Embed Size (px)
Citation preview

Economic and Infrastructure Studies Department
May 2016
1st Quarter of 2016 Report for Barcelona City Council
1
Business Climate in the Metropolitan Area of Barcelona
Situation in the first quarter of 2016 and outlook for the second
quarter of 2016.
Economic and Infrastructure Studies Department
May 2016
1st Quarter of 2016 Report for Barcelona City Council
2
1. Business performance in the Metropolitan Area of Barcelona and its
sectors
2. Trends of the main business variables in the Metropolitan Area of
Barcelona and its sectors
2.1. Metropolitan Area of Barcelona
2.2. Industry
2.3. Construction
2.4. Retail
2.5. Hospitality
2.6. Other services
3. Outlook for business performance in the Metropolitan Area of
Barcelona and its sectors
4. Outlook for the main business variables in the Metropolitan Area of
Barcelona and its sectors
4.1. Metropolitan Area of Barcelona
4.2. Industry
4.3. Construction
4.4. Retail
4.5. Hospitality
4.6. Other services
5. Technical information
6. Methodology

Economic and Infrastructure Studies Department
May 2016
1st Quarter of 2016 Report for Barcelona City Council
3
1. Business performance in the Metropolitan Area of Barcelona and its
sectors
Businesses registered their best results since the data series began in
2009
The performance of businesses in the Metropolitan Area of Barcelona (AMB)
reached a historic high, registering their best overall results ever, according to the
Business Climate Survey conducted by Barcelona’s Chamber of Commerce and
Idescat on a sample of 1,178 businesses located in the AMB in April, 2016,
These overall positive business results prolong a yearlong positive trend that
began in the first quarter of 2015. These are the best results ever since data
collection began in Q1 2009. This improvement comes on the back of the previous
quarter that showed a slight increase in the percentage of business people that say
business performance has been favourable (28% in 4Q15 compared to 29% in
1Q16), while the percentage of executives who said that performance was
unfavourable remained stable at 14%. So the overall result shows a rise of one
percentage point up on 4Q15 as seen in Figure 1.
Figure 1. Business performance in the AMB
(Balance in %)
Source: Chamber of Commerce of Barcelona and Idescat
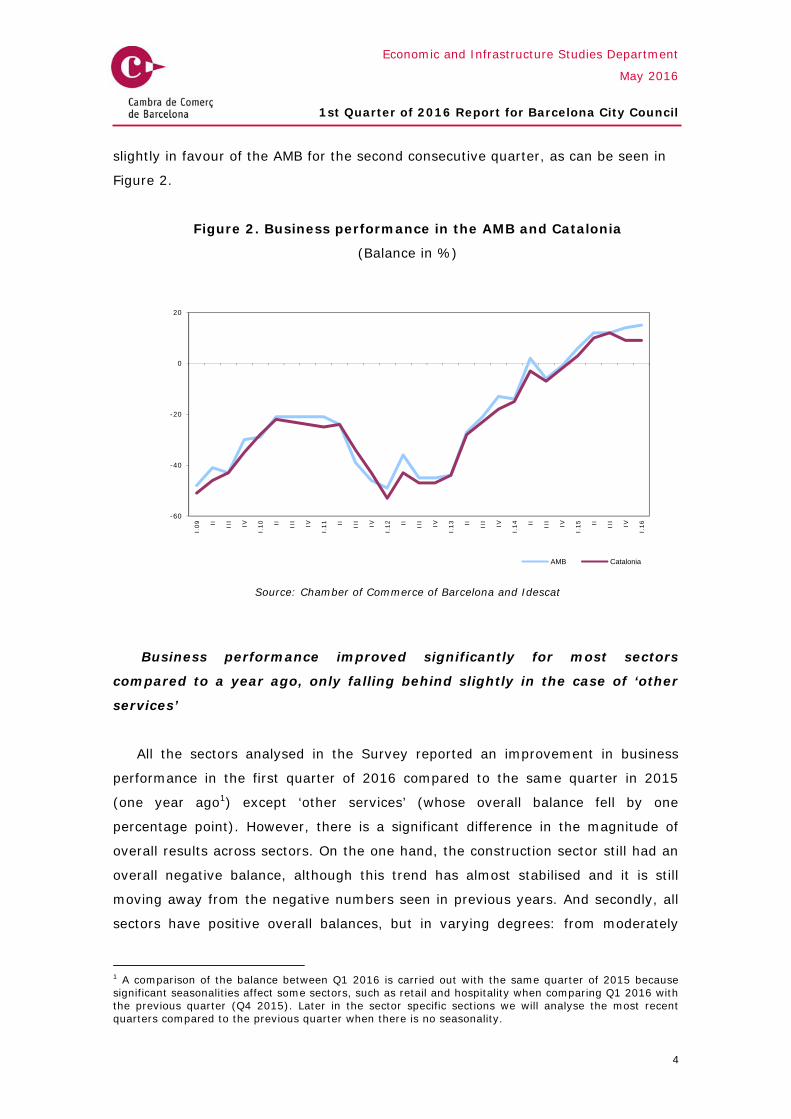
Business performance continued on the same positive trend seen in Q4 2015 across
the whole of Catalonia. Therefore, the differential between the two has widened
-60
-40
-20
0
20
I.09 II III IV I.10 II III IV I.11 II III IV I.12 II III IV I.13 II III IV I.14 II III IV I.15 II III IV I.16
Economic and Infrastructure Studies Department
May 2016
1st Quarter of 2016 Report for Barcelona City Council
4
slightly in favour of the AMB for the second consecutive quarter, as can be seen in
Figure 2.
Figure 2. Business performance in the AMB and Catalonia
(Balance in %)
Source: Chamber of Commerce of Barcelona and Idescat
Business performance improved significantly for most sectors
compared to a year ago, only falling behind slightly in the case of ‘other
services’
All the sectors analysed in the Survey reported an improvement in business
performance in the first quarter of 2016 compared to the same quarter in 2015
(one year ago1) except ‘other services’ (whose overall balance fell by one
percentage point). However, there is a significant difference in the magnitude of
overall results across sectors. On the one hand, the construction sector still had an
overall negative balance, although this trend has almost stabilised and it is still
moving away from the negative numbers seen in previous years. And secondly, all
sectors have positive overall balances, but in varying degrees: from moderately
1 A comparison of the balance between Q1 2016 is carried out with the same quarter of 2015 because significant seasonalities affect some sectors, such as retail and hospitality when comparing Q1 2016 with the previous quarter (Q4 2015). Later in the sector specific sections we will analyse the most recent quarters compared to the previous quarter when there is no seasonality.
-60
-40
-20
0
20
I.09 II II
I
IV
I.10 II II
I
IV
I.11 II II
I
IV
I.12 II II
I
IV
I.13 II II
I
IV
I.14 II II
I
IV
I.15 II II
I
IV
I.16
AMB Catalonia

Economic and Infrastructure Studies Department
May 2016
1st Quarter of 2016 Report for Barcelona City Council
5
positive results in terms of retail to very strong positive results in the hospitality
sector.
Figure 3. Business performance in the AMB and its main sectors (Balance, in %)
Table 1. Business performance in the Metropolitan Area of Barcelona
and its main sectors
Barcelona Metropolitan Area
Percentage of businesses
Quarter. I
2015
Quarter. IV
2015
Quarter. I
2016
Situation during the quarter
Barcelona Metropolitan
Area2
Favourable 25 28 29 Normal 55 58 57
Unfavourable 19 14 14 Balance 6 14 15
Industry
Favourable 22 34 30 Normal 53 52 55
Unfavourable 25 14 15 Balance -3 20 15
Construction
Favourable 17 23 21 Normal 56 61 57
Unfavourable 27 16 22 Balance -10 7 -1
Retail
Favourable 26 25 26 Normal 53 61 53
Unfavourable 22 14 21 Balance 4 11 5
Hospitality
Favourable 39 49 65 Normal 44 42 29
Unfavourable 18 8 6 Balance 21 41 59
Other services
Favourable 26 25 24 Normal 60 61 64
Unfavourable 14 14 12 Balance 13 11 12
Source: Chamber of Commerce of Barcelona and Idescat
2 Barcelona’s Chamber of Commerce develops these findings for the whole of the Metropolitan Area of Barcelona based on average results for each sector in Catalonia divided by the results for the whole Catalan economy in terms of gross value added (GVA) because this data is not available at the AMB level.
-3-10
4
21
13
6
15
-1
5
59
1215
-20
0
20
40
60
80
Industry Construction Retail Hospitality Other services AMB
I Q. 2015 I Q. 2016

Economic and Infrastructure Studies Department
May 2016
1st Quarter of 2016 Report for Barcelona City Council
6
2. Trends of the main business variables in the Metropolitan Area of
Barcelona and its sectors
2.1. Metropolitan Area of Barcelona
Results showing a moderation in sales prices in the AMB were the best
since the data series began
Trends showing a certain moderation in falls in sales prices continued in Q1,
represented by the least negative overall balance since the first quarter of 2009
(the beginning of the data series). Specifically, 11% of business executives
indicated that sales prices fell in the first quarter in the AMB, compared to 9% that
said prices increased.
The results per sector show a decrease in sales prices across all sectors, with
the exception of the hospitality sector, but with an overall balance close to zero.
Regarding trends, compared to the previous year all the sectors analysed recorded
lower overall negative balances (and a positive result in the hospitality sector), but
compared to the previous quarter, falls in sales prices in the industrial sector and
‘other services’ sector accelerated slightly. However, sales prices in the hospitality
sector increased (overall positive balance), which is the first time this has happened
in the first quarter for this sector, compared to the overall slightly negative results
seen in the previous quarter and also a year ago.
Figure 4. Trend showing sales prices in the AMB (Balance in %)
Source: Chamber of Commerce of Barcelona and Idescat
-4
-16
-5
-1
-10-7
-4 -4 -3
30
-6
-2
-20
0
20
40
Industry Construction Retail Hospitality Other services AMB
I Q. 2015 I Q. 2016

Economic and Infrastructure Studies Department
May 2016
1st Quarter of 2016 Report for Barcelona City Council
7
Employment trends worsen slightly compared to the previous quarter,
but improved compared to a year ago
Employment in the AMB in Q1 recorded a slightly positive overall balance, but it
was lower than the previous quarter because of the percentage of business people
in the AMB that indicated employment had risen (19% in Q4 and 16% in Q1).
However, compared to the previous year, employment improved because the
percentage of business people indicating a fall in fact decreased (from 17% in Q1
2015 to 12% from 17% in Q1 2016).
In terms of sectors, employment is positive across all sectors, except
construction and retail. However, when compared to the results of last year's
survey the trends are quite heterogeneous. Industry, ‘other services’ and
construction showed a favourable trend, with positive overall results for the first
two sectors, however, the overall balance continued to be negative despite these
improvements. The retail and hospitality sectors are in a worse position, with the
former showing a slightly negative balance, while the latter has seen its overall
positive balance reduced.
Figure 5. Employment trends in the AMB (Balance in %)
Source: Chamber of Commerce of Barcelona and Idescat
-1
-14
2
22
-6
-2
8
-8
-4
14
5 4
-20
0
20
40
Industry Construction Retail Hospitality Other services AMB
I Q. 2015 I Q. 2016
Economic and Infrastructure Studies Department
May 2016
1st Quarter of 2016 Report for Barcelona City Council
8
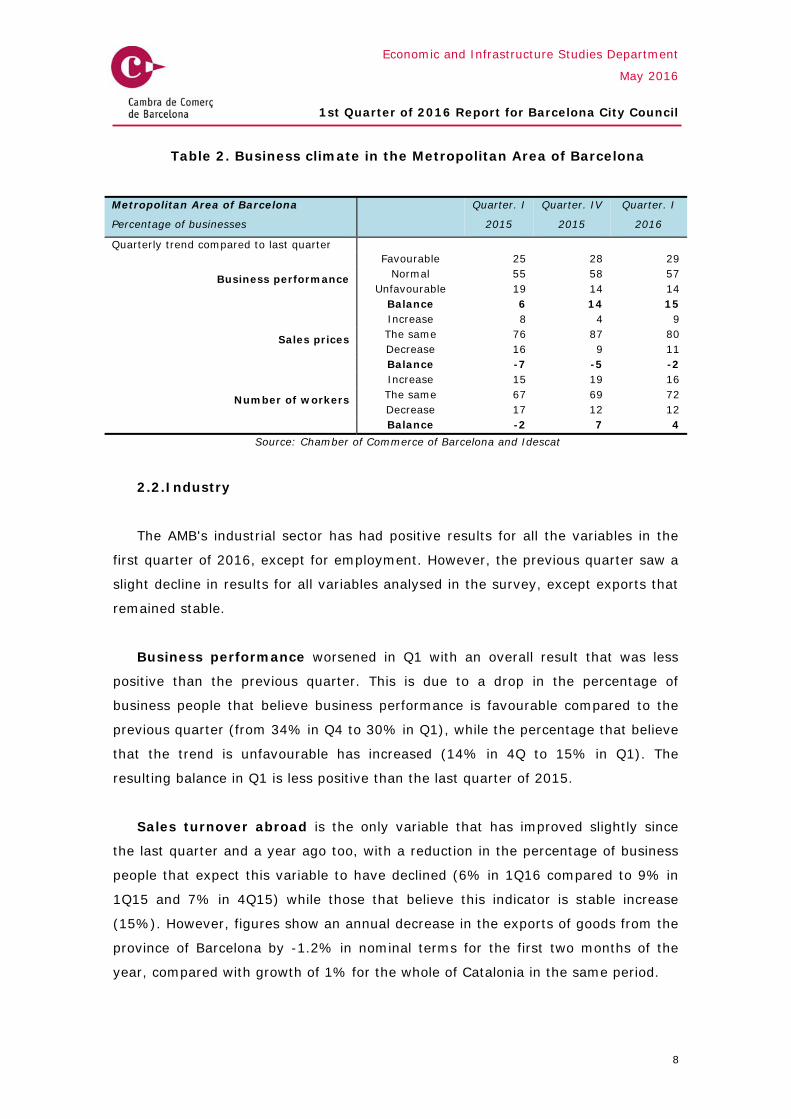
Table 2. Business climate in the Metropolitan Area of Barcelona
Metropolitan Area of Barcelona
Percentage of businesses
Quarter. I
2015
Quarter. IV
2015
Quarter. I
2016
Quarterly trend compared to last quarter
Business performance
Favourable 25 28 29 Normal 55 58 57
Unfavourable 19 14 14 Balance 6 14 15
Sales prices
Increase 8 4 9 The same 76 87 80 Decrease 16 9 11 Balance -7 -5 -2
Number of workers
Increase 15 19 16 The same 67 69 72 Decrease 17 12 12 Balance -2 7 4
Source: Chamber of Commerce of Barcelona and Idescat
2.2. Industry
The AMB's industrial sector has had positive results for all the variables in the
first quarter of 2016, except for employment. However, the previous quarter saw a
slight decline in results for all variables analysed in the survey, except exports that
remained stable.
Business performance worsened in Q1 with an overall result that was less
positive than the previous quarter. This is due to a drop in the percentage of
business people that believe business performance is favourable compared to the
previous quarter (from 34% in Q4 to 30% in Q1), while the percentage that believe
that the trend is unfavourable has increased (14% in 4Q to 15% in Q1). The
resulting balance in Q1 is less positive than the last quarter of 2015.
Sales turnover abroad is the only variable that has improved slightly since
the last quarter and a year ago too, with a reduction in the percentage of business
people that expect this variable to have declined (6% in 1Q16 compared to 9% in
1Q15 and 7% in 4Q15) while those that believe this indicator is stable increase
(15%). However, figures show an annual decrease in the exports of goods from the
province of Barcelona by -1.2% in nominal terms for the first two months of the
year, compared with growth of 1% for the whole of Catalonia in the same period.

Economic and Infrastructure Studies Department
May 2016
1st Quarter of 2016 Report for Barcelona City Council
9
The decline in sales prices in the industrial sector increased slightly in Q1
compared to the previous quarter with an increase in the percentage of business
people who believe there has been a fall in prices (up to 10%, 4% in the previous
quarter), a higher proportion than those that believe there has been a rise,
standing at 6% in Q1 (3% in the previous quarter).
Employment also worsened compared to the previous quarter, with a reduction
in the positive overall balance. While the percentage of business people that say
there has been a drop in the number of employees fell to 6% in Q1 (previously
standing at 8%), as well, the percentage of business people indicating growth in
employee numbers stood at 14% (21% previously). Therefore, the overall balance
in Q1 is less positive than it was in Q4 2015.
Table 3. Business performance in the industrial sector
Industry
Percentage of businesses
Quarter I
2015
Quarter. IV
2015
Quarter. I
2016
Quarterly trend compared to last quarter
Business performance
Favourable 22 34 30
Normal 53 52 55
Unfavourable 25 14 15
Balance -3 20 15
Exports
Increase 15 15 15
The same 37 41 43
Decrease 9 7 6
Balance 6 8 9
Sales prices
Increase 10 3 6
The same 77 93 84
Decrease 14 4 10
Balance -4 -2 -4
Number of workers
Increase 15 21 14
The same 69 71 80
Decrease 16 8 6
Balance -1 14 8
Source: Chamber of Commerce of Barcelona and Idescat
The industrial sector in the AMB recorded better results than Catalonia in the first
quarter of 2016 across all indicators analysed, with the exception of exports. The
overall balance for business performance and employment is more positive than
that seen in Catalonia as a whole and the sales price balance is slightly less
negative than in Catalonia. Conversely, Catalan exports recorded a slightly higher
overall positive balance than in the AMB.

Economic and Infrastructure Studies Department
May 2016
1st Quarter of 2016 Report for Barcelona City Council
10
Figure 6. Trends in the industrial sector in the AMB and Catalonia
in the first quarter of 2016 (Balance in %)
Source: Chamber of Commerce of Barcelona and Idescat
2.3. Construction
The construction sector in the AMB continues to show negative overall balances
across all variables studied. As well, the sector showed poorer results in terms of
business performance and employment compared to the positive trend seen in the
previous quarter. However, prices tended to fall less than previously.
Indeed, business performance in the first quarter again recorded slightly
negative numbers compared to the previous quarter when it registered a positive
overall balance for the first time. However, this negative number (close to zero) is
the second best result on this variable since 2009. In particular, the percentage of
employers that indicate business performance as favourable was 21% (23% in the
previous quarter) whilst 22% indicate it was unfavourable (16% in Q4 2015).
Falls in sales prices continue to slow for the fifth consecutive quarter and this
sector is no longer the one with the most negative overall numbers on this variable.
The percentage of negative answers (falling prices) dropped to 11% in Q1 (16%
15
9
-4
810 10
-6
4
-10
-5
0
5
10
15
20
Business performance Turnover abroad Prices Employment
AMB Catalonia

Economic and Infrastructure Studies Department
May 2016
1st Quarter of 2016 Report for Barcelona City Council
11
the previous quarter), and this narrowly exceeded the percentage of positive
answers (price increases), which rose to 7% (2% in the previous quarter).
Employment again recorded a negative balance in Q1, with an increasing
number of business people (24%) indicating rises in employment (14% in the
previous quarter), while those pointing to a drop in employment remains at 16%.
Table 4. Business climate in the construction sector
Construction
Percentage of businesses
Quarter I
2015
Quarter IV
2015
Quarter I
2016
Quarterly trend compared to last quarter
Business performance
Favourable 17 23 21 Normal 56 61 57
Unfavourable 27 16 22 Balance -10 7 -1
Sales prices
Increase 1 2 7 The same 82 82 82 Decrease 17 16 11 Balance -16 -15 -4
Number of workers
Increase 14 16 16 The same 57 70 60 Decrease 29 14 24 Balance -14 2 -8
Source: Chamber of Commerce of Barcelona and Idescat
The construction sector in the AMB registered an overall balance that was
considerably more negative than that for the whole of Catalonia in terms of
employment. However, the overall result for business performance and sales prices
was less negative in the AMB than in Catalonia as a whole, especially regarding
business performance.

Economic and Infrastructure Studies Department
May 2016
1st Quarter of 2016 Report for Barcelona City Council
12
Figure 5. Construction sector trends in the AMB and Catalonia first quarter of 2016 (Balance in %)
Source: Chamber of Commerce of Barcelona and Idescat
2.4. Retail
Favourable household consumption trends have affected the overall balance of
the retail sector in the AMB. Business performance has been positive in the first
quarter of 2016, stabilising its situation with respect to a year ago3. Sales prices in
the retail sector are still showing an overall negative balance, but this is very
similar to the previous year. However, employment has shown a negative trend.
Business performance recorded a slightly positive overall balance in Q1 2016
compared to the same period during the previous year, but lower than in Q4 2015.
This slight annual improvement is because of a decrease in the percentage of
business people that say business was unfavourable, standing at 21% (while last
year this figure was 22%), while the percentage saying business performance was
favourable was the same (26%).
Sales prices recorded a lower negative overall balance in Q1 than compared to
a year ago, because the percentage of negative survey responses (indicating
declines in prices) was greater than the percentage of positive responses (increase
in prices), with the former going from 17% in Q1 2015 to 12% in Q1 2016 and the
latter dropping from 12% to 10% in the same period.
3 As for the retail sector, the last quarter coincides with the Christmas period when this sector enjoys high turnovers, and discounts before winter sales (which is becoming increasingly widespread); while the first quarter of the year coincides with the winter sales.
-1
-4
-8
-7
-5
-4
-9
-8
-7
-6
-5
-4
-3
-2
-1
0
Business performance Sales prices Employment
AMB Catalonia

Economic and Infrastructure Studies Department
May 2016
1st Quarter of 2016 Report for Barcelona City Council
13
Employment in the retail sector fell in the first quarter for the first time since
Q3 2014. Thus, the percentage of employers indicating a decline in employee
numbers increased from 13% in Q1 2015 to 15% in Q1 2016, while business people
saying employment rose in this sector fell from 15% to 11% for the same period,
resulting in a negative overall balance.
Retail in the AMB enjoyed better results than in Catalonia as a whole in terms of
business performance and sales prices. However, in terms of employment, the
overall balance for Catalonia was 0 compared to a negative balance in the AMB.
Table 5. Business climate in the retail sector
Retail
Percentage of businesses
Quarter I
any 2015
Quarter IV
any 2015
Quarter I
any 2016
Quarterly trend compared to last quarter
Business performance
Favourable 26 25 26 Normal 53 61 53
Unfavourable 22 14 21 Balance 4 11 5
Sales prices
Increase 12 4 10 The same 71 88 78 Decrease 17 8 12 Balance -5 -4 -3
Number of workers
Increase 15 18 11 The same 71 75 74 Decrease 13 7 15 Balance 2 11 -4
Source: Chamber of Commerce of Barcelona and Idescat
Figure 8. Trends in the retail sector in the AMB and Catalonia, Q1 2016
(Balance in %)
Source: Chamber of Commerce of Barcelona and Idescat
5
-3
-4
2
-5
0
-6
-4
-2
0
2
4
6
Business performance Sales prices Employment
AMB Catalonia

Economic and Infrastructure Studies Department
May 2016
1st Quarter of 2016 Report for Barcelona City Council
14
2.5. Hospitality
The hospitality sector in the Metropolitan Area of Barcelona continues to get the
best results in the Business Climate Survey in the first quarter of 2016, with the
highest overall numbers since the data series began.
It is worth noting, however, that these fine results are largely seasonal, with the
Easter period in 2016 included while Q1 2015 only included the first three days
(Palm Sunday, and Holy Monday and Tuesday). In addition, we need to add in fine
results in terms of tourism and private consumption, and the highly successful last
edition of the Mobile World Congress. All this has meant that 2016’s result is the
best quarter since 2009 on all variables analysed, with the exception of
employment, which recorded a slightly lower overall balance compared to that of
Q1 2015.
The significant improvement in business performance in Q1 is due to an
increase in the percentage of business people indicating that business performance
is favourable, rising to 65% (39% last year), while the percentage of business
people indicating that business performance is unfavourable fell to 6% (18% last
year). This improvement produced a very significant positive overall balance,
ranking as the second best result since the data series began.
Q1 sales prices experienced a significant increase, rising from a slightly
negative balance in 1Q15 and 4Q15, to a positive balance standing at 30. This
upward trend is due to a fall in negative responses (lower prices) by more than half
from 19% in Q1 2015 to 7% in Q1 2016, and a two-fold increase in positive
answers (rises in prices) from 18% to 36% in the same period.
However, employment fell slightly, as the percentage of business executives
indicating a rise in employment fell significantly (28% in Q1 2015 to 19% in Q1
2016).
The hospitality sector in the AMB registered much better results when compared
to the whole of Catalonia on all variables. This may be due, as mentioned, to the

Economic and Infrastructure Studies Department
May 2016
1st Quarter of 2016 Report for Barcelona City Council
15
benefits that this sector felt from hosting the eleventh edition of the Mobile World
Congress at Fira de Barcelona. This latest edition, held from 22 to 25 February, was
the most successful ever with 100,000 delegates, an economic impact of 460
million Euros and more than 13,000 temporary workers taken on in Barcelona and
the Metropolitan Area. Added to this is the fact that tourism is less seasonal in the
city of Barcelona -and by extension the AMB- than the rest of Catalonia.
Table 6. Business climate in the hospitality sector
Hospitality
Percentage of businesses
Quarter IV
2014 Quarter III
2015
Quarter IV
2015
Quarterly trend compared to last quarter
Business performance
Favourable 39 49 65
Normal 44 42 29
Unfavourable 18 8 6
Balance 21 41 59
Sales prices
Increase 18 20 36
The same 63 59 57
Decrease 19 21 7
Balance -1 -2 30
Number of workers
Increase 28 17 19
The same 66 48 76
Decrease 6 35 5
Balance 22 -19 14
Source: Chamber of Commerce of Barcelona and Idescat
Figure 9. Trend in hospitality sector in the AMB and Catalonia, 1Q 2016 (Balance in %)
59
30
14
31
14
4
0
10
20
30
40
50
60
70
Business performance Sales prices Employment
AMB Catalona

Economic and Infrastructure Studies Department
May 2016
1st Quarter of 2016 Report for Barcelona City Council
16
Source: Chamber of Commerce of Barcelona and Idescat
2.6. Other services
Business performance in the ‘other services’ sector in the first quarter of 2016,
was positive, continuing a positive trend that began in early 2015. However, sales
prices and employment are down slightly from the previous quarter.
Regarding business performance, improvements on the previous quarter
resulted in a positive overall balance that was up by one point. This is because the
percentage of negative responses went down (business performance was
unfavourable), from 14% in 4Q15 to 12% in 1Q16, while positive responses
remained practically unchanged: 25% and 24%, respectively. It should be
mentioned that the overall balance is very similar to what was seen throughout the
quarters of 2015.
The falls in sales prices remained practically stable compared to the previous
quarter, with the number of positive responses (price increases) increasing in the
same proportion as the negative responses (falls in prices). As such it achieved the
second best result in the data series (after that of Q4 2015).
The overall balance in terms of employment is slightly less positive in Q1 2016
than the previous quarter, pointing to a gradual slowdown. This trend in overall
results is due to a reduction in the number of positive responses (increases in
employment) from 19% in Q4 to 17% in Q1, as the percentage of negative
responses (decreases in employment) remained virtually the same, down just one
percentage point compared to Q4 2015 (from 13% to 12%, respectively).
‘Other services’ results were slightly better for the whole of Catalonia in all
areas (business performance, sales prices and employment) in the first quarter of
2016.

Economic and Infrastructure Studies Department
May 2016
1st Quarter of 2016 Report for Barcelona City Council
17
Table 7. Business climate for the ‘other services’ sector
Other services
Percentage of businesses
Quarter I
2015
Quarter IV
2015
Quarter I
2016
Quarterly trend compared to last quarter
Business performance
Favourable 26 25 24
Normal 60 61 64
Unfavourable 14 14 12
Balance 13 11 12
Sales prices
Increase 5 3 5
The same 79 88 84
Decrease 15 9 11
Balance -10 -5 -6
Number of workers
Increase 14 19 17
The same 67 68 71
Decrease 19 13 12
Balance -6 7 5
Source: Chamber of Commerce of Barcelona and Idescat

Economic and Infrastructure Studies Department
May 2016
1st Quarter of 2016 Report for Barcelona City Council
18
Figure 8. Trends in ‘other services’ in the AMB and Catalonia, first quarter
2016 (Balance in %)
Source: Chamber of Commerce of Barcelona and Idescat
3. Outlook for business performance in the Metropolitan Area of Barcelona
and its sectors
Business executives’ forecasts for the second quarter are the most
positive since 2010, along with those made a year ago
Business executives are forecasting that the AMB’s business performance will
be positive in Q2 2016, improving on the result seen in the previous quarter,
maintaining the previous year’s result. This is due to an increase in the percentage
of business people in the AMB that expect business performance to be favourable
(22% in Q1 to 28% in Q2), while the percentage that believe this indicator will be
unfavourable decreases (from 16% to 11%). It’s worth mentioning that during the
first quarter of 2016 the Catalan economy began a deceleration process, despite
growth rates remaining high –and rates were higher than those in Spain and
especially those seen in the European Union. This marks a turning point in the
recovery process that began in mid-2013 and reached its peak in the fourth quarter
of 2015. The main reasons for this lack of growth is a slowdown in the drivers
pushing the economy forward and a worsening economic condition worldwide.
However, a recovery in consumption and investment and job creation are still
playing a fundamental role in the economic recovery of the Catalan economy and
this is keeping business and consumer confidence high.
12
-6
5
10
-5
4
-8
-6
-4
-2
0
2
4
6
8
10
12
14
Business performance Sales prices Employment
AMB Catalonia
Economic and Infrastructure Studies Department
May 2016
1st Quarter of 2016 Report for Barcelona City Council
19
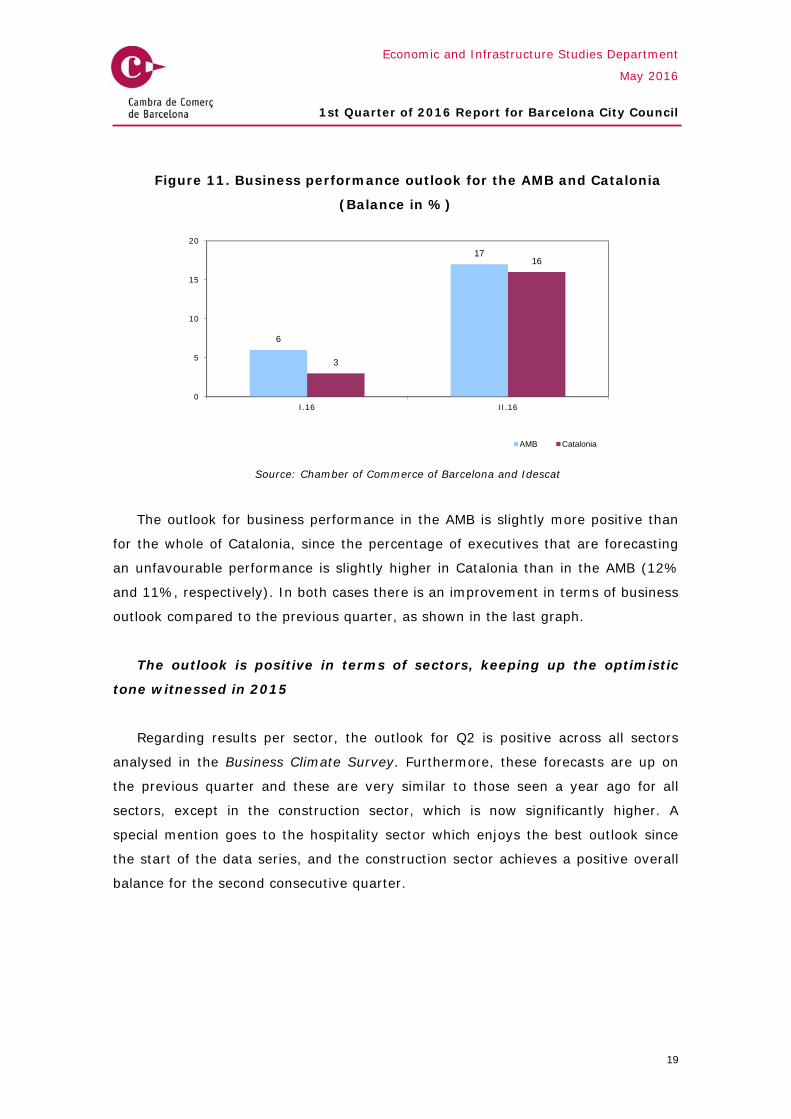
Figure 11. Business performance outlook for the AMB and Catalonia
(Balance in %)
Source: Chamber of Commerce of Barcelona and Idescat
The outlook for business performance in the AMB is slightly more positive than
for the whole of Catalonia, since the percentage of executives that are forecasting
an unfavourable performance is slightly higher in Catalonia than in the AMB (12%
and 11%, respectively). In both cases there is an improvement in terms of business
outlook compared to the previous quarter, as shown in the last graph.
The outlook is positive in terms of sectors, keeping up the optimistic
tone witnessed in 2015
Regarding results per sector, the outlook for Q2 is positive across all sectors
analysed in the Business Climate Survey. Furthermore, these forecasts are up on
the previous quarter and these are very similar to those seen a year ago for all
sectors, except in the construction sector, which is now significantly higher. A
special mention goes to the hospitality sector which enjoys the best outlook since
the start of the data series, and the construction sector achieves a positive overall
balance for the second consecutive quarter.
6
17
3
16
0
5
10
15
20
I.16 II.16
AMB Catalonia

Economic and Infrastructure Studies Department
May 2016
1st Quarter of 2016 Report for Barcelona City Council
20
Figure 12. Outlook for business performance in the AMB and its sectors (Balances in %)
Source: Chamber of Commerce of Barcelona and Idescat
Indeed, the hospitality sector’s business performance registered the best
outlook since Q1 2011 and it was the most positive of all the sectors analysed for
the second quarter of 2016. Thus, almost half of business people in this sector are
forecasting favourable business performance in 2T (47%), compared to only 2% of
executives saying it will be unfavourable.
Retail, industry and ‘other services’ sectors have the second best results
with positive overall balances (about 15%) and these follow a similar trend. Thus,
all three sectors recorded a small reduction in their overall balances with respect to
the outlook seen a year ago (around 2-3 percentage points). However, the overall
balance for these sectors is better than the previous quarter by 7-8 percentage,
because the percentage of business people forecasting an unfavourable outlook
increases, while the percentage that expect it to be unfavourable in all three
sectors falls.
The outlook for the construction sector is slightly positive for Q2. In fact, it is
the second best semester with a positive overall balance since the beginning of the
data series, second only to Q4 in 2015. The construction sector recorded 21% of
business people indicating a favourable business performance outlook compared to
20% forecasting an unfavourable forecast.
19
-15
19
41
17 1716
1
16
45
1517
-20
-10
0
10
20
30
40
50
Industry Construction Retail Hospitality Other services AMB
II Q 2015 II Q 2016
Economic and Infrastructure Studies Department
May 2016
1st Quarter of 2016 Report for Barcelona City Council
21
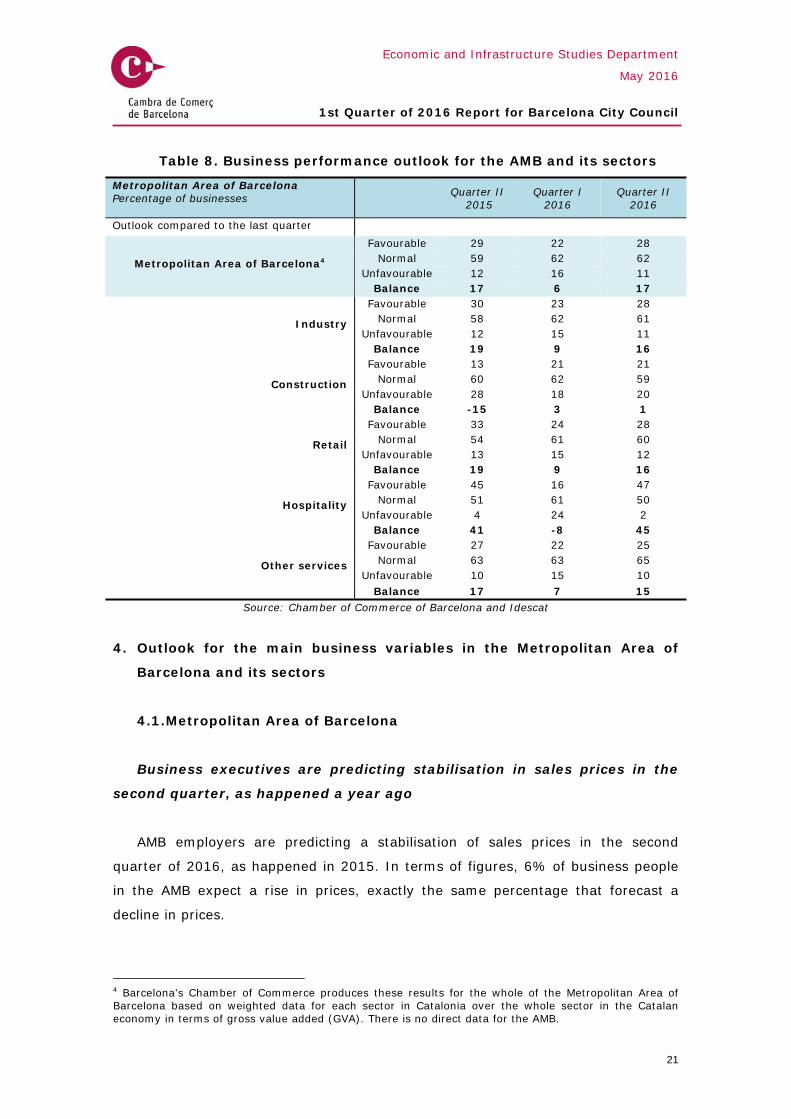
Table 8. Business performance outlook for the AMB and its sectors
Metropolitan Area of Barcelona Percentage of businesses
Quarter II 2015
Quarter I 2016
Quarter II 2016
Outlook compared to the last quarter
Metropolitan Area of Barcelona4
Favourable 29 22 28 Normal 59 62 62
Unfavourable 12 16 11 Balance 17 6 17
Industry
Favourable 30 23 28 Normal 58 62 61
Unfavourable 12 15 11 Balance 19 9 16
Construction
Favourable 13 21 21 Normal 60 62 59
Unfavourable 28 18 20 Balance -15 3 1
Retail
Favourable 33 24 28 Normal 54 61 60
Unfavourable 13 15 12 Balance 19 9 16
Hospitality
Favourable 45 16 47 Normal 51 61 50
Unfavourable 4 24 2 Balance 41 -8 45
Other services
Favourable 27 22 25 Normal 63 63 65
Unfavourable 10 15 10 Balance 17 7 15
Source: Chamber of Commerce of Barcelona and Idescat
4. Outlook for the main business variables in the Metropolitan Area of
Barcelona and its sectors
4.1. Metropolitan Area of Barcelona
Business executives are predicting stabilisation in sales prices in the
second quarter, as happened a year ago
AMB employers are predicting a stabilisation of sales prices in the second
quarter of 2016, as happened in 2015. In terms of figures, 6% of business people
in the AMB expect a rise in prices, exactly the same percentage that forecast a
decline in prices.
4 Barcelona’s Chamber of Commerce produces these results for the whole of the Metropolitan Area of Barcelona based on weighted data for each sector in Catalonia over the whole sector in the Catalan economy in terms of gross value added (GVA). There is no direct data for the AMB.
Economic and Infrastructure Studies Department
May 2016
1st Quarter of 2016 Report for Barcelona City Council
22
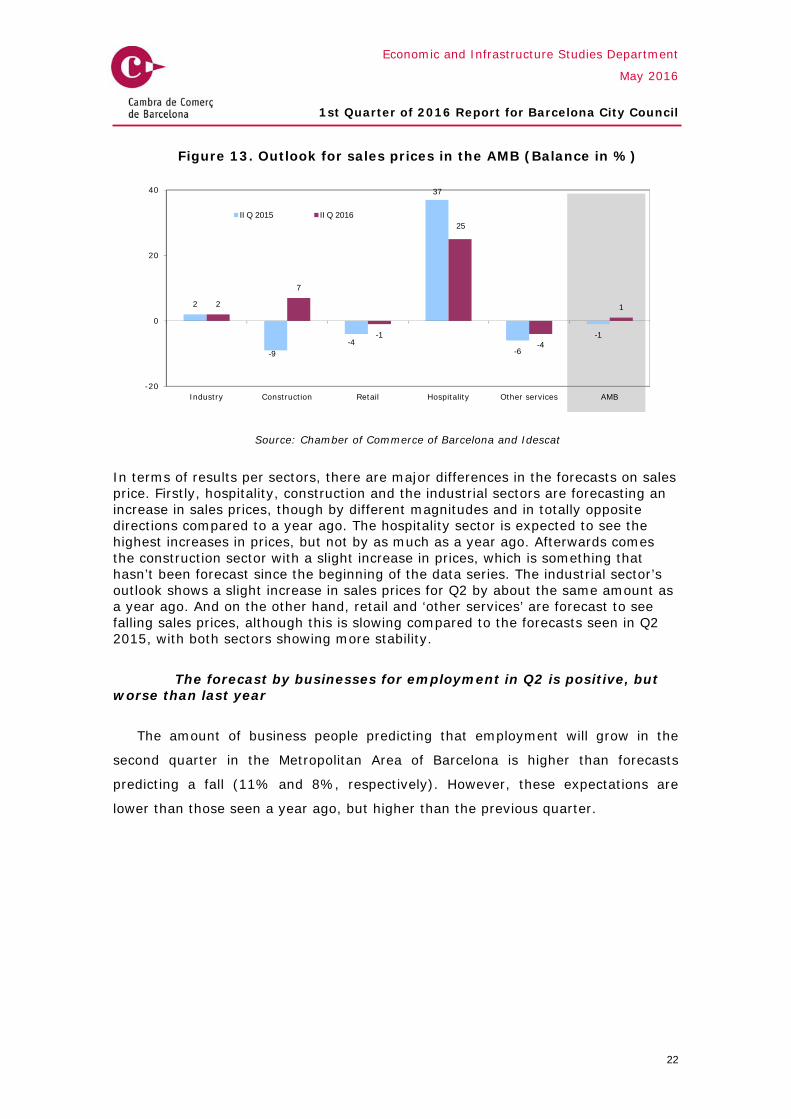
Figure 13. Outlook for sales prices in the AMB (Balance in %)
Source: Chamber of Commerce of Barcelona and Idescat
In terms of results per sectors, there are major differences in the forecasts on sales price. Firstly, hospitality, construction and the industrial sectors are forecasting an increase in sales prices, though by different magnitudes and in totally opposite directions compared to a year ago. The hospitality sector is expected to see the highest increases in prices, but not by as much as a year ago. Afterwards comes the construction sector with a slight increase in prices, which is something that hasn’t been forecast since the beginning of the data series. The industrial sector’s outlook shows a slight increase in sales prices for Q2 by about the same amount as a year ago. And on the other hand, retail and ‘other services’ are forecast to see falling sales prices, although this is slowing compared to the forecasts seen in Q2 2015, with both sectors showing more stability.
The forecast by businesses for employment in Q2 is positive, but worse than last year
The amount of business people predicting that employment will grow in the
second quarter in the Metropolitan Area of Barcelona is higher than forecasts
predicting a fall (11% and 8%, respectively). However, these expectations are
lower than those seen a year ago, but higher than the previous quarter.
2
-9
-4
37
-6
-1
2
7
-1
25
-4
1
-20
0
20
40
Industry Construction Retail Hospitality Other services AMB
II Q 2015 II Q 2016

Economic and Infrastructure Studies Department
May 2016
1st Quarter of 2016 Report for Barcelona City Council
23
Figure 14. Outlook for sales prices in the AMB (Balance in %)
Source: Chamber of Commerce of Barcelona and Idescat
In terms of sectors, we can see an overall decline when compared to the year
previous, and if we compare with last quarter only the hospitality, retail and ‘other
services’ sectors show an improvement, but we should remember that seasonality
has played an important role in the first two sectors mentioned.
Table 9. Business outlook for the Metropolitan Area of Barcelona
Metropolitan Area of Barcelona
Percentage of businesses
Quarter II
2015
Quarter I
2016
Quarter II
2016
Outlook compared to the last quarter
Business performance
Favourable 29 22 28 Normal 59 62 62
Unfavourable 12 16 11 Balance 17 6 17
Sales prices
Increase 7 11 6 The same 86 80 88 Decrease 8 9 6 Balance -1 1 0
Number of workers
Increase 15 11 11 The same 77 78 81 Decrease 8 11 8 Balance 7 0 3
Source: Chamber of Commerce of Barcelona and Idescat
4.2. Industry
The industrial sector has a positive forecast across all variables analysed, but
these forecasts are more pessimistic than during the same quarter last year.
2
-9
5
44
6 7
2
-13
2
17
4 3
-20
0
20
40
60
Industry Construction Retail Hospitality Other services AMB
II Q. 2015 II Q. 2016

Economic and Infrastructure Studies Department
May 2016
1st Quarter of 2016 Report for Barcelona City Council
24
Specifically, with respect to business performance, 28% of executives predict
a favourable outlook in the second quarter, exceeding the percentage indicating an
unfavourable outlook, standing at 11%. This positive overall balance is lower than
last year’s results, but forecasts are the second highest in the last five years.
Forecasts by executives in the industrial sector about exports for the second
quarter of 2016 are also positive but lower compared to the previous quarters, and
a year ago. 13% of businesses expect that this will grow, while only 6% expect it to
decrease.
The outlook for sales prices are positive, but stable compared to the same
period of 2015. This is because the percentages were exactly the same and there
has been no change. In relation to the previous quarter, the outlook is slightly
brighter.
The outlook for employment in Q2 is positive, with the percentage of business
people expecting this to increase higher than the percentage expecting a fall (8%
and 5%, respectively). However, the overall balance is lower than the outlook seen
the previous year, but slightly higher than in Q1 in 2016.
Table 10. Business outlook in the industrial sector Industry
Percentage of businesses
Quarter II
any 2015
Quarter I
any 2016
Quarter II
2016
Outlook compared to the last quarter
Business performance
Favourable 30 23 28 Normal 58 62 61
Unfavourable 12 15 11 Balance 19 9 16
Exports
Increase 19 13 13 The same 41 46 48 Decrease 1 4 6 Balance 18 9 7
Sales prices
Increase 8 10 8 The same 85 81 86 Decrease 6 9 6 Balance 2 0 2
Number of workers
Increase 12 13 8 The same 80 80 87 Decrease 8 7 5 Balance 4 7 2
Source: Chamber of Commerce of Barcelona and Idescat
Industrialists have a more positive outlook in Catalonia as a whole compared to
the AMB, mainly because of exports. The only aspect that was in the AMB’s favour
Economic and Infrastructure Studies Department
May 2016
1st Quarter of 2016 Report for Barcelona City Council
25
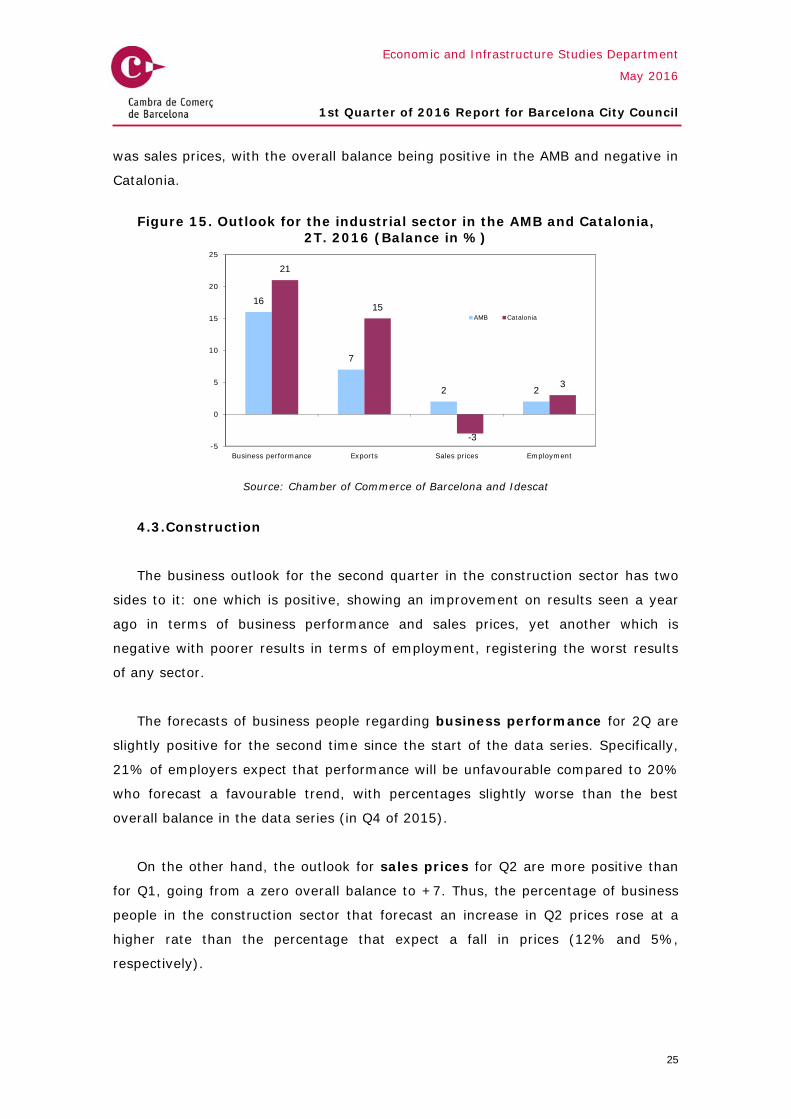
was sales prices, with the overall balance being positive in the AMB and negative in
Catalonia.
Figure 15. Outlook for the industrial sector in the AMB and Catalonia, 2T. 2016 (Balance in %)
Source: Chamber of Commerce of Barcelona and Idescat
4.3. Construction
The business outlook for the second quarter in the construction sector has two
sides to it: one which is positive, showing an improvement on results seen a year
ago in terms of business performance and sales prices, yet another which is
negative with poorer results in terms of employment, registering the worst results
of any sector.
The forecasts of business people regarding business performance for 2Q are
slightly positive for the second time since the start of the data series. Specifically,
21% of employers expect that performance will be unfavourable compared to 20%
who forecast a favourable trend, with percentages slightly worse than the best
overall balance in the data series (in Q4 of 2015).
On the other hand, the outlook for sales prices for Q2 are more positive than
for Q1, going from a zero overall balance to +7. Thus, the percentage of business
people in the construction sector that forecast an increase in Q2 prices rose at a
higher rate than the percentage that expect a fall in prices (12% and 5%,
respectively).
16
7
2 2
21
15
-3
3
-5
0
5
10
15
20
25
Business performance Exports Sales prices Employment
AMB Catalonia

Economic and Infrastructure Studies Department
May 2016
1st Quarter of 2016 Report for Barcelona City Council
26
The outlook for employment in Q2 shows a negative trend. The percentage of
business people in the construction sector that forecast an increase in employee
numbers decreases slightly to 4% (before 5%), while the percentage indicating a
fall in fact rose to 17% (compared to 9% the previous quarter). Therefore, the
forecast is that there will be a decrease in employment.
Businesses’ negative outlook in terms of employment for the second quarter in
the AMB is even worse when we look at Catalonia as a whole. Sales price forecasts
are also lower in Catalonia, and the forecast for business performance is the same
in Catalonia and the AMB.
Table 11. Business outlook in the construction sector
Construction
Percentage of businesses
Quarter II
2015
Quarter I
2016
Quarter II
2016
Outlook compared to the last quarter
Business performance
Favourable 13 21 21
Normal 60 62 59
Unfavourable 28 18 20
Balance -15 3 1
Sales prices
Increase 1 4 12
The same 90 92 82
Decrease 10 4 5
Balance -9 0 7
Number of workers
Increase 5 5 4
The same 82 86 79
Decrease 14 9 17
Balance -9 -4 -13
Source: Chamber of Commerce of Barcelona and Idescat

Economic and Infrastructure Studies Department
May 2016
1st Quarter of 2016 Report for Barcelona City Council
27
Figure 16. Outlook for the construction sector in the AMB and Catalonia, 2T.2016 (Balance in %)
Source: Chamber of Commerce of Barcelona and Idescat
4.4. Retail
The outlook for retail in the second quarter is positive in terms of business
performance and employment, but sales prices remain at a similar level, with a
slight improvement compared to the previous quarter, but not compared to the
situation a year ago.
With respect to business performance, the increase in the percentage of
business people in the retail sector forecasting a favourable trend rose to 28% in
Q2 (24% the previous quarter), while the percentage of businesses indicating an
unfavourable trend dropped to 12% (compared to 15% in Q1). The overall balance
is very positive and in line with 2015’s outlook.
Sales price forecasts indicate there will be a small drop in prices in the second
quarter compared to the previous quarter, when the outlook was for price stability.
The percentage of employers in the retail sector that expect sales prices to rise in
fact gets smaller, but by a smaller percentage than those that expect prices will
decline (7% and 8%, respectively).
1
7
-13
10
-7
-15
-10
-5
0
5
10
Business performance Sales prices Employment
AMB Catalonia

Economic and Infrastructure Studies Department
May 2016
1st Quarter of 2016 Report for Barcelona City Council
28
However, the outlook for employment improved, and it is now positive in Q2.
10% of business people expect that employment will increase in the second quarter
(exactly the same percentage as the previous quarter), compared to 8% who
expect it to decrease (percentage decreases compared to the 11% recorded in the
previous quarter).
Table 12. Business outlook for the retail sector
Retail
Percentage of businesses
Quarter II
2015
Quarter I
2016
Quarter II
2016
Outlook compared to the last quarter
Business performance
Favourable 33 24 28 Normal 54 61 60
Unfavourable 13 15 12 Balance 19 9 16
Sales prices
Increase 7 14 7 The same 83 72 85 Decrease 11 14 8 Balance -4 0 -1
Number of workers
Increase 11 10 10 The same 83 79 82 Decrease 6 11 8 Balance 5 -1 2
Source: Chamber of Commerce of Barcelona and Idescat
The outlook for business performance in the retail sector in the second quarter
of 2016 is better in Catalonia as a whole than in the AMB, with the former being
slightly more positive in terms of employment and sales prices (these had a
negative overall balance). The outlook on business performance is the same for
both geographical areas.
Figure 17. Outlook for the retail sector in the AMB and Catalonia 2T. 2016
(Balance in %)
Source: Chamber of Commerce of Barcelona and Idescat
16
-1
2
16
1
5
-5
0
5
10
15
20
Business performance Sales prices Employment
AMB Catalonia

Economic and Infrastructure Studies Department
May 2016
1st Quarter of 2016 Report for Barcelona City Council
29
4.5. Hospitality
Hospitality is the sector with the best business outlook for the second quarter,
notably with positive balances for all variables analysed. However, these forecasts
were not as high as for the same quarter the previous year in terms of sales prices
and employment.
The outlook for business performance in the second quarter is very positive,
mainly due to the fact that this coincides with the beginning of the summer season
and tourism in general is enjoying very good results. Thus, 47% of business people
expect business performance will be favourable, well above the 2% who expected it
to be unfavourable. This result improves on last year’s (45% and 4%, respectively),
making it the best outlook since the data series began.
Given this very favourable situation in Q2, the sector is expecting sales prices to
rise. This is what 29% of business people in the hospitality sector expect, clearly
exceeding the 4% indicating it will decrease.
Furthermore, the sector is expecting to create employment in the second
quarter: 19% of employers forecast an increase of workers, compared to 2% who
expected this to drop. However, the overall balance is less positive than a year ago,
when these percentages were 46% and 1%, respectively.
Table 13. Business outlook in the hospitality sector Hospitality
Percentage of businesses
Quarter II
2015
Quarter I
2016
Quarter II
2016
Business performance
Favourable 45 16 47
Normal 51 61 50
Unfavourable 4 24 2
Sales prices
Balance 41 -8 45
The same 58 80 66
Decrease 2 13 4
Balance 37 -7 25
Number of workers
Increase 46 1 19
The same 53 75 80
Decrease 1 24 2
Balance 44 -23 17
Source: Chamber of Commerce of Barcelona and Idescat

Economic and Infrastructure Studies Department
May 2016
1st Quarter of 2016 Report for Barcelona City Council
30
Business performance and sales prices in the hospitality sector are expected to
be more favourable in the AMB than the whole of Catalonia, very likely because this
sector is highly concentrated in the metropolitan area, especially in the city of
Barcelona. However, employment forecasts are slightly higher in Catalonia than the
AMB.
Figure 18. Outlook for the hospitality sector in the AMB and Catalonia
2T.2016 (Balance in %)
Source: Chamber of Commerce of Barcelona and Idescat
4.6. Other services
For ‘other services’ the prospects are positive, except for sales prices. These
forecasts are in line with the outlook a year ago, but compared to the previous
quarter, these are more favourable and positive in terms of business performance
and employment, while sales prices worsen (turning in negative number).
Regarding business performance, the outlook remains quite favourable. 25%
of business people in this sector expect business performance to be favourable in
Q2, a higher percentage than that expecting business performance to be
unfavourable (10%), which means the overall balance is only two percentage points
lower than that of Q2 in 2015 (which was the best result since 2010).
On the other hand, the business outlook for sales prices is worse and these
are again slightly negative. The percentage of business people forecasting prices
45
25
17
33
20 21
0
10
20
30
40
50
Business performance Sales prices Employment
AMB Catalonia

Economic and Infrastructure Studies Department
May 2016
1st Quarter of 2016 Report for Barcelona City Council
31
will decrease dropped to 5% (7% in the previous quarter), while the percentage
expecting prices to rise in fact decreases by a larger amount to 1% (compared to
11% in 1T).
The outlook for employment and business performance also improved
significantly with an increase in the overall balance in the second quarter. 11% of
employers expected this would rise, a percentage that is higher than the 8% that
expected it will fall, giving an overall positive outlook balance.
Table 14. Business outlook for the ‘other services’ sector
Other services
Percentage of businesses
Quarter II
2015
Quarter I
2016
Quarter II
2016
Outlook compared to the last quarter
Business performance
Favourable 27 22 25 Normal 63 63 65
Unfavourable 10 15 10 Balance 17 7 15
Sales prices
Increase 2 11 1 The same 91 81 93 Decrease 8 7 5 Balance -6 4 -4
Number of workers
Increase 15 13 11 The same 75 75 81 Decrease 10 12 8 Balance 6 1 4
Source: Chamber of Commerce of Barcelona and Idescat
The outlook for the Metropolitan Area of Barcelona in the second quarter is
worse for sales prices and employment than Catalonia as a whole, but a little
better in terms of business performance.
Figure 19. Outlook for ‘other services’ sector in the AMB and Catalonia
2T.2016 (Balance in %)
Source: Chamber of Commerce of Barcelona and Idescat
15
-4
4
14
-3
5
-10
-5
0
5
10
15
20
Business performance Sales prices Employment
AMB Catalonia

Economic and Infrastructure Studies Department
May 2016
1st Quarter of 2016 Report for Barcelona City Council
32
5. Technical information
Table 15. Sample error. Metropolitan Area of Barcelona.
First quarter 2016
Sectors Sample Error5
Industry 177 7.4% Construction 94 10.1% Retail 247 6.2% Hospitality 101 9.8% Other services 559 4.1% TOTAL 1178 2.9%
Source: Chamber of Commerce of Barcelona and Idescat
6. Methodology
Since 2012, the Business Climate Survey of Catalonia broadened its reach in
terms of sectors considered to be consistent with INE data for the whole of Spain,
which the agency started to use in January, 2012.
These changes are mainly related to:
Broadening the industrial sector to include the whole sector, because so
far it only considered manufacturing industry.
Broadening the construction sector to include the whole sector. This
means including specialised construction activities, which were previously
not contemplated.
Broadening the retail sector. Until now this only contemplated retail
trade, but it now also includes the wholesale trade and the sale and repair
of vehicles.
Broadening the sector related to tourism. So far, it only included the hotel
industry, but this now includes eateries (food and beverage services)
Broadening the services sector in order to contemplate almost all the
sector. So this is now called ‘other services’.
5 Maximum possible error calculated from a simple random sample

Economic and Infrastructure Studies Department
May 2016
1st Quarter of 2016 Report for Barcelona City Council
33
Therefore, the sector categories6 after 2012 are:
Industry 01: Food, beverages and tobacco (CCAE-2009: 10 to 12) 02: Textiles, clothing, leather and footwear (CCAE-2009: 13 to 15) 03: Wood and cork, paper and printing industries (CCAE-2009: 16 to 18) 04: Chemical, rubber and other non-metal minerals industries (CCAE-2009: 20 to 23) 05: Metallurgy and manufacturing of metal products (CCAE-2009: 24 and 25) 06: Manufacture of machinery and mechanical equipment, and electrical products, computers, electronic and optical products (CCAE-2009: 26 to 28) 07 Other industries (CCAE-2009: 05 09 to 19, 29 to 33, 35 to 39) Construction Section F of the CCAE-2009 is considered completely, with divisions: 41: Construction of buildings 42: Construction of civil engineering works 43: Specialised construction activities Retail 01: Retail trade of food products, beverages and tobacco specialized (CCAE-2009: 472) 02: Retail trade of household goods, cultural and recreational goods in specialised shops (CCAE-2009: 475 and 476) 03: Other types of retail (CCAE-2009: 473, 474, 477, 478, 479) 04: Retail in non-specialized shops (CCAE-2009: 471) 05: Sale and repair of motor vehicles and motorcycles (CCAE-2009: 45) 06: Wholesale trading and intermediary trading (CCAE-2009: 46) Hospitality CCAE-2009: 55 and 56 55: Accommodation Services 56: Food and Beverage Services Other services 01: Information and communication (CCAE-2009: 58 to 63) 02: Legal and accounting activities (CCAE-2009: 69) 03: R&D, advertising and market research and scientific and technical activities (CCAE-2009: 71 to 75) 04: Administrative and support service activities (CCAE-2009: 77 to 82) 05: Other Services (CCAE-2009: 49 53, 64 66, 68, 92, 93 and 96)
For more information on methodology, see: http://www.ine.es/metodologia/t37/t3730199.htm
6 The new methodology used for sector categories in the Business Climate Survey for industry and construction allows a comparison with the survey results for previous quarters in 2012, but not in the ‘other sectors’ sector.