Embed Size (px)
Citation preview
Benchmark roundup – why bother?
• Benchmarking since 2009
– 276 councils participated, many more than
once
– Confidential, but valuable dataset
• Publish aggregate as a “state of the
nation”
– Before we forget
– for future benefit

What we’ll cover
• Costs and subsidy of planning
• Fees
• Productivity
• Customer survey
• Planning Quality Framework
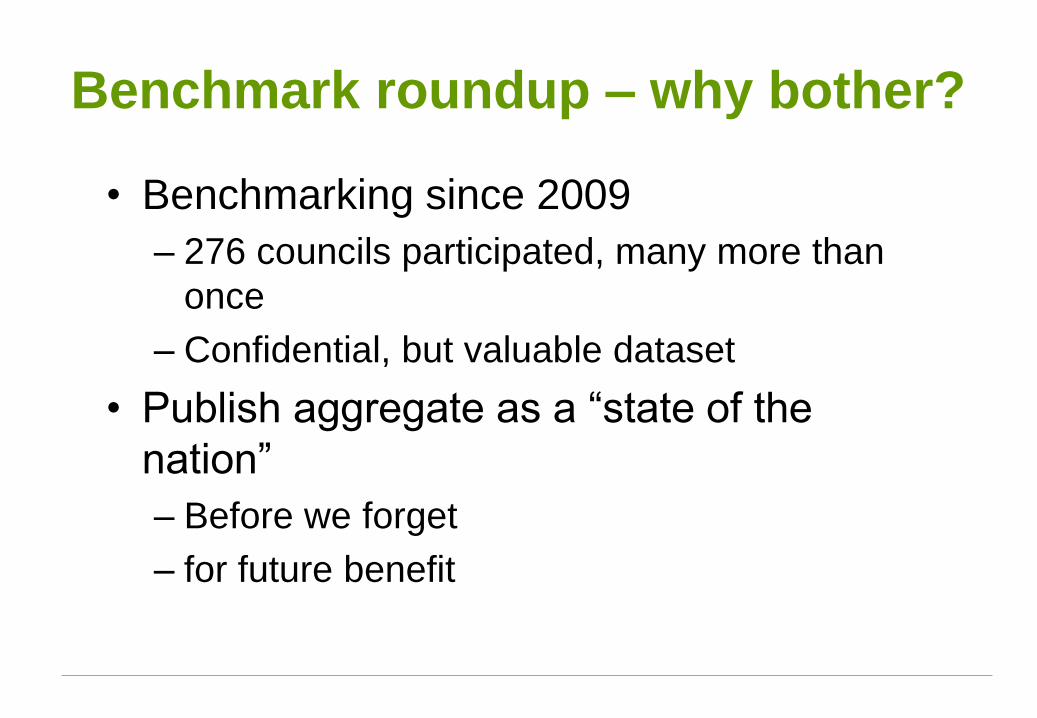
What do councils spend the money
on?
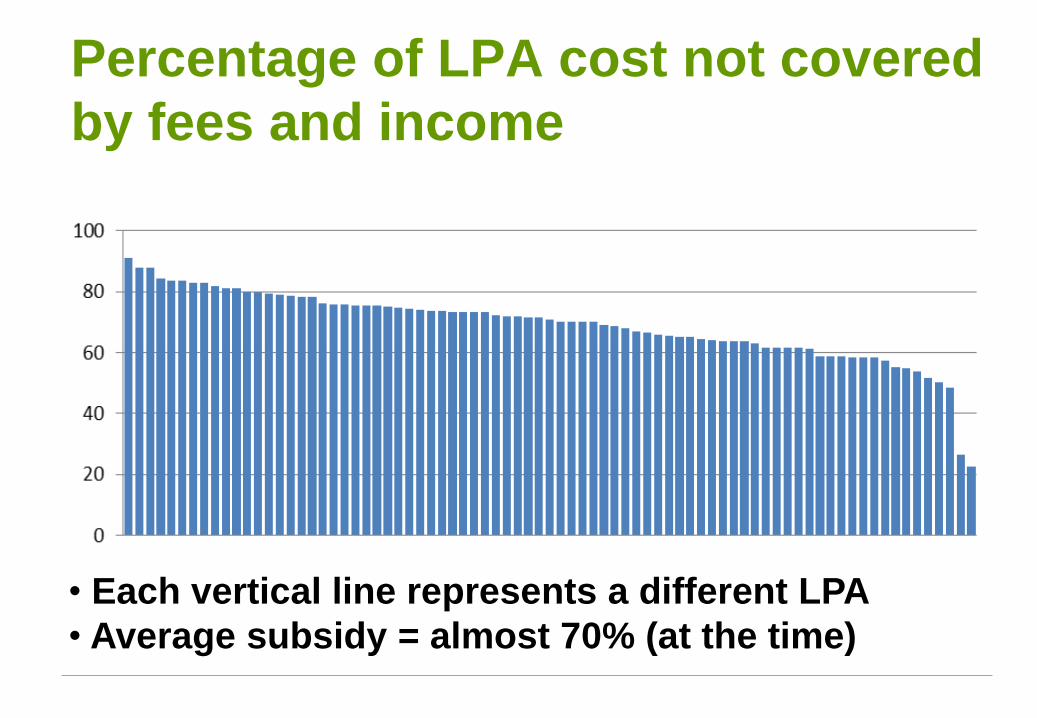
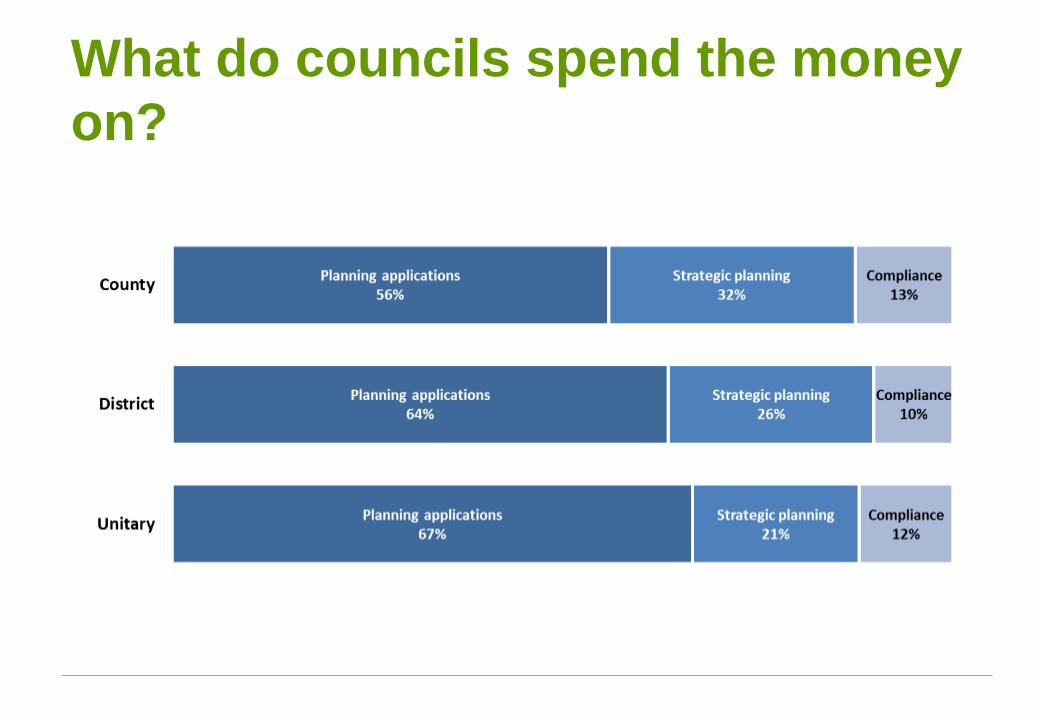
Percentage of LPA cost not covered
by fees and income
• Each vertical line represents a different LPA
• Average subsidy = almost 70% (at the time)
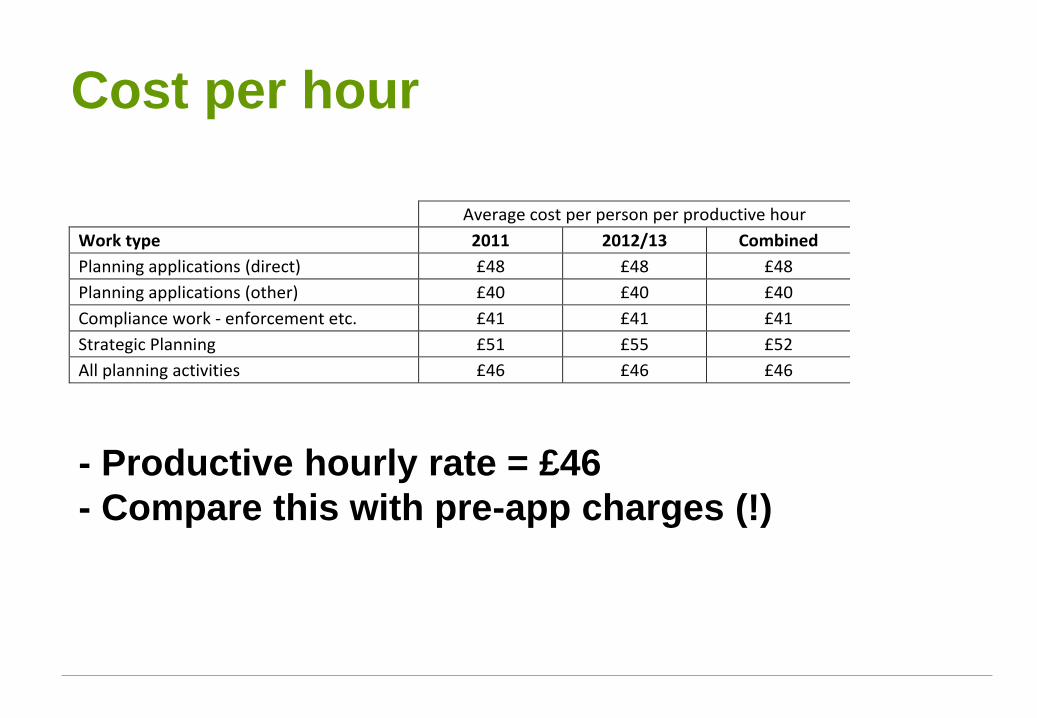
Cost per hour
Average cost per person per productive hour
Work type 2011 2012/13 Combined
Planning applications (direct) £48 £48 £48
Planning applications (other) £40 £40 £40
Compliance work - enforcement etc. £41 £41 £41
Strategic Planning £51 £55 £52
All planning activities £46 £46 £46
- Productive hourly rate = £46
- Compare this with pre-app charges (!)
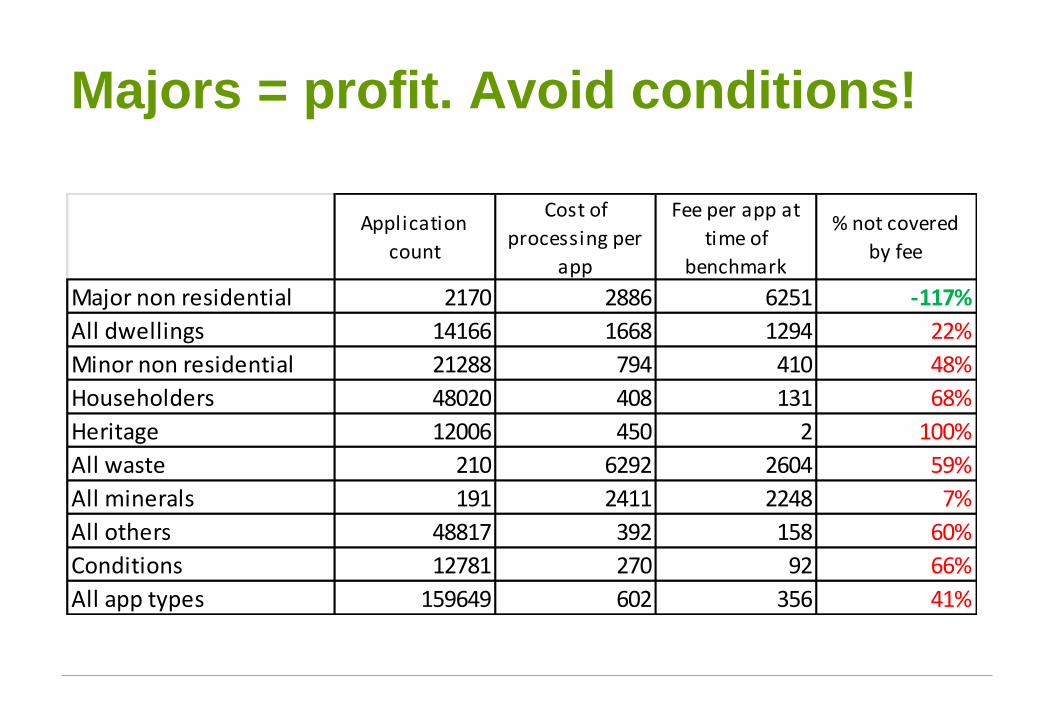
Majors = profit. Avoid conditions!
Application
count
Cost of
processing per
app
Fee per app at
time of
benchmark
% not covered
by fee
Major non residential 2170 2886 6251 -117%
All dwellings 14166 1668 1294 22%
Minor non residential 21288 794 410 48%
Householders 48020 408 131 68%
Heritage 12006 450 2 100%
All waste 210 6292 2604 59%
All minerals 191 2411 2248 7%
All others 48817 392 158 60%
Conditions 12781 270 92 66%
All app types 159649 602 356 41%
Productivity
• “We are not updating the 150 cases per
officer thing”
Productivity
• “We are not updating the 150 cases per
officer thing”
– In the end, we have (sort of)
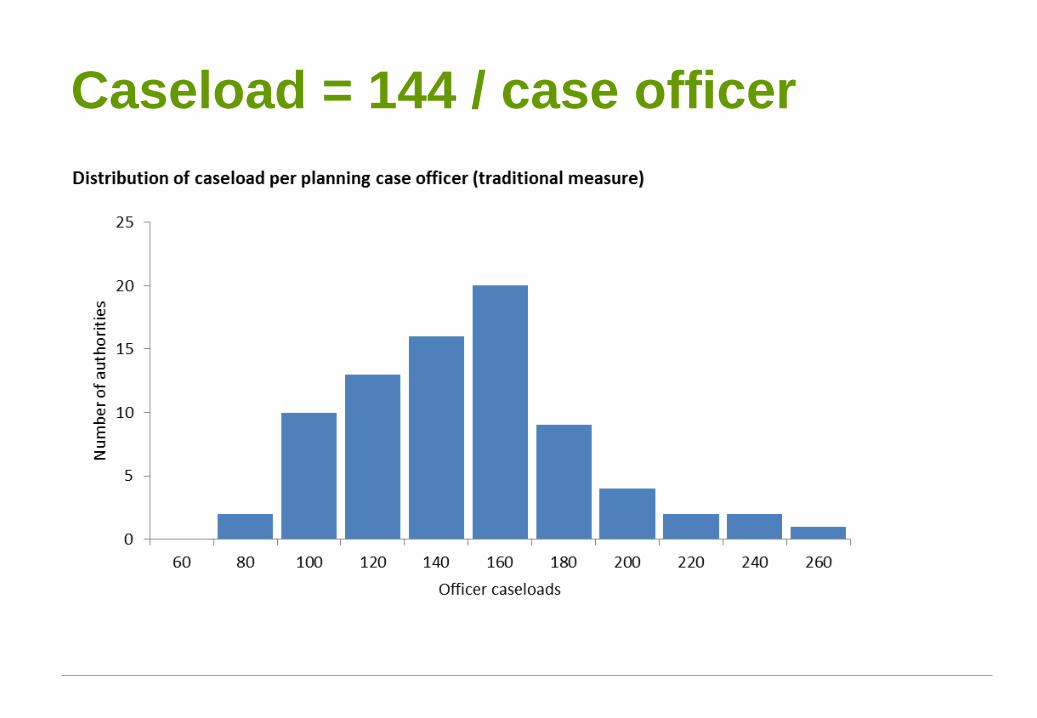
Caseload = 144 / case officer
Productivity revisited
• In 2002, it was professional case officer +
admin types. Now less differentiation.
• Not cases per DC officer, but cases per
person
– Derives total head count
– In the ODPM study, this was “less than 100”
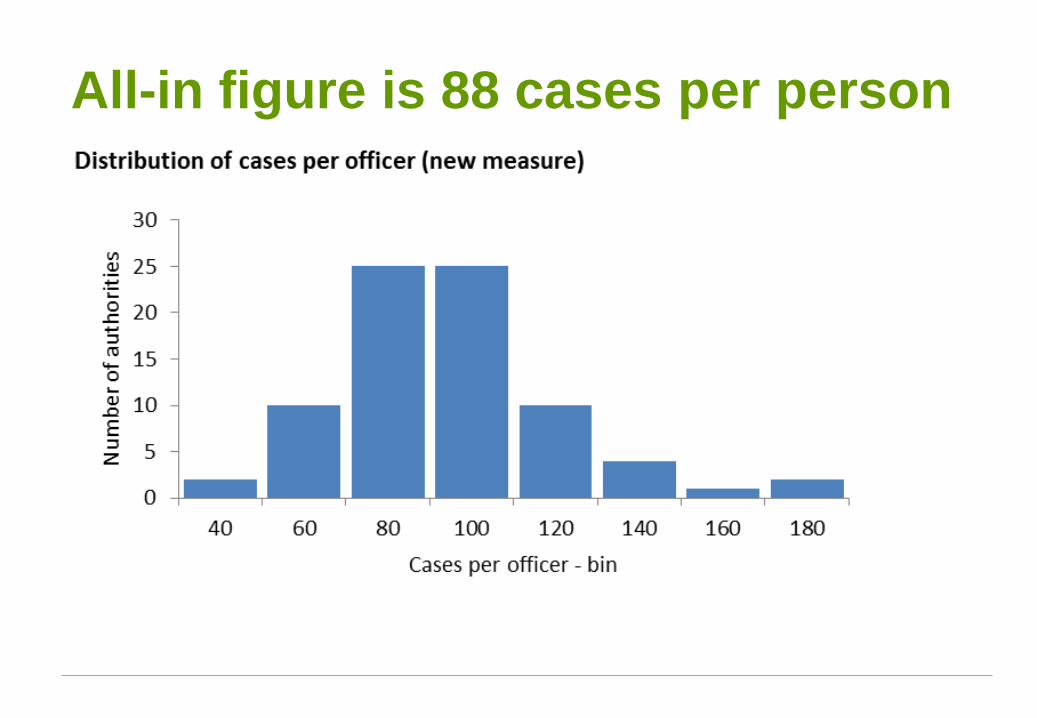
All-in figure is 88 cases per person
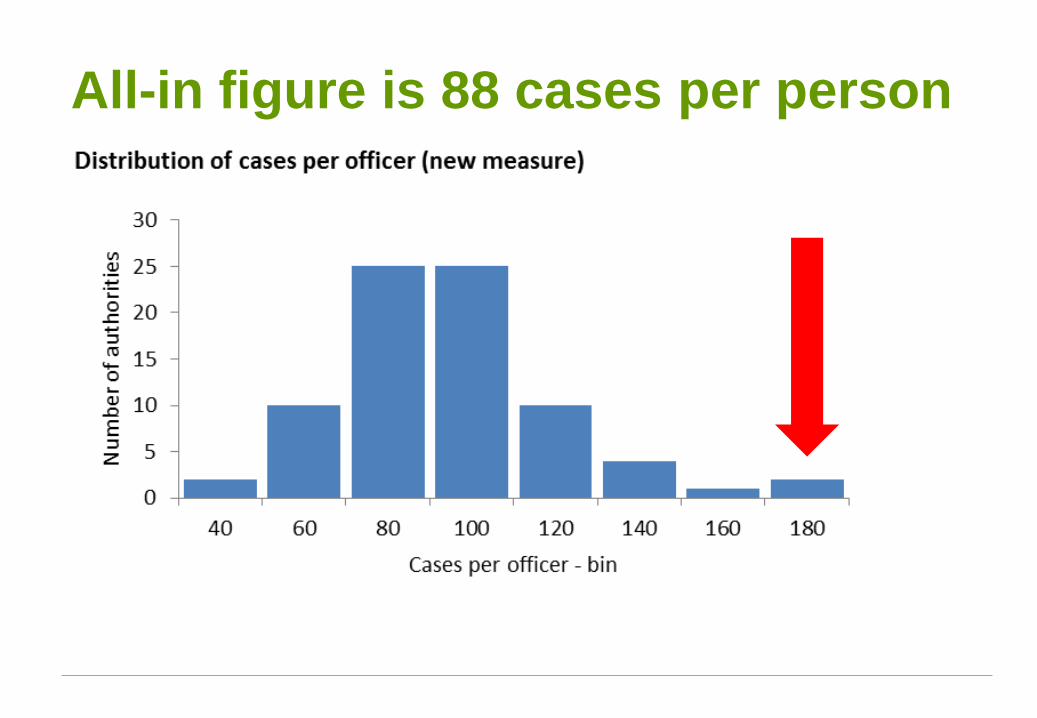
All-in figure is 88 cases per person
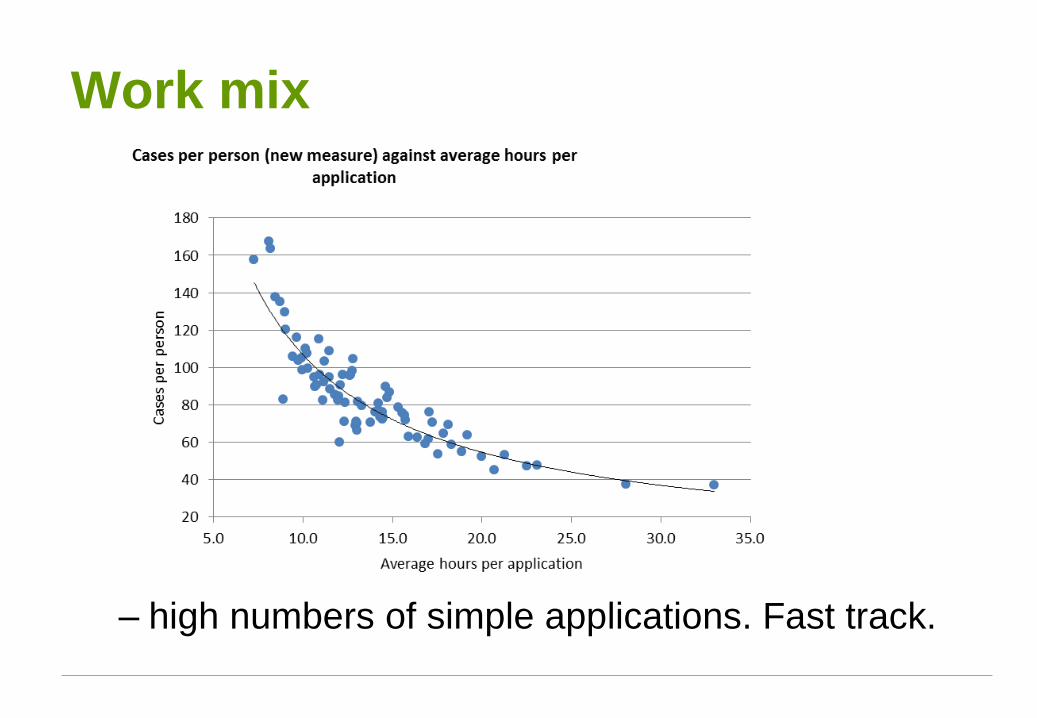
Work mix
– high numbers of simple applications. Fast track.
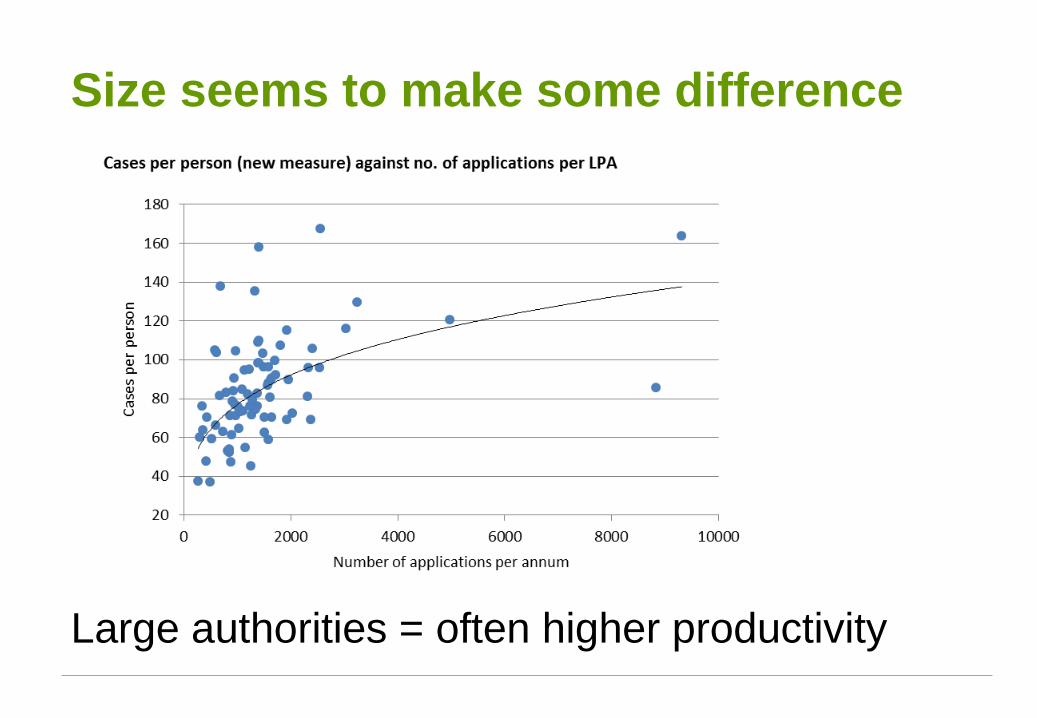
Size seems to make some difference
Large authorities = often higher productivity
Customers
• In aggregate there were clear messages
– Talk to us, generally. It’s just manners.
– Talk to us *especially* when there are issues
– Let us amend
– Councils (generally) fail on customer care
• We fail because we don’t communicate and
follow a target culture
Reflections on the old benchmark
results
• One size does not fit all
• National indicators hide almost everything
interesting and useful about performance
• Subsidy represents a risk to development
• Communication is often weak