Embed Size (px)
Citation preview
Active Transportation Performance Measures
Susan Wright, PEAssociate Engineer
March 30, 2015Oregon Active Transportation Summit
What’s a Performance Measure?
• The metric we use to evaluate if our system is functioning the way we want it to– Used to • evaluate our existing system• plan our future system• prioritize projects and programs • to condition development
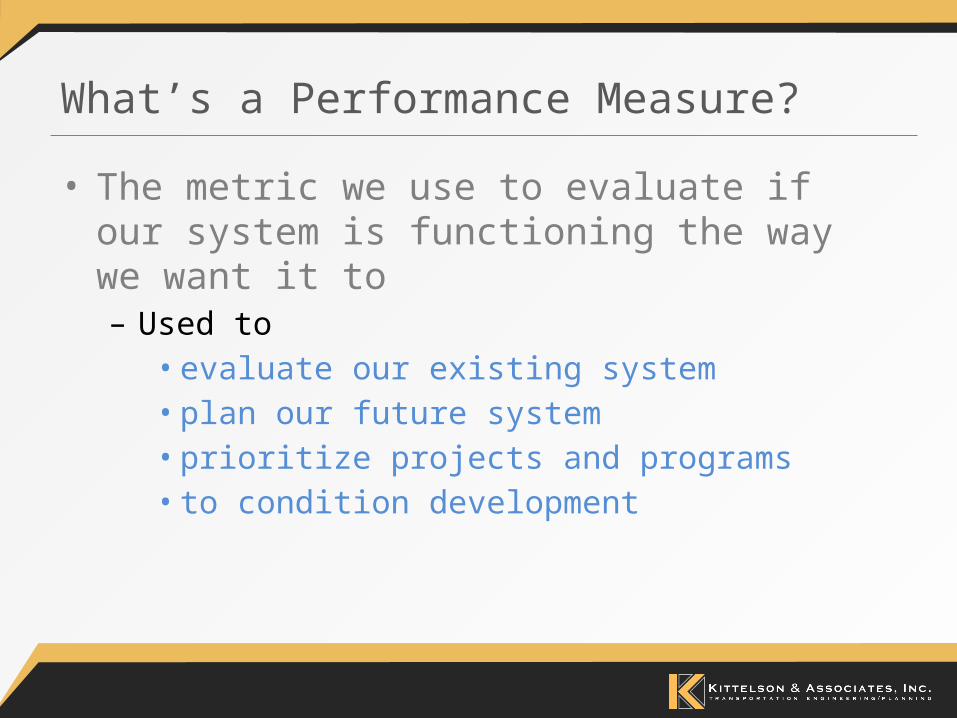
Vision, Goals, Objectives, Performance Measures
• Vision and Goals– Provide strategic direction for investment and policy decisions
• Vision –The ideal condition for your community under perfect conditions. – Example - To be the most walkable community
• Goals – The desired outcomes. – Example - Facilitate walking
• Objectives– Describe how a goal can be accomplished
• Example - Every household is within 3/8 mi. of a trailhead• Example - Development patterns influenced by trail network
• Performance Measures – How we know if we are meeting our objectives

Performance Measures
• You get what you measure– Are you measuring things that directly relate to the
outcomes you want?
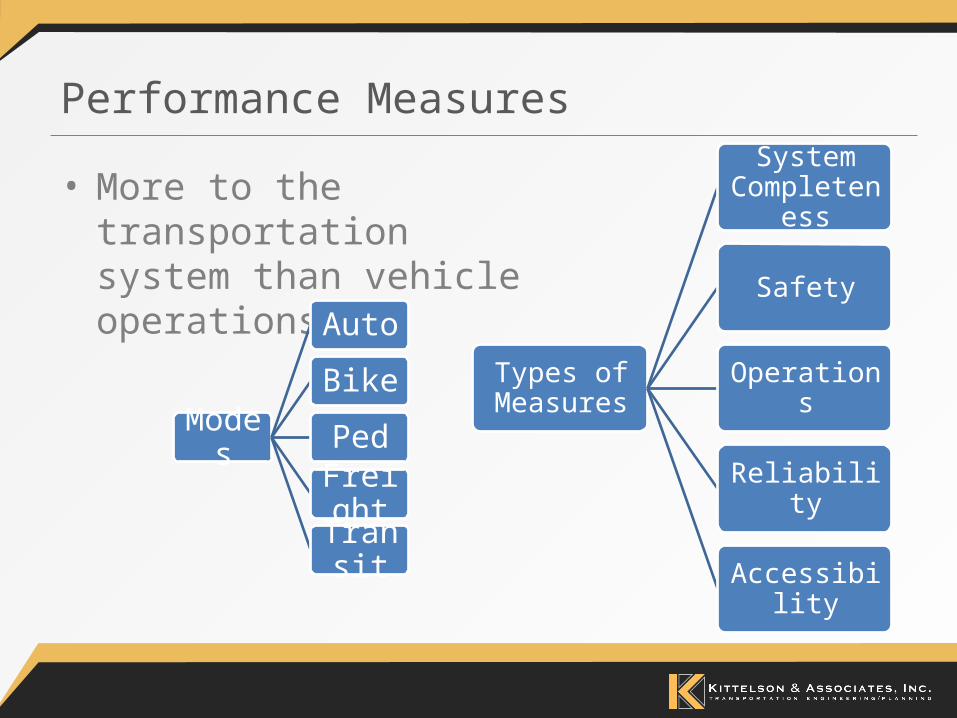
Performance Measures
• More to the transportation system than vehicle operations
Modes
Auto
Bike
Ped
Freight
Transit
Types of Measures
System Completeness
Safety
Operations
Reliability
Accessibility
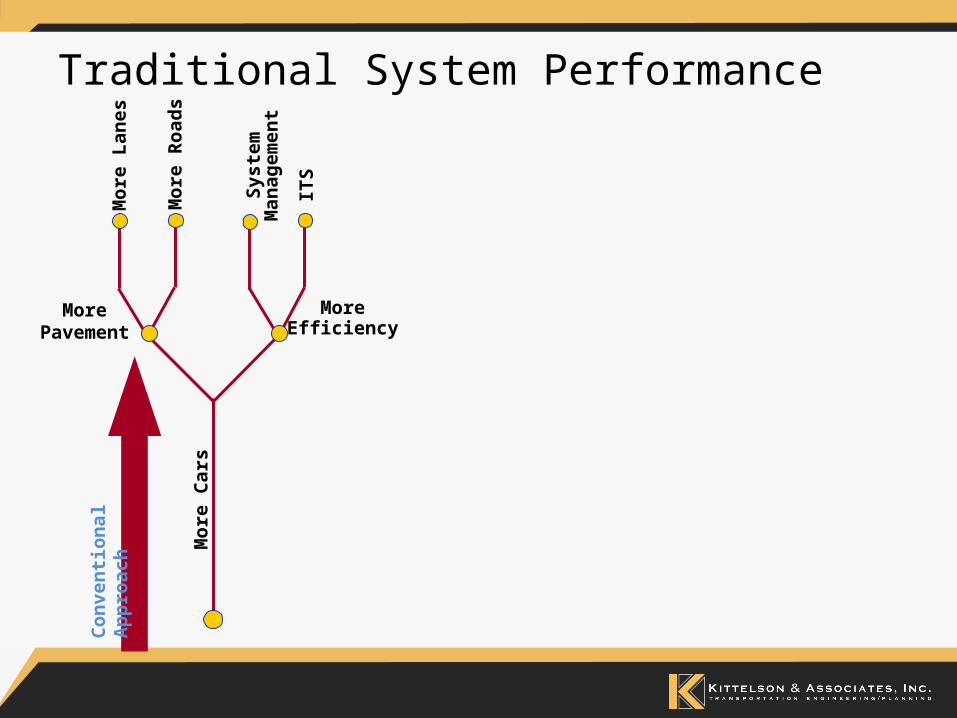
Con
ven
tion
al
Ap
pro
ach
MoreEfficiency
Syste
m
Man
ag
em
en
t
More Pavement
More
Lan
es
More
Road
s
ITS
More
Cars
Traditional System Performance
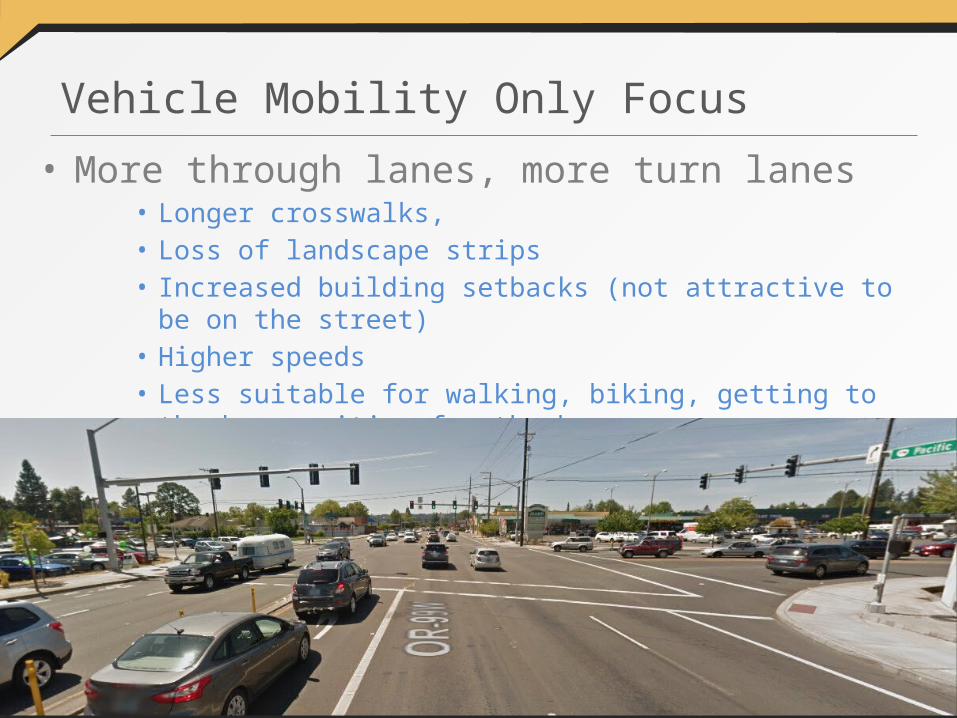
Vehicle Mobility Only Focus
• More through lanes, more turn lanes• Longer crosswalks, • Loss of landscape strips• Increased building setbacks (not attractive to be on the street)• Higher speeds• Less suitable for walking, biking, getting to the bus, waiting for the
bus
Con
ven
tion
al
Ap
pro
ach
MoreEfficiency
Syste
m
Man
ag
em
en
t
More Pavement
More
Lan
es
More
Road
s
ITS
More
Cars
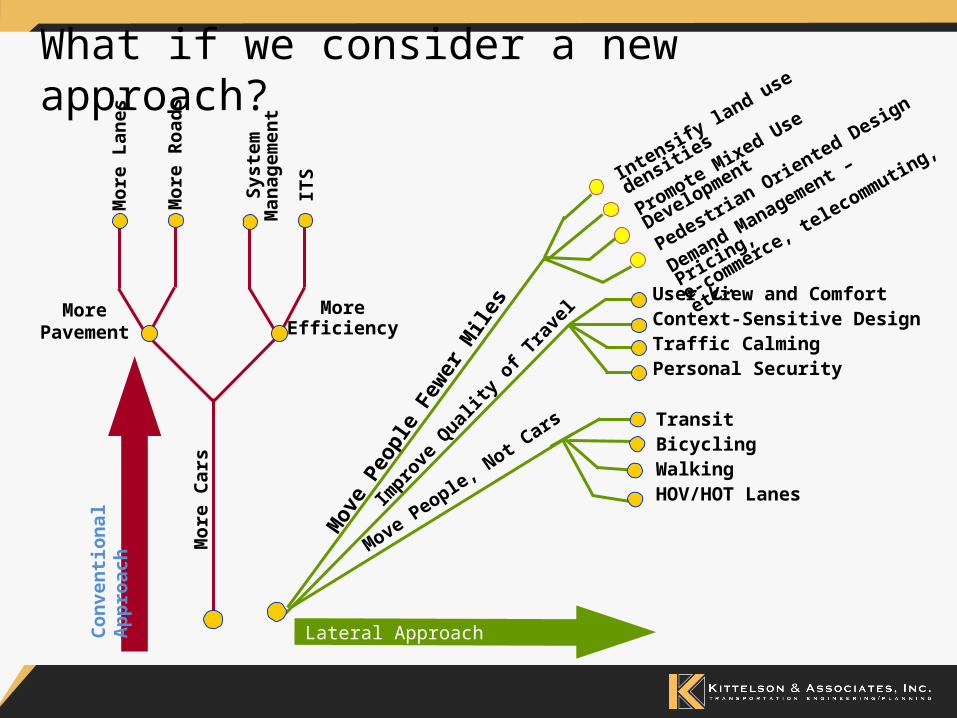
What if we consider a new approach?
Lateral Approach
Impr
ove
Qua
lity
of Tra
vel
User View and ComfortContext-Sensitive DesignTraffic CalmingPersonal Security
Mov
e Peo
ple
Few
er M
iles
Intensify la
nd use densit
ies
Promote M
ixed Use
Development
Pedestrian O
riented
Design
Demand Management –
Pricing,
e-commerce
,
telecommutin
g, etc…
Move People, N
ot Cars Transit
BicyclingWalkingHOV/HOT Lanes

Oregon Policy Context
DLCD’s Transportation Planning Rule
(TPR)
ODOT’s Oregon Highway Plan
Policy 1F
Metro’s Regional Transportation Plan and Regional Transportation
Functional Plan
Local Agencies
Allow for flexibility in setting multi-modal performance measures at the local level (balance highway standards with local objectives).
Requires local jurisdictions to measure and plan for multi-modal transportation.
Looking for ways to adopt multi-modal performance measures and standards.

Performance Measures
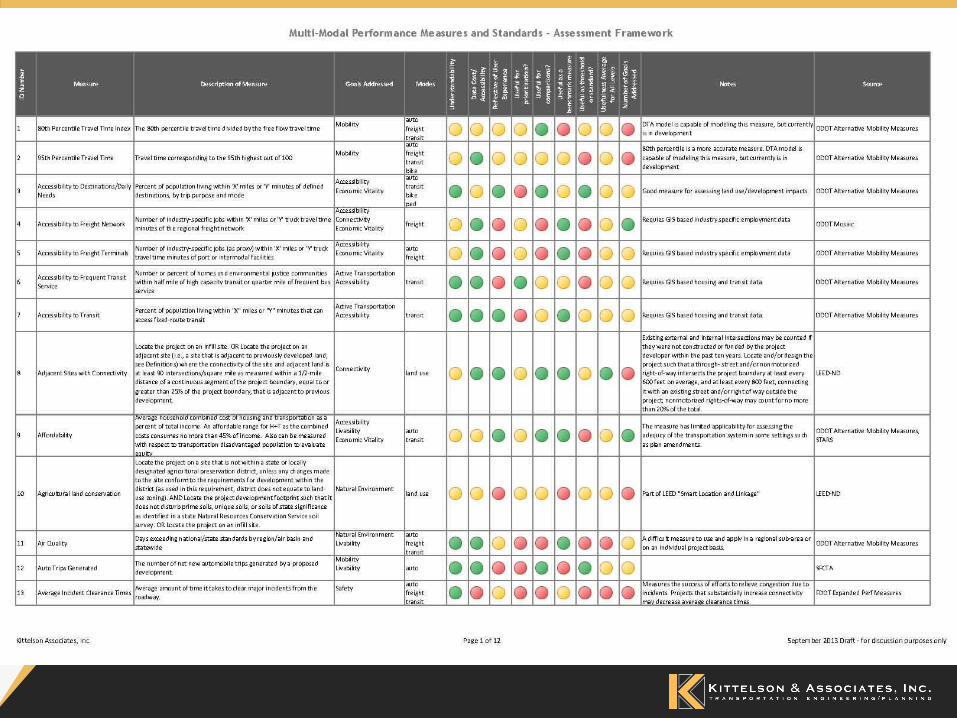
• Evaluated over 160 measures for Washington County from many sources– Types of goals addressed– Modes addressed– Understandability of
Measures– Data Cost and Accessibility– Reflective of User Experience– Applicability to Different
Planning Uses
The measure would be easily applied for the planning scenario.
The measure could be applied, but may not be the most effective measure.
The measure would be difficult to apply to the planning scenario.

Different Measures for Different Purposes
Source: Washington County Multi-Modal Performance Measures and Standards
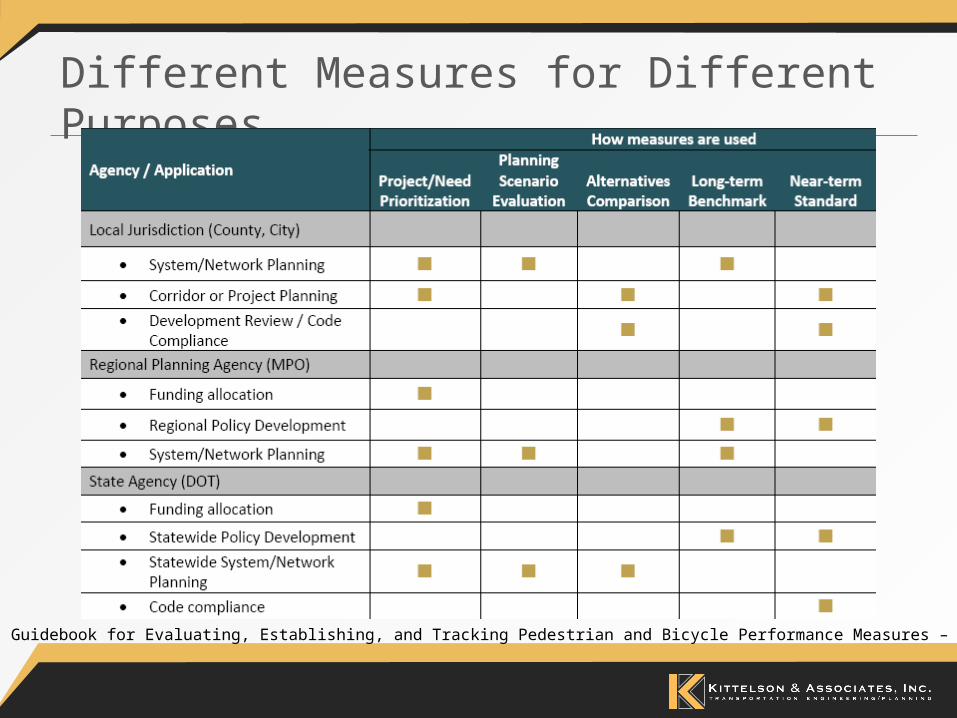
Different Measures for Different Purposes
Source: FHWA Guidebook for Evaluating, Establishing, and Tracking Pedestrian and Bicycle Performance Measures – Literature Review
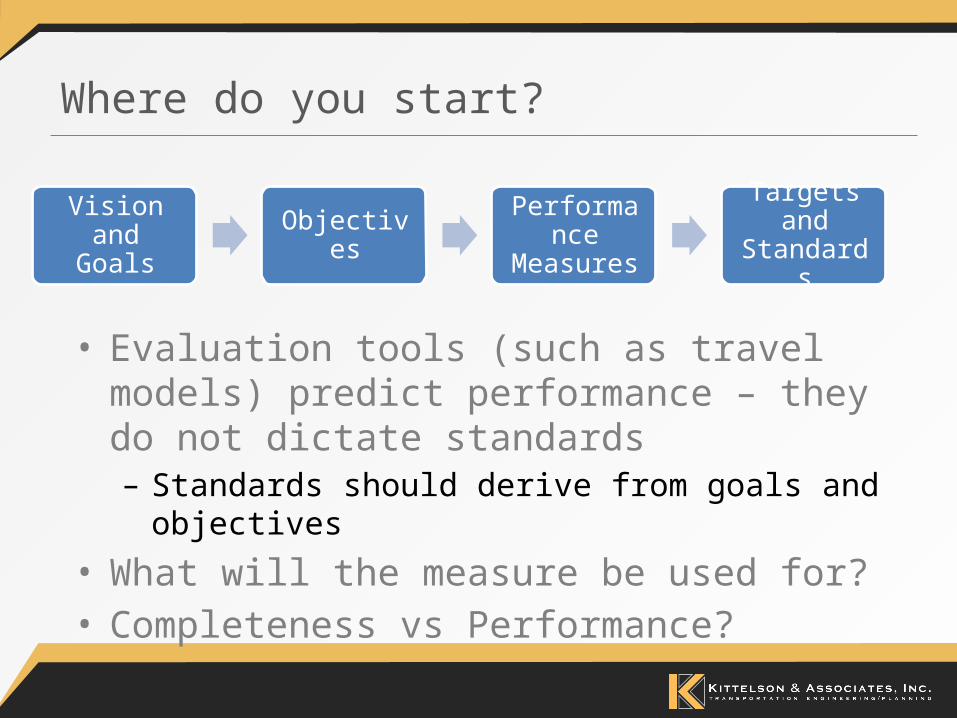
Where do you start?
• Evaluation tools (such as travel models) predict performance – they do not dictate standards– Standards should derive from goals and objectives
• What will the measure be used for?• Completeness vs Performance?
Vision and Goals Objectives Performance
MeasuresTargets and Standards
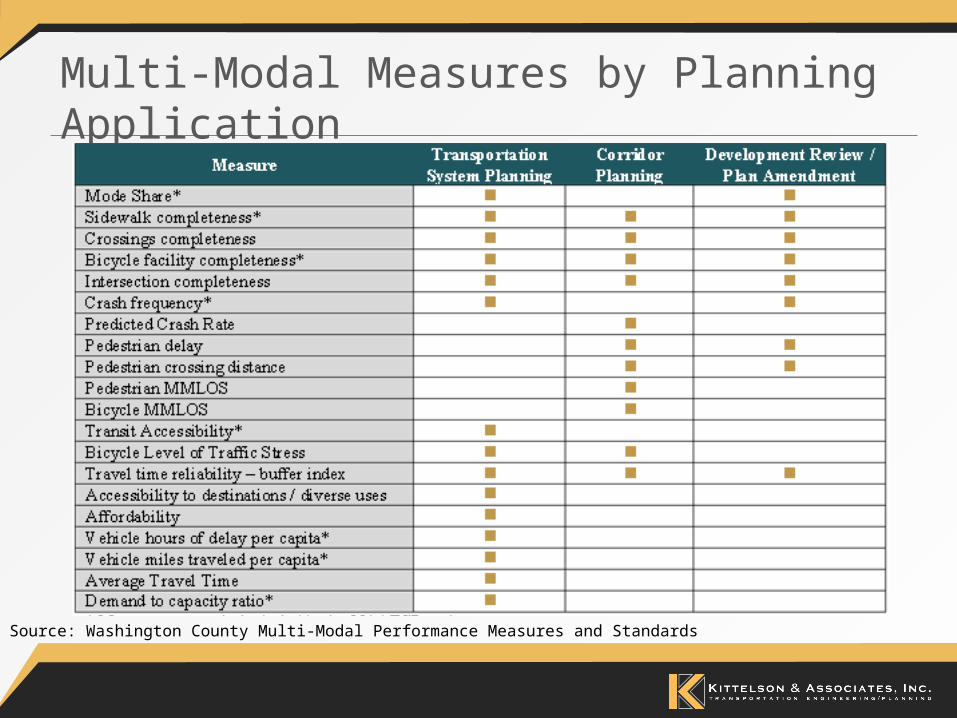
Multi-Modal Measures by Planning Application
Source: Washington County Multi-Modal Performance Measures and Standards
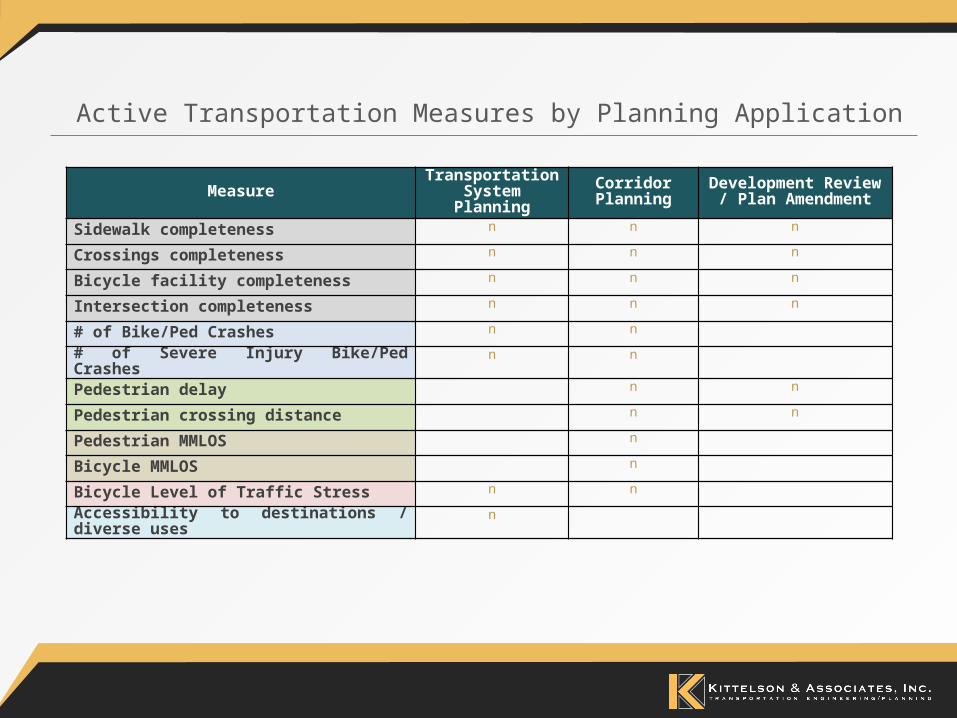
Measure Transportation System Planning
Corridor Planning
Development Review / Plan Amendment
Sidewalk completeness n n n
Crossings completeness n n n
Bicycle facility completeness n n n
Intersection completeness n n n
# of Bike/Ped Crashes n n
# of Severe Injury Bike/Ped Crashes n n
Pedestrian delay n n
Pedestrian crossing distance n n
Pedestrian MMLOS n
Bicycle MMLOS n
Bicycle Level of Traffic Stress n n
Accessibility to destinations / diverse uses n
Active Transportation Measures by Planning Application
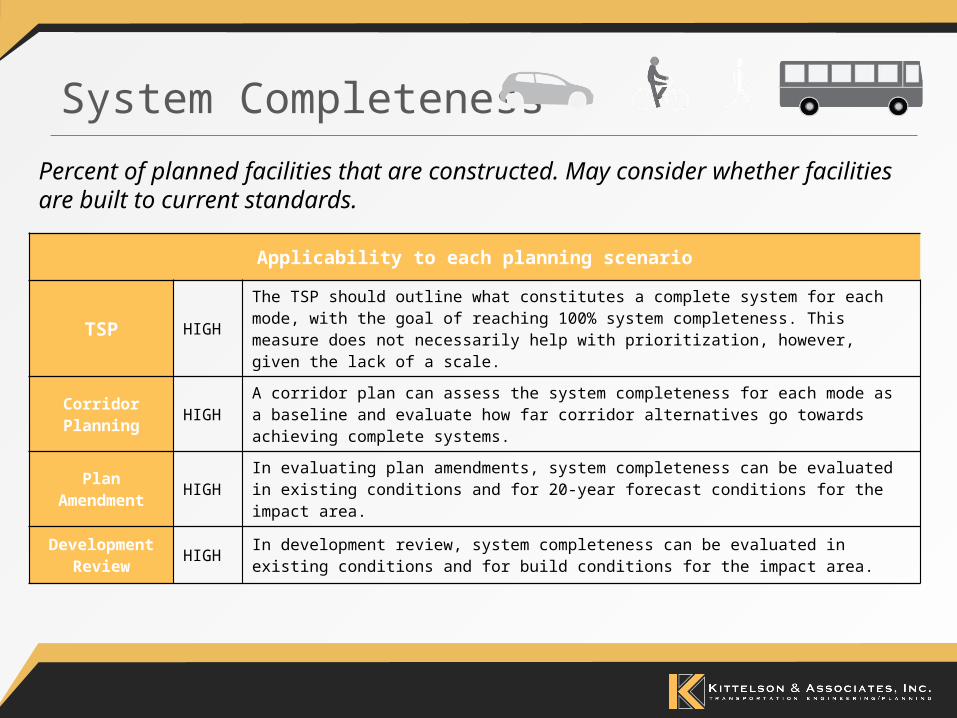
Applicability to each planning scenario
TSP HIGHThe TSP should outline what constitutes a complete system for each mode, with the goal of reaching 100% system completeness. This measure does not necessarily help with prioritization, however, given the lack of a scale.
Corridor Planning HIGH A corridor plan can assess the system completeness for each mode as a baseline and evaluate how far corridor alternatives go towards achieving complete systems.
Plan Amendment HIGH In evaluating plan amendments, system completeness can be evaluated in existing conditions and for 20-year forecast conditions for the impact area.
Development Review HIGH In development review, system completeness can be evaluated in existing conditions and for build
conditions for the impact area.
System Completeness
Percent of planned facilities that are constructed. May consider whether facilities are built to current standards.
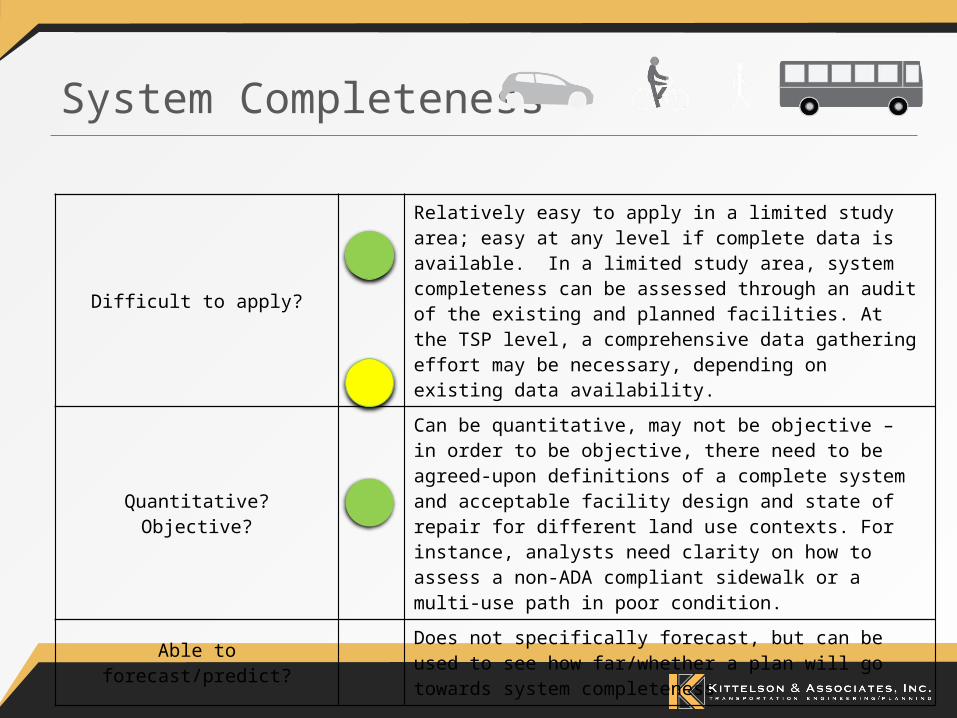
System Completeness
Difficult to apply?
Relatively easy to apply in a limited study area; easy at any level if complete data is available. In a limited study area, system completeness can be assessed through an audit of the existing and planned facilities. At the TSP level, a comprehensive data gathering effort may be necessary, depending on existing data availability.
Quantitative? Objective?
Can be quantitative, may not be objective – in order to be objective, there need to be agreed-upon definitions of a complete system and acceptable facility design and state of repair for different land use contexts. For instance, analysts need clarity on how to assess a non-ADA compliant sidewalk or a multi-use path in poor condition.
Able to forecast/predict? Does not specifically forecast, but can be used to see how far/whether a plan will go towards system completeness
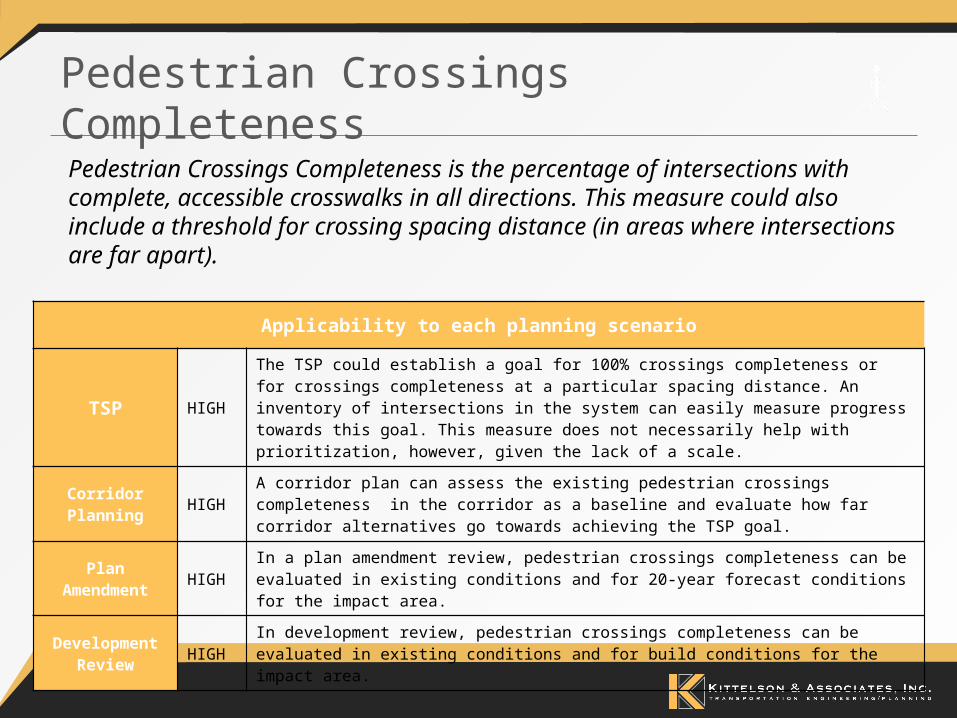
Pedestrian Crossings CompletenessPedestrian Crossings Completeness is the percentage of intersections with complete, accessible crosswalks in all directions. This measure could also include a threshold for crossing spacing distance (in areas where intersections are far apart).
Applicability to each planning scenario
TSP HIGHThe TSP could establish a goal for 100% crossings completeness or for crossings completeness at a particular spacing distance. An inventory of intersections in the system can easily measure progress towards this goal. This measure does not necessarily help with prioritization, however, given the lack of a scale.
Corridor Planning HIGH A corridor plan can assess the existing pedestrian crossings completeness in the corridor as a baseline and evaluate how far corridor alternatives go towards achieving the TSP goal.
Plan Amendment HIGH In a plan amendment review, pedestrian crossings completeness can be evaluated in existing conditions and for 20-year forecast conditions for the impact area.
Development Review HIGH In development review, pedestrian crossings completeness can be evaluated in existing conditions
and for build conditions for the impact area.
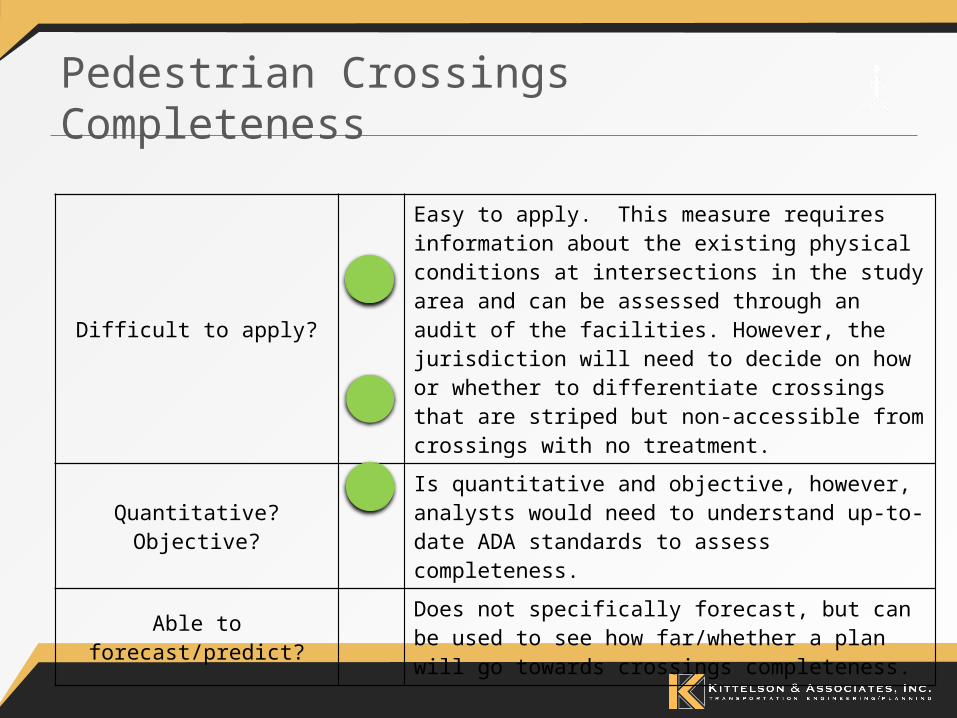
Pedestrian Crossings Completeness
Difficult to apply?
Easy to apply. This measure requires information about the existing physical conditions at intersections in the study area and can be assessed through an audit of the facilities. However, the jurisdiction will need to decide on how or whether to differentiate crossings that are striped but non-accessible from crossings with no treatment.
Quantitative? Objective?Is quantitative and objective, however, analysts would need to understand up-to-date ADA standards to assess completeness.
Able to forecast/predict? Does not specifically forecast, but can be used to see how far/whether a plan will go towards crossings completeness.

Bicycle Level of Traffic Stress
– Link• Physical separation of bike facility (+)• Presence of on-street parking (-)• Number of through vehicle lanes (-)• Bike lane presence and width (+)• Speed limit (-)• On-street parking utilization (–)• Bike lane blockage (-)• Presence of Street Centerline (-)
– Intersection• Right turn lane configuration details
– Crossing• Speed limit of street being crossed (-)• Number of through vehicle lanes (-)• Presence of median refuge (at least 6 feet wide) (+)
Bicycle Level of Traffic Stress is a stratified rating system designed to describe the traffic-based stress on bicyclists on a particular route or network. The assessment is based on the following attributes:
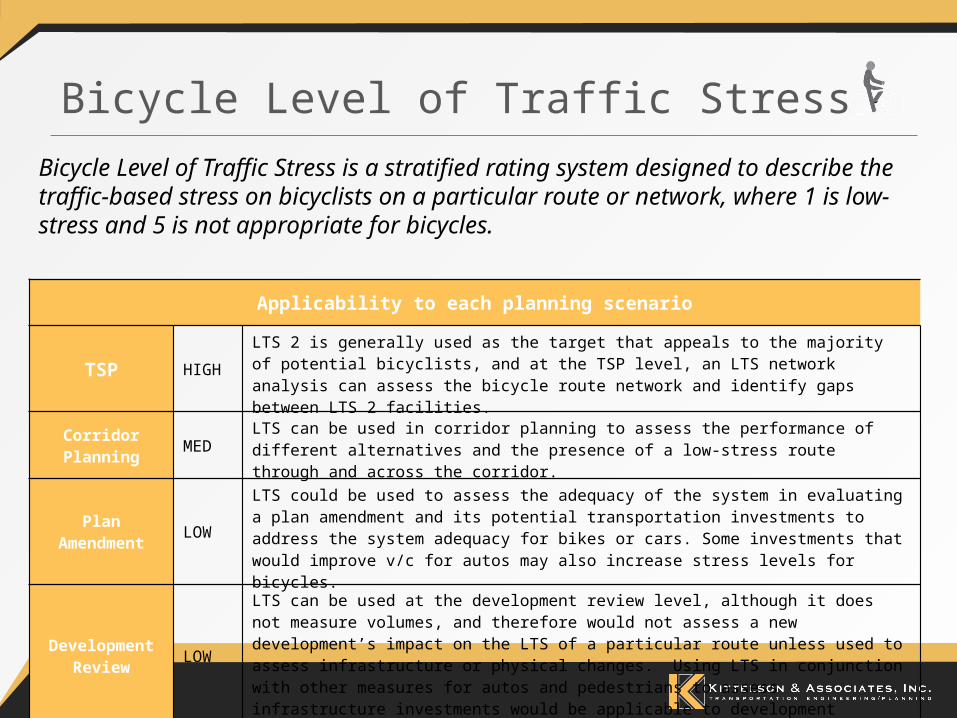
Bicycle Level of Traffic StressBicycle Level of Traffic Stress is a stratified rating system designed to describe the traffic-based stress on bicyclists on a particular route or network, where 1 is low-stress and 5 is not appropriate for bicycles.
Applicability to each planning scenario
TSP HIGHLTS 2 is generally used as the target that appeals to the majority of potential bicyclists, and at the TSP level, an LTS network analysis can assess the bicycle route network and identify gaps between LTS 2 facilities.
Corridor Planning MED LTS can be used in corridor planning to assess the performance of different alternatives and the presence of a low-stress route through and across the corridor.
Plan Amendment LOWLTS could be used to assess the adequacy of the system in evaluating a plan amendment and its potential transportation investments to address the system adequacy for bikes or cars. Some investments that would improve v/c for autos may also increase stress levels for bicycles.
Development Review LOW
LTS can be used at the development review level, although it does not measure volumes, and therefore would not assess a new development’s impact on the LTS of a particular route unless used to assess infrastructure or physical changes. Using LTS in conjunction with other measures for autos and pedestrians to assess infrastructure investments would be applicable to development review.
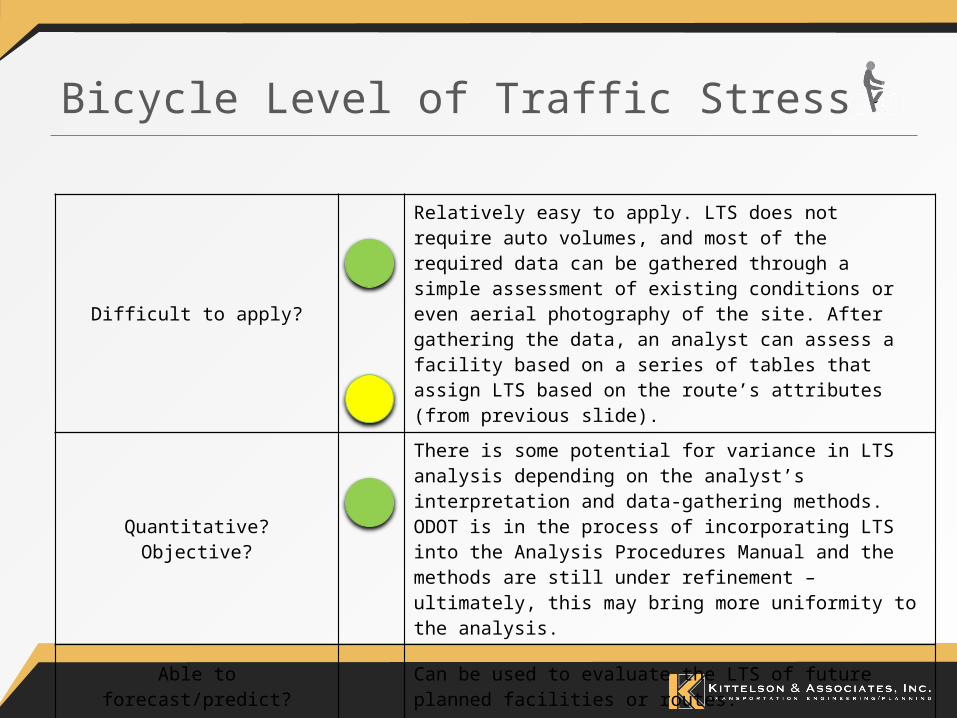
Bicycle Level of Traffic Stress
Difficult to apply?
Relatively easy to apply. LTS does not require auto volumes, and most of the required data can be gathered through a simple assessment of existing conditions or even aerial photography of the site. After gathering the data, an analyst can assess a facility based on a series of tables that assign LTS based on the route’s attributes (from previous slide).
Quantitative? Objective?
There is some potential for variance in LTS analysis depending on the analyst’s interpretation and data-gathering methods. ODOT is in the process of incorporating LTS into the Analysis Procedures Manual and the methods are still under refinement – ultimately, this may bring more uniformity to the analysis.
Able to forecast/predict? Can be used to evaluate the LTS of future planned facilities or routes.
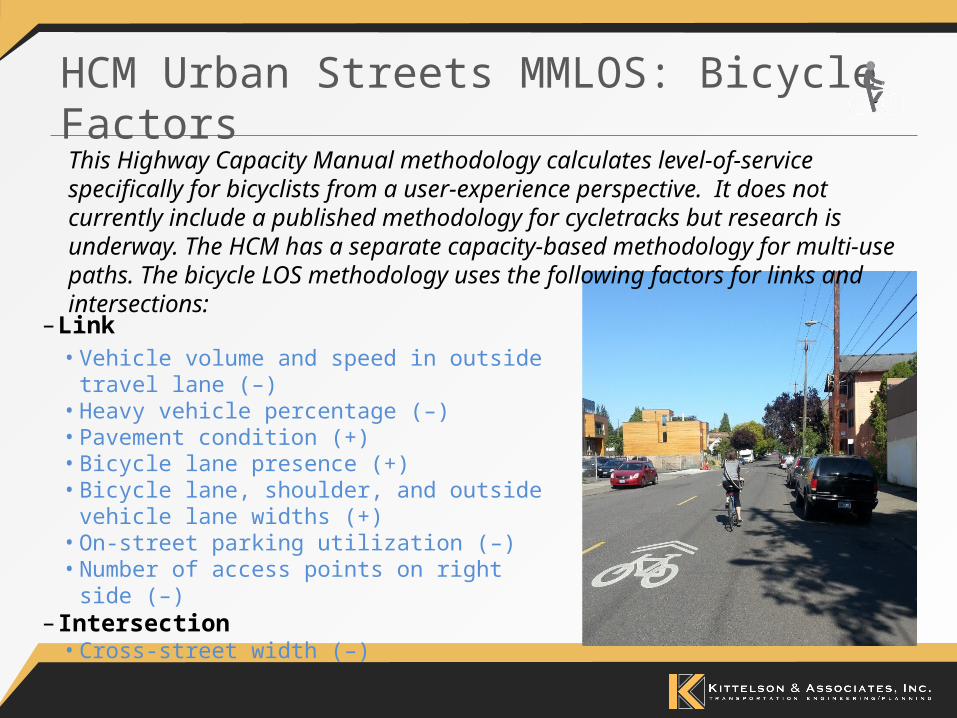
HCM Urban Streets MMLOS: Bicycle Factors
– Link• Vehicle volume and speed in outside travel
lane (–)• Heavy vehicle percentage (–)• Pavement condition (+)• Bicycle lane presence (+)• Bicycle lane, shoulder, and outside vehicle
lane widths (+)• On-street parking utilization (–)• Number of access points on right side (–)
– Intersection• Cross-street width (–)
This Highway Capacity Manual methodology calculates level-of-service specifically for bicyclists from a user-experience perspective. It does not currently include a published methodology for cycletracks but research is underway. The HCM has a separate capacity-based methodology for multi-use paths. The bicycle LOS methodology uses the following factors for links and intersections:

HCM Urban Streets MMLOS: Pedestrian Factors
– Link• Sidewalk presence and clear width (+)• Vehicle volume and speed in outside travel lane (–)• Bicycle lane, shoulder, and outside vehicle lane
widths (+)• Buffer presence and width (+)• On-street parking utilization (+)
– Intersection• Permitted left turn, right-turn-on-red volumes (–)• Cross-street motor vehicle volumes and speeds (–)• Crossing length (–)• Average pedestrian delay (–)• Right-turn channelizing island presence (+)
This Highway Capacity Manual methodology calculates level-of-service specifically for pedestrians from a user perspective. The HCM has a separate capacity-based methodology for multi-use paths. MMLOS for pedestrians uses the following factors for links and intersections:
HCM Urban Streets Multimodal Level of Service (MMLOS)
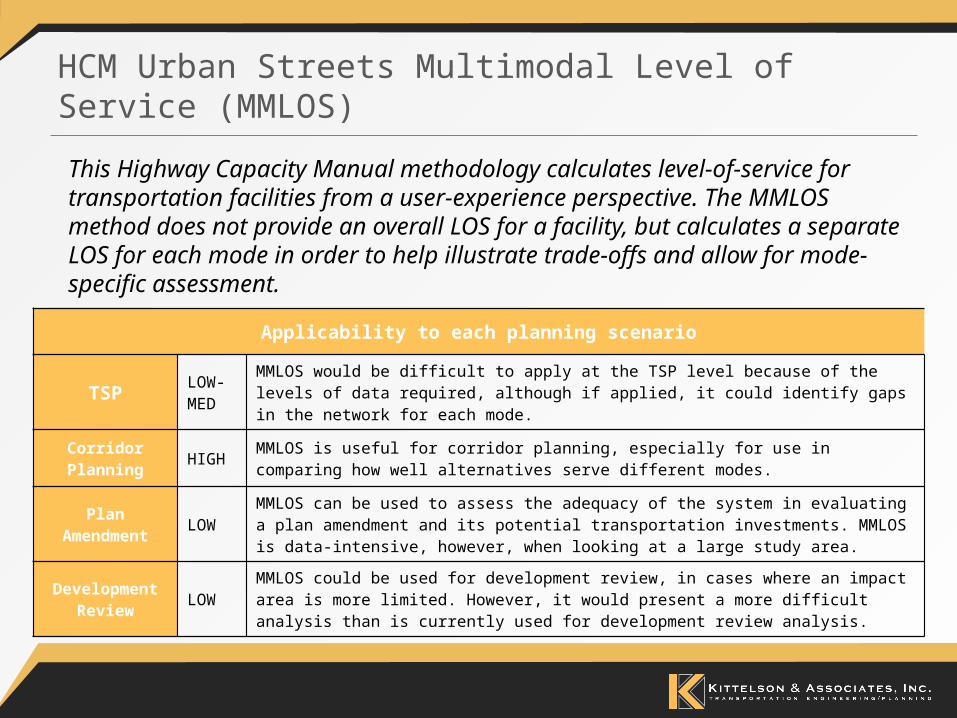
This Highway Capacity Manual methodology calculates level-of-service for transportation facilities from a user-experience perspective. The MMLOS method does not provide an overall LOS for a facility, but calculates a separate LOS for each mode in order to help illustrate trade-offs and allow for mode-specific assessment.
Applicability to each planning scenario
TSP LOW-MED
MMLOS would be difficult to apply at the TSP level because of the levels of data required, although if applied, it could identify gaps in the network for each mode.
Corridor Planning HIGH MMLOS is useful for corridor planning, especially for use in comparing how well alternatives serve different modes.
Plan Amendment LOWMMLOS can be used to assess the adequacy of the system in evaluating a plan amendment and its potential transportation investments. MMLOS is data-intensive, however, when looking at a large study area.
Development Review LOW
MMLOS could be used for development review, in cases where an impact area is more limited. However, it would present a more difficult analysis than is currently used for development review analysis.
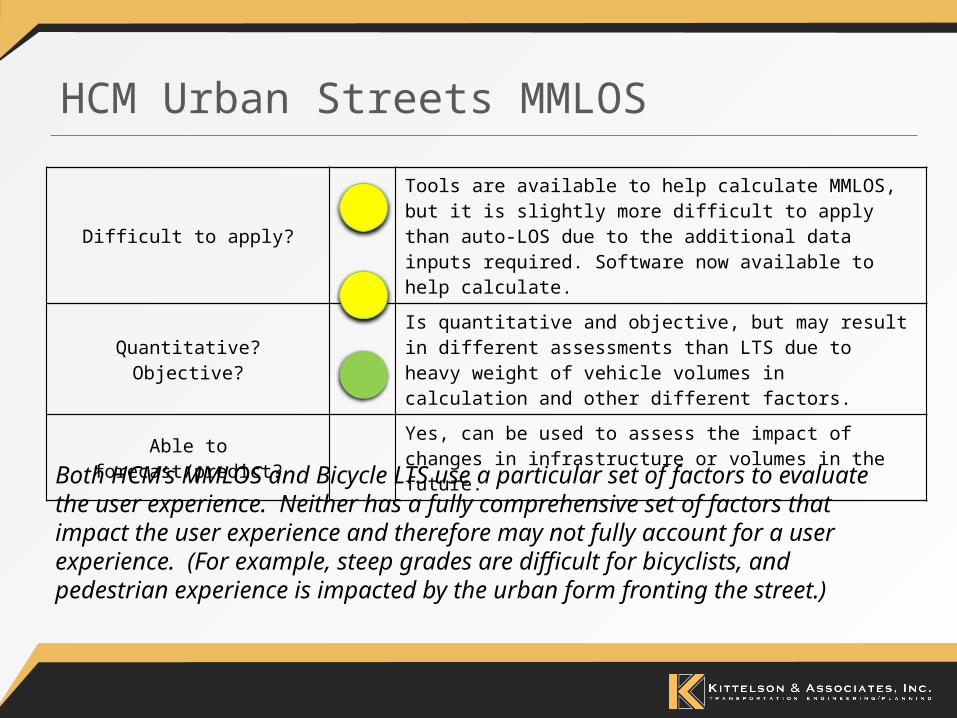
HCM Urban Streets MMLOS
Difficult to apply?Tools are available to help calculate MMLOS, but it is slightly more difficult to apply than auto-LOS due to the additional data inputs required. Software now available to help calculate.
Quantitative? Objective?Is quantitative and objective, but may result in different assessments than LTS due to heavy weight of vehicle volumes in calculation and other different factors.
Able to forecast/predict? Yes, can be used to assess the impact of changes in infrastructure or volumes in the future.
Both HCM’s MMLOS and Bicycle LTS use a particular set of factors to evaluate the user experience. Neither has a fully comprehensive set of factors that impact the user experience and therefore may not fully account for a user experience. (For example, steep grades are difficult for bicyclists, and pedestrian experience is impacted by the urban form fronting the street.)
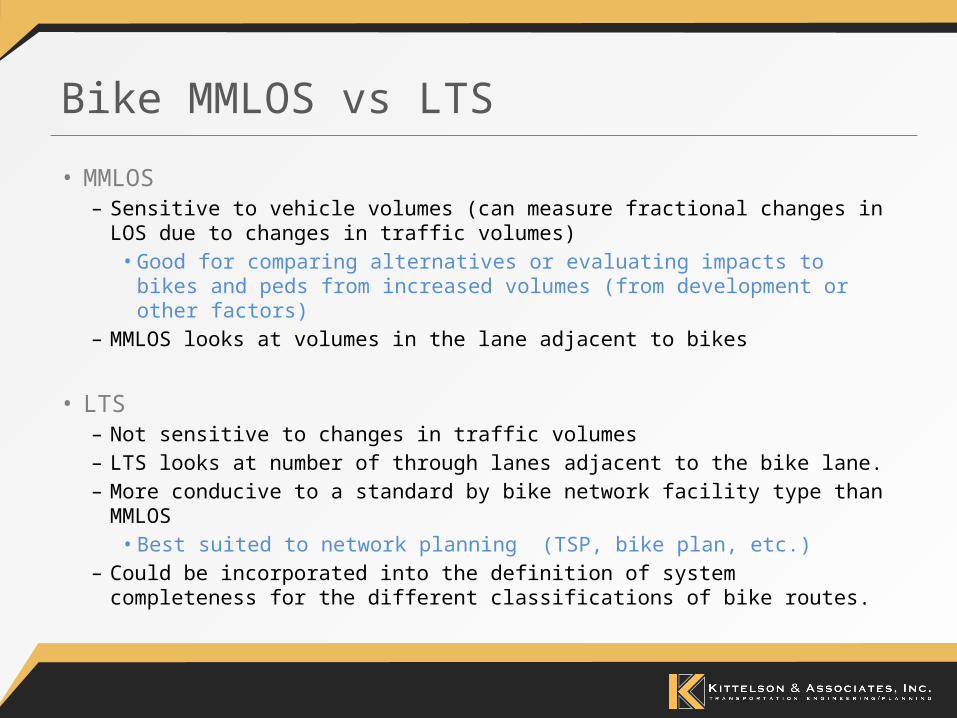
Bike MMLOS vs LTS
• MMLOS – Sensitive to vehicle volumes (can measure fractional changes in LOS due to
changes in traffic volumes)• Good for comparing alternatives or evaluating impacts to bikes and
peds from increased volumes (from development or other factors) – MMLOS looks at volumes in the lane adjacent to bikes
• LTS – Not sensitive to changes in traffic volumes– LTS looks at number of through lanes adjacent to the bike lane. – More conducive to a standard by bike network facility type than MMLOS
• Best suited to network planning (TSP, bike plan, etc.)– Could be incorporated into the definition of system completeness for the
different classifications of bike routes.

Questions?
• For more information contact
Susan Wright, PEKittelson & Associates, [email protected](503)228-5230


![WELCOME [dot.nebraska.gov] · Prioritization Selection. Project Prioritization Process 11. Prioritizing Transportation Investments 12. The Build Nebraska Act Projects have been selected](https://img.pdfslide.us/doc/110x75/5f7c9fe96f8ee0681617bed7/welcome-dot-prioritization-selection-project-prioritization-process-11-prioritizing.jpg)