Embed Size (px)
Citation preview
Edwin H. Sutanudjajaa, Rens van Beeka, Karen G. Villholthb, Aditya Soodc, Tingju Zhud
a Faculty of Geosciences, Utrecht Univ., The Netherlandsb IWMI, South Africa
c IWMI, Sri Lankad IFPRI, Washington DC
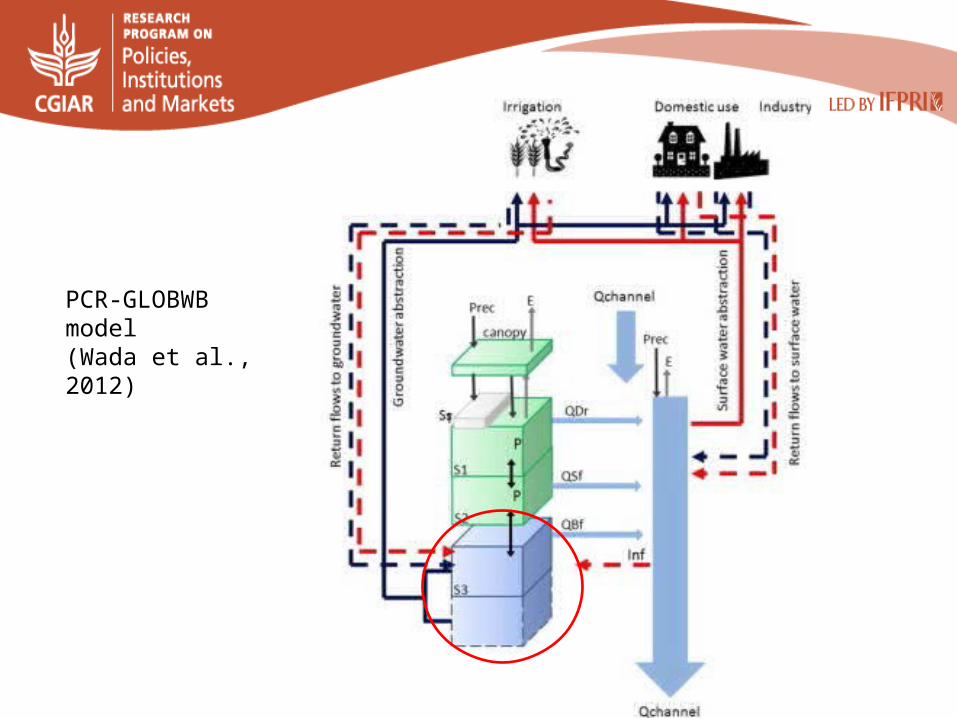
Progress and challenges in modelling globalgroundwater depletion - experience with
PCR-GLOBWB
25th May, 2015
1. How are constraints in groundwater availability and access influencing global groundwater depletion?
2. How is groundwater depletion influencing global food production?
3. How can better groundwater management improve food security?
Objective/Research questions
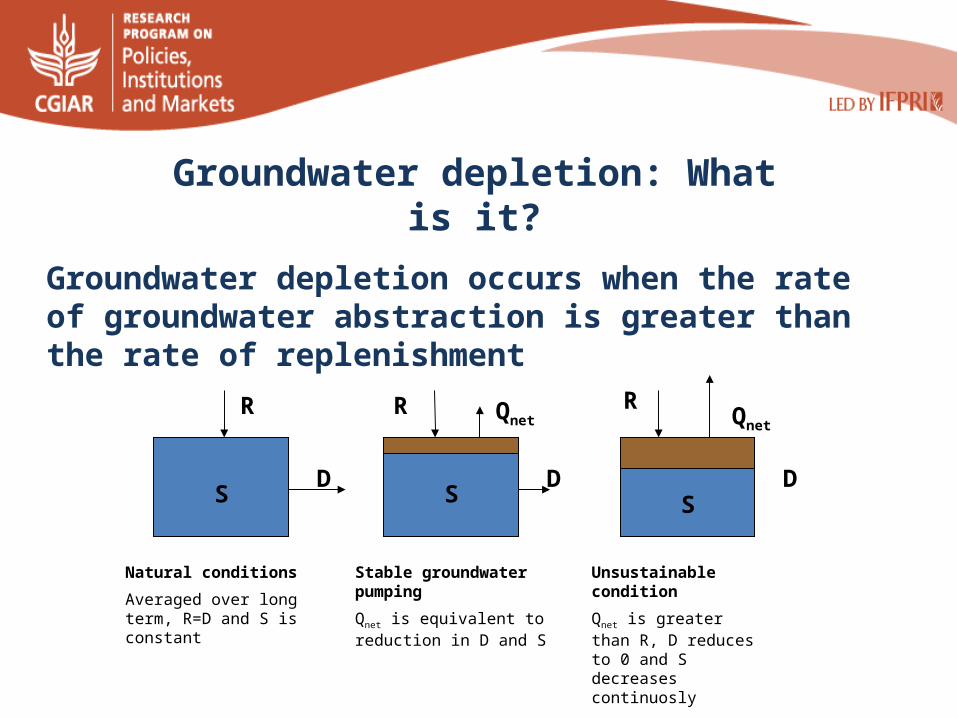
Groundwater depletion occurs when the rate of groundwater abstraction is greater than the rate of replenishment
Groundwater depletion: What is it?
S
R
D
Natural conditions
Averaged over long term, R=D and S is constant
S
R
D
Stable groundwater pumping
Qnet is equivalent to reduction in D and S
Qnet
S
R
D
Unsustainable condition
Qnet is greater than R, D reduces to 0 and S decreases continuosly
Qnet

19601963
19661969
19721975
19781981
19841987
19901993
19961999
0
50,000
100,000
150,000
200,000
250,000
300,000
Mm
3//y
ear
Total groundwater depletion
Source: Wada et al., 2012
Results from the PCR-GLOBWB model
Depletion = Abstraction - Recharge
Source:Shah et al., 2007
Gro
undw
ater
with
draw
al (c
ubic
km
per
yea
r)
in selected countries
at global scale
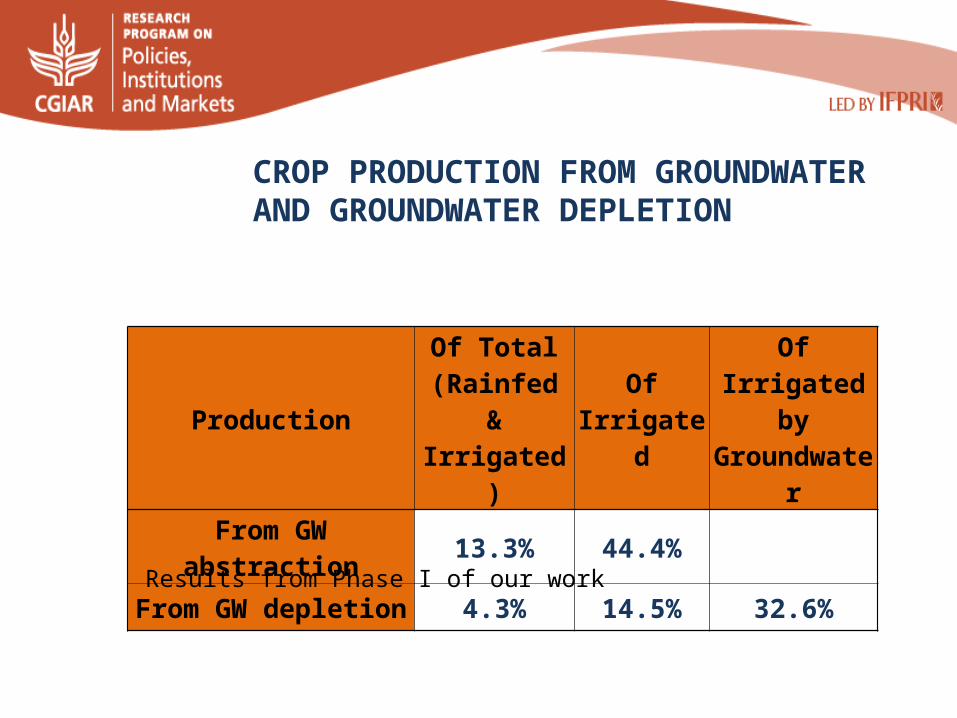
ProductionOf Total
(Rainfed & Irrigated)
Of Irrigated Of Irrigated by Groundwater
From GW abstraction 13.3% 44.4%
From GW depletion 4.3% 14.5% 32.6%
CROP PRODUCTION FROM GROUNDWATER AND GROUNDWATER DEPLETION
Results from Phase I of our work
1. Non-renewable GW is implicitly assumed to be unlimited (same as in IGHM)
2. GW pumping is not constrained by socio-economic and technical factors.
Shortcomings of PCR-GLOBWB model
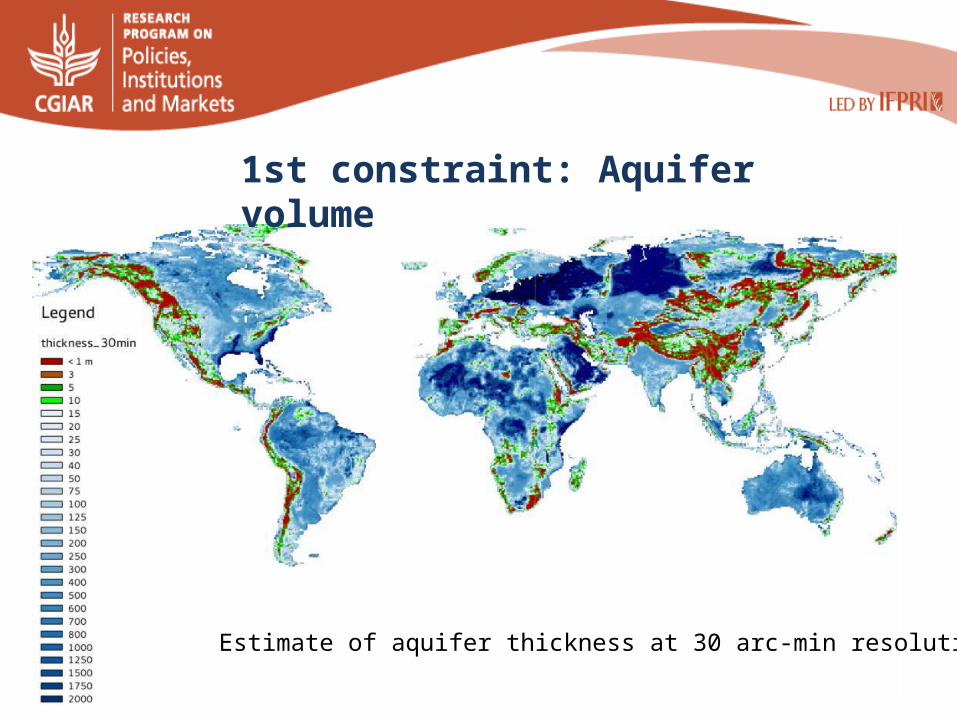
1st constraint: Aquifer volume
Estimate of aquifer thickness at 30 arc-min resolution
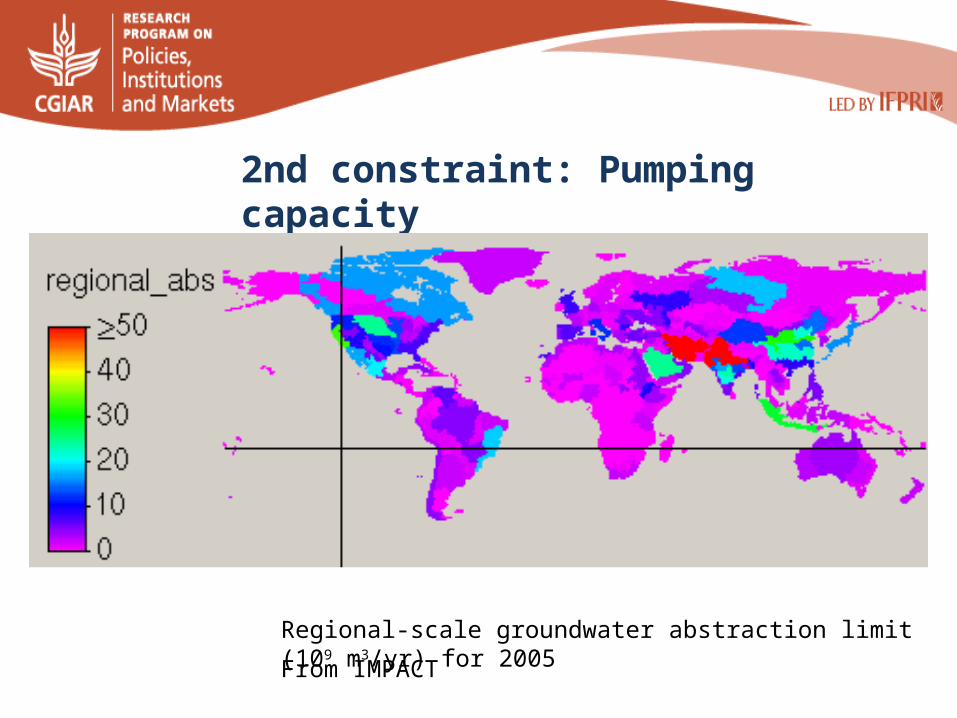
2nd constraint: Pumping capacity
Regional-scale groundwater abstraction limit (109 m3/yr) for 2005
From IMPACT
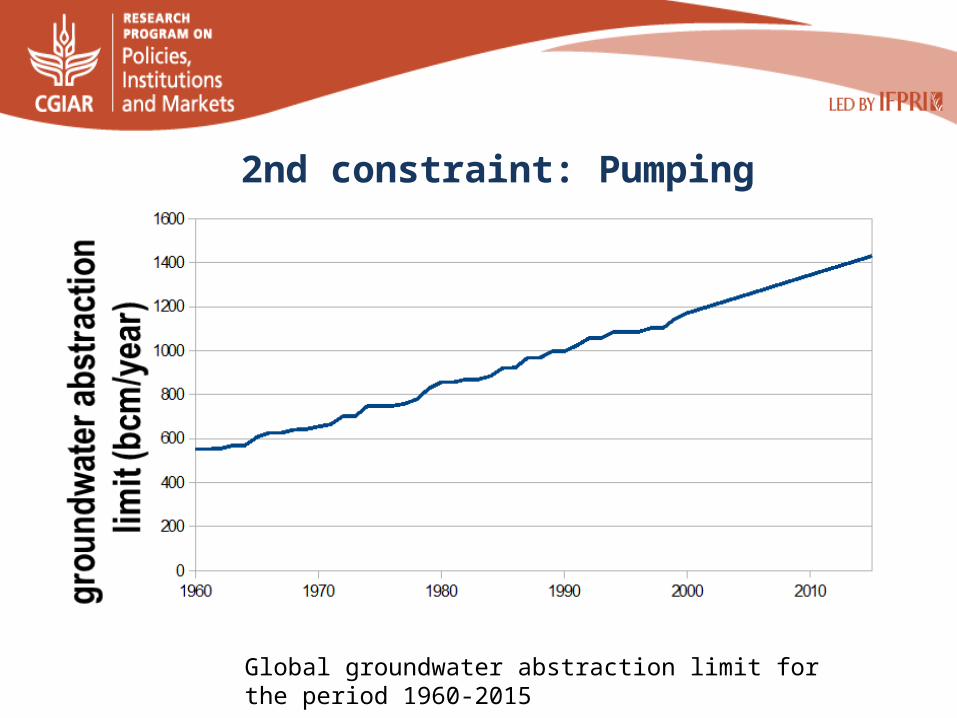
2nd constraint: Pumping capacity
Global groundwater abstraction limit for the period 1960-2015
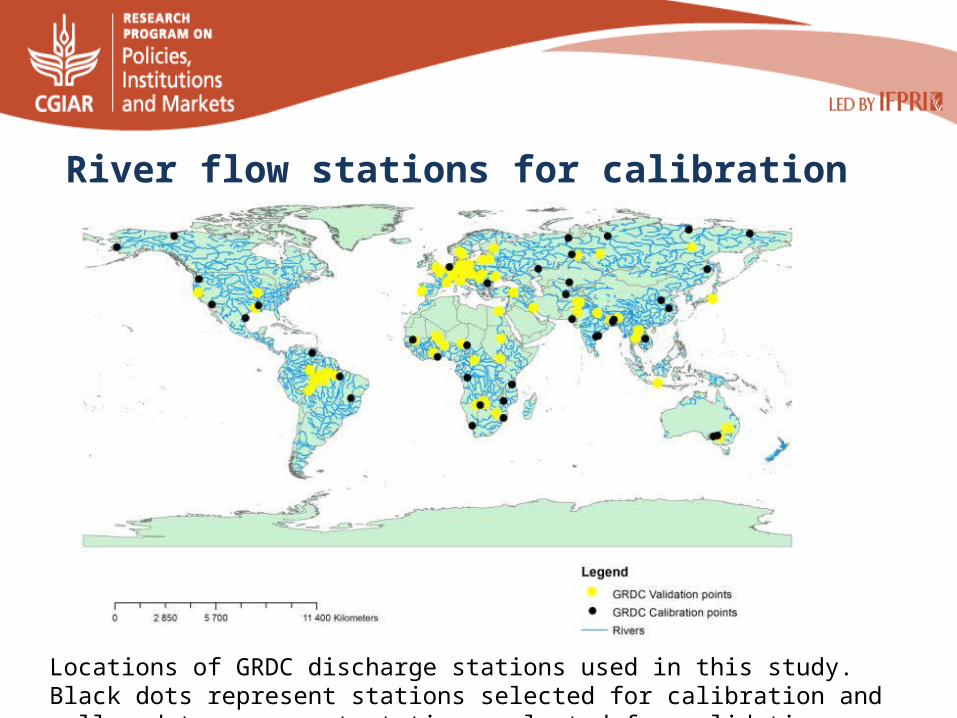
River flow stations for calibration and validation
Locations of GRDC discharge stations used in this study. Black dots represent stations selected for calibration and yellow dots represent stations selected for validation.
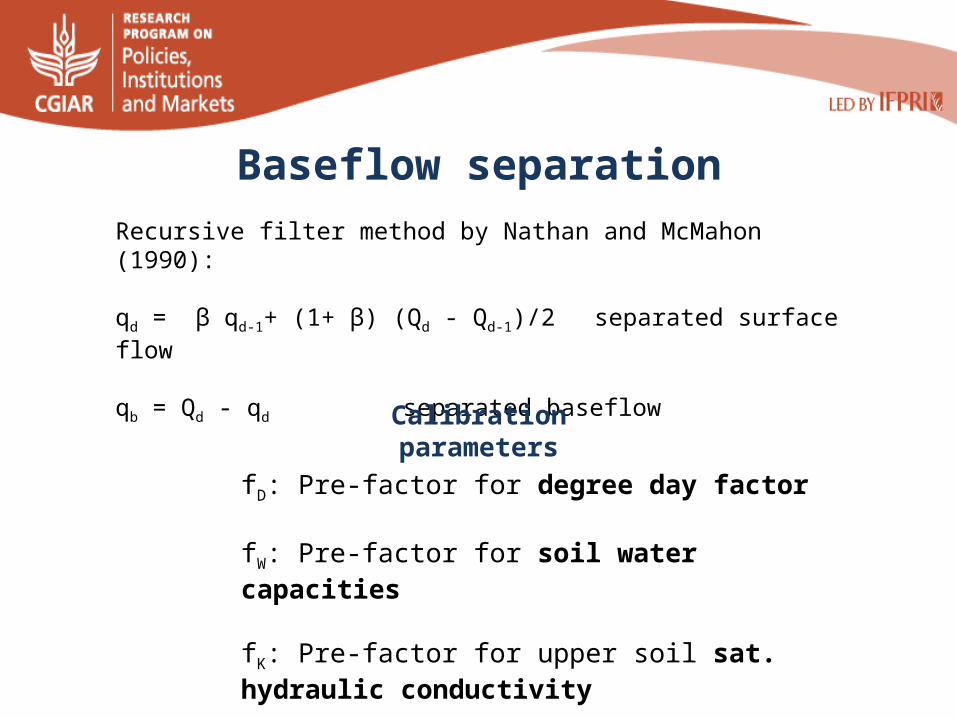
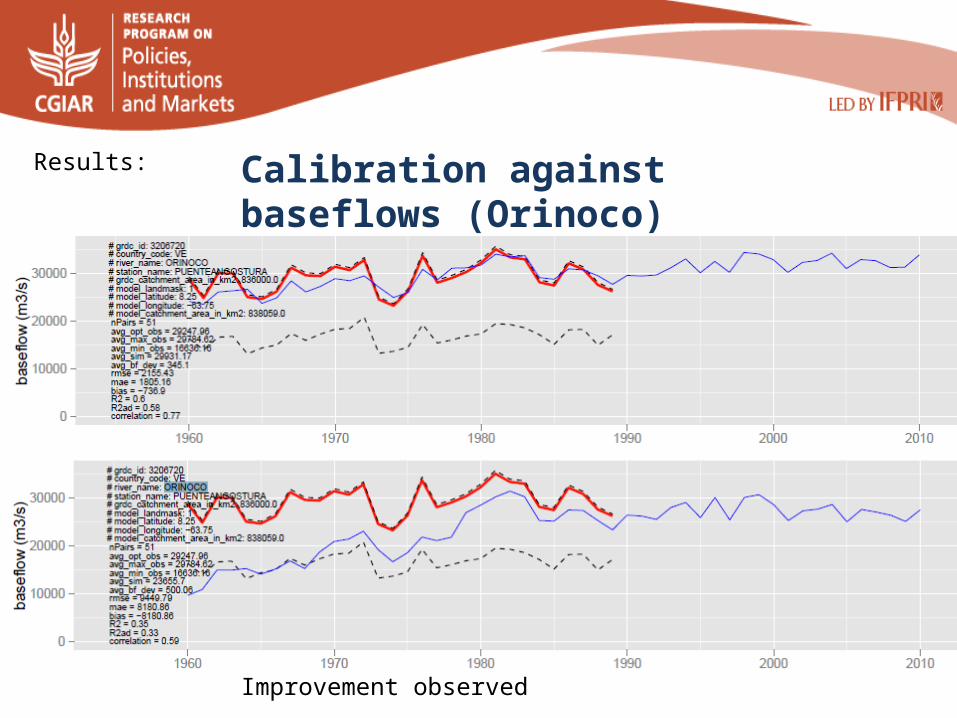
Recursive filter method by Nathan and McMahon (1990):
qd = β qd-1+ (1+ β) (Qd - Qd-1)/2 separated surface flow
qb = Qd - qd separated baseflow
Baseflow separation
Calibration parameters
fD: Pre-factor for degree day factor
fW: Pre-factor for soil water capacities
fK: Pre-factor for upper soil sat. hydraulic conductivity
fJ: Pre-factor for groundwater recession coefficient

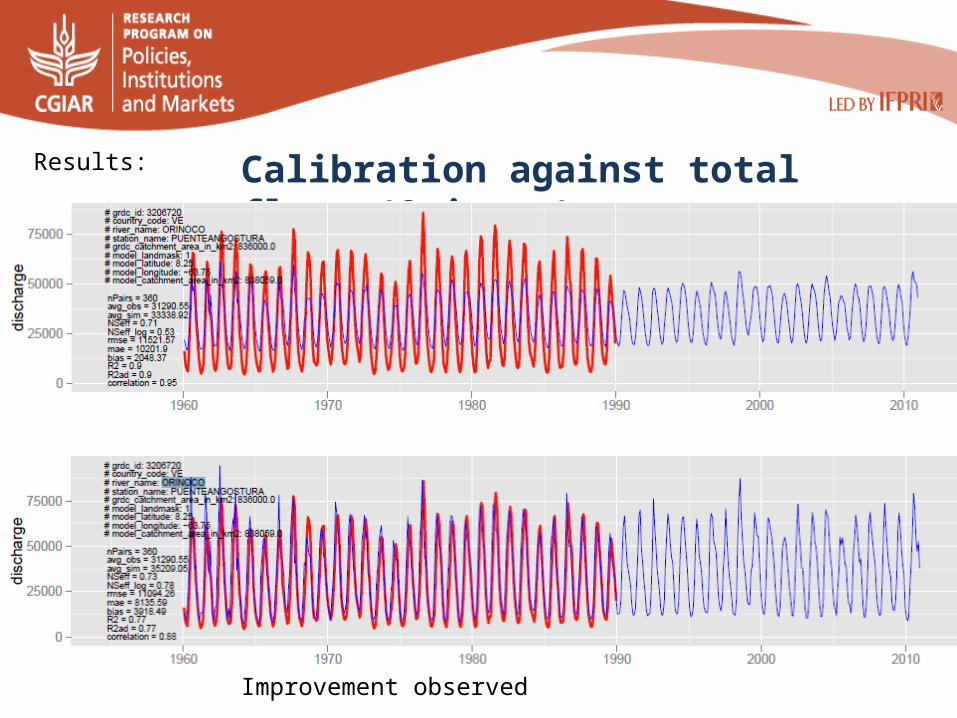
Calibration against total flows (Congo)
No improvement observed
Results: Calibration against total flows (Congo)

1. Run without constraints2. Run with limited non-renewable GW3. Run with limited non-renewable GW
and limited pumping capacity4. Run 3., but calibrating parameters
Approach to simulations
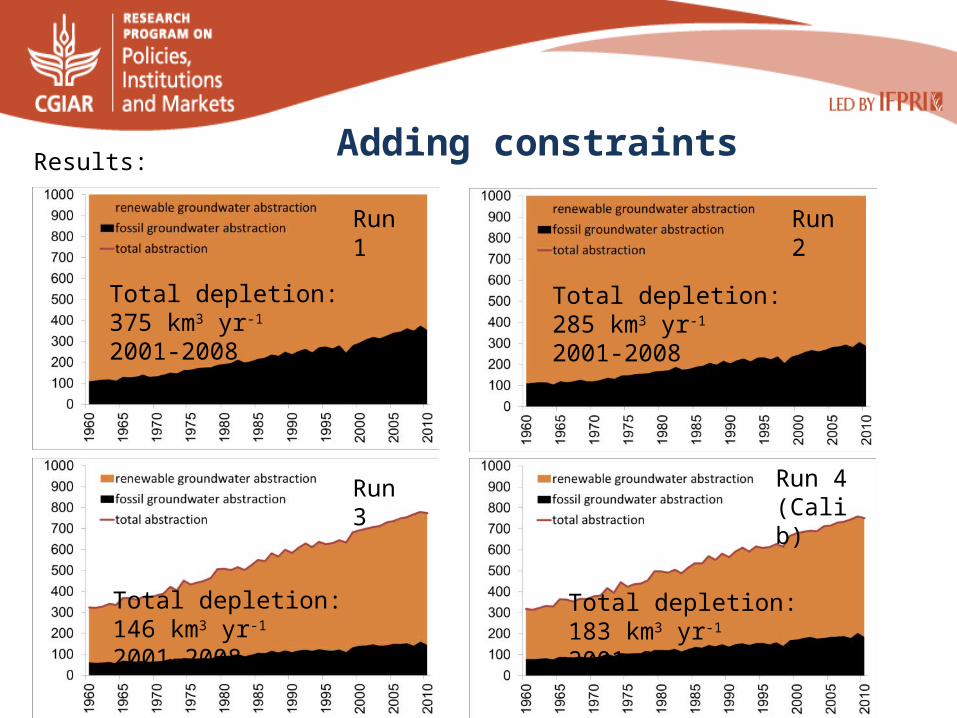
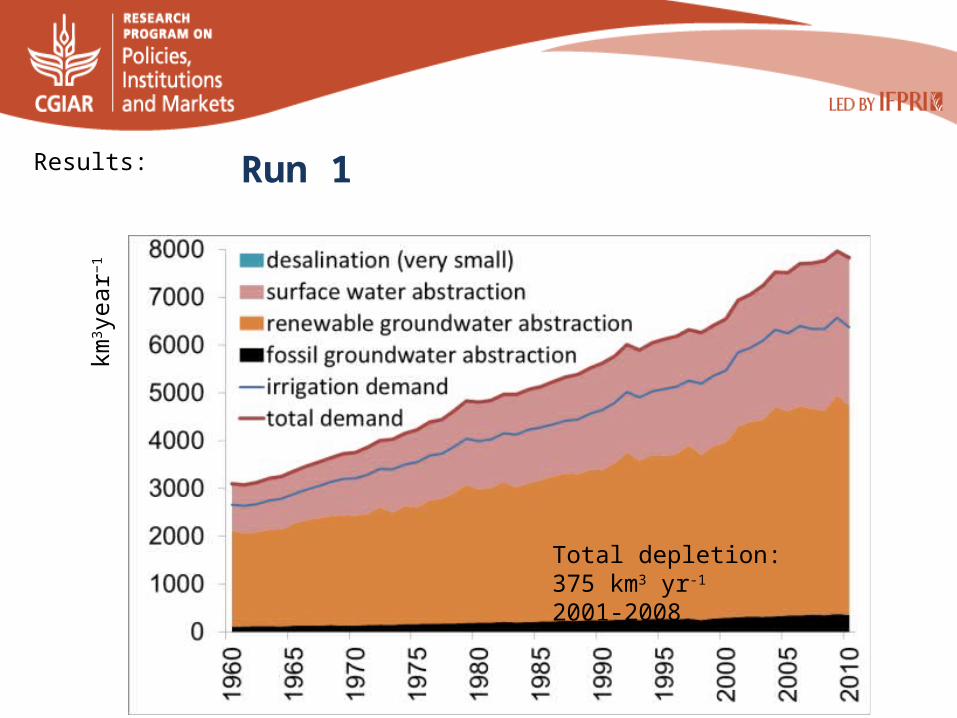
Adding constraintsResults:
km3 y
ear−1
Run 1 Run 2
Run 3
Total depletion: 285 km3 yr-1
2001-2008 Total depletion: 375 km3 yr-1
2001-2008
Total depletion: 146 km3 yr-1
2001-2008
Run 4(Calib)
Total depletion: 183 km3 yr-1
2001-2008
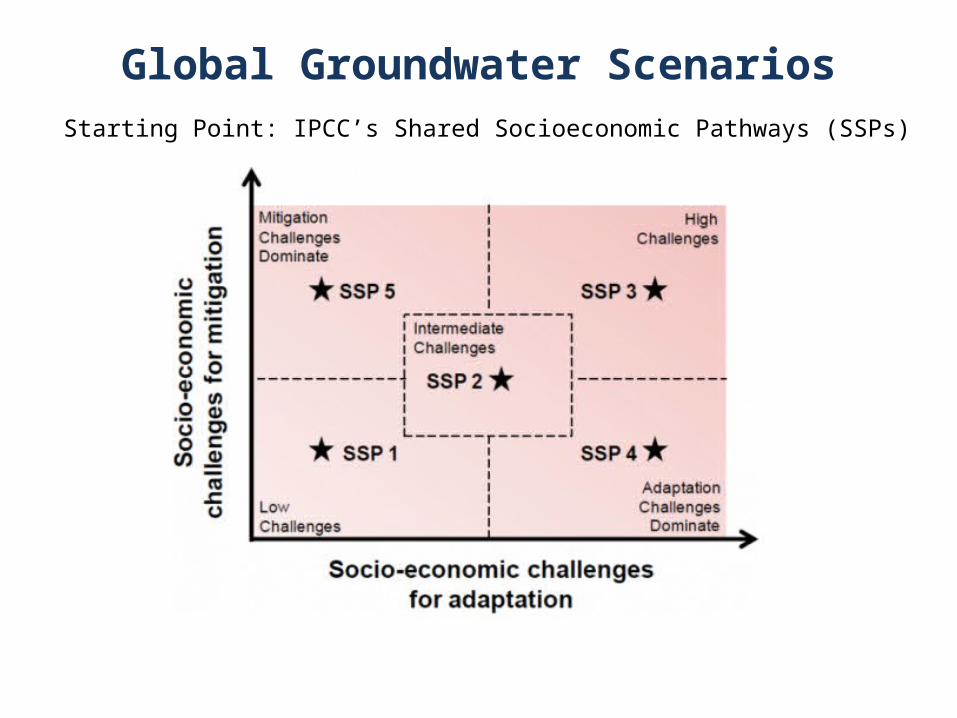
Global Groundwater ScenariosStarting Point: IPCC’s Shared Socioeconomic Pathways (SSPs)
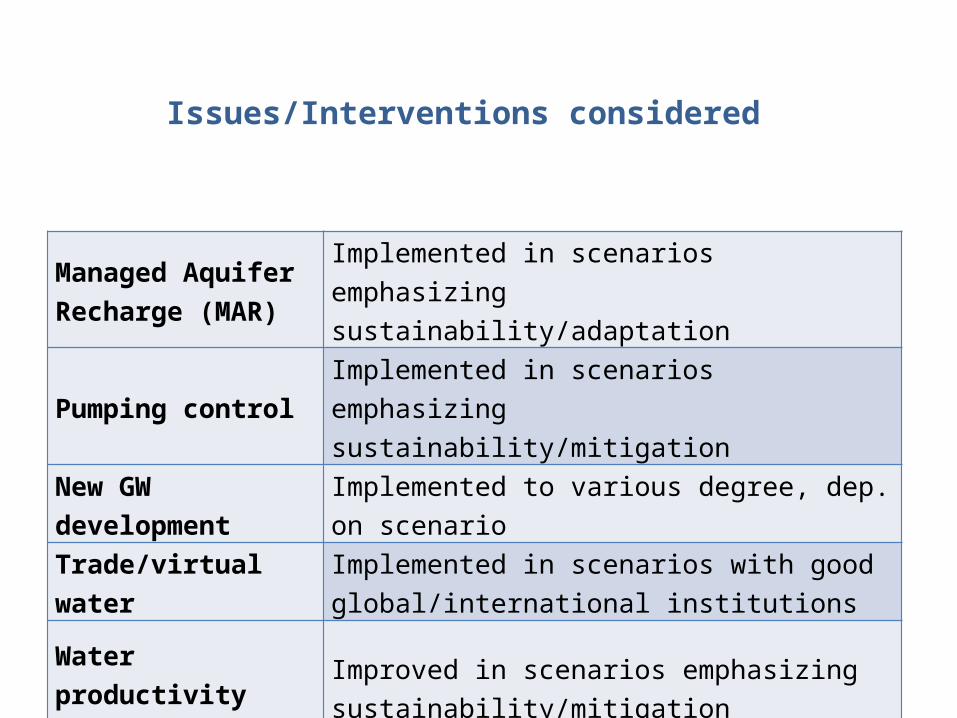
Managed Aquifer Recharge (MAR)
Implemented in scenarios emphasizing sustainability/adaptation
Pumping control Implemented in scenarios emphasizing sustainability/mitigation
New GW developmentImplemented to various degree, dep. on scenario
Trade/virtual water Implemented in scenarios with good global/international institutions
Water productivity Improved in scenarios emphasizing sustainability/mitigation
Issues/Interventions considered

SSP5 Pumping in depleted regions is not controlled MAR/UTFI is implemented on a large scale,
mostly to control extreme flooding Balanced new GW dev. in potential regions to
adapt to CC Trade/virtuous virtual water flows
constrained by dominant economic development imperatives
Water productivity from GW (and SW) not improved
SSP3 (worst case) Pumping in depleted regions is not controlled MAR is not practised Unbalanced new GW dev. in potential
regions Trade/virtuous virtual water flows
constrained by dominant self-sufficiency strategies
Water productivity from GW (and SW) not improved
SSP1 Pumping in depleted regions is controlled
through regulations and incentive-based methods
MAR is implemented on a large scale Balanced new GW dev. in potential regions Trade is deliberately used to control GW
depletion (virtuous virtual water flows) Water productivity from GW (and SW)
improved
SSP4 Pumping in depleted regions is controlled
through effective energy policies MAR is not implemented Unbalanced/unequal new GW dev. in
potential regions, e.g. for biofuels Trade is deliberately used to control GW
depletion (virtuous virtual water flows), but not benefitting the smallholders
Water productivity from GW (and SW) improved to save energy in commercial farming
Scenario Storyline

1. Availability and access constraints to GW are critical to consider in future food security scenarios
2. Adding constraints and calibration improved the model’s handling of groundwater.
3. This compares well to previous estimates (145+/-39 km3 yr-1, Konikow (2011)).
4. Once included in IMPACT, global scenarios for different SSPs will be created and analyzed
5. Focus on country and regional level studies.
Conclusions


![[Day 2] Center Presentation: IWMI](https://img.pdfslide.us/doc/110x75/5552d096b4c90581158b51ff/day-2-center-presentation-iwmi.jpg)