Embed Size (px)
Citation preview
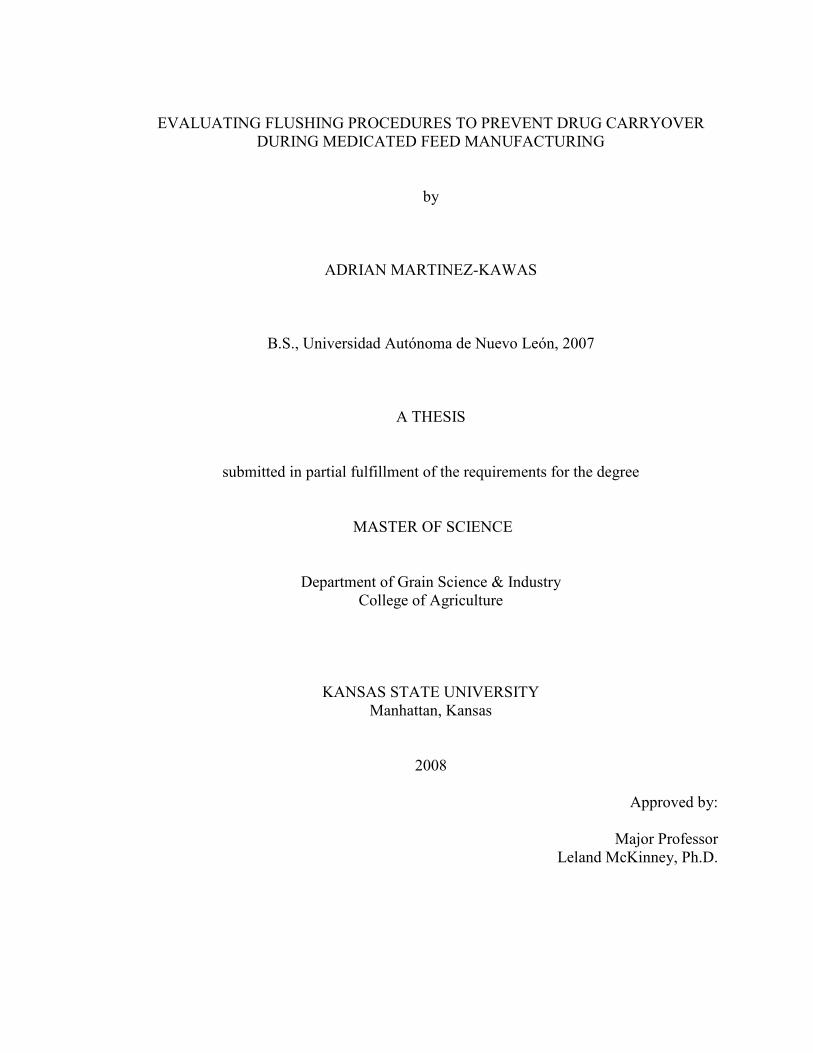
EVALUATING FLUSHING PROCEDURES TO PREVENT DRUG CARRYOVER
DURING MEDICATED FEED MANUFACTURING
by
ADRIAN MARTINEZ-KAWAS
B.S., Universidad Autónoma de Nuevo León, 2007
A THESIS
submitted in partial fulfillment of the requirements for the degree
MASTER OF SCIENCE
Department of Grain Science & Industry
College of Agriculture
KANSAS STATE UNIVERSITY
Manhattan, Kansas
2008
Approved by:
Major Professor
Leland McKinney, Ph.D.
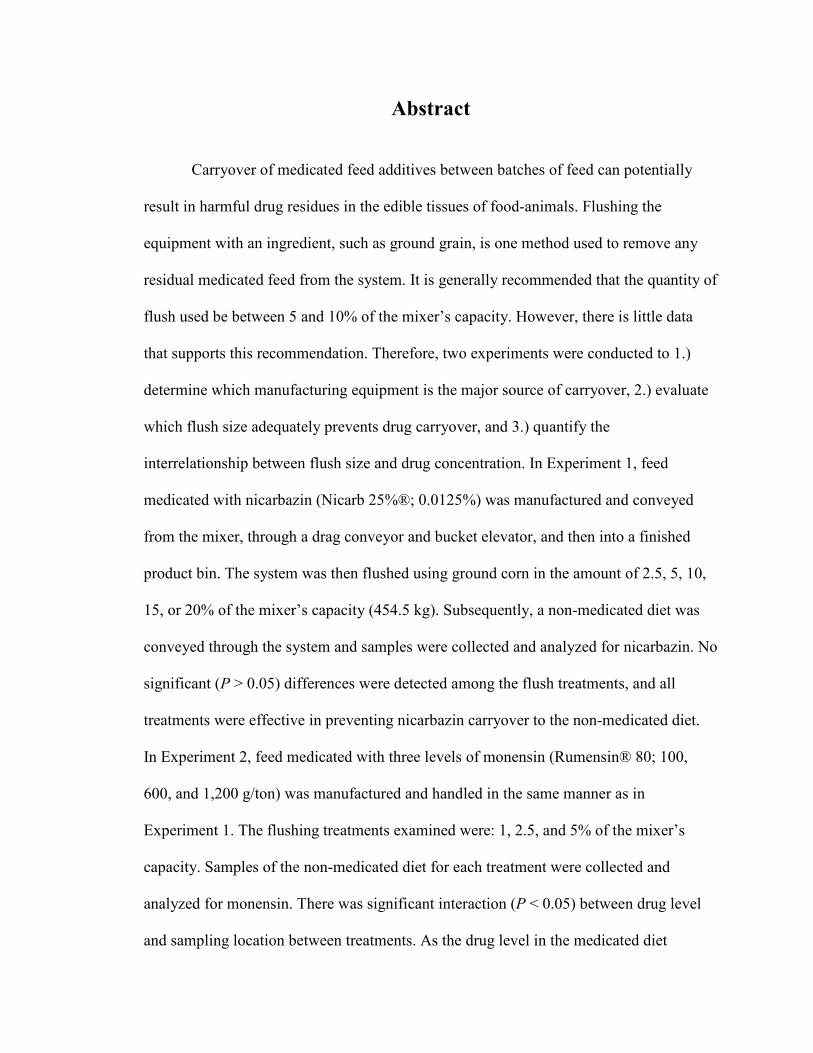
Abstract
Carryover of medicated feed additives between batches of feed can potentially
result in harmful drug residues in the edible tissues of food-animals. Flushing the
equipment with an ingredient, such as ground grain, is one method used to remove any
residual medicated feed from the system. It is generally recommended that the quantity of
flush used be between 5 and 10% of the mixer’s capacity. However, there is little data
that supports this recommendation. Therefore, two experiments were conducted to 1.)
determine which manufacturing equipment is the major source of carryover, 2.) evaluate
which flush size adequately prevents drug carryover, and 3.) quantify the
interrelationship between flush size and drug concentration. In Experiment 1, feed
medicated with nicarbazin (Nicarb 25%®; 0.0125%) was manufactured and conveyed
from the mixer, through a drag conveyor and bucket elevator, and then into a finished
product bin. The system was then flushed using ground corn in the amount of 2.5, 5, 10,
15, or 20% of the mixer’s capacity (454.5 kg). Subsequently, a non-medicated diet was
conveyed through the system and samples were collected and analyzed for nicarbazin. No
significant (P > 0.05) differences were detected among the flush treatments, and all
treatments were effective in preventing nicarbazin carryover to the non-medicated diet.
In Experiment 2, feed medicated with three levels of monensin (Rumensin® 80; 100,
600, and 1,200 g/ton) was manufactured and handled in the same manner as in
Experiment 1. The flushing treatments examined were: 1, 2.5, and 5% of the mixer’s
capacity. Samples of the non-medicated diet for each treatment were collected and
analyzed for monensin. There was significant interaction (P < 0.05) between drug level
and sampling location between treatments. As the drug level in the medicated diet

increased, higher concentrations of monensin were detected in the non-medicated diet.
Collectively, these studies demonstrate that a 2.5%, even a 1% flush size, is effective in
preventing carryover of medicated feed additives. It was also demonstrated that the
bucket elevator and finished product bin were the major sources of drug carryover in this
particular feed manufacturing system.
iv
Table of Contents
List of Figures ................................................................................................................................ vi
List of Tables ................................................................................................................................. vii
Dedication .................................................................................................................................... viii
CHAPTER 1 - Introduction............................................................................................................. 1
Overview of Food Safety ............................................................................................................ 1
Current Good Manufacturing Practice Regulations – Feed Industry .......................................... 2
Drug Carryover during Medicated Feed Manufacturing ............................................................ 4
Feed Additives and Their Uses ................................................................................................... 6
Nicarbazin ............................................................................................................................... 6
Monensin ................................................................................................................................. 8
The Purpose of Animal Drug Use ............................................................................................. 10
Disease Control and Prevention: Coccidiosis ....................................................................... 10
Growth Promotants: Ionophores ........................................................................................... 12
Research Objectives .................................................................................................................. 13
Thesis Organization .................................................................................................................. 13
References ................................................................................................................................. 17
CHAPTER 2 - Evaluating Flushing Procedures to Prevent Nicarbazin Carryover during
Medicated Feed Manufacturing .................................................................................................... 24
Material and Methods ............................................................................................................... 27
Results and Discussion .............................................................................................................. 31
Conclusions ............................................................................................................................... 34

v
References ................................................................................................................................. 44
CHAPTER 3 - Evaluating Flushing Procedures to Prevent Monensin Carryover during
Medicated Feed Manufacturing .................................................................................................... 47
Materials and Methods .............................................................................................................. 50
Results and Discussion .............................................................................................................. 54
Conclusions ............................................................................................................................... 57
References ................................................................................................................................. 69
vi
List of Figures
Figure 1.1 Chemical structure of the components of nicarbazin................................................... 15
Figure 1.2 Chemical structure of monensin .................................................................................. 16
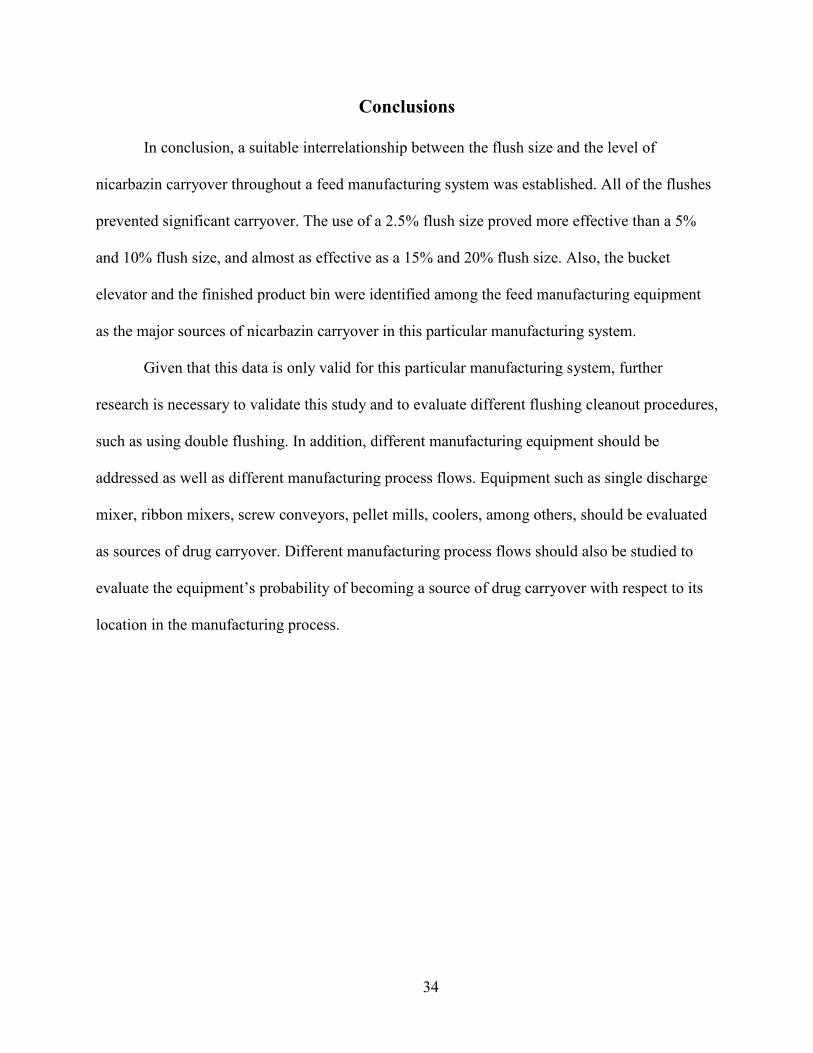
Figure 2.1 Chemical structure of the components of nicarbazin................................................... 35
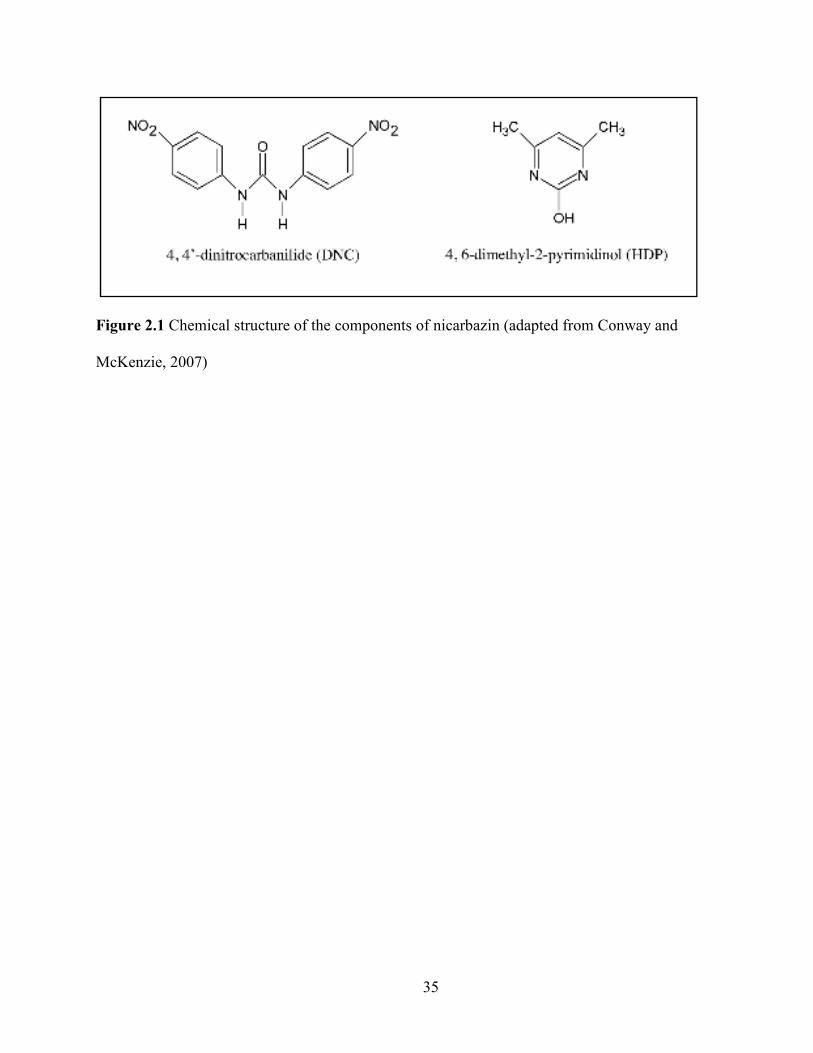
Figure 2.2 Manufacturing flow process used in Experiment 1 ..................................................... 36
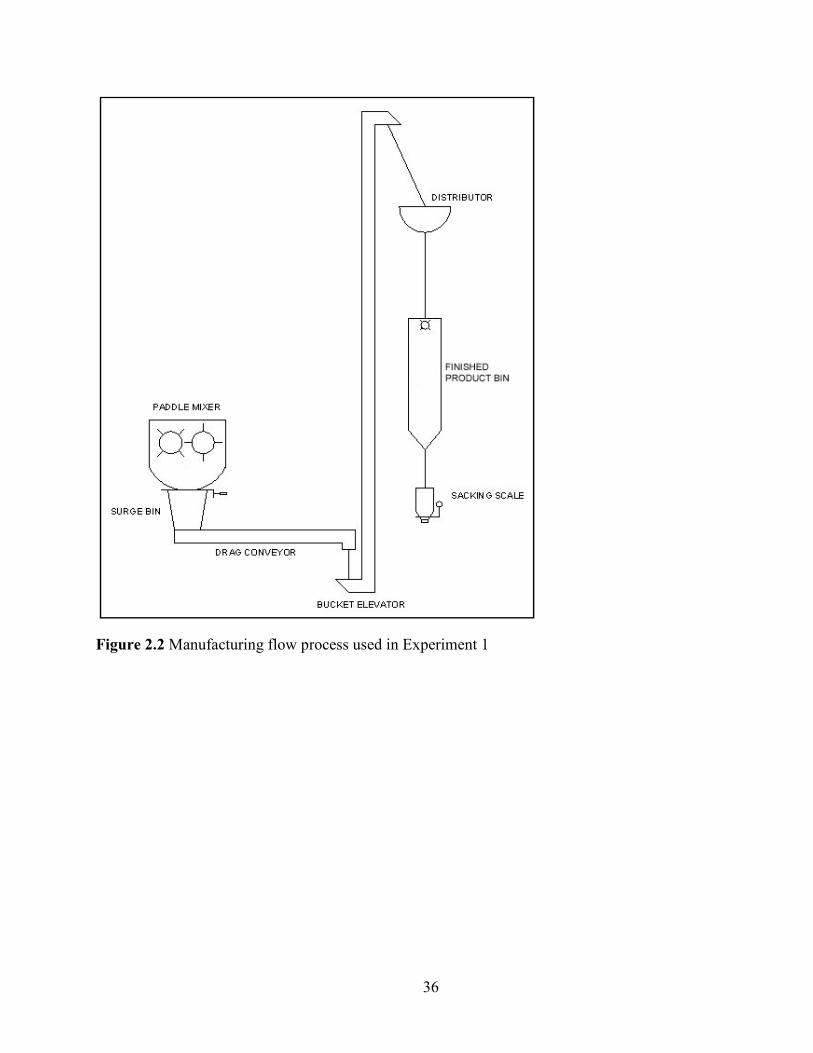
Figure 2.3 Nicarbazin concentrations in medicated diets sampled at the mixer for each flush
treatment ................................................................................................................................ 37
Figure 2.4 Nicarbazin concentrations in the flush material sampled at the finished product bin for
each flush treatment .............................................................................................................. 38
Figure 2.5 Nicarbazin concentrations in the non-medicated diets at different sampling location
for each flush treatment ......................................................................................................... 39
Figure 3.1 Chemical structure of monensin .................................................................................. 59
Figure 3.2 Experiment 2 manufacturing process flow .................................................................. 60
Figure 3.3 Monensin concentrations in the medicated diets sampled at the mixer for each flush
treatment and each formulated Rumensin®80 level ............................................................. 61
Figure 3.4 Monensin concentrations in the flush material sampled at the finished product bin for
each flush treatment and each formulated Rumensin®80 level ............................................ 62
Figure 3.5 Monensin concentrations in the flush material sampled at the finished product bin for
each flush treatment and each formulated Rumensin®80 level ............................................ 63
vii
List of Tables
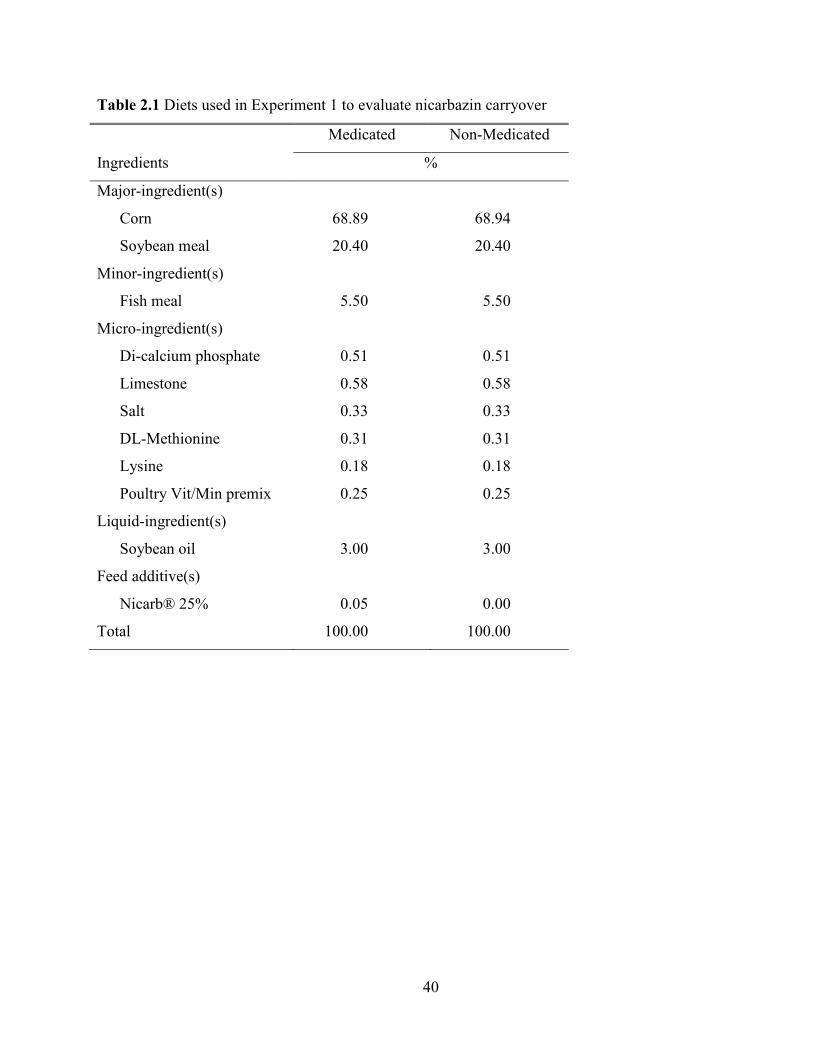
Table 2.1 Diets used in Experiment 1 to evaluate nicarbazin carryover ....................................... 40
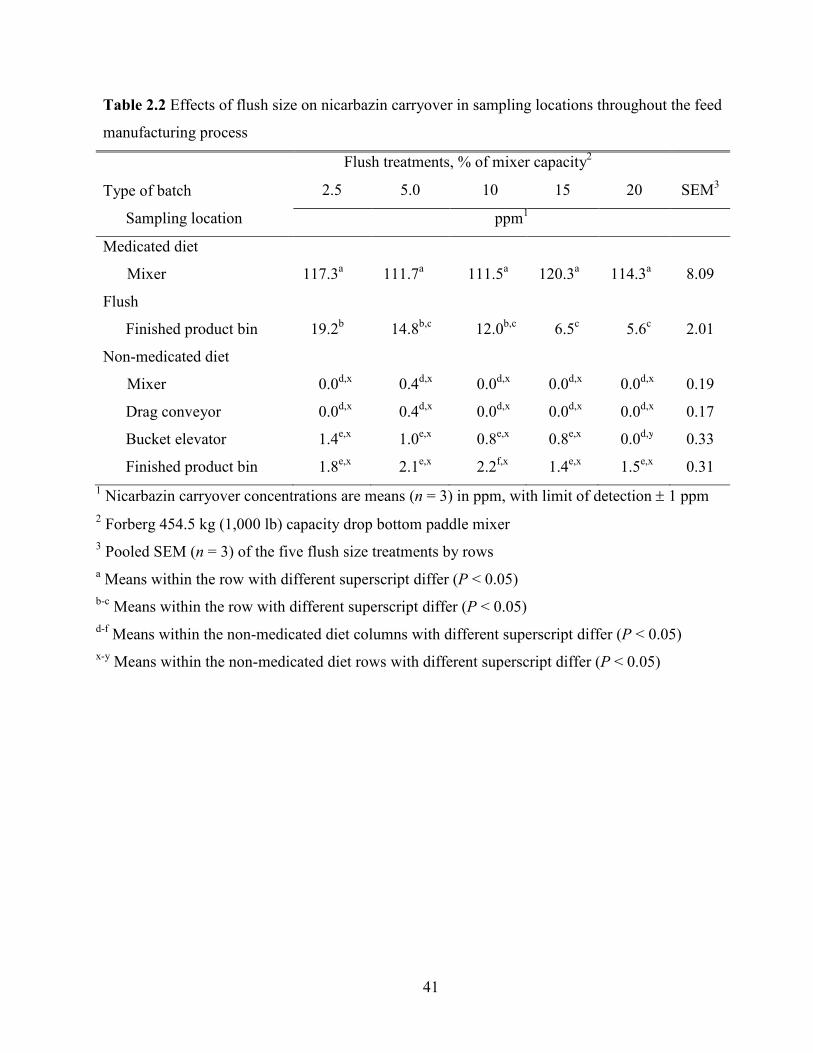
Table 2.2 Effects of flush size on nicarbazin carryover in sampling locations throughout the feed
manufacturing process ........................................................................................................... 41
Table 2.3 Calculated nicarbazin carryover in sampling location throughout the feed
manufacturing process ........................................................................................................... 42
Table 2.4 Pair-wise comparison of sampling location and flush size of non-medicated diet
treatments in Experiment 1 ................................................................................................... 43
Table 3.1 Medicated diets used in Experiment 2 to evaluate monensin carryover ....................... 64
Table 3.2 Non-medicated diet used in Experiment 2 to evaluate monensin carryover ................. 65
Table 3.3 Effects of flush size on monensin carryover in sampling location and formulated
Rumensin® 80 level throughout the feed manufacturing process ........................................ 66
Table 3.4 Calculated monensin carryover in sampling location and formulated Rumensin® 80
level throughout the feed manufacturing process ................................................................. 67
Table 3.5 Pair-wise comparison of sampling location, flush size and formulated Rumensin® 80
level of non-medicated diet treatments in Experiment 2 ....................................................... 68
viii
Dedication
I would like to dedicate this thesis to my parents, Aida and Gustavo, and to my siblings,
Gus and Giga. Mom and Dad: Thank you for everything! You are my pillar of strength! I would
like to express my sincere gratefulness for all your loving support and your constant words of
encouragement. Gus and Giga: You are my best friends! You have always been there to help me,
support me, and motivate me. Thanks for always being there for me! I also want to thank my
uncle Jorge, my mentor. All of this was possible because of your unconditional support. I shall
be forever in your debt. Thank you so much!
1
CHAPTER 1 - Introduction
Overview of Food Safety
In the last decade, there has been a substantial increase in the level of public awareness
and concern relative to the safety and security of food supply. Consequently, the food industry
has placed much emphasis on ensuring food safety. In spite of this increase in awareness,
notable incidents still occur such as the most recent case of melamine contamination in the pet
food industry (FDA, 2008). It has been estimated that pet food manufacturers have voluntarily
recalled more than one hundred brands of dog and cat food across the United States since the
outbreak (FDA, 2007a). This food safety incident also came to be an issue of concern to humans,
since a portion of the pet food produced was used to feed food-producing animals. However, it
was determined that the food-producing animals that were fed melamine contaminated feed
posed a very low risk to human health (FDA, 2007b; USDA, 2007). With incidents like this, the
need to develop outreach programs that disseminate information, guidelines, and risk-assessment
strategies to producers, manufacturers, distributors, as well as consumers becomes a necessity to
prevent contamination of our food supply. The United States’ food supply has become one of the
world’s safest as a result of the implementation of these types of programs and through
continuous monitoring of manufacturing, processing, and distribution facilities. The agencies
that work together to provide a safe food supply in the United States include the United States
Department of Agriculture (USDA), and the Food and Drug Administration (FDA).
The USDA, through the Food Safety and Inspection Service agency (FSIS), is
responsible that all domestic and imported meat, poultry, and processed egg products are safe,

2
properly labeled and packaged accordingly. The USDA accomplishes this by establishing meat
production standards in addition to routine inspections of food-producing animals and processing
facilities. Meat production standards are established for food packaging, plant sanitation, and
thermal processing. Inspections are also routinely performed on food-producing animals before
and after slaughter, and on processing facilities to verify compliance with Sanitation Standard
Operating Procedures (SSOP) regulations.
The FDA, through the Center of Veterinary Medicine (CVM), is responsible for ensuring
quality and safety in foods and animal feeds, regulating the manufacture and distribution of feed
ingredients and complete feeds, as well as assuring the safety and efficacy of animal drugs. This
is accomplished with the evaluation of animal drugs for use in food-producing animals and
through routine inspections of a facility’s compliance with Current Good Manufacturing
Practices (CGMP) regulations. These regulations contain the principles and guidelines for
medicated feed manufacturing and are considered minimum guidelines. Below these minimum
guidelines, products are deemed adulterated.
Current Good Manufacturing Practice Regulations – Feed Industry
The CGMP regulations for food and drugs are published in Title 21 of the Code of
Federal Regulations (CFR). Title 21 consists of three chapters that are regulated by the FDA, the
Drug Enforcement Administration, and the Office of National Drug Control Policy. The CGMP
regulations are found in Parts 110 and 225 of Chapter 1 and are regulated by the FDA. Part 110
applies to the manufacturing, packing, and holding of human food, whereas Part 225 applies to
the manufacturing, packing, and holding of medicated feed. All food and feed manufacturing,
processing, and distribution facilities must comply with CGMP regulations.
3
The legal basis of CGMP compliance for animal drugs is found in the Federal Food,
Drug, and Cosmetic Act (FD&C Act, 2008). It states that if the methods, facilities or controls
used for manufacturing, processing, packing, and holding of a drug (including a drug contained
in a medicated feed) do not comply with CGMP, it would be deemed adulterated. Compliance
with CGMP regulations assures that such drugs meet safety, identity, strength, quality, and purity
requirements.
Depending on the drug sources used to manufacture medicated feed, medicated feed
manufacturers are divided into two groups: those required to register and obtain a license with
the FDA and those not required to be registered nor licensed (FDA-HHS, 2007a). This
determines which section of the CGMP regulations manufacturers must abide by. Licensed
facilities must comply with sections 225.10 through 225.115, whereas non-licensed facilities
must comply with sections 225.120 through 225.202 of the CGMP regulations.
Drugs are divided into two categories – Category I and Category II (FDA-HHS, 2008).
Category I drugs require no withdrawal period at the lowest use level in each approved species,
and Category II drugs require a withdrawal period at the lowest use level for at least one
approved species, and are regulated on a “zero-residue” basis.
Drug sources are divided in three types - Type A medicated articles, Type B and Type C
medicated feeds (FDA-HHS, 2008). Type A medicated articles are products of standardized
potency that contain one or more animal drugs intended for use in the manufacture of another
medicated article or a medicated feed. Type B medicated feeds are produced from a Type A
medicated article and are intended to manufacture either a Type B or Type C medicated feed.
Type C medicated feeds are produced from either a Type A medicated article or a Type B

4
medicated feed. Type C medicated feed may be offered free choice together with other animal
feed.
Facilities incorporating Category II - Type A medicated articles to animal feed must
register with the FDA, obtain a Feed Mill License (FML), comply with more stringent CGMP
regulations, perform regular drug assays, and are subjected to a mandatory biennial inspection by
the FDA. These facilities must comply with criteria established in sections 226.10 through
226.115 of the CGMP regulations, which stipulates methods used in the manufacturing,
processing, packing, and holding of Category II - Type A medicated articles (FDA-HHS, 2007b).
Facilities manufacturing feed using all Category I and/or Category II - Type B drugs are not
required to register with FDA or obtain a FML. As non-licensed facilities, they are subject to
less detailed CGMP regulations, and are not subject to routine FDA inspections, although they
may be inspected for cause or by state officials.
Compliance with CGMP regulations will not only ensure a product meets safety, identity,
strength, quality, and purity standards, it will also prevent one of the major issues during
medicated feed manufacturing – drug carryover. Drug carryover during medicated feed
manufacturing may result in unsafe drug contamination of subsequent batches. This is may be
detrimental to certain animal species and poses a risk for consumers through unsafe drug
residues in the edible products from these animals (NRC, 1999). To avoid unsafe drug
contamination, the CGMP regulations require subjecting all manufacturing equipment that
comes in contact with animal drugs or medicated feed to effective cleanout procedures.
Drug Carryover during Medicated Feed Manufacturing
Unsafe drug contamination in animal feed is defined as the level of drug contamination
which would result in an above tolerance drug residue in the edible tissue of the food-producing
5
animal or which has deleterious effects when fed to animals. The CGMP regulations require
medicated feed manufacturers to use one or more approved cleanout procedures, such as
cleaning, sequencing, and/or flushing to prevent drug carryover (FDA-HHS, 1976). Cleaning
demands the complete shutdown of the facility to thoroughly clean the manufacturing
equipment. Sequencing entails a pre-planned order of production of feeds designed to direct drug
carryover into subsequent feeds that will not result in unsafe drug contamination. Flushing
involves taking a specific quantity of an ingredient, such as ground grain, and conveying it
through the system to “flush” out any residual medicated feed from the previous medicated
batches.
The most effective method, but not widely used in the feed industry, is cleaning. The
thorough cleaning of the manufacturing equipment following every batch of medicated feed can
only be accomplished by completely shutting down the facility. This is both impractical and not
economically feasible. A complete manufacturing system cleanout is only recommended under
high-risk situations such as, when handling a high potency form of a drug, when physical
properties (e.g., adhesive strength, electrostatic properties) of drugs are such that sequencing and
flushing are not sufficient, when the manufacturing equipment is inaccessible, or when liquid
ingredients are used in the diet.
The feed industry typically uses sequencing because it minimizes the manufacturing
system’s downtime. The ordering sequence determines the likelihood of drug carryover into
subsequent batches. Medicated feed containing the same drug(s) should be produced in
sequence, with the batch with the highest drug level batched first. This production sequence
would be followed by a non-medicated feed for the same animal species. In most medicated feed
manufacturing facilities, sequencing will reduce drug carryover to a level that eliminates the

6
potential for consequent tissue residue in animals. However, sequencing may not reduce
carryover to a sufficient level if deficiencies in CGMPs exist. If properly planned and executed,
it may be the most cost-effective cleanout procedure. Periodic re-evaluation of the sequencing
procedures should be performed to verify and validate effectiveness.
When flushing, ground corn at an approximate particle size of 600 microns is usually
used as the flush material. As the flush material is conveyed through the manufacturing system,
it comingles with residual medicated feed from previous batches, diluting the drug concentration
to a safe level. The FDA recommends using between 5 and 10% of the mixer’s total capacity as
the quantity of flush material. Once the flush material has been used to clean the system, it must
be properly identified and stored to prevent cross contamination. Flushing is not often used as a
cleanout procedure considering the economic implications of having to store and/or dispose the
flush material.
Feed Additives and Their Uses
Nicarbazin
Nicarbazin is a prophylactic that has been used since the 1950s to control coccidiosis in
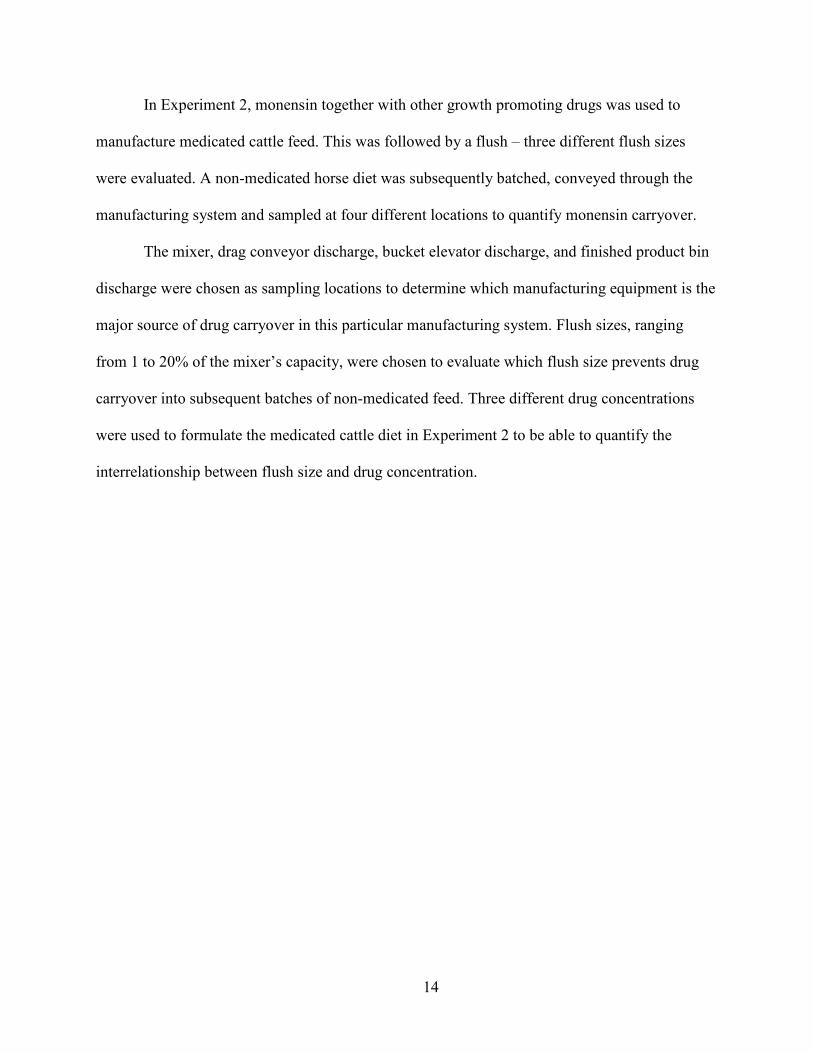
broilers (Ott et al., 1956; Newberne and Buck, 1957). Nicarbazin has two components: 4,6 di-
methyl-2-pyrimidinol (HDP) and 4,4’-dinitrocarbanilide (DNC) (Figure 1.1; Conway and
McKenzie, 2007). The function of HDP is to increase absorption in the intestinal tract, and DNC
is considered the coccidiostat (Cuckler et al., 1955; Rogers et al., 1983).
The FDA classifies nicarbazin as a Category II - Type A medicated article, which can be
fed to different animal species. In the United States, nicarbazin is approved for broilers at a
concentration of 113.5 g/ton as a sole medication to prevent cecal and intestinal coccidiosis, and
7
up to 181.6 g/ton when combined with growth-promoting drugs for increased rate of weight gain
and improved feed efficiency. Diets with nicarbazin concentrations of 113.5 g/ton have been
proven effective in preventing coccidiosis in broilers (Ott et al., 1956; Rubin et al., 1956;
McLoughlin and Chester, 1959; McLoughlin et al., 1960; Gardiner and McLoughlin, 1963). A
withdrawal period of 4 days is used if nicarbazin is the only drug used and 4-5 days if nicarbazin
is fed in combination with other feed additives. These withdrawal periods provide the time
needed for the concentration of the active compound (i.e., DNC) to fall below 4 ppm, which is
the maximum allowable concentration in uncooked chicken muscle, liver, skin, and kidneys
(FDA-HHS, 1975).
Feeding nicarbazin-contaminated feed may be detrimental to laying birds, such as hens
(Jones et al., 1990; Hughes et al., 1991; Chapman, 1994; VerCauteren et al., 2001) and geese
(Johnston et al., 2002). Nicarbazin affects egg production, weight, and hatchability, as well as the
appearance of the yolk (i.e., mottling) (Ott et al., 1956; Sherwood et al., 1956; Jones et al., 1990;
Hughes et al., 1991; Chapman, 1994).
Regulatory agencies have set tolerance levels for nicarbazin residues in uncooked
chicken muscle, liver, skin and kidneys. In the United States, the FDA established 4 ppm (FDA-
HHS, 1975), whereas internationally, the Joint FAO/WHO Expert Committee on Food Additives
(JECFA) fixed a maximum residue level (MRL) of 0.2 ppm (FAO/WHO, 1999). Neither
regulatory agency has yet established tolerance levels in eggs. However, in the UK, the
Veterinary Medicines Directorate has defined a differential action limit (DAL) of 0.1 ppm of
nicarbazin in eggs. Animal food-products above these guidelines pose a risk to consumers
through unsafe drug residue in the edible products from these animals. European researchers
have reported that feed contaminated with 1.9 ppm and 2.4 ppm of nicarbazin was sufficient to

8
exceed both egg DAL and liver MRL respectively (Cannavan et al., 2000; Cannavan and
Kennedy, 2000).
Monensin
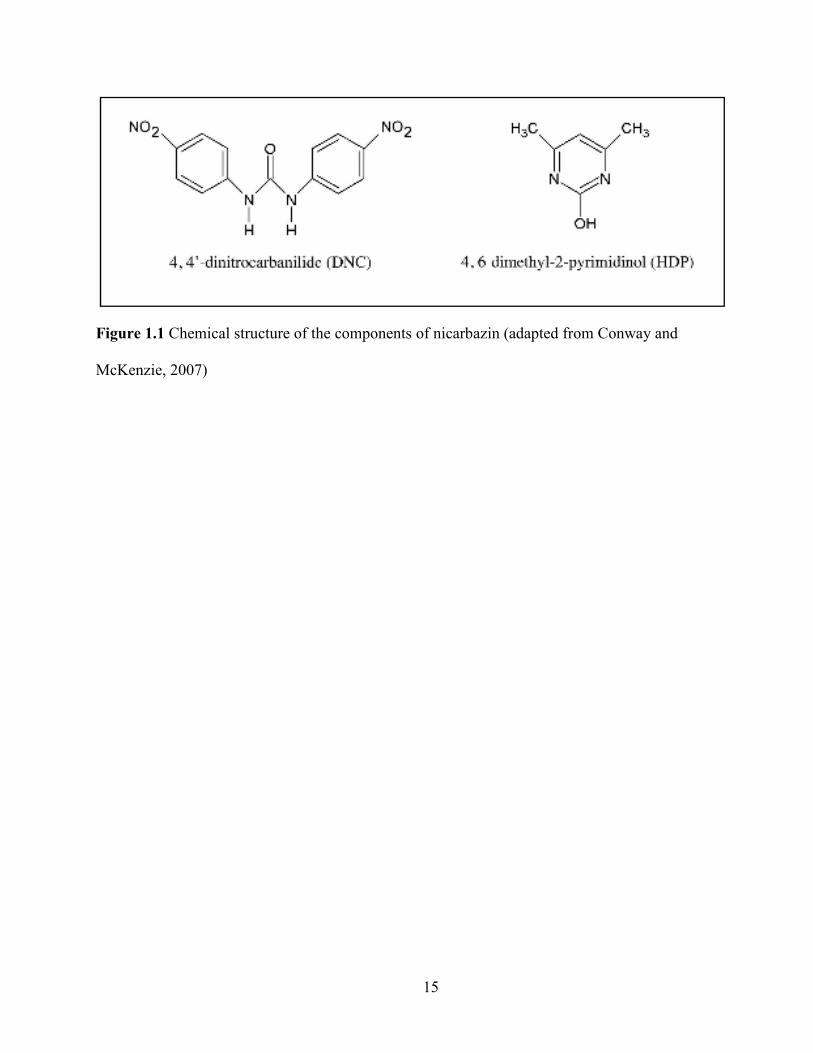
Monensin is classified as a Category I - Type A medicated article by the FDA. Monensin
is an ionophore produced by the Streptomyces cinnamonensis strain and is typically fed as the
sodium salt. It is composed by 2-(5-ethyltetrahydro-5(tetrahydro-3-methyl-5-(tetrahydro-6-
hydroxy-6-hydroxymethyl)-3,5-dimethyl-2H-pyran-2-yl-2-furyl)-2-furyl)9-hydroxy-β-methoxy-
a,g,2,8-tetramethyl-1,6-diaoxaspiro(4,5)decane-7-butyric acid) (Figure 1.2; Conway and
McKenzie, 2007).
In the United States, monensin is approved at different concentration levels for different
animal species. It is approved for broilers at a concentration of 90-110 g/ton as a sole medication
and when combined with growth promoting drugs to prevent coccidiosis. This same
concentration is approved for replacement chickens (intended for use as caged layers) with a
maximum use of 16 weeks. Monensin is also approved for use in cattle rations as a sole
medication for the prevention and control of coccidiosis (0.14-0.42 mg/lb of bodyweight), to
increase weight gain (25-400 g/ton), and to improve feed efficiency (5-400 g/ton). When
combined with growth promoting drugs, it is approved for the prevention and control of
coccidiosis (10-30 g/ton) and to improve feed efficiency (50-1,200 g/ton). The FDA requires
withdrawal periods of up to seven days depending on the monensin use level, the animal species
being fed, and if used as a sole medication or in combination with other feed additives.
Withdrawal periods provide time for the concentration of the active compound to fall below
regulatory guidelines. Feeding chickens does not require having a withdrawal period, although it
may limit feed intake resulting in reduced weight gain. Tolerances for monensin residues in
9
cattle are set at 0.10 ppm for liver and 0.05 ppm for muscle, kidney and fat (FDA-HHS, 1975).
No tolerance for monensin residue has been established for chicken.
Feeding monensin-contaminated feed may be detrimental to certain animal species.
Compared to nicarbazin, monensin does not have major effects on layer birds’ egg production.
Researchers have observed that concentrations from 264-440 mg/kg of monensin will make
laying birds cease egg production (EFSA, 2008). Broilers present reduced body weight gain
when fed monensin concentrations of 250 mg/kg (EFSA, 2005), although reduced body weight
can also be observed when no withdrawal period is implemented in the feeding program for
chickens. Horses are the most susceptible to monensin (Matsuoka, 1976). Concentration as low
as 33 mg/kg may cause temporary anorexia, and up to 121 mg/kg will cause toxicity and
subsequent death (EFSA, 2008).
Accidental feeding of monensin-medicated feed to horses has been documented to result
in toxicity and death (Stoker, 1975; Matsuoka, 1976; Nava, 1978; Beck and Harries, 1979;
Whitlock et al., 1979; Muylle et al., 1981). A major source of exposure is usually a result of
accidental contamination during formulation of horse rations (Doonan et al., 1989). It was
reported by the European Food Safety Authority (2008) that horses that consume cattle feed
(with a 33 mg/kg monensin concentration) develop anorexia, whereas the consumption of broiler
feed (with a 121 mg/kg monensin concentration) would cause toxicity, resulting in death.
Monensin toxicity side effects in horses include anorexia, colic pain, sweating, tachycardia,
uneasiness, polyuria, progressive ataxia, recumbence, and death (EFSA, 2008). The high
susceptibility of horses to monensin is associated with a deficiency in demethylating enzymes,
which facilitate clearing monensin out of the animal’s system. Nebbia et al. (2001) showed that
horses have a low catalytic efficiency to demethylate monensin. For this reason, horse feeds
10
should never be batched immediately after the production of a medicated feed containing
monensin, unless adequate measures are taken to prevent drug carryover.
The Purpose of Animal Drug Use
Disease Control and Prevention: Coccidiosis
Nicarbazin and monensin are both approved animal drugs used as an aid in the prevention
and control of coccidian infections. Coccidia are a variety of single-celled, species-specific,
parasitic organisms from the subkingdom Protozoa of the phylum Apicomplexa (Long, 1982).
Chickens are challenged by the species of coccidia that belong to the genus Eimeria, specifically
E. acervulina, E. brunetti, E. maxima, E. mittis, E. necatrix, E. praecox, and E. tenella (Conway
and McKenzie, 2007). Although there are seven different Eimeria species specific to chickens,
E. acervulina, E. maxima, and E. tenella are the most prevalent in the United States. Cattle are
primarily challenged by E. auburnensis, E. bovis and E. zuernii (EFSA, 2008).
The Eimeria’s life cycle typically lasts about 4-7 days. The cycle begins when a
susceptible animal ingests an oocyst, a thick-walled capsule that protects four sporocysts within,
which contain two sporozoites. The sporozoites are then released in the digestive tract and
invade specific epithelial cells depending on which Eimeria species challenges the animal. The
sporozites will then transform to a feeding stage called trophozoite in about 12-24 hours.
Subsequently, the parasitic nucleus will divide by a process of asexual reproduction and be
referred to as a schizont. The schizont will rupture when mature, and releases the merozoites that
will invade other epithelial cells to repeat the development cycle of the parasite. Given a
parasite’s “self-limiting” nature, multiplication will cease before killing the host, and the
remaining oocysts will be shed in the feces.
11
Coccidian organisms are opportunistic in nature, for the most part challenging young
and/or immuno-compromised animals by invading the intestinal lining. The primary symptom of
a coccidian infection is diarrhea, which may become bloody in acute cases. In chickens,
symptoms such as poor weight gain, poor feed conversion, poor egg production, and death can
be observed (Conway and McKenzie, 2007). Cattle may present symptoms such as straining, and
severe weight loss (Kirkpatrick and Selk, 2007).
Coccidiosis is one of the most common diseases in the poultry industry and one that can
have major economic implications to producers. Studies have shown that exposure to coccidia
usually begins shortly after chicks are placed on litter (Long and Rowell 1975; Long et al., 1975;
Long and Millard 1978; Braunius 1984), with the highest level of infection occurring between
three and six weeks of age (Conway and McKenzie, 2007). Chapman (1999) observed that the
development of the bird’s full natural immunity is not attained until seven weeks of age. The
latter is highly dependable on the anticoccidial drug used and the level of challenge during the
first five to six weeks of growth.
The prevention and control of coccidiosis is dependent upon the integration of
anticoccidial drugs to a comprehensive feeding program. Anticoccidial drug shuttle programs are
used to reduce the organism’s resistance to anticoccidial drugs. The poultry industry shuttle
programs typically use a chemical (e.g., nicarbazin) in the starter ration, and an ionophore (e.g.,
monensin) in the grower ration (Eckman, 1993). Programs using an ionophore in the starter
ration and a chemical in the grower ration have also proven to be successful. However,
nicarbazin is not recommended for use in the grower phase, especially in warm environments,
because it has been shown to reduce the bird’s heat tolerance (Buys and Rasmussen, 1978;
McDouglad and McQuisition, 1980; Keshavarz and McDougald, 1981).

12
Growth Promotants: Ionophores
Ionophores are lipid-soluble molecules, usually synthesized by microorganisms that
transport ions across cell membranes (Callaway et al., 2003). Ionophores are primarily utilized
for ruminant animals as growth promotants. The main purpose of ionophores is to bind ions and
move them across membranes. Monensin is an ionophore that can exchange H+ for either Na
+ or
K+ (Russell and Strobel, 1989).
The rumen environment contains high sodium and low potassium concentrations. To be
able to uptake nutrients, bacteria in the rumen maintain an intracellular concentration opposite to
that of the rumen (Chow and Russell, 1992). Since the potassium gradient is greater than the
sodium gradient in the rumen, protons will accumulate inside the bacterium (Chow et al., 1994).
This will create a cytoplasmic acidification inside the bacterium, by which the bacterium reacts
by activating a sodium-potassium exchanger (Booth, 1985). The purpose of activating this
sodium-potassium exchanger (Na+/K
+ ATPase) is to move protons out of the cell and re-establish
the ionic gradient between the bacterium and the rumen. This will limit the intracellular ATPs
used for growth, leading to cellular death (Russell, 1987; Russell and Strobel, 1989).
Two of monensin’s major effects when fed to ruminant animals are: 1.) an increase in
propionate production, and 2.) a decreases methane production in the rumen environment (Dinius
et al., 1976; Richardson, et al., 1976; Russell and Strobel, 1989). Since propionate is the most
efficiently utilized volatile fatty acid (VFA), an increase in propionate production in the rumen
increases the energy availability to the animal (Russell and Strobel, 1989). Richardson et al.
(1976) concluded that a decrease in the acetate to propionate ratio (i.e., an increase in propionate
production) increases gross energy available to the animal by 5.6%. A decrease in methane
production in the rumen is also observed with the use of monensin as a feed additive
13
(Wedegaertner and Johnson, 1983; Russell and Strobel, 1989; Johnson and Johnson, 1995).
Methane-producing bacteria, called methanogens, are not directly inhibited by monensin.
Monensin inhibits the bacteria responsible for feeding nutrients (i.e., H2) to this methanogens
(Van Nevel and Demeyer, 1977; Dellinger and Ferry, 1984).
In addition to these two major effects, monensin also reduces acidosis in ruminal animals
(Galyean and Owens, 1988). Acidification in the rumen is due to the accumulation of lactic acid
as a result of the rapid fermentation of dietary carbohydrate (Nagaraja, et al., 1982; Burrin and
Britton, 1986; Russell and Rychlik, 2001). Ruminal acidosis is associated with reduced feed
intake, low feed efficiency, and cyclic feeding, as well as death in some cases. Monensin reduces
acidosis by directly inhibiting the lactate-producing bacteria (Dennis, et al., 1981).
Research Objectives
1) To determine which manufacturing equipment is the major source of drug carryover.
2) To evaluate which flush size adequately prevents drug carryover into subsequent batches
of non-medicated feed.
3) To quantify the interrelationship between flush size and drug concentration.
Thesis Organization
To address the previously mentioned objectives, two experiments were conducted in the
Feed Processing Research Center in the Department of Grain Science & Industry at Kansas State
University. In Experiment 1, nicarbazin was used as the sole feed additive to manufacture
medicated broiler feed. This was followed by a flush – five different flush sizes were evaluated.
Subsequently, a non-medicated broiler diet was batched, conveyed through the manufacturing
system and sampled at four different locations to quantify nicarbazin carryover.
14
In Experiment 2, monensin together with other growth promoting drugs was used to
manufacture medicated cattle feed. This was followed by a flush – three different flush sizes
were evaluated. A non-medicated horse diet was subsequently batched, conveyed through the
manufacturing system and sampled at four different locations to quantify monensin carryover.
The mixer, drag conveyor discharge, bucket elevator discharge, and finished product bin
discharge were chosen as sampling locations to determine which manufacturing equipment is the
major source of drug carryover in this particular manufacturing system. Flush sizes, ranging
from 1 to 20% of the mixer’s capacity, were chosen to evaluate which flush size prevents drug
carryover into subsequent batches of non-medicated feed. Three different drug concentrations
were used to formulate the medicated cattle diet in Experiment 2 to be able to quantify the
interrelationship between flush size and drug concentration.
15
Figure 1.1 Chemical structure of the components of nicarbazin (adapted from Conway and
McKenzie, 2007)
16
Figure 1.2 Chemical structure of monensin (adapted from Conway and McKenzie, 2007)
17
References
Beck B. E., and W. N. Harries. 1979. The diagnosis of monensin toxicosis: A report on
outbreaks in horses, cattle and chickens. In: Am. Assoc. Vet. Lab. Diagnost Annu. Proc.
22:269-282.
Booth, I. R. 1985. Regulation of cytoplasmic pH in bacteria. Microbiol. Rev. 49:359-378.
Braunius, W. W. 1984. Epidemiology of Eimeria in broiler flocks and the effect of anticocidial
drugs on the economic performance. Zootecnica Int., June:48-53.
Burrin, D. G., and R. A. Britton. 1986. Response to monensin in cattle during subacute acidosis
in cattle. J. Anim. Sci. 63:888-893.
Buys, S. B., and R. W. Rasmussen. 1978. Heat stress mortaility in nicarbazin fed chickens. J.
South African Vet. Assoc. 49:127-128.
Callaway, T. R., Edrington, T. S., Rychlik, J. L., Genovese, K. J., Poole, T. L., Jung, Y. S.,
Bischoff, K. M., Anderson, R. C., and D. J. Nisbet. 2003. Ionophores: Their use as Ruminant
Growth Promotants and Impact on Food Safety. Curr. Issues Intest. Microbiol. 4:43-51.
Cannavan, A., Ball, G., and D. G. Kennedy. 2000. Nicarbazin contamination in feeds as a cause
of residues in eggs. Food Addit. Contam. 17:829-836.
Cannavan, A., and D. G. Kennedy. 2000. Possible causes of nicarbazin residues in chicken
tissues. Food Addit. Contam. 17:1001-1006.
Chapman, H. D. 1994. A review of the biological activity of the anticoccidial drug nicarbazin
and its application for the control of coccidiosis in poultry. Poult. Sci. Rev. 5:231-243.
Chapman, H. D. 1999. Anticoccidial drugs and their effects upon the development of immunity
to Eimeria infections in poultry. Avian Pathol. 28:521-35.
18
Chow, J. M., and J. B. Russell. 1992. Effect of pH and monensin on glucose transport by
Fibrobacter succinogenes, a cellulolytic ruminal bacterium. Appl. Environ. Microbiol.
58:1115-1120.
Chow, J. M., Van Kessel, J. A. S., and J. B. Russell. 1994. Binding of radiolabeled monensin and
lasalocid to ruminal microorganisms and feed. J. Anim. Sci. 72:1630-1635.
Conway, D. P., and M. E. McKenzie. 2007. Poultry coccidiosis: diagnostic and testing
procedures. 3rd ed. Blackwell Pub., Ames, Iowa.
Cuckler, A. C., Malanga C. M., Basso A. J., and R. C. O’Neill. 1955. Antiparasitic activity of
substituted carbanilide complexes. Science. 122:244-245.
Dellinger, C. A., and J. G. Ferry. 1984. Effect of monensin on growth and methanogenesis of
Methanobacterium formicicum. Appl. Environ. Microbiol. 48:680-682.
Dennis, S. M., Nagaraja, T. G., and E. E. Bartley. 1981. Effects of lasalocid or monensin on
lactate-producing or -using rumen bacteria. J. Anim. Sci. 52:418-426.
Dinius, D. A., Simpson, M. E., and P. B. Marsh. 1976. Effect of monensin fed with forage on
digestion and the ruminal ecosystem of steers. J. Anim. Sci. 42:229-234.
Doonan, G., Brown, C. M., Mullaney, T. P., Brooks, D. B., Ulmanis, E. G., and M. R. Slanker.
1989. Monensin poisoning in horses – an international incident. Can. Vet. J. 30:165-169.
Eckman, M. K. 1993. Horizontal vs. vertical health programs in broiler production. Poultry
Digest. August:16-22.
European Food Safety Authority. 2005. Opinion of the Scientific Panel on Additives and
Products or Substances used in Animal Feed on a request from the European Commission on
the evaluation of the coccidiostat Coxidin (Monensin Sodium). The EFSA Journal 283:1-53.
19
European Food Safety Authority. 2008. Cross-contamination of non-target feedingstuffs by
monensin authorised for use as a feed additive. The EFSA Journal. 592:1-40.
FAO/WHO (Food and Agriculture Organization/World Health Organization). 1999. Evaluation
of certain veterinary drug residues in food. Fiftieth report of the Joint FAO/WHO Expert
Committee on Food Additives, WHO Technical Report Series 888.
FD&C Act (Federal Food, Drug, and Cosmetic Act). 2008. Adulterated Drugs and Devices. Sec.
501(a)(2)(B).
Food and Drug Administration. 2007a. www.fda.gov/consumer/updates/petfoodrecallup.html.
Food and Drug Administration. 2007b.
http://www.fda.gov/consumer/updates/melamine051407.html.
Food and Drug Administration. 2008. www.fda.gov/oc/opacom/hottopics/petfood.html.
Food and Drug Administration, Department of Health and Human Services. 1975. Tolerances for
residues of new animal drugs. 21 CFR part 556. Fed. Regist. 40:13942.
Food and Drug Administration, Department of Health and Human Services. 1976. Current Good
Manufacturing Practice for Medicated Feeds. 21CFR part 225.65. Fed. Regist. 41:52618.
Food and Drug Administration, Department of Health and Human Services. 2007a. Current
Good Manufacturing Practice for Medicated Feeds. 21CFR part 225.1. Fed. Regist.
72:69120.
Food and Drug Administration, Department of Health and Human Services. 2007b. Current
Good Manufacturing Practice for Type A Medicated Articles. 21 CFR part 226.1. Fed.
Regist. 72:69120.
Food and Drug Administration, Department of Health and Human Services. 2008. New Animal
Drugs for Use in Animal Feeds. 21 CFR part 558.3. Fed. Regist. 73:15884.
20
Galyean, M. L., and F. N. Owens. 1988. Effects of monensin on growth, reproduction, and
lactation in ruminants. In: ISI Atlas of Science: Anim. Philadelphia, PA. 71-75.
Gardiner, J. L., and D. K. McLoughlin. 1963. The comparative activity of certain coccidiostats in
experimental Eimeria tenella infections. Poultry Sci. 42:932-935.
Hughes, B. L., Jones, J. E., J. E. Toler, J. Solis, and D. J. Castaldo. 1991. Effects of exposing
broiler breeders to nicarbazin contaminated feed. Poult. Sci. 70:476-482.
Johnson, K.A., and D. E. Johnson. 1995. Methane emissions from cattle. J. Anim. Sci. 73:2483-
2494.
Johnston, J. J., Britton, W. M., MacDonald, A., Primus, T. M., Goodal, M. J., Yoder, C. A.,
Miller, L. A., and K. A. Fagerstone. 2002. Quantification of plasma and egg 4,4'-
dinitrocarbanilide (DNC) residues for the efficient development of a nicarbazin-based
contraceptive for pest waterfowl. Pest. Manag. Sci. 58:197-202.
Jones, J. E., Solis, J., Hughes, B. L., Castaldo, D. J., and J. E. Toler. 1990. Production and egg-
quality responses of White Leghorn layers to anticoccidial agents. Poult. Sci. 69:378-387.
Keshavarz, K., and L. R. McDougald. 1981. Influence of anticoccidial drugs on losses of broiler
chickens from heat stress and coccidiosis. Poultry Sci. 60:2423-28.
Kirkpatrick and Selk. 2007. Coccidiosis in cattle. Oklahoma Cooperative Extension, Stillwater,
Oklahoma.
Long, P. L., Tompkins, R. V., and B. J. Millard. 1975. Coccidiosis in broilers: evaluation of
infection by the examination of broiler house litter for oocysts. Avian Path. 4:287-94.
Long, P. L., and J. G. Rowell. 1975. Sampling broiler house litter for coccidial oocysts. Br.
Poultry Sci. 16:583-92.
21
Long, P. L., and B. J. Millard. 1978. Coccidiosis in broilers: the effect of monensin and other
anticoccidial drug treatments on occyst output. Avian Path. 7:373-81.
Long, P. L. 1982. The biology of the coccidia. Page 396. University Park Press, Baltimore,
Maryland.
Matsuoka, T. 1976. Evaluation of monensin toxicity in the horse. J. Am. Vet. Med. Assoc.
169:1098-1100.
McDougald, L. R., and T. E. McQuistion, 1980. Mortality from heat stress in broiler chickens
influenced by anticoccidial drug. Poultry Sci. 59:2421-2123.
McLoughlin, D. K., and D. K. Chester. 1959. The comparative efficacy of six anticoccidial
compounds. Poultry Sci. 38:353-355.
McLoughlin D. K., Gardiner, J. L., and D. K. Chester. 1960. The activity of glycarbylamide,
Trithiadol, and nicarbazin against Eimeria tenella in chickens. Poultry Sci. 39:1328-1332.
Muylle, E., Vandenhende, C., Oyaert, W., Thoonen, H., and K. Vlaeminck. 1981. Delayed
Monensin sodium toxicity in horses. Equine Vet. J. 13:107-108.
Nagaraja, T. G., Avery, T. B., Bartley, E. E., Roof, S. K., and A. D. Dayton. 1982. Effect of
lasalocid, monensin or thiopeptin on lactic acidosis in cattle. J. Anim. Sci. 54: 649-658.
Nava, K. M. 1978. Mysterious horse deaths at Bonita Valley Farms. Cal. Vet. 32:27-28.
Nebbia, C., Ceppa, L., Dacasto, M., Nachtmann, C., and M. Carletti. 2001. Oxidative monensin
metabolism and cytochrome P450 3A content and functions in liver microsomes from horses,
pigs, broiler chicks, cattle and rats. Journal of Veterinary Pharmacology and Therapeutics 24
(6):399–403.
Newberne, P. M., and W. B. Buck. 1957. Studies on drug toxicity in chicks 3. The influence of
various levels of nicarbazin on growth and development of chicks. Poult. Sci. 36:304-311.

22
NRC (National Research Council). Board on Agriculture. Panel on Animal Health, Food Safety,
and Public Health. Committee on Drug Use in Food Animals. 1999. The use of drugs in food
animals: benefits and risks. National Academy Press, Washington, D.C.
Ott, W. H., Kuna, S., Porter, C. C., Cuckler, A. C., and D. E. Fogg. 1956. Biological studies on
nicarbazin, a new anticoccidial agent. Poult. Sci. 35:1355-1367.
Richardson, L. F., Raun, A. P., Potter, E. L., Cooley, C.O., and R. P. Rathmacher. 1976. Effect
of monensin on rumen fermentation in vitro and in vivo. J. Anim. Sci. 43:657-664.
Rogers, E. F., Brown, R. D., Brown, J. E., Kazazis, D. M., Leanza, W. J., Nichols, J. R., Ostlind,
D. A., and T. M. Rodino. 1983. Nicarbazin complex yields dinitrocarbanilide as ultrafine
crystals with improved anticoccidial activity. Science. 222:630-632.
Rubin, R., McLoughlin, D. K., Costello, L. C., and E. E. Wehr. 1956. The efficacy of nicarbazin
as a prophylactic drug in cecal coccidiosis of chickens. Poultry Sci. 35:856-860.
Russell, J. B. 1987. A proposed mechanism of monensin action in inhibiting ruminal bacterial
growth: effects on ion flux and protonmotive force. J. Anim. Sci. 64:1519-1525.
Russell, J. B., and H. J. Strobel. 1989. Effect of ionophores on ruminal fermentation. Appl.
Environ. Microbiol. 55:1-6.
Russell, J. B., and J. L. Rychlik. 2001. Factors that alter rumen microbial ecology. Science.
292:1119-1122.
Sherwood, D. H., Milby, T. T., and W. A. Higgins. 1956. The effect of nicarbazin on
reproduction in White Rock breeder hens. Poultry Sci. 35:1014.
Stoker, J. W. 1975. Letter: Monensin sodium in horses. Vet. Rec. 97:137-138.
USDA. 2007. Fact Sheet: Interim Melamine and Analogues Safety/Risk Assessment.
Van Nevel, C. J., and D. I. Demeyer. 1977. Effect of monensin on rumen metabolism in vitro.
23
Appl. Enviro. Microbiol. 34:251-257.
VerCauteren, K. C., Pipas, M. J., and K. L. Tope. 2001. Evaluation of nicarbazin-treated pellets
for reducing the laying and viability of Canada goose eggs. Proc. 9th Wildlife Management
Conference.
Wedegaertner, T. C., and D. E. Johnson. 1983. Monensin effects on digestibility,
methanogenesis and heat increment of a cracked corn-silage diet fed to steers. J. Anim. Sci.
57:168-177.
Whitlock, R. H., White, N. A., Rowland, G. N., and R. Plue. 1979. Monensin toxicosis in horses:
Clinical manifestations. In: Am. Assoc. Equine Pract. Annu. Proc. 24:473-486.
24
CHAPTER 2 - Evaluating Flushing Procedures to Prevent
Nicarbazin Carryover during Medicated Feed Manufacturing
Feed manufacturers produce a broad range of feeds targeted to different animal species.
Low production facilities generally only have one production line on which all the different
animal species feeds are produced. When switching from one type of feed to the subsequent one,
residues of the first batch will remain in the production line and end up in the subsequent batch.
The transfer of residues from one batch to the subsequent batch is called carryover. Drug
carryover is a form of feed contamination that results when an animal drug gets transferred from
one production batch to the subsequent batch in unsafe levels. Varying among animal species
and age, unsafe levels may have detrimental effects on the animals and may result in above
tolerance residue levels in the edible tissue of food-producing animals. Drug carryover can occur
during feed manufacturing, processing, or distribution. To prevent drug carryover during feed
manufacturing, all equipment that comes in contact with an animal drug or medicated feed shall
be subjected to effective cleanout procedures.
The FDA’s CGMP regulations serve as guidelines for medicated feed manufacturers to
ensure their products meet identity, strength, and quality standards. These regulations required
the implementation of adequate procedures for all equipment used to manufacture medicated
feed to avoid unsafe levels of drug contamination during feed manufacturing. The CGMP
regulations require medicated feed manufacturers to use one or more of the approved cleanout
procedure, such as cleaning, sequencing, and/or flushing to prevent unsafe contamination by
drug carryover (HHS-FDA, 1976).
25
The most effective cleanout procedure is considered the thorough cleaning of the
manufacturing system. However, sequencing and flushing are the most commonly used in the
feed industry. Flushing is typically used in low production facilities. The FDA recommends
using of 5 to 10 percent of the mixer’s total capacity as the flush material. However, these
quantities are based solely on recommendations with little data available to support this practice.
Consequently, establishing an interrelationship between flush size and drug carryover is a
practical necessity.
One of the most economically significant feed additives in the feed industry is nicarbazin.
Nicarbazin is primarily used in the poultry industry to prevent coccidiosis in broilers. The FDA
classifies nicarbazin as a Category II - Type A medicated article used for different animal
species. This prophylactic additive has been in use as an aid in preventing outbreaks of cecal and
intestinal coccidiosis in chickens since the 1950s (Ott et al., 1956; Newberne and Buck, 1957).
Nicarbazin has two components: 4,6 di-methyl-2-pyrimidinol (HDP) and 4,4’-dinitrocarbanilide
(DNC) (Figure 2.1; Conway and McKenzie, 2007). The function of HDP is to increase
absorption in the intestinal tract, and DNC is considered the coccidiostat (Cuckler et al., 1955;
Rogers et al., 1983).
In the United States, nicarbazin is approved for broilers at a concentration of 113.5 g/ton
as a sole medication to prevent cecal and intestinal coccidiosis, and up to 181.6 g/ton when
combined with growth-promoting drugs for increased rate of weight gain and improved feed
efficiency. Diets with nicarbazin concentrations of 113.5 g/ton have proven effective in
preventing coccidiosis in broilers (Ott et al., 1956; Rubin et al., 1956; McLoughlin and Chester,
1959; McLoughlin et al., 1960; Gardiner and McLoughlin, 1963). A withdrawal period of four to
five days is required to allow for elimination of the drug from edible tissue. A withdrawal period

26
of four days is used if it is the only drug used and five days if it is fed in combination with other
additives. This withdrawal period provides time needed for the concentration of active
compounds to fall below 4 ppm, which is the maximum allowable concentration in uncooked
chicken muscle, liver, skin and kidneys (HHS-FDA, 1975).
Coccidia are a variety of single-celled, species-specific, parasitic organisms from the
subkingdom Protozoa of the phylum Apicomplexa (Long, 1982). Infection by coccidia parasites
that produce clinical manifestations of disease is called coccidiosis. Chickens are challenged by
the species of coccidia that belong to the genus Eimeria, specifically E. acervulina, E. brunetti,
E. maxima, E. mittis, E. necatrix, E. praecox, and E. tenella (Conway and McKenzie, 2007).
Although there are seven different Eimeria species specific to chickens, E. acervulina, E.
maxima, and E. tenella are the most prevalent in the United States.
Feeding nicarbazin-contaminated feed may be detrimental to laying birds, such as hens
(Jones et al., 1990; Hughes et al., 1991; Chapman, 1994; VerCauteren et al., 2001) and geese
(Johnston et al., 2002). Nicarbazin affects egg production, weight, and hatchability, as well as the
yolk appearance (i.e., mottling) (Ott et al., 1956; Sherwood et al., 1956; Jones et al., 1990;
Hughes et al., 1991; Chapman, 1994).
Regulatory agencies have set tolerance levels for residues of nicarbazin in uncooked
chicken muscle, liver, skin and kidneys. In the United States, the FDA established 4 ppm (HHS-
FDA, 1975), whereas internationally, the Joint FAO/WHO Expert Committee on Food Additives
(JECFA) fixed a maximum residue level (MRL) of 0.2 ppm (FAO/WHO, 1999). Neither
regulatory agency has yet established tolerance levels in eggs. However, in the UK, the
Veterinary Medicines Directorate has defined a differential action limit (DAL) of 0.1 ppm of
nicarbazin in eggs. Animal food-products above these guidelines pose a risk to consumers

27
through unsafe drug residues in the edible products from these animals. European researchers
have reported that feed contaminated with 2 ppm and 2.4 ppm of nicarbazin was sufficient to
exceed both egg DAL and liver MRL respectively (Cannavan et al., 2000; Cannavan and
Kennedy, 2000).
To reduce the risk of drug residue in animal food products, manufacturing facilities in the
United States must use one or more of the cleanout procedures required by the FDA. Given that
flushing is commonly used among the feed industry, the present study was designed to establish
the interrelationship between the flush size and the level of nicarbazin carryover throughout a
particular feed manufacturing system. This study may prove useful to determine which
manufacturing equipment is the major source of drug carryover, as well as to develop strategies
to prevent drug carryover during medicated feed manufacturing.
Material and Methods
Feed Manufacturing and Sampling procedures. Five flush size treatments were
evaluated using the same nicarbazin level (125 ppm): 1) 2.5; 2) 5.0; 3) 10; 4) 15; and 5) 20% of
the mixer’s capacity. The study was conducted in the Feed Processing Research Center in the
Department of Grain Science & Industry at Kansas State University. The feed manufacturing
system included the following major equipment: a 454.5 kg (1,000 lb) capacity drop bottom
paddle mixer (Forberg, Hegdalveien, Larvik, Norway); a 3.79 kg/s (8.33 lb/s) capacity drag
conveyor (Esmueller, Laurel, MS); a 19.96 MT/h (44,000 lb/h) capacity bucket elevator (Hayes
& Stolz, Forth Worth, Texas); a 11-position electric distributor; and a 5.44 MT capacity finished
product bin (Figure 2.2).
The manufacturing equipment was thoroughly cleaned prior to the start of the study and
in between treatments. To clean each piece of equipment, Lockout/Tagout procedures were
28
followed to comply with the Occupational Safety & Health Administration’s (OSHA)
regulations. First, the complete system was shut down and the corresponding equipment was
LOTO. The paddle mixer was cleaned using compressed air and a scraper to remove the excess
of material buildup from the walls and paddles. Subsequently, a vacuum cleaner was used to
vacuum the scrap material. Due to the inaccessibility of the drag conveyor and given its self-
cleaning characteristics, the drag conveyor was clean by simply letting it run with no load for
five minutes. To clean the bucket elevator, the boot section panels were removed and the whole
boot section was vacuumed out. Also, the spout that transfers the material into the finished
product bin was opened and scraped to remove material buildup. To clean the finished product
bin, a rubber mallet was used to hit the bin and dislodged any material remaining on the bin
walls and on the bin bottom. All of this material buildup excess was collected from the finished
product bin and disposed off. The sampling probes were also cleaned prior and after each
treatment. The multi-port sample probe (Burrows Equipment Co., Evanston, IL) and a plastic
scoop were cleaned using a damped clean cloth and then dried using compressed air.
To prepare a batch, macro-ingredients were first measured and added into the mixer using
a batching system. After that, minor- and micro-ingredients, as well as the feed additive (i.e.,
nicarbazin) were hand weighed and added to the mixer at the same location across treatments to
ensure consistency. The mix cycles included a dry mix and a wet mix. After the addition of all
the dry ingredients, the dry mix began and continued for 120 s. The wet mix began immediately
after and continued for 180 s while soybean oil was being pumped into the mixer through
internal spray nozzles.
Two 454.5 kg (1,000 lb) batches of the medicated diet (Table 2.1) were prepared prior to
the start of the study using Nicarb® 25%. Medicated feed was prepared in excess and re-used to
29
ensure the same nicarbazin level in all the treatments and to replace loss in sampling and
carryover. After the mix cycles, each batch was discharged from the mixer and conveyed by the
drag conveyor into a bucket elevator, and then distributed into the finished product bin. After the
complete transfer of both batches into the finished product bin, the medicated diet was bagged in
22.7 kg (50 lb) bags and set aside. The system was then thoroughly cleaned as previously
described.
To contaminate the system, 454.5 kg (1,000 lb) of the previously prepared medicated diet
was added to mixer and re-mixed for 120 s. A composite sample was then taken of six different
sampled locations in the mixer using the multi-port sample probe. The medicated diet was then
discharged from the mixer and conveyed by the drag conveyor into a bucket elevator, and then
distributed into the finished product bin. After the medicated diet transferred completely into the
finished product bin, it was bagged in 22.7 kg (50 lb) bags and set aside to re-use later.
Corn was ground to an approximate particle size of 500 microns using a hammer mill
(Jacobson, Minneapolis, MN) with a 0.32 cm (1/8 inch) diameter screen, and used as the flushing
material. The quantity of flush material used for each treatment was weighed out using the
batching system and mixed for 120 s. After mixing, the flush material was discharged from the
mixer, conveyed by the drag conveyor into a bucket elevator, and then distributed into the
finished product bin. Once the flush had transferred completely into the finished product bin, it
was bagged in 22.7 kg bag(s). A composite sample was collected from bag(s) using the multi-
port sample probe.
Following the flush, a 227.3 kg (500 lb) non-medicated diet (Table 2.1) was batched.
After the mix cycles, a composite sample was taken of six different sampled locations in the
mixer using the multi-port sample probe. The non-mediated diet was also sampled at the drag
30
conveyor and bucket elevator discharges as it was being conveyed through the system.
Composite samples for the drag conveyor and bucket elevator were collected at 15, 30 and 45 s
after the non-medicated diet started discharging the equipment. After the complete transfer of the
non-medicated diet, it was placed in 22.7 kg (50 lb) bags. A composite sample was collected
from bags 1-9 using the multi-port sample probe. The system was then thoroughly cleaned as
previously described to start the next treatment. Treatments were randomly assigned an order for
each of the three replications.
All composite samples from the mixer, drag conveyor discharge, bucket elevator
discharge, and finished product were split using a riffler, and approximately 227.3 g (0.50 lb)
were collected for nicarbazin analysis.
Laboratory Analysis. Samples were sent to a commercial laboratory (Eurofins
Laboratories, Portage, MI) for nicarbazin analysis immediately after the study. Analysis was
performed using the quantitation of nicarbazin in medicated feed articles by HPLC using Elanco
B05511. Nicarbazin was extracted from 40 g of the medicated feed article using 200 mL of
80:20 ACN:Water. An aliquot of the extract was filtered and assayed using reverse-phase
isocratic method, which measures the DNC moiety at a wave length of 340 nm. Nicarbazin
concentration was reported based on an assumed equivalence of DNC and Nicarbazin. The
lowest detection limit in the feed samples for the laboratory’s nicarbazin assays was 1 ppm.
Statistical Analysis. The study was designed as a 5 × 4 factorial (flush size × sampling
location) arrangement of treatments. GLM procedures of the SAS Institute (SAS Institute, 2003)
were used to detect significant differences (P < 0.05) between treatments. When significant
differences were detected, least square means were used for means separation at α = 0.05.

31
Results and Discussion
Drug levels of samples taken at the mixer for the medicated diets (Figure 2.3; Table 2.2)
were very close to those formulated. Regulatory agencies set drug assay limits for each approved
drug. Nicarbazin’s assay limit is 85-115 percent of the labeled amount (125 ppm) for a Type B or
Type C medicated feed, resulting in a range of 106.3-143.8 ppm. All treatments were within
nicarbazin assays limits for this study. Laboratory drug assays’ accuracy was ± 0.01 ppm, with
values less than 1 ppm considered non-detectable levels of nicarbazin in feed samples.
The need of accurate drug levels in medicated feed is crucial. Inaccurate inclusion of a
drug into medicated diet can cause the drug to be ineffective or detrimental to the animal. Diets
formulated with a nicarbazin concentration between 50-200 mg/kg allows for good growth and
feed conversion in broilers. However, concentrations between 400-600 mg/kg will decrease the
bird’s body weight gain and lower its feed efficiency, and concentrations up to 1,500 mg/kg will
increase the mortality rate. Laying birds are the most susceptible to nicarbazin. A decrease in
hatchability and egg shell pigmentation can be observed when laying hens are fed contaminated
diets with nicarbazin levels as low as 50 mg/kg (Jones, 1990). Concentrations of nicarbazin of up
to 125 mg/kg reduce the hen’s egg production, as well as affecting the egg’s weight and yolk
appearance (Jones et al., 1990). Booth and McDonald (1982) observed that nicarbazin caused a
65% egg production reduction, and completely inhibited the egg hatchability when fed at a
concentration of 125 mg/kg.
Table 2.2 shows the effect of flush size on nicarbazin carryover in sampling locations
throughout the feed manufacturing process. It was observed that as the quantity of flush material
used to flush the system increased, the nicarbazin concentration decreased (Figure 2.4). This
demonstrates a dilution effect as a result of an increase in flush size used to cleanout the
32
manufacturing system. These drug concentrations represent the amount of carryover to the
subsequent batches if sequencing was used as the cleanout procedure. However, none of the
treatments would exceed drug residue guidelines because, due to economical implications, feed
manufacturers generally prepare no less than 454.55 kg (1,000 lb) of feed per batch. This would
set the nicarbazin concentrations for all treatments below the guidelines for feed. European
researchers have reported that feed contaminated with 2.0 ppm and 2.5 ppm of nicarbazin was
sufficient to exceed both egg DAL and liver MRL respectively (Cannavan et al., 2000; Cannavan
and Kennedy, 2000).
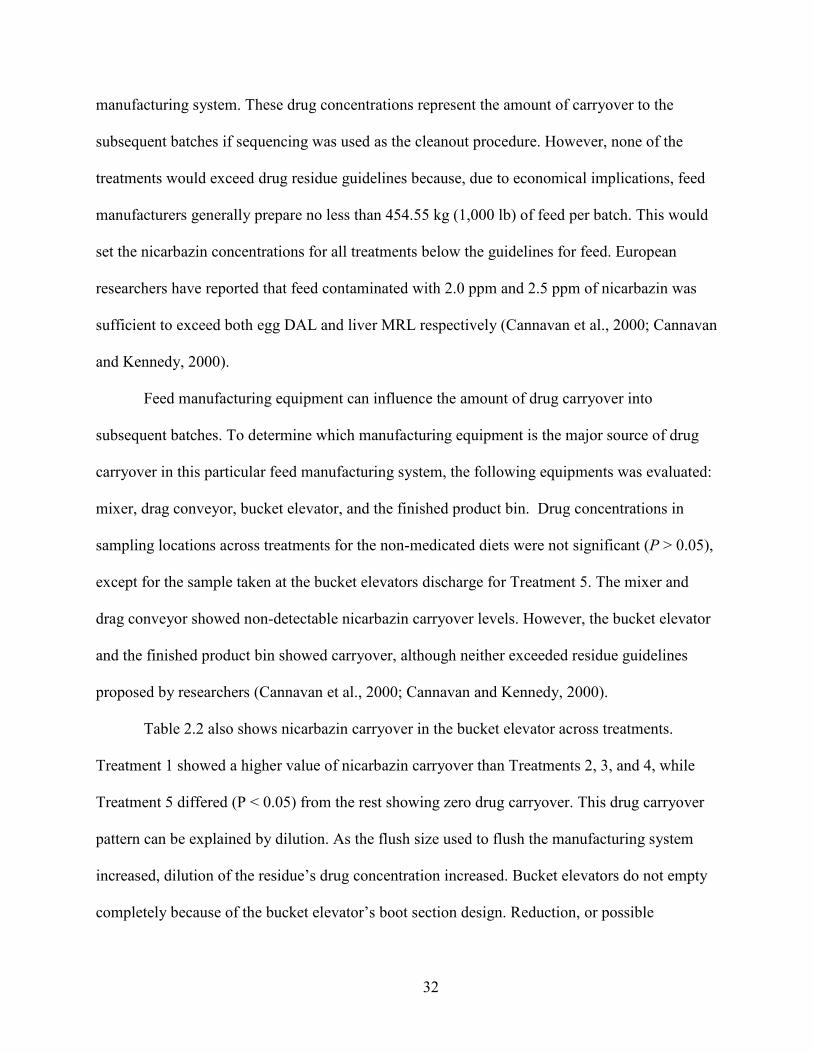
Feed manufacturing equipment can influence the amount of drug carryover into
subsequent batches. To determine which manufacturing equipment is the major source of drug
carryover in this particular feed manufacturing system, the following equipments was evaluated:
mixer, drag conveyor, bucket elevator, and the finished product bin. Drug concentrations in
sampling locations across treatments for the non-medicated diets were not significant (P > 0.05),
except for the sample taken at the bucket elevators discharge for Treatment 5. The mixer and
drag conveyor showed non-detectable nicarbazin carryover levels. However, the bucket elevator
and the finished product bin showed carryover, although neither exceeded residue guidelines
proposed by researchers (Cannavan et al., 2000; Cannavan and Kennedy, 2000).
Table 2.2 also shows nicarbazin carryover in the bucket elevator across treatments.
Treatment 1 showed a higher value of nicarbazin carryover than Treatments 2, 3, and 4, while
Treatment 5 differed (P < 0.05) from the rest showing zero drug carryover. This drug carryover
pattern can be explained by dilution. As the flush size used to flush the manufacturing system
increased, dilution of the residue’s drug concentration increased. Bucket elevators do not empty
completely because of the bucket elevator’s boot section design. Reduction, or possible
33
elimination, of drug carryover can be achieved by using a self-cleaning boot section. Self-
cleaning boot sections are designed with a reduced bucket-to-base clearance for minimal material
residue, hence a reduction in drug carryover. Wear in conveying systems can also become a
source for drug carryover, as reduced flow in specific areas tends to accumulate the material
being conveyed.
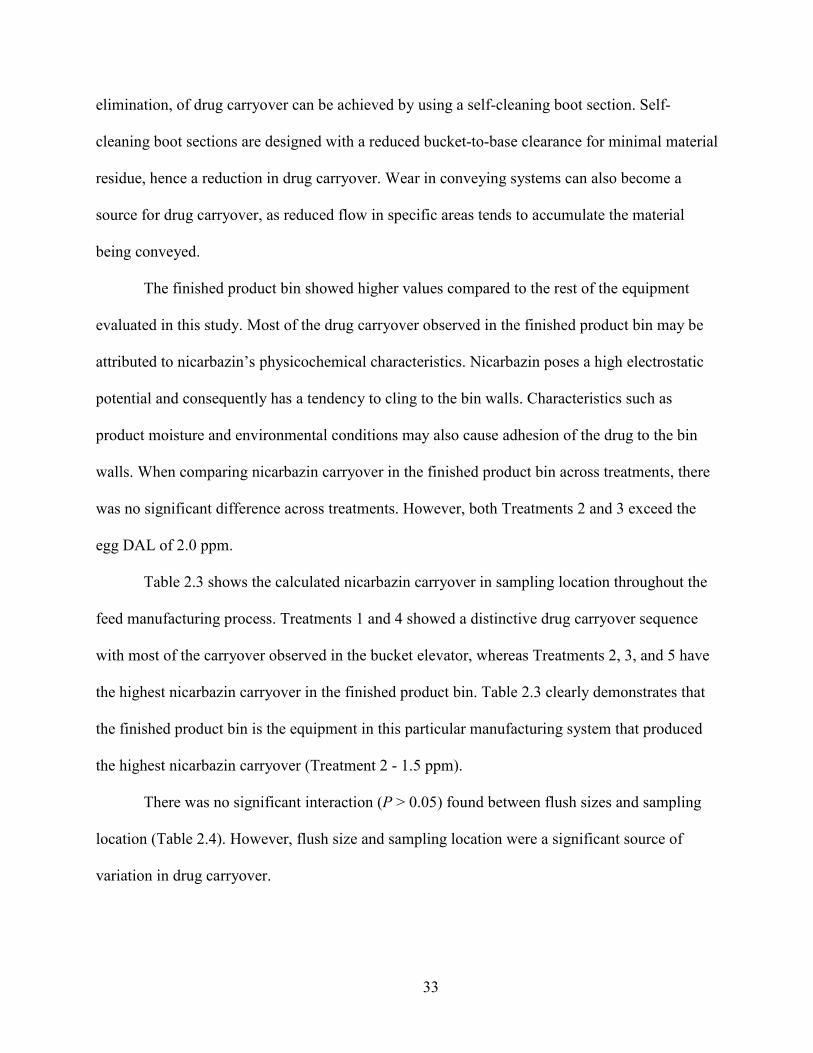
The finished product bin showed higher values compared to the rest of the equipment
evaluated in this study. Most of the drug carryover observed in the finished product bin may be
attributed to nicarbazin’s physicochemical characteristics. Nicarbazin poses a high electrostatic
potential and consequently has a tendency to cling to the bin walls. Characteristics such as
product moisture and environmental conditions may also cause adhesion of the drug to the bin
walls. When comparing nicarbazin carryover in the finished product bin across treatments, there
was no significant difference across treatments. However, both Treatments 2 and 3 exceed the
egg DAL of 2.0 ppm.
Table 2.3 shows the calculated nicarbazin carryover in sampling location throughout the
feed manufacturing process. Treatments 1 and 4 showed a distinctive drug carryover sequence
with most of the carryover observed in the bucket elevator, whereas Treatments 2, 3, and 5 have
the highest nicarbazin carryover in the finished product bin. Table 2.3 clearly demonstrates that
the finished product bin is the equipment in this particular manufacturing system that produced
the highest nicarbazin carryover (Treatment 2 - 1.5 ppm).
There was no significant interaction (P > 0.05) found between flush sizes and sampling
location (Table 2.4). However, flush size and sampling location were a significant source of
variation in drug carryover.
34
Conclusions
In conclusion, a suitable interrelationship between the flush size and the level of
nicarbazin carryover throughout a feed manufacturing system was established. All of the flushes
prevented significant carryover. The use of a 2.5% flush size proved more effective than a 5%
and 10% flush size, and almost as effective as a 15% and 20% flush size. Also, the bucket
elevator and the finished product bin were identified among the feed manufacturing equipment
as the major sources of nicarbazin carryover in this particular manufacturing system.
Given that this data is only valid for this particular manufacturing system, further
research is necessary to validate this study and to evaluate different flushing cleanout procedures,
such as using double flushing. In addition, different manufacturing equipment should be
addressed as well as different manufacturing process flows. Equipment such as single discharge
mixer, ribbon mixers, screw conveyors, pellet mills, coolers, among others, should be evaluated
as sources of drug carryover. Different manufacturing process flows should also be studied to
evaluate the equipment’s probability of becoming a source of drug carryover with respect to its
location in the manufacturing process.
35
Figure 2.1 Chemical structure of the components of nicarbazin (adapted from Conway and
McKenzie, 2007)
36
Figure 2.2 Manufacturing flow process used in Experiment 1
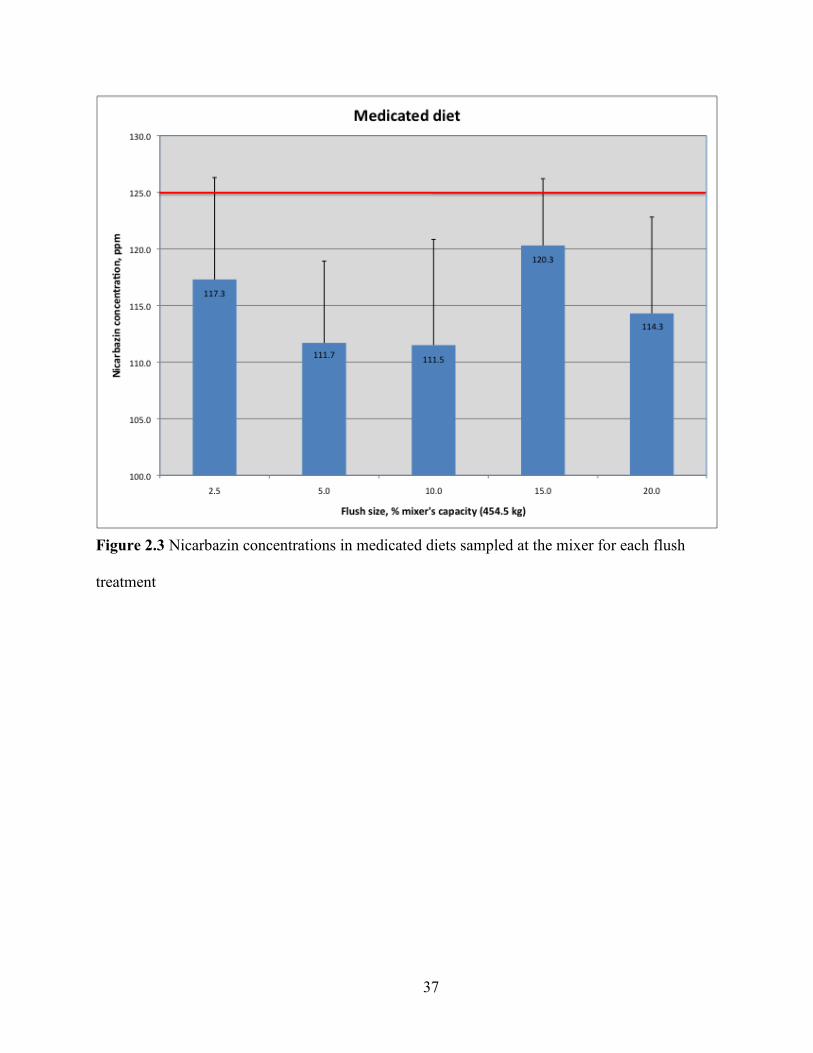
Figure 2.3 Nicarbazin concentrations
treatment
37
concentrations in medicated diets sampled at the mixer for each flush sampled at the mixer for each flush
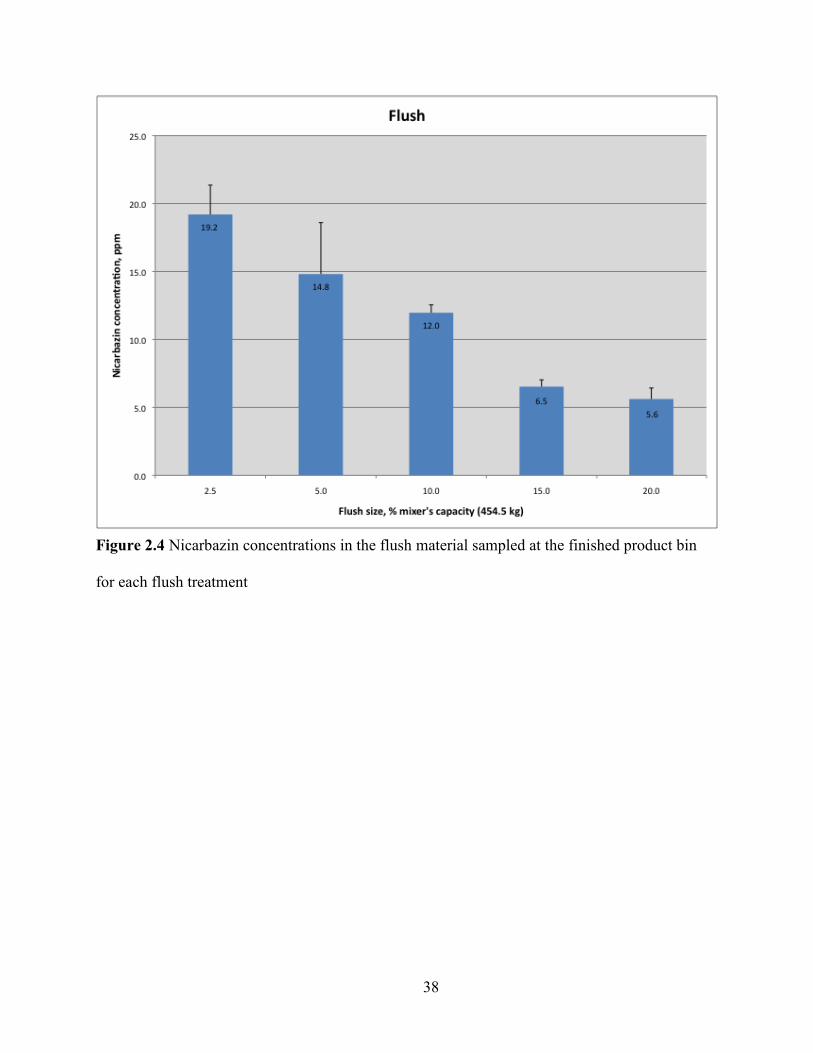
Figure 2.4 Nicarbazin concentrations
for each flush treatment
38
Nicarbazin concentrations in the flush material sampled at the finished product bin finished product bin
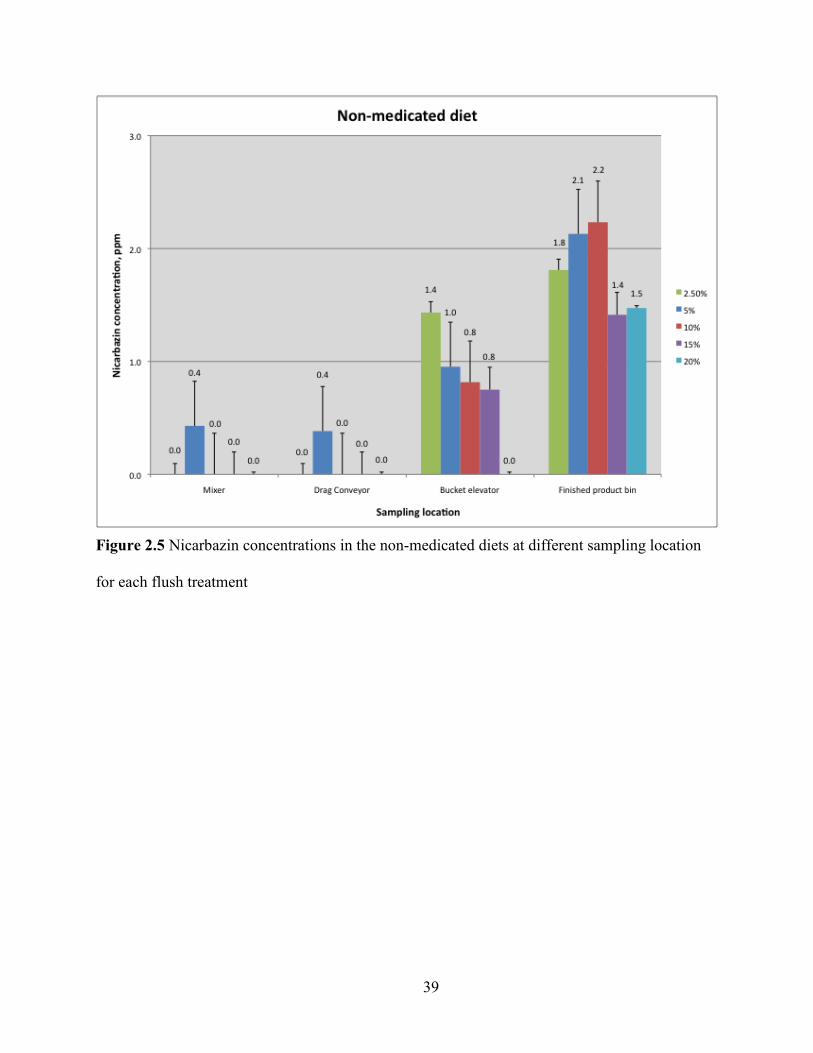
Figure 2.5 Nicarbazin concentrations
for each flush treatment
39
Nicarbazin concentrations in the non-medicated diets at different sampling locationsampling location
40
Table 2.1 Diets used in Experiment 1 to evaluate nicarbazin carryover
Medicated Non-Medicated
Ingredients %
Major-ingredient(s)
Corn 68.89 68.94
Soybean meal 20.40 20.40
Minor-ingredient(s)
Fish meal 5.50 5.50
Micro-ingredient(s)
Di-calcium phosphate 0.51 0.51
Limestone 0.58 0.58
Salt 0.33 0.33
DL-Methionine 0.31 0.31
Lysine 0.18 0.18
Poultry Vit/Min premix 0.25 0.25
Liquid-ingredient(s)
Soybean oil 3.00 3.00
Feed additive(s)
Nicarb® 25% 0.05 0.00
Total 100.00 100.00
41
Table 2.2 Effects of flush size on nicarbazin carryover in sampling locations throughout the feed
manufacturing process
Flush treatments, % of mixer capacity2
Type of batch
Sampling location
2.5 5.0 10 15 20 SEM3
ppm1
Medicated diet
Mixer 117.3a 111.7
a 111.5
a 120.3
a 114.3
a 8.09
Flush
Finished product bin 19.2b 14.8
b,c 12.0
b,c 6.5
c 5.6
c 2.01
Non-medicated diet
Mixer 0.0d,x
0.4d,x
0.0d,x
0.0d,x
0.0d,x
0.19
Drag conveyor 0.0d,x
0.4d,x
0.0d,x
0.0d,x
0.0d,x
0.17
Bucket elevator 1.4e,x
1.0e,x
0.8e,x
0.8e,x
0.0d,y
0.33
Finished product bin 1.8e,x
2.1e,x
2.2f,x
1.4e,x
1.5e,x
0.31
1 Nicarbazin carryover concentrations are means (n = 3) in ppm, with limit of detection ± 1 ppm
2 Forberg 454.5 kg (1,000 lb) capacity drop bottom paddle mixer
3 Pooled SEM (n = 3) of the five flush size treatments by rows
a Means within the row with different superscript differ (P < 0.05)
b-c Means within the row with different superscript differ (P < 0.05)
d-f Means within the non-medicated diet columns with different superscript differ (P < 0.05)
x-y Means within the non-medicated diet rows with different superscript differ (P < 0.05)

42
Table 2.3 Calculated nicarbazin carryover in sampling location throughout the feed
manufacturing process
Flush Treatments, % of mixer capacity1
Type of batch
Sampling location
2.5 5.0 10 15 20
ppm2
Non-medicated diet
Mixer 0.0 0.4 0.0 0.0 0.0
Drag conveyor 0.0 0.0 0.0 0.0 0.0
Bucket elevator 1.4 0.6 0.8 0.8 0.0
Finished product bin 0.4 1.5 1.4 0.6 1.5
Total nicarbazin carryover 1.8 2.1 2.2 1.4 1.5
1 Forberg 454.5 kg (1,000 lb) capacity drop bottom paddle mixer
2 Nicarbazin concentrations are calculated differences between two locations within treatments

43
Table 2.4 Pair-wise comparison of sampling location and flush size of non-medicated
diet treatments in Experiment 1
Sources of Variation P < 0.051
Flush size 0.0185
Sampling location < 0.0001
Flush size × Sampling location 0.3110
1 Significant differences detected using least square means for mean separation at α = 0.05
44
References
Cannavan, A., Ball, G., and D. G. Kennedy. 2000. Nicarbazin contamination in feeds as a cause
of residues in eggs. Food Addit. Contam. 17:829-836.
Cannavan, A., and D. G. Kennedy. 2000. Possible causes of nicarbazin residues in chicken
tissues. Food Addit. Contam. 17:1001-1006.
Chapman, H. D. 1994. A review of the biological activity of the anticoccidial drug nicarbazin
and its application for the control of coccidiosis in poultry. Poult. Sci. Rev. 5:231-243.
Conway, D. P., and M. E. McKenzie. 2007. Poultry coccidiosis: diagnostic and testing
procedures. 3rd ed. Blackwell Pub., Ames, Iowa.
Cuckler, A. C., Malanga C. M., Basso A. J., and R. C. O’Neill. 1955. Antiparasitic activity of
substituted carbanilide complexes. Science 122:244-245.
Eurofins Animal Health. 2007. Standard Operating Procedure. PHB-102.01. Portage, MI
FAO/WHO (Food and Agriculture Organization/World Health Organization). 1999. Evaluation
of certain veterinary drug residues in food. Fiftieth report of the Joint FAO/WHO Expert
Committee on Food Additives, WHO Technical Report Series 888.
Food and Drug Administration, Department of Health and Human Services. 1975. Tolerances for
residues of new animal drugs. 21 CFR part 556. Fed. Regist. 40:13942.
Food and Drug Administration, Department of Health and Human Services. 1976. Current Good
Manufacturing Practice for Medicated Feeds. 21CFR part 225.65. Fed. Regist. 41:52618.
Food and Drug Administration, Department of Health and Human Services. 2007a. Current
Good Manufacturing Practice for Medicated Feeds. 21CFR part 225.1. Fed. Regist.
72:69120.
45
Food and Drug Administration, Department of Health and Human Services. 2007b. Current
Good Manufacturing Practice for Type A Medicated Articles. 21 CFR part 226.1. Fed.
Regist. 72:69120.
Food and Drug Administration, Department of Health and Human Services. 2008. New Animal
Drugs for Use in Animal Feeds. 21 CFR part 558.3. Fed. Regist. 73:15884.
Gardiner, J. L., and D. K. McLoughlin. 1963. The comparative activity of certain coccidiostats in
experimental Eimeria tenella infections. Poultry Sci. 42:932-935.
Hughes, B. L., Jones, J. E., J. E. Toler, J. Solis, and D. J. Castaldo. 1991. Effects of exposing
broiler breeders to nicarbazin contaminated feed. Poult. Sci. 70:476-482.
Johnston, J. J., Britton, W. M., MacDonald, A., Primus, T. M., Goodal, M. J., Yoder, C. A.,
Miller, L. A., and K. A. Fagerstone. 2002. Quantification of plasma and egg 4,4'-
dinitrocarbanilide (DNC) residues for the efficient development of a nicarbazin-based
contraceptive for pest waterfowl. Pest. Manag. Sci. 58:197-202.
Jones, J. E., Solis, J., Hughes, B. L., Castaldo, D. J., and J. E. Toler. 1990. Production and egg-
quality responses of White Leghorn layers to anticoccidial agents. Poult. Sci. 69:378-387.
Long, P. L. 1982. The biology of the coccidia. Page 396. University Park Press, Baltimore,
Maryland.
McLoughlin, D. K., and D. K. Chester. 1959. The comparative efficacy of six anticoccidial
compounds. Poultry Sci. 38:353-355.
McLoughlin, Gardiner, J. L., and D. K. Chester. 1960. The activity of glycarbylamide,
Trithiadol, and nicarbazin against Eimeria tenella in chickens. Poultry Sci. 39:1328-1332.
Newberne, P. M., and W. B. Buck. 1957. Studies on drug toxicity in chicks 3. The influence of
various levels of nicarbazin on growth and development of chicks. Poult. Sci. 36:304-311.

46
NRC (National Research Council). Board on Agriculture. Panel on Animal Health, Food Safety,
and Public Health. Committee on Drug Use in Food Animals. 1999. The use of drugs in food
animals: benefits and risks. National Academy Press, Washington, D.C.
Ott, W. H., Kuna, S., Porter, C. C., Cuckler, A. C., and D. E. Fogg. 1956. Biological studies on
nicarbazin, a new anticoccidial agent. Poult. Sci. 35:1355-1367.
Rogers, E. F., Brown, R. D., Brown, J. E., Kazazis, D. M., Leanza, W. J., Nichols, J. R., Ostlind,
D. A., and T. M. Rodino. 1983. Nicarbazin complex yields dinitrocarbanilide as ultrafine
crystals with improved anticoccidial activity. Science. 222:630-632.
Rubin, R., McLoughlin, D. K., Costello, L. C., and E. E. Wehr. 1956. The efficacy of nicarbazin
as a prophylactic drug in cecal coccidiosis of chickens. Poultry Sci. 35:856-860.
SAS Inst., Inc. 2003 Version 9.1. SAS Inst., Inc., Cary North Carolina.
Sherwood, D. H., Milby, T. T., and W. A. Higgins. 1956. The effect of nicarbazin on
reproduction in White Rock breeder hens. Poultry Sci. 35:1014.
VerCauteren, K. C., Pipas, M. J., and K. L. Tope. 2001. Evaluation of nicarbazin-treated pellets
for reducing the laying and viability of Canada goose eggs. Proc. 9th Wildlife Management
Conference.
47
CHAPTER 3 - Evaluating Flushing Procedures to Prevent
Monensin Carryover during Medicated Feed Manufacturing
Feed manufacturers produce a broad range of feeds targeted to different animal species.
When facilities switch from one type of feed to the next, residues of the first batch will remain in
the production line and end up in the subsequent batch. The transfer of residues from one batch
to the subsequent batch is called carryover. Drug carryover is a form of feed contamination that
results when an animal drug gets transferred from one production batch to the subsequent batch
in unsafe levels. Drug carryover is undesirable given that it may have detrimental effects on the
animals and may result in above tolerance residue levels in the edible tissue of food-producing
animals. Drug carryover can occur during feed manufacturing, processing, or distribution. To
prevent drug carryover during feed manufacturing, all equipment that comes in contact with an
animal drug or medicated feed shall be subjected to effective cleanout procedures.
The FDA’s CGMP regulations serve as guidelines for medicated feed manufacturers to
ensure their products meet identity, strength, and quality standards. These regulations required
the implementation of adequate procedures for all equipment used to manufacture medicated
feed to avoid unsafe levels of drug contamination during feed manufacturing. The CGMP
regulations require medicated feed manufacturers to use one or more of the approved cleanout
procedure, such as cleaning, sequencing, and/or flushing to prevent unsafe contamination by
drug carryover (HHS-FDA, 1976).
The most effective cleanout procedure is considered the thorough cleaning of the
manufacturing system. However, sequencing and flushing are the most commonly used in the
feed industry. Flushing is typically used in low production facilities, which generally only have
48
one production line on which all the different animal species feeds are produced. The FDA
recommends using of 5 to 10 percent of the mixer’s total capacity as the flush material.
However, these quantities are based solely on recommendations with little data available to
support this practice. Consequently, establishing an interrelationship between flush size and drug
carryover is a practical necessity.
One of the most economically significant feed additives in the feed industry is monensin.
Monensin is a feed additive approved for use in animal feed. The FDA classifies monensin as a
Category I - Type A medicated article used for different animal species. Monensin is an
ionophore produced by the Streptomyces cinnamonensis strain. Typically fed as the sodium salt,
it is composed by 2-(5-ethyltetrahydro-5(tetrahydro-3-methyl-5-(tetrahydro-6-hydroxy-6-
hydroxymethyl)-3,5-dimethyl-2H-pyran-2-yl-2-furyl)-2-furyl)9-hydroxy-β-methoxy-a,g,2,8-
tetramethyl-1,6-diaoxaspiro(4,5)decane-7-butyric acid) (Figure 3.1; Conway and McKenzie,
2007).
In the United States, monensin is approved for different animal species, each at different
concentration levels. When monensin is used in broiler diets as the sole medication or in
combination with growth promoting drugs, it is approved to be included at a concentration of 90-
110 g/ton. This same concentration is approved for replacement chickens (intended for use as
caged layers) with a maximum use of 16 weeks. The FDA also approves the use of monensin in
cattle rations. If used as the sole medication, it prevents coccidiosis (0.14-0.42 mg/lb of
bodyweight), increases weight gain (25-400 g/ton), and improves feed efficiency (5-400 g/ton).
When combined with growth promoting drugs, it prevents coccidiosis (10-30 g/ton) and
improves feed efficiency (50-1,200 g/ton). Withdrawal periods when using monensin can be up
to seven days, depending on the monensin use level, the animal specie being fed, and if
49
monensin is used as a sole medication or in combination with other feed additives. Withdrawal
periods provide time for the concentration of active compound to fall below regulatory
guidelines. Feeding chickens does not require having a withdrawal period, although it may limit
feed intake resulting in reduced weight gain. Tolerances for monensin residues in cattle are set at
0.10 ppm for liver and 0.05 ppm for muscle, kidneys and fat (FDA-HHS, 1975). No tolerance for
monensin residue has been established in chickens.
Coccidia are a variety of single-celled, species-specific, parasitic organisms from the
subkingdom Protozoa of the phylum Apicomplexa (Long, 1982). Infection by coccidia parasites
that produce clinical manifestations of disease is called coccidiosis. Chickens are challenged by
the species of coccidia that belong to the genus Eimeria, specifically E. acervulina, E. maxima,
and E. tenella (Conway and McKenzie, 2007). Cattle are primarily challenged by E. bovis and E.
zuernii (EFSA, 2008).
Feeding monensin-contaminated feed may be detrimental to certain animal species.
Compared to nicarbazin, monensin does not have a major effect on a layer bird’s egg production,
although researchers have observed that monensin concentrations between 264-440 mg/kg will
cause layer birds to cease egg production (EFSA, 2008). Broilers present reduced body weight
gain when fed diets that have a monensin concentration of 250 mg/kg (EFSA, 2005). Horses are
the most susceptible to monensin (Matsuoka, 1976). Concentrations as low as 33 mg/kg may
cause temporary anorexia and concentrations up to 121 mg/kg will cause toxicity and subsequent
death (EFSA, 2008).
Accidental feeding of monensin-medicated feed to horses has been documented to result
in toxicity and death (Stoker, 1975; Matsuoka, 1976; Nava et al., 1978; Beck et al., 1979;
Whitlock et al., 1979; Muylle et al., 1981; Amend et al., 1985). Accidental feeding is a result of
50
drug carryover during feed manufacturing (Doonan et al., 1989). It was reported by the European
Food Safety Authority (2008) that horses that consume cattle feed (with a concentration of 33
mg/kg of monensin) would develop anorexia, whereas the consumption of broiler feed (with a
concentration of 121 mg/kg of monensin) would cause toxicity, resulting in death. Monensin
toxicity side effects in horses include anorexia, colic pain, sweating, tachycardia, uneasiness,
polyuria, progressive ataxia, recumbence, and death (EFSA, 2008). The high susceptibility of
horses to monensin is associated with a relative deficiency in demethylating enzymes, which
facilitate clearing monensin out of the animal’s system. Nebbia et al. (2001) showed that horses
have a low catalytic efficiency to demethylate monensin. For this reason, horse feeds should
never be batched immediately after feed that contains monensin, unless adequate measures were
taken to prevent drug carryover.
To reduce the risk of drug residue in animal food-products, manufacturing facilities in the
United States generally use one or more of the cleanout procedures (i.e., cleaning, sequencing,
and/or flushing) required by the FDA. Flushing is commonly used among the feed industry.
Generally, 5 to 10 percent of the mixer’s total capacity is used as the flush material. The present
study was designed to establish the relationship between the flush size and the level of monensin
carryover throughout a feed manufacturing system. This study may prove useful to establish
critical control points throughout the feed manufacturing process, as well as to develop strategies
to prevent drug carryover during medicated feed manufacturing.
Materials and Methods
Feed Manufacturing and Sampling procedures. Three flush size treatments (% of the
mixer’s capacity) were evaluated using three different Rumensin® 80 drug levels (100, 600, and
1,200 g/ton). Treatments were: 1) 1.0/100; 2) 1.0/600; 3) 1.0/1,200 4) 2.5/100; 5) 2.5/600; 6)
51
2.5/1,200 7) 5.0/100; 8) 5.0/600; and 9) 5.0/1,200. The study was conducted in the Feed
Processing Research Center in the Department of Grain Science & Industry at Kansas State
University. The feed manufacturing system included the following major equipment: a 454.5 kg
(1,000 lb) capacity drop bottom paddle mixer (Forberg, Hegdalveien, Larvik, Norway); a 3.79
kg/s (8.33 lb/s) capacity drag conveyor (Esmueller, Laurel, MS); a 19.96 MT/h (44,000 lb/h)
capacity bucket elevator (Hayes & Stolz, Forth Worth, Texas); a 11-position electric distributor;
and a 5.44 MT capacity finished product bin (Figure 3.2).
The manufacturing equipment was thoroughly cleaned prior to the start of the study and
in between treatments. To clean each piece of equipment, Lockout/Tagout procedures were
followed to comply with the Occupational Safety & Health Administration’s (OSHA)
regulations. First, the complete system was shut down and the corresponding equipment was
LOTO. The paddle mixer was cleaned using compressed air and a scraper to remove the excess
of material buildup from the walls and paddles. Subsequently, a vacuum cleaner was used to
vacuum the scrap material. Due to the inaccessibility of the drag conveyor and given its self-
cleaning characteristics, the drag conveyor was clean by simply letting it run with no load for
five minutes. To clean the bucket elevator, the boot section panels were removed and the whole
boot section was vacuumed out. Also, the spout that transfers the material into the finished
product bin was opened and scraped to remove material buildup. To clean the finished product
bin, a rubber mallet was used to hit the bin and dislodged any material remaining on the bin
walls and on the bin bottom. All of this material buildup excess was collected from the finished
product bin and disposed off. The sampling probes were also cleaned prior and after each
treatment. The multi-port sample probe (Burrows Equipment Co., Evanston, IL) and a plastic
scoop were cleaned using a damped clean cloth and then dried using compressed air.
52
To prepare a batch, macro-ingredients were first measured and added into the mixer using
a batching system. After that, minor- and micro-ingredients, as well as the feed additive (i.e.,
nicarbazin) were hand weighed and added to the mixer at the same location across treatments to
ensure consistency. The mix cycles included a dry mix and a wet mix. After the addition of all
the dry ingredients, the dry mix began and continued for 120 s. The wet mix began immediately
after and continued for 180 s while soybean oil was being pumped into the mixer through
internal spray nozzles.
Two 340.9 kg (750 lb) batches of the medicated diet (Table 3.1) were prepared prior to
the start of the study using Rumensin® 80 for each drug level (100, 600, 1,200 g/ton). Medicated
feed was prepared in excess and re-used to ensure the same nicarbazin level in all the treatments
and to replace loss in sampling and carryover. After the mix cycles, each batch was discharged
from the mixer and conveyed by the drag conveyor into a bucket elevator then distributed into
the finished product bin. After the complete transfer of both batches into the finished product
bin, the medicated diet was bagged in 22.7 kg (50 lb) bags and set aside. The system was then
thoroughly cleaned as previously described.
To contaminate the system, 454.5 kg (1,000 lb) of the previously prepared medicated diet
was added to mixer and re-mixed for 120 s. A composite sample was then taken of six different
locations in the mixer using the multi-port sample probe. The medicated diet was then
discharged from the mixer and conveyed by the drag conveyor into a bucket elevator, and then
distributed into the finished product bin. After the medicated diet transferred completely into the
finished product bin, it was bagged in 22.7 kg (50 lb) bags and set aside to re-use later.
Corn was ground to an approximate particle size of 500 microns using a hammer mill
(Jacobson, Minneapolis, MN) with a 0.32 cm (1/8 inch) diameter screen, and used as the flushing
53
material. The quantity of flush material used for each treatment was weighed out using the
batching system and mixed for 120 s. After mixing, the flush material was discharged from the
mixer, conveyed by the drag conveyor into a bucket elevator, and then distributed into the
finished product bin. Once the flush had transferred completely into the finished product bin, it
was bagged in 22.7 kg bag(s). A composite sample was collected from bags 1-9 using the multi-
port sample probe.
Following the flush, a 227.3 kg (500 lb) non-medicated diet (Table 3.1) was batched.
After the mix cycles, a composite sample was taken of six different locations in the mixer using
the multi-port sample probe. The non-mediated diet was also sampled at the drag conveyor and
bucket elevator discharges as it was being conveyed through the system. Composite samples for
the drag conveyor and bucket elevator were collected at 15, 30 and 45 s after the non-medicated
diet started discharging the equipment. After the complete transfer of the non-medicated diet, it
was placed in 22.7 kg (50 lb) bags and sampled. The system was then thoroughly cleaned as
previously described to start the next treatment. Treatments were randomly assigned an order for
each of the two replications.
All composite samples from the mixer, drag conveyor discharge, bucket elevator
discharge, and finished product were split using a riffler, and approximately 227.3 g (0.50 lb)
were collected for nicarbazin analysis.
Laboratory Analysis. Samples were sent to a commercial laboratory (Trilogy Analytical
Laboratory, Washington, MO) for monensin analysis. This was performed using the AOAC
Official Method 997.04. Samples were extracted as follows: 5 g of the sample was added to 200
ml extraction solution (90 + 10 methanol/water) and shook for 1 hour. Samples were then filtered

54
and injected onto the HPLC. The lowest detection limits in the feed samples for the laboratory’s
monensin assays was 1 ppm.
Statistical Analysis. The study was designed as a 3 × 4 × 3 factorial (flush size ×
sampling location × drug level) arrangement of treatments. GLM procedures of the SAS Institute
(SAS Institute, 2003) were used to detect significance differences (P < 0.05) between treatments.
When significant differences were detected, least squares means was used for means separation
at α = 0.05.
Results and Discussion
Drug levels of samples taken at the mixer for the medicated diet (Figure 3.3; Table 3.3)
were very close to those formulated. Regulatory agencies set drug assay limits for the production
of medicated feed. Monensin’s assay limit is 85-115 percent of the labeled amount (100, 600,
and 1,200 g/ton), resulting in a range of 77.4-104.7, 464.1-627.9 and 928.2-1,255.8 ppm,
respectively. Only Treatments 1, 2 and 5 were slightly outside of their respective range (Trt
1=105.9 ppm; Trt 3=125.2 ppm; Trt 5=677.0 ppm). This might be due to laboratory drug assays
sampling accuracy. Laboratory drug assays’ accuracy was ± 0.01 ppm, with values less than 1
ppm considered as non-detectable levels of monensin in feed samples.
The need of accurate drug levels in medicated feed is crucial because an inaccurate
inclusion of a drug into medicated diet can cause the drug to be ineffective or detrimental to the
animal. Laying birds feed on diets that have monensin concentrations between 264-440 mg/kg
will cause the birds to cease production and their feed intake would be greatly depressed (EFSA,
2008). Broiler fed monensin concentrations of 250 mg/kg may present reduced body weight gain
(EFSA, 2008), although reduced body weight can also be observed when no withdrawal period is
implemented in the feeding program for chickens. Non-targeted animals, such as horses, are the

55
most susceptible to monensin (Matsuoka, 1976). Concentration as lows as 33 mg/kg may cause
temporary anorexia, and concentrations up to 121 mg/kg will cause toxicity and subsequent
death (EFSA, 2008).
Table 3.3 shows the effect of flush size on monensin carryover in sampling location and
formulated monensin drug level throughout the feed manufacturing process. It was observed that
as the quantity of flush material used to flush the system increased, the monensin concentration
decreased (Figure 3.4). This dilution effect is a result of an increase in flush size used to cleanout
the manufacturing system. These drug concentrations represent the amount of carryover to
subsequent batches if sequencing was used as the cleanout procedure. However, none of the
treatments exceeded drug residue guidelines because, due to economical implications, feed
manufacturers generally prepare no less than 454.55 kg (1,000 lb) of feed per batch. This would
set the monensin concentrations for all treatments below the guidelines for feed.
The equipment used to manufacture feed can influence the amount of drug carryover into
subsequent batches. To determine which manufacturing equipment is the major source of drug
carryover in this particular feed manufacturing system, the following equipment was evaluated:
mixer, drag conveyor, bucket elevator, and the finished product bin. Figure 3.3 showed that the
data was mostly consist among the three formulated drug levels. The sampling location among
the three formulated drug levels that had the least carryover was the drag conveyor, with the
finished product bin being the major source of drug carryover. None of the treatments exceeded
tolerance limits (33 ppm) that may have detrimental effects to horses.
Monensin concentrations in non-medicated diets at each sampling location did not differ
(P > 0.05) between Treatments 1-3 (100 g/ton). These same treatments presented zero carryover
at the mixer and drag conveyor. There was a slight amount of carryover in the bucket elevator,
56
with the greatest amount of carryover in the finished product. Treatment 1 showed a higher
monensin concentration followed by Treatment 2 and then Treatment 3. Dilution of the residue’s
drug concentration can explain this carryover pattern. As the quantity of flush material used to
flush the system increases, dilution of the feed residue’s drug concentration increases. Monensin
concentrations in non-medicated diets for Treatments 4-6 (600 g/ton) differ significantly (P <
0.05) at the bucket elevator and finished product bin. This drug level (600 g/ton) was enough to
cause carryover in all sampling locations. In all of the equipment that presented carryover, the
1% flush size had the highest carryover, followed by 2.5%, and then 5%. These treatments
followed the same dilution pattern as Treatments 1-3. Monensin concentrations in non-medicated
diets for Treatments 7-9 (1,200 g/ton) did differ (P < 0.05) on all the sampling locations among
those treatments. These treatments presented carryover in all sampling locations, with
Treatments 8 and 9 showing a higher overall monensin concentration than Treatment 7.
Laboratory assay accuracy might have been the cause of this discrepancy.
Given that drop bottom mixers and drag conveyors are equipment that empty thoroughly
and are not identified as equipment with possible areas for residue accumulation, the carryover
present in Treatments 4-9 might be because of the high level of drug used to formulate the diet.
In the case of the bucket elevators, some bucket elevators do not empty completely because of
the design of the boot section. A reduction, or possible elimination, of drug carryover can be
achieved by using a self-cleaning boot section. Self-cleaning boot sections are designed with a
reduced bucket-to-base clearance for minimal material residue, hence a reduction in drug
carryover. Wear in conveying systems can also become a source of drug carryover, as reduced
flow in specific areas tends to accumulate the material being conveyed. Most of the drug
carryover observed in the finished product bin may be attributed to monensin’s physicochemical
57
characteristics, as well as product moisture and environmental conditions that may have caused
adhesion of the drug to the bin walls.
Table 3.4 shows the calculated monensin carryover in sampling location of all treatments.
Treatments 1, 4, and 6 showed a distinctive drug carryover sequence with most of the carryover
observed in the bucket elevator, whereas Treatments 2, 3, 5, 8, and 9 have the highest monensin
carryover in the finished product bin. Table 3.4 clearly demonstrates that the bucket elevator and
the finished product bin are the equipment in this particular manufacturing system that produced
the highest nicarbazin carryover.
There was no significant interaction (P > 0.05) found between sampling location and
flush size, and flush sizes and drug level (Table 3.5). However, sampling location, flush size,
drug level, and sampling location and drug level interaction were significant sources of variation
in drug carryover.
Conclusions
In conclusion, a suitable interrelationship between the flush size and the level of
monensin carryover throughout a feed manufacturing system was established. The use of a 1.0%
flush size proved effective, as did the rest of the flush sizes. Consequently, all the flushes
prevented significant carryover and none exceeded monensin tolerance limit (33 ppm) that may
cause detrimental effect to horses. Also, the bucket elevator and the finished product bin were
identified among the feed manufacturing equipment as the major sources of monensin carryover
in this particular manufacturing system.
Given that this data is only valid for this particular manufacturing system, further
research is necessary to validate this study and to evaluate different flushing cleanout procedures,
such as using double flushing. In addition, different manufacturing equipment should be

58
addressed as well as different manufacturing process flows. Equipment such as single discharge
mixer, ribbon mixers, screw conveyors, pellet mills, coolers, among others, should be evaluated
as sources of drug carryover. Different manufacturing process flows should also be studied to
evaluate the equipment’s probability of becoming a source of drug carryover with respect to its
location in the manufacturing process.
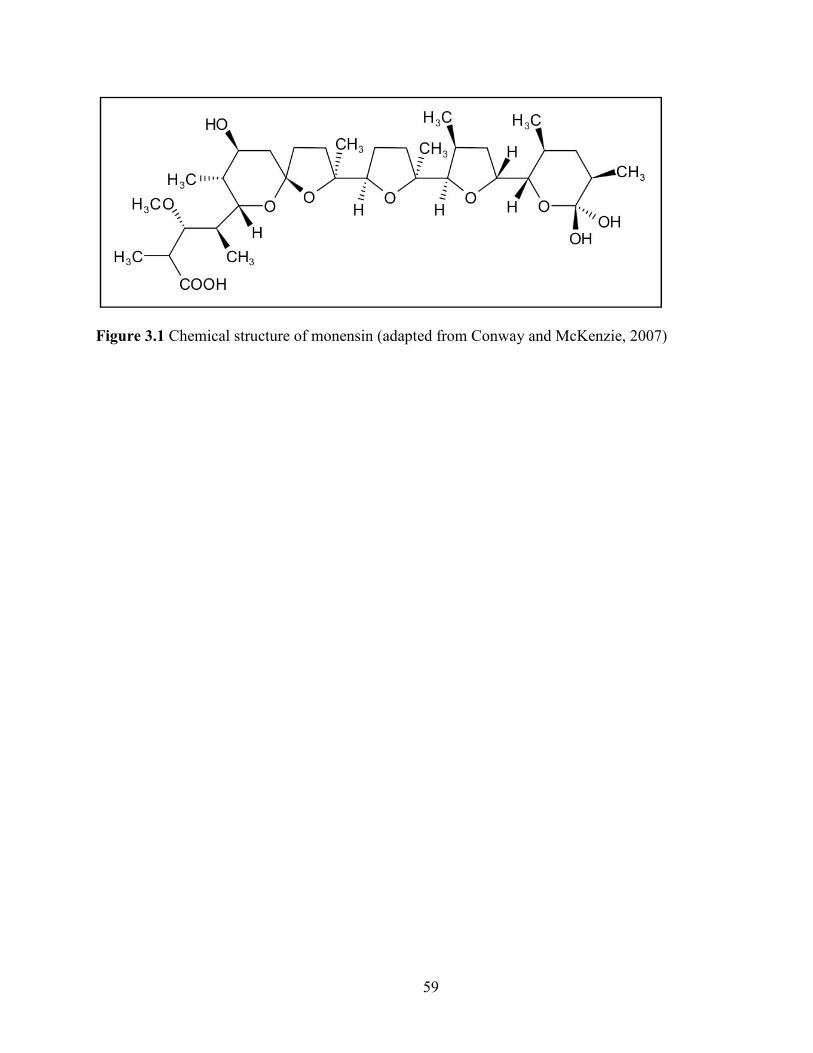
59
Figure 3.1 Chemical structure of monensin (adapted from Conway and McKenzie, 2007)
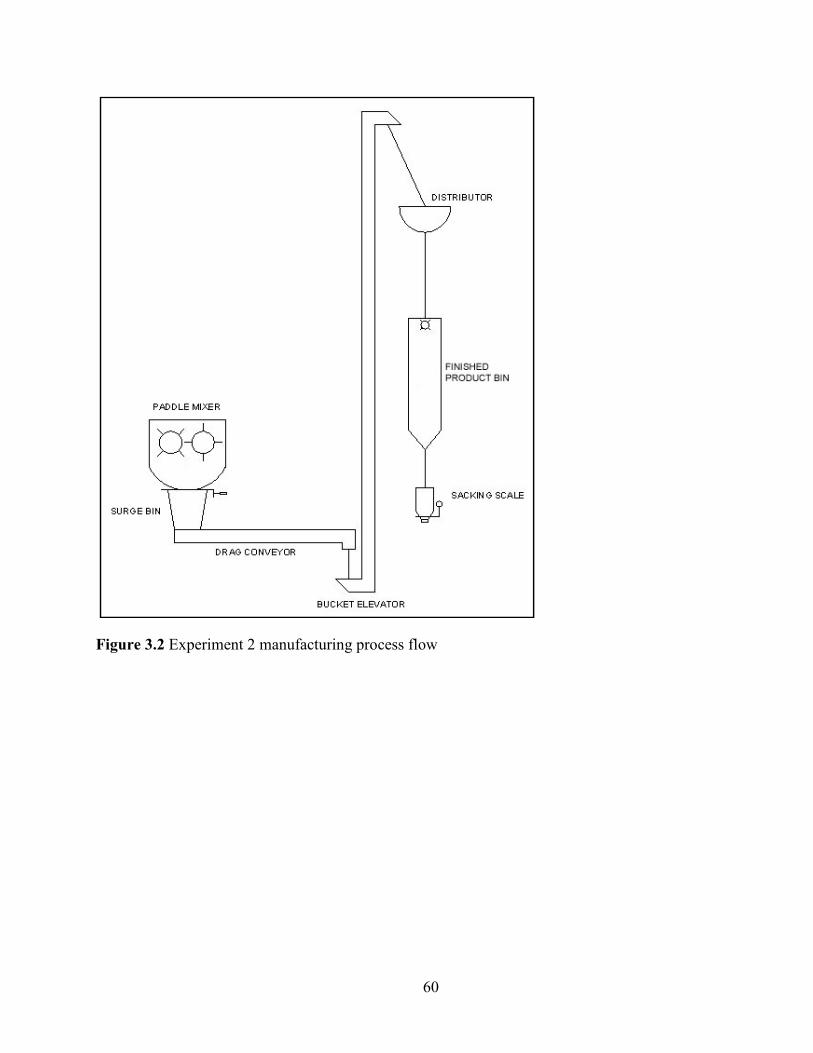
60
Figure 3.2 Experiment 2 manufacturing process flow
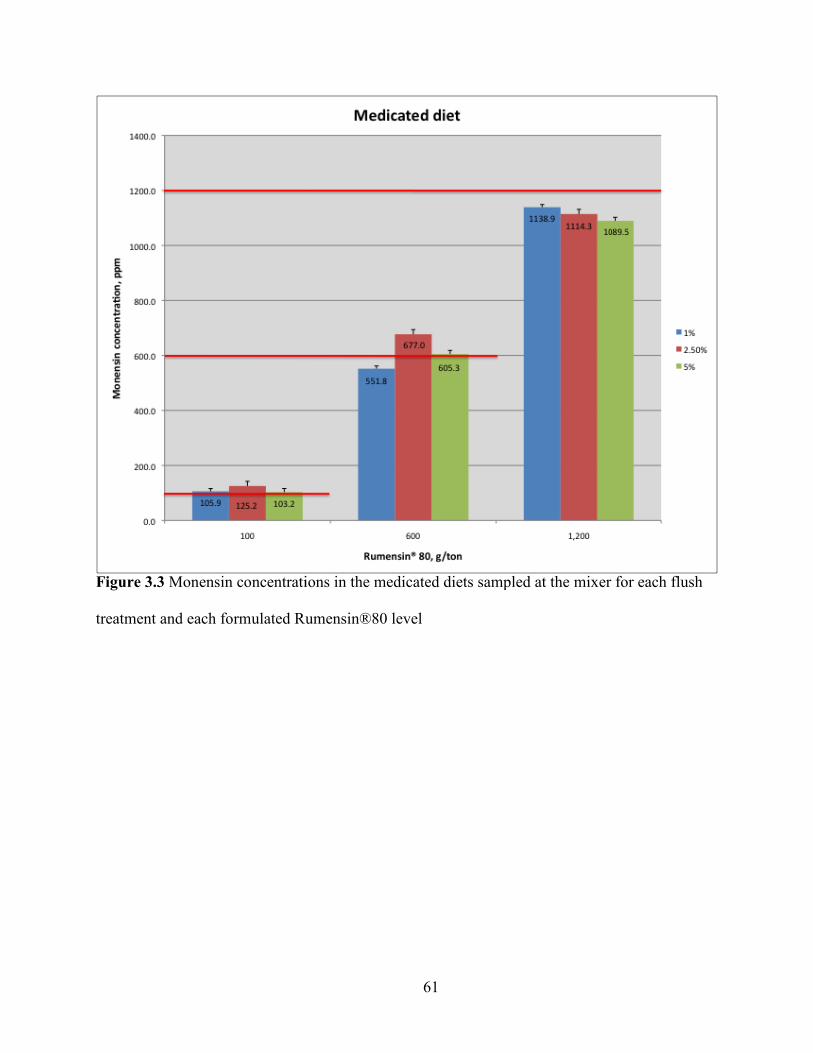
Figure 3.3 Monensin concentrations
treatment and each formulated Rumensin®80 level
61
Monensin concentrations in the medicated diets sampled at the mixer for each flush
and each formulated Rumensin®80 level
medicated diets sampled at the mixer for each flush

Figure 3.4 Monensin concentrations
each flush treatment and each formulated
62
Monensin concentrations in the flush material sampled at the finished product bin for
each flush treatment and each formulated Rumensin®80 level
in the flush material sampled at the finished product bin for
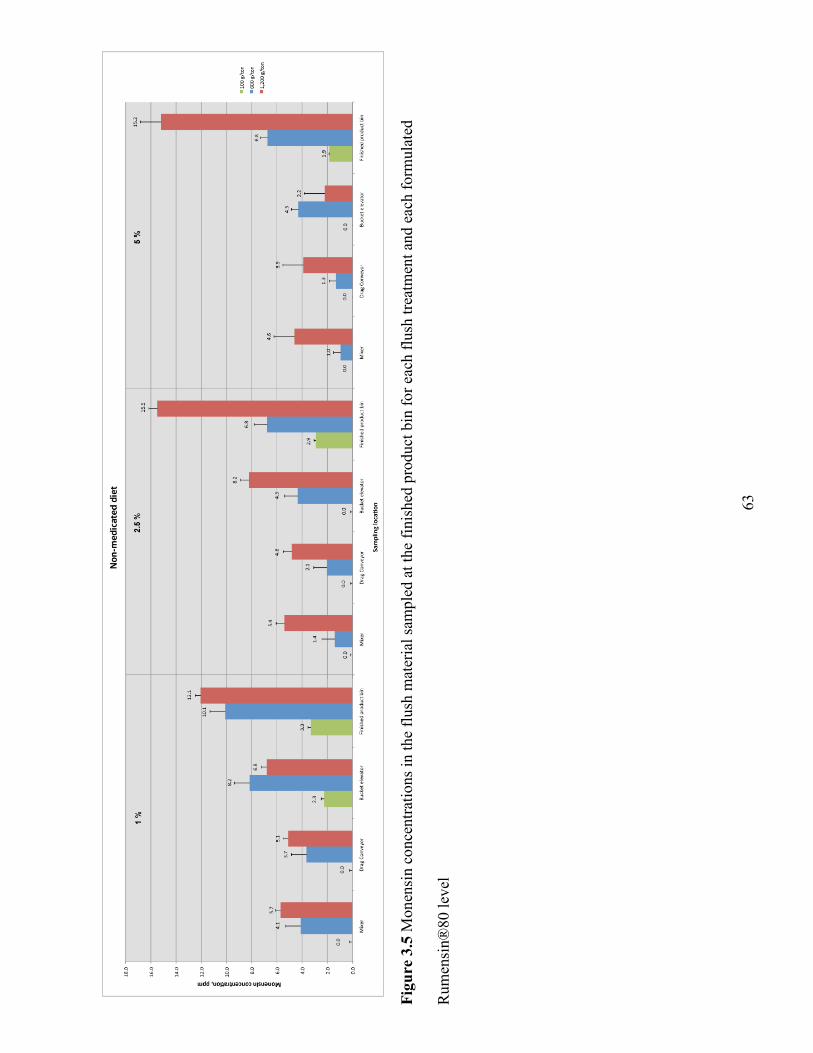
63
Figure 3.5
Mon
ensi
n c
once
ntr
atio
ns
in t
he
flush
mat
eria
l sa
mple
d a
t th
e fi
nis
hed
pro
duct
bin
for
each
flu
sh t
reat
men
t an
d e
ach f
orm
ula
ted
Rum
ensi
n®
80 l
evel

64
Table 3.1 Medicated diets used in Experiment 2 to evaluate
monensin carryover
Rumensin® 80, g/ton
Ingredients
100 600 1,200
%
Major-ingredient(s)
Corn 40.26 40.04 39.58
Minor-ingredient(s)
Limestone 25.49 25.49 25.49
Urea 20.76 20.76 20.76
Micro-ingredient(s)
Salt 4.96 4.96 4.96
Potassium chloride 4.16 4.16 4.16
KSU Beef trace mineral 0.73 0.73 0.73
Vitamin E-20 2.07 2.07 2.07
Vitamin A-30 0.15 0.15 0.15
Phosphate selenite 0.34 0.34 0.34
Liquid-ingredient(s)
Soybean oil 0.62 0.62 0.62
Feed additive(s)
Rumensin® 80 0.06 0.28 0.75
Tylan® 40 0.19 0.19 0.19
MGA® 200 0.21 0.21 0.21
Total 100.00 100.00 100.00
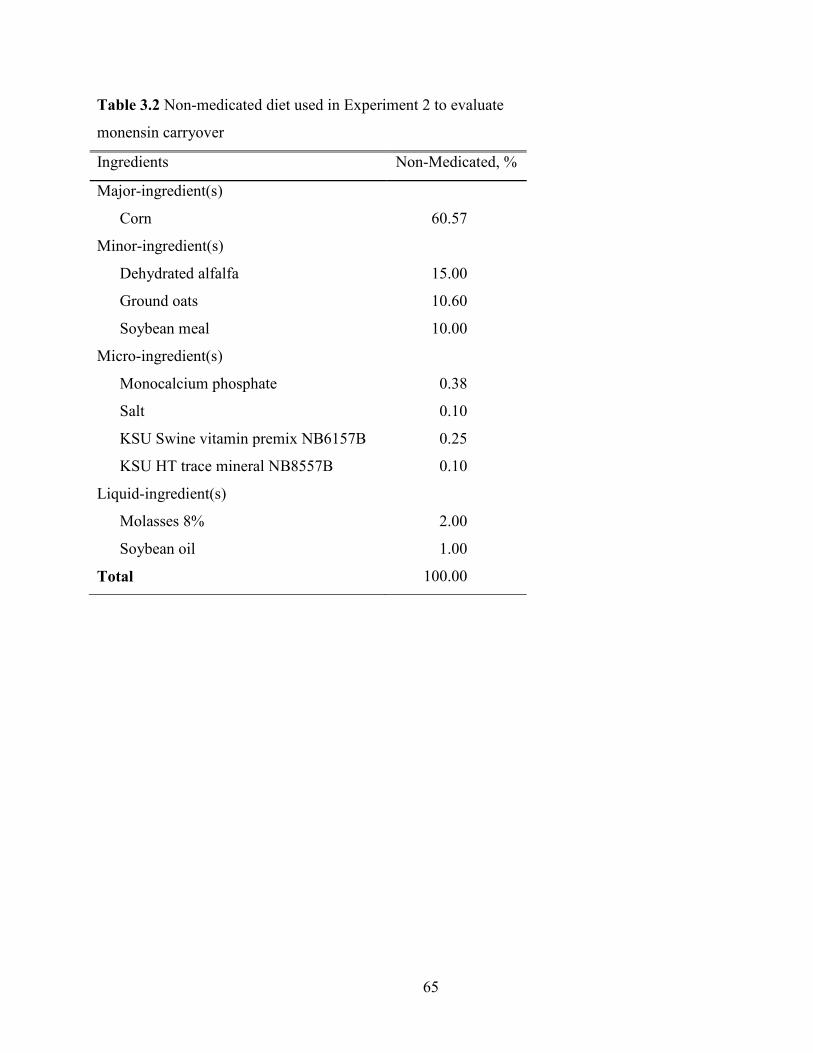
65
Table 3.2 Non-medicated diet used in Experiment 2 to evaluate
monensin carryover
Ingredients Non-Medicated, %
Major-ingredient(s)
Corn 60.57
Minor-ingredient(s)
Dehydrated alfalfa 15.00
Ground oats 10.60
Soybean meal 10.00
Micro-ingredient(s)
Monocalcium phosphate 0.38
Salt 0.10
KSU Swine vitamin premix NB6157B 0.25
KSU HT trace mineral NB8557B 0.10
Liquid-ingredient(s)
Molasses 8% 2.00
Soybean oil 1.00
Total 100.00

66
Table 3.3
Eff
ects
of
flush
siz
e on m
onen
sin c
arry
over
in s
ampli
ng l
oca
tion a
nd f
orm
ula
ted R
um
ensi
n®
80 l
evel
thro
ughout
the
feed
man
ufa
cturi
ng p
roce
ss
F
lush
Tre
atm
ents
, %
of
mix
er c
apac
ity
2
100 g
/ton
600 g
/ton
1,2
00 g
/ton
Type
of
bat
ch
Sam
pli
ng l
oca
tion
1.0
2.5
5.0
S
EM
3
1.0
2.5
5.0
S
EM
3
1.0
2.5
5.0
S
EM
3
pp
m1
Med
icat
ed d
iet
Mix
er
105.9
a 125.2
a 103.2
a 9.9
2
551.8
a 677.0
a 605.3
a 16.9
4
1,1
38.9
a 1,1
14.3
a 1,0
89.5
a 12.8
7
Flu
sh
Fin
ished
pro
duct
bin
77.3
b
19.0
c 8.4
c 4.9
3
243.0
b
90.6
c 33.6
c 8.3
7
409.1
b
184.4
b
98.0
b
37.0
3
Non-m
edic
ated
die
t
Mix
er
0.0
d,x
0.0
d,x
0.0
d,x
0.0
0
4.1
d,x
1.4
d,x
1.0
d,x
0.7
8
5.7
d,y
5.4
d,y
4.6
d,x
0.7
5
Dra
g c
onv
eyor
0.0
d,x
0.0
d,x
0.0
d,x
0.0
0
3.7
d,x
2.1
d,x
1.3
d,x
0.8
1
5.1
d,y
4.8
d,y
3.9
d,x
0.2
2
Buck
et e
levat
or
2.3
d,x
0.0
d,x
0.0
d,x
0.2
8
8.2
d,y
4.3
d,x
4.3
d,x
0.6
8
6.8
d,x
8.2
d,y
2.2
d,x
1.1
1
Fin
ished
pro
duct
bin
3.3
d,x
2.9
d,x
1.9
d,x
0.2
2
10.1
e,y
6.8
e,x
6.8
e,x
1.8
2
12.1
d,y
15.5
e,y
15.2
e,y
1.9
9
1 M
onen
sin c
arry
over
co
nce
ntr
atio
ns
are
mea
ns
(n =
2)
in p
pm
, w
ith l
imit
of
det
ecti
on ±
1 p
pm
2 F
orb
erg 4
54.5
kg (
1,0
00 l
b)
capac
ity d
rop b
ott
om
pad
dle
mix
er
3 P
oole
d S
EM
(n =
2)
of
the
thre
e fl
ush
siz
e tr
eatm
ents
by r
ow
s
a Mea
ns
wit
hin
the
row
foll
ow
ed b
y d
iffe
rent
lett
ers
are
signif
ican
tly d
iffe
rent
(P <
0.0
5)
b-c
Mea
ns
wit
hin
the
row
foll
ow
ed b
y d
iffe
rent
lett
ers
are
signif
ican
tly d
iffe
rent
(P <
0.0
5)
d-f M
eans
wit
hin
the
non-m
edic
ated
die
t co
lum
ns
foll
ow
ed b
y d
iffe
rent
lett
ers
are
signif
ican
tly d
iffe
rent
(P <
0.0
5)
x-y
Mea
ns
wit
hin
the
non-m
edic
ated
row
s fo
llow
ed b
y d
iffe
rent
lett
ers
are
signif
ican
tly d
iffe
rent
(P <
0.0
5)
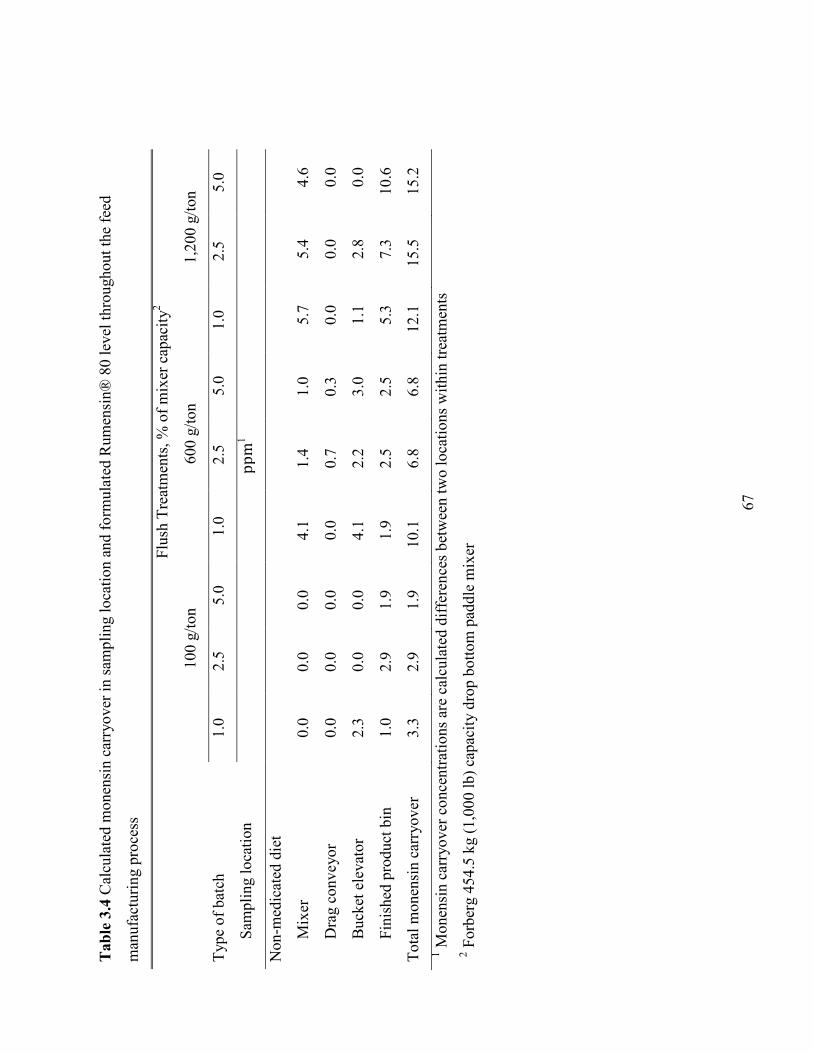
67
Table 3.4
Cal
cula
ted m
onen
sin c
arry
over
in s
amp
ling l
oca
tion a
nd f
orm
ula
ted R
um
ensi
n®
80 l
evel
thro
ughout
the
feed
man
ufa
cturi
ng p
roce
ss
F
lush
Tre
atm
ents
, %
of
mix
er c
apac
ity
2
100 g
/ton
600 g
/ton
1,2
00 g
/ton
Type
of
bat
ch
Sam
pli
ng l
oca
tion
1.0
2.5
5.0
1.0
2.5
5.0
1.0
2.5
5.0
pp
m1
Non-m
edic
ated
die
t
Mix
er
0.0
0.0
0.0
4.1
1.4
1.0
5.7
5.4
4.6
Dra
g c
onv
eyor
0.0
0.0
0.0
0.0
0.7
0.3
0.0
0.0
0.0
Buck
et e
levat
or
2.3
0.0
0.0
4.1
2.2
3.0
1.1
2.8
0.0
Fin
ished
pro
duct
bin
1.0
2.9
1.9
1.9
2.5
2.5
5.3
7.3
10.6
Tota
l m
onen
sin c
arry
ov
er
3.3
2.9
1.9
10.1
6.8
6.8
12.1
15.5
15.2
1 M
onen
sin c
arry
over
co
nce
ntr
atio
ns
are
calc
ula
ted d
iffe
ren
ces
bet
wee
n t
wo l
oca
tions
wit
hin
tre
atm
ents
2 F
orb
erg 4
54.5
kg (
1,0
00 l
b)
capac
ity d
rop b
ott
om
pad
dle
mix
er
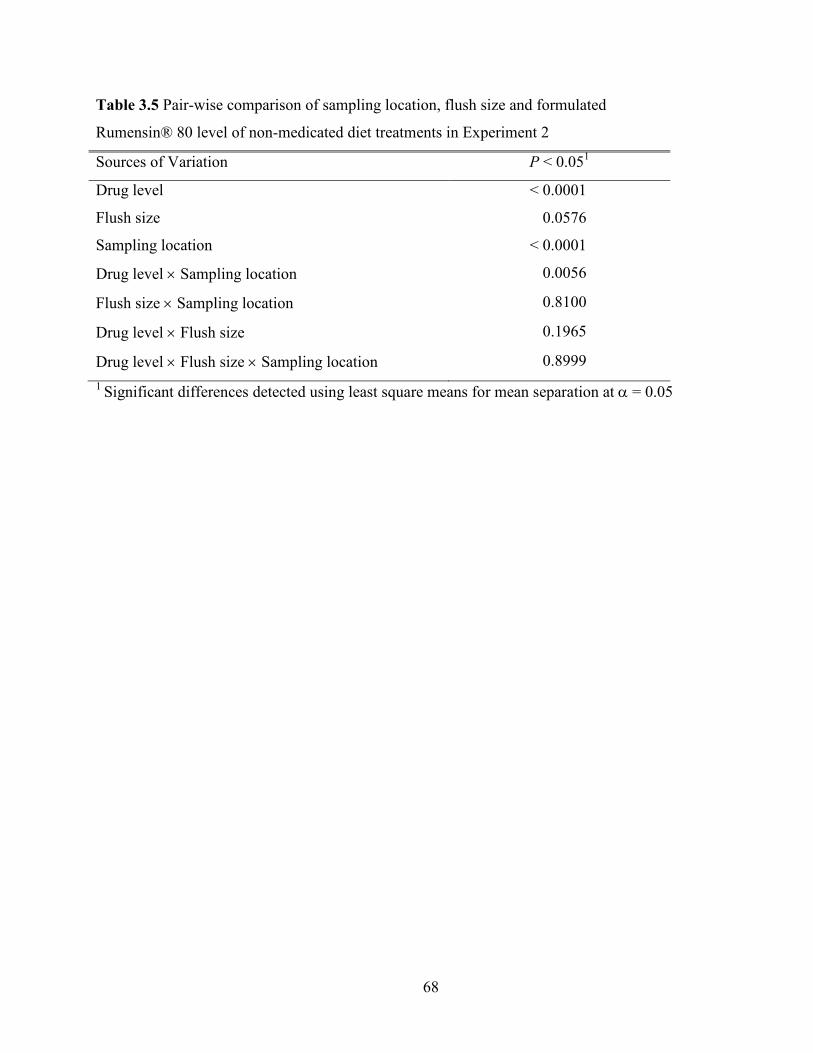
68
Table 3.5 Pair-wise comparison of sampling location, flush size and formulated
Rumensin® 80 level of non-medicated diet treatments in Experiment 2
Sources of Variation P < 0.051
Drug level < 0.0001
Flush size 0.0576
Sampling location < 0.0001
Drug level × Sampling location 0.0056
Flush size × Sampling location 0.8100
Drug level × Flush size 0.1965
Drug level × Flush size × Sampling location 0.8999
1 Significant differences detected using least square means for mean separation at α = 0.05
69
References
Amend, J.F., Nichelson, R.L., King, R.S., Mallon, F.M., and L. Freeland. 1985. Equine
monensin toxicosis: Useful ante-mortem and post-mortem clinical pathologic tests. In: Am.
Assoc. Equine Pract. 32: 361-371.
Beck B.E., and W. N. Harries. 1979. The diagnosis of monensin toxicosis: A report on outbreaks
in horses, cattle and chickens. In: Am. Assoc. Vet. Lab. Diagnost Annu. Proc. 22:269-282.
Conway, D. P., and M. E. McKenzie. 2007. Poultry coccidiosis: diagnostic and testing
procedures. 3rd ed. Blackwell Pub., Ames, Iowa.
Doonan, G., Brown, C. M., Mullaney, T. P., Brooks, D. B., Ulmanis, E. G., and M. R. Slanker.
1989. Monensin poisoning in horses – an international incident. Can. Vet. J. 30:165-169.
European Food Safety Authority. 2005. Opinion of the Scientific Panel on Additives and
Products or Substances used in Animal Feed on a request from the European Commission on
the evaluation of the coccidiostat Coxidin (Monensin Sodium). The EFSA Journal 283:1-53.
European Food Safety Authority. 2008. Cross-contamination of non-target feedingstuffs by
monensin authorised for use as a feed additive. The EFSA Journal. 592:1-40.
Food and Drug Administration, Department of Health and Human Services. 1975. Tolerances for
residues of new animal drugs. 21 CFR part 556. Fed. Regist. 40:13942.
Food and Drug Administration, Department of Health and Human Services. 1976. Current Good
Manufacturing Practice for Medicated Feeds. 21CFR part 225.65. Fed. Regist. 41:52618.
Food and Drug Administration, Department of Health and Human Services. 2007a. Current
Good Manufacturing Practice for Medicated Feeds. 21CFR part 225.1. Fed. Regist.
72:69120.

70
Food and Drug Administration, Department of Health and Human Services. 2007b. Current
Good Manufacturing Practice for Type A Medicated Articles. 21 CFR part 226.1. Fed.
Regist. 72:69120.
Food and Drug Administration, Department of Health and Human Services. 2008. New Animal
Drugs for Use in Animal Feeds. 21 CFR part 558.3. Fed. Regist. 73:15884.
Long, P. L. 1982. The biology of the coccidia. Page 396. University Park Press, Baltimore,
Maryland.
Matsuoka, T. 1976. Evaluation of monensin toxicity in he horse. J. Am. Vet. Med. Assoc.
169:1098-1100.
Muylle, E., Vandenhende, C., Oyaert, W., Thoonen, H., and K. Vlaeminck. 1981. Delayed
Monensin sodium toxicity in horses. Equine Vet. J. 13:107-108.
Nava, K.M. 1978. Mysterious horse deaths at Bonita Valley Farms. Cal. Vet. 32:27-28.
Nebbia, C., Ceppa, L., Dacasto, M., Nachtmann, C., and M. Carletti. 2001. Oxidative monensin
metabolism and cytochrome P450 3A content and functions in liver microsomes from horses,
pigs, broiler chicks, cattle and rats. Journal of Veterinary Pharmacology and Therapeutics 24
(6):399–403.
SAS Inst., Inc. 2003 Version 9.1. SAS Inst., Inc., Cary North Carolina.
Stoker, J. W. 1975. Letter: Monensin sodium in horses. Vet. Rec. 97:137-138.
Whitlock, R. H., White, N. A., Rowland, G. N., and R. Plue. 1979. Monensin toxicosis in horses:
Clinical manifestations. In: Am. Assoc. Equine Pract. Annu. Proc. 24:473-486.