Embed Size (px)
Citation preview
Restaurant Valuation
Part Art / Part Science
December 2, 2014
Everyone has an opinion of value:
• The bookkeeper
• The owner
• The owner’s spouse
• The owner’s ex-spouse
• The owner’s parents
• The auditor
• The tax preparer
2
Standard of Value
Purpose or need for the valuation
• Merger or acquisition
• Family gifting
• Estate tax
• Divorce
• Shareholder oppression / dissent
• Damages
• Bankruptcy
• Shareholder agreements
• Income Tax
• Financial statement reporting
3
Standard of Value
• Fair Market Value
• Investment Value
• Fair Value
4
Standard of Value
• Going Concern Value
• Liquidation Value:
Orderly
Forced
5
Premise of Value
VALUATION THEORY
6
FINANCIAL STATEMENT
ANALYSIS
7
• True Economic Income
• Recasting / Normalizing P&L
• Normalizing Balance Sheet
• Comparative common size normalized and industry
comparison
8
Cash Flows
Source: Statement on Standards for Valuation Services #1, AICPA, June 2007
• Market Level Compensation
• Perquisites
• Market Rent (Above/Below)
• Non-recurring revenue and expense items
• POS Cash Register Info
9
Normalization Adjustments
VALUATION APPROACHES
10
• Cost Approach
• Income Approach
• Market Approach
11
Common Valuation Approaches
• Most pertinent where a company’s value is tied directly
to the value of its underlying assets.
• Generally not appropriate for restaurants because
intangible assets are not considered
12
Cost Approach
• Expectation
• Requires the determination of a company’s
representative earning power which is then discounted
back to a present value.
13
Income Approach
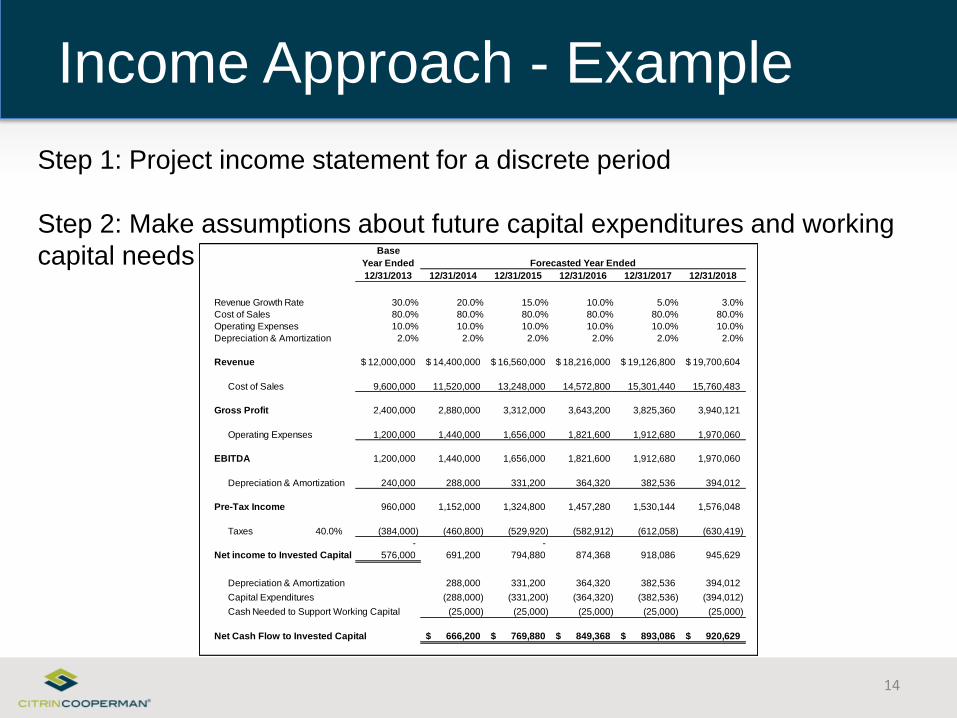
Step 1: Project income statement for a discrete period
Step 2: Make assumptions about future capital expenditures and working
capital needs
14
Income Approach - Example
Base
Year Ended
12/31/2013 12/31/2014 12/31/2015 12/31/2016 12/31/2017 12/31/2018
Revenue Growth Rate 30.0% 20.0% 15.0% 10.0% 5.0% 3.0%
Cost of Sales 80.0% 80.0% 80.0% 80.0% 80.0% 80.0%
Operating Expenses 10.0% 10.0% 10.0% 10.0% 10.0% 10.0%
Depreciation & Amortization 2.0% 2.0% 2.0% 2.0% 2.0% 2.0%
Revenue 12,000,000$ 14,400,000$ 16,560,000$ 18,216,000$ 19,126,800$ 19,700,604$
Cost of Sales 9,600,000 11,520,000 13,248,000 14,572,800 15,301,440 15,760,483
Gross Profit 2,400,000 2,880,000 3,312,000 3,643,200 3,825,360 3,940,121
Operating Expenses 1,200,000 1,440,000 1,656,000 1,821,600 1,912,680 1,970,060
EBITDA 1,200,000 1,440,000 1,656,000 1,821,600 1,912,680 1,970,060
Depreciation & Amortization 240,000 288,000 331,200 364,320 382,536 394,012
Pre-Tax Income 960,000 1,152,000 1,324,800 1,457,280 1,530,144 1,576,048
Taxes 40.0% (384,000) (460,800) (529,920) (582,912) (612,058) (630,419)
- -
Net income to Invested Capital 576,000 691,200 794,880 874,368 918,086 945,629
Depreciation & Amortization 288,000 331,200 364,320 382,536 394,012
Capital Expenditures (288,000) (331,200) (364,320) (382,536) (394,012)
Cash Needed to Support Working Capital (25,000) (25,000) (25,000) (25,000) (25,000)
Net Cash Flow to Invested Capital 666,200$ 769,880$ 849,368$ 893,086$ 920,629$
Forecasted Year Ended
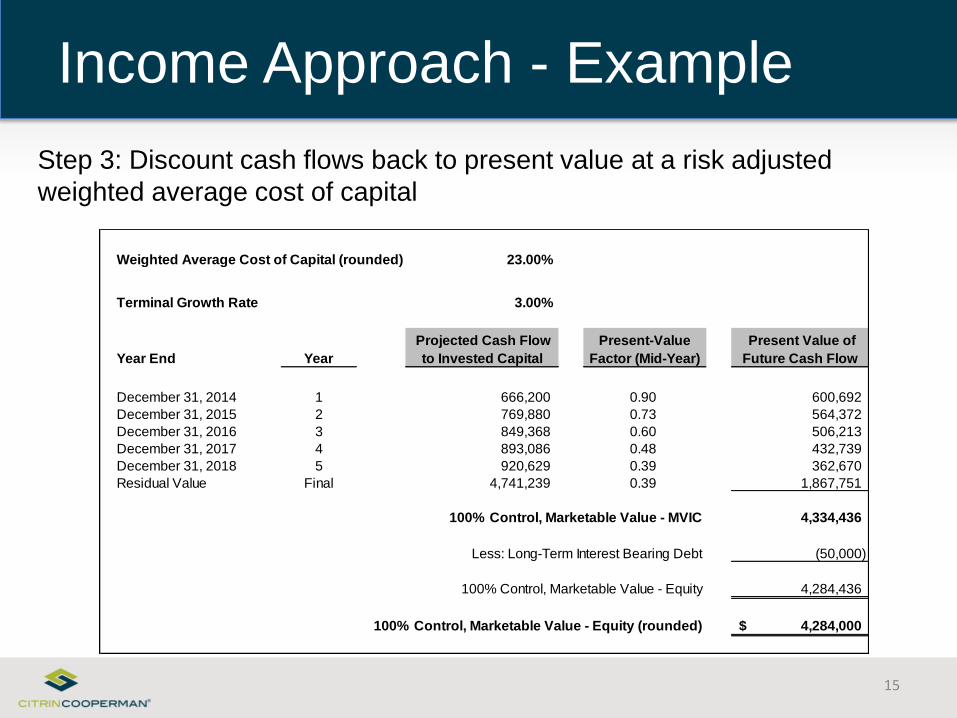
Step 3: Discount cash flows back to present value at a risk adjusted
weighted average cost of capital
15
Income Approach - Example
Weighted Average Cost of Capital (rounded) 23.00%
Terminal Growth Rate 3.00%
Year End Year
December 31, 2014 1 666,200 0.90 600,692
December 31, 2015 2 769,880 0.73 564,372
December 31, 2016 3 849,368 0.60 506,213
December 31, 2017 4 893,086 0.48 432,739
December 31, 2018 5 920,629 0.39 362,670
Residual Value Final 4,741,239 0.39 1,867,751
100% Control, Marketable Value - MVIC 4,334,436
Less: Long-Term Interest Bearing Debt (50,000)
100% Control, Marketable Value - Equity 4,284,436
100% Control, Marketable Value - Equity (rounded) 4,284,000$
Projected Cash Flow
to Invested Capital
Present-Value
Factor (Mid-Year)
Present Value of
Future Cash Flow
• Ranking
• Compares publicly traded businesses or comparable
private and public company transactions in similar
industries and financial positions and applies implied
multiples to the subject company
16
Market Approach
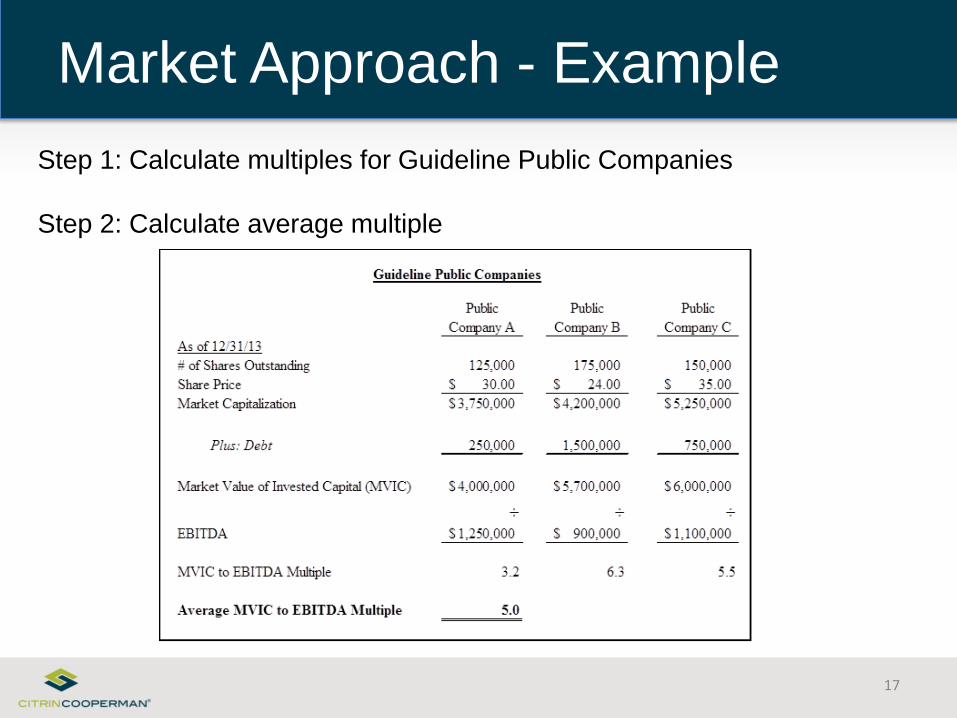
Step 1: Calculate multiples for Guideline Public Companies
Step 2: Calculate average multiple
17
Market Approach - Example
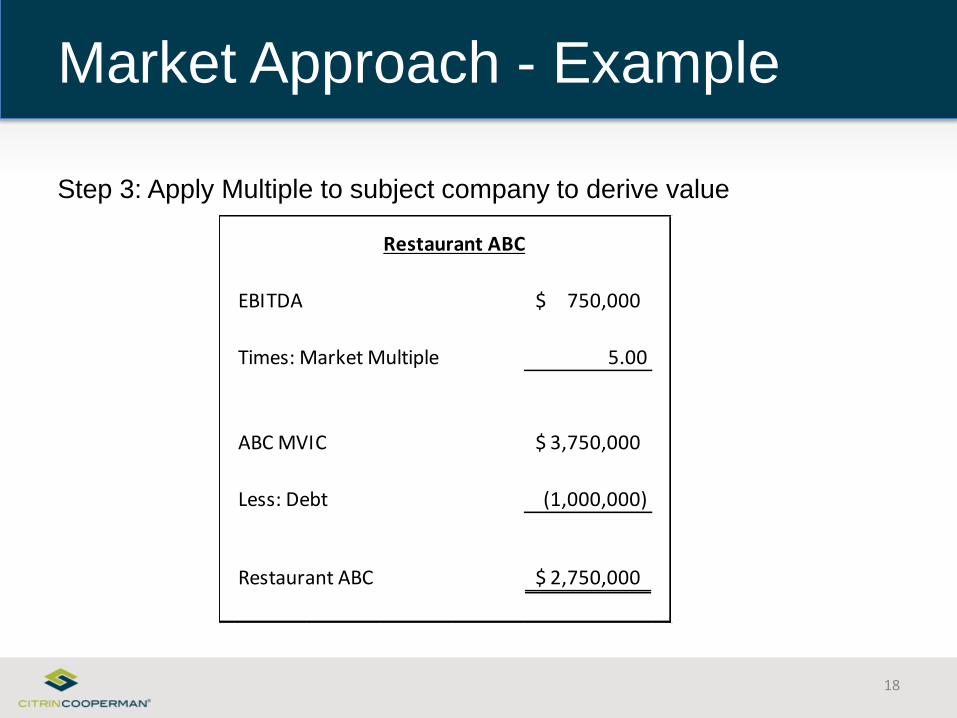
Step 3: Apply Multiple to subject company to derive value
18
Market Approach - Example
Restaurant ABC
EBITDA 750,000$
Times: Market Multiple 5.00
ABC MVIC 3,750,000$
Less: Debt (1,000,000)
Restaurant ABC 2,750,000$
• Technically not a valuation method.
• Prevalent in the restaurant industry.
• Vary among different types of restaurants.
• Typically used as a reasonableness check.
19
Rules of Thumb
Source: BVR’s Guide to Restaurant Valuation, by Edward Moran, Business Valuation Resources, LLC, 2010
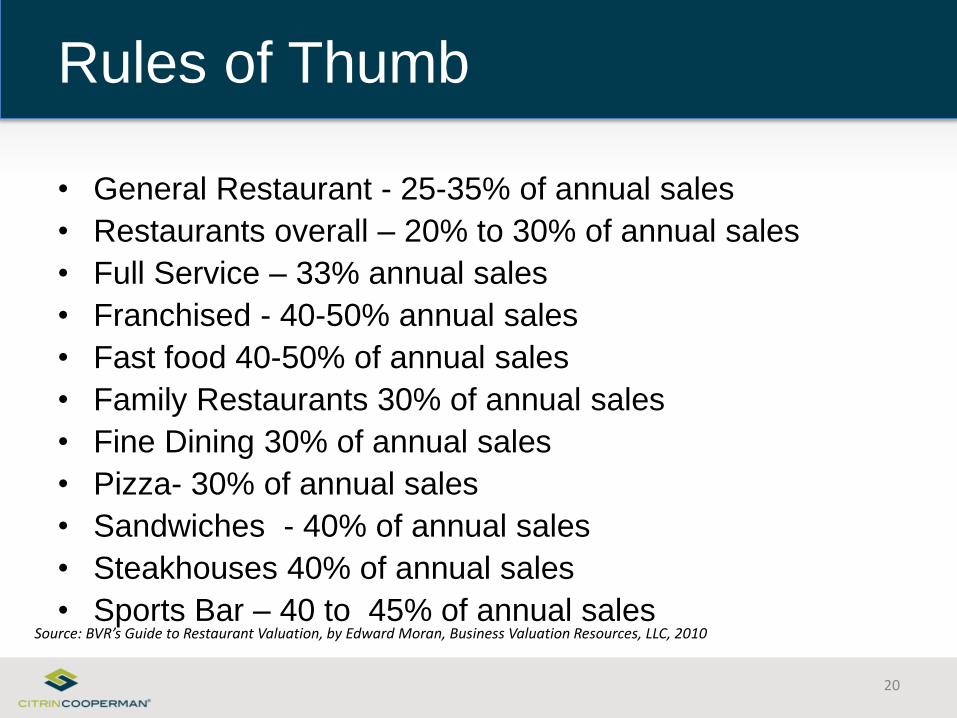
• General Restaurant - 25-35% of annual sales
• Restaurants overall – 20% to 30% of annual sales
• Full Service – 33% annual sales
• Franchised - 40-50% annual sales
• Fast food 40-50% of annual sales
• Family Restaurants 30% of annual sales
• Fine Dining 30% of annual sales
• Pizza- 30% of annual sales
• Sandwiches - 40% of annual sales
• Steakhouses 40% of annual sales
• Sports Bar – 40 to 45% of annual sales
20
Rules of Thumb
Source: BVR’s Guide to Restaurant Valuation, by Edward Moran, Business Valuation Resources, LLC, 2010
VALUE DRIVERS
21

• Location
• Concept
• Menu
• Quality of Cooking and Wait Staff
• Cost Control
• Operational profitability
• Consistency
22
Value Drivers – Restaurants
Source: Value Maps – Valuation Tools The Unlock Business Wealth – Warren D. Miller

• Controlling Costs
• Growing revenue
• Careful budgeting
• Adequate levels of cash & working capital
• Conservative levels of debt at market level interest rates
• Ongoing repair, maintenance, and replacement of worn
out machinery, equipment, and fixtures
• Below market leases
23
Value Drivers – Restaurants
Source: BVR’s Guide to Restaurant Valuation, by Edward Moran, Business Valuation Resources, LLC, 2010
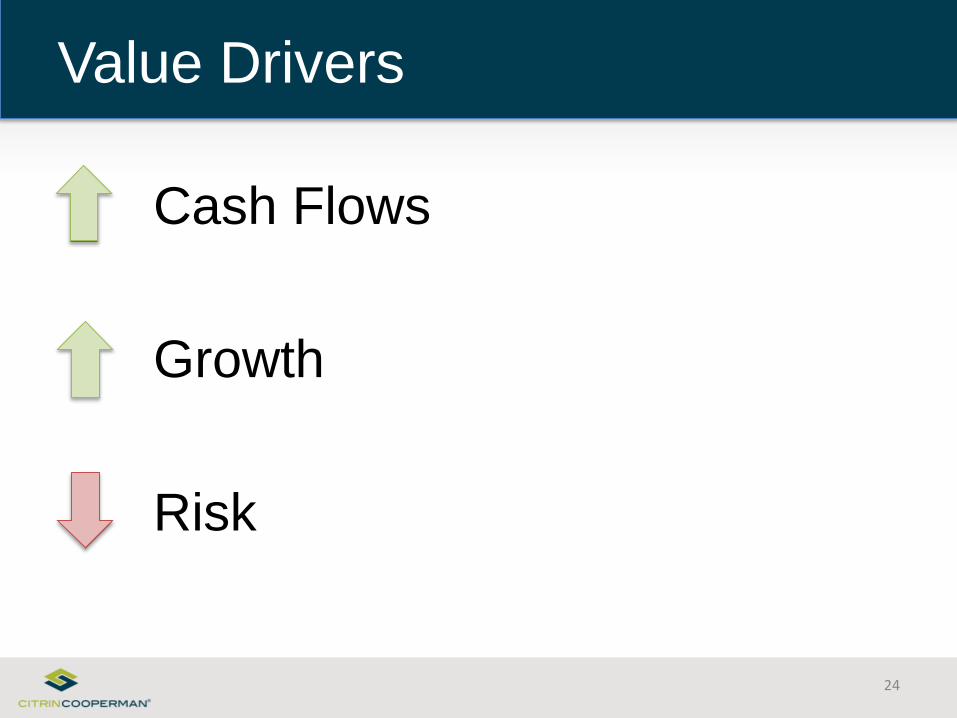
Value Drivers
Cash Flows
Growth
Risk
24
• Cash Flows
– Monitor and the control
– Benchmarking
– Representative economic income
25
Value Drivers
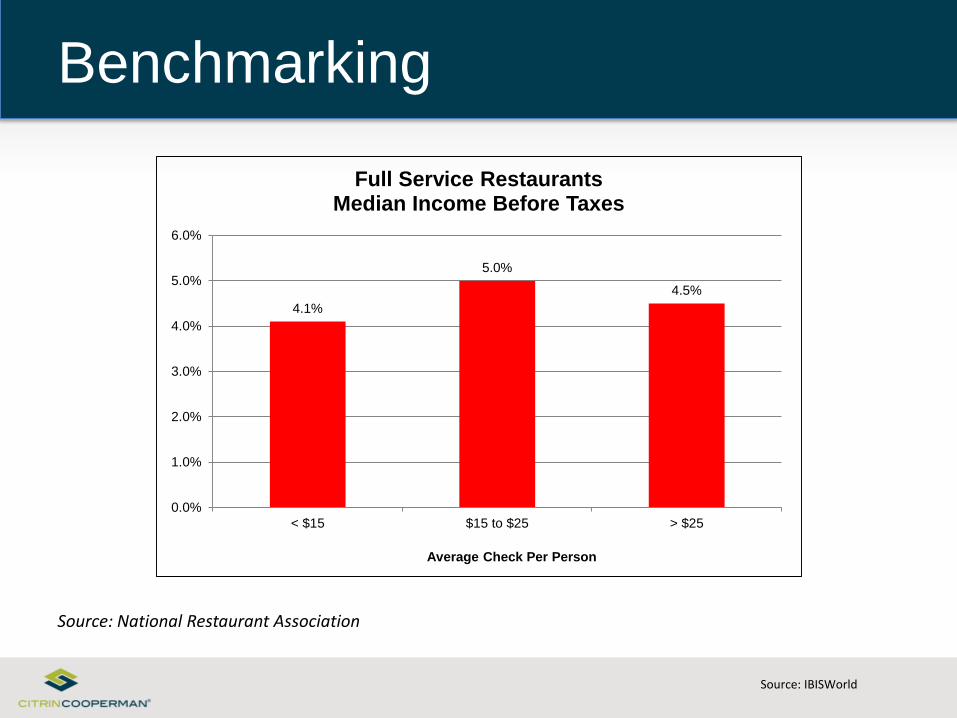
Benchmarking
Source: IBISWorld
Source: National Restaurant Association
4.1%
5.0%
4.5%
0.0%
1.0%
2.0%
3.0%
4.0%
5.0%
6.0%
< $15 $15 to $25 > $25
Average Check Per Person
Full Service RestaurantsMedian Income Before Taxes
Source: American Staffing Association and IBISWorld
• Growth
– Expansion
– Benchmarking
27
Value Drivers
Growth
• Income – the #1 driver of restaurant spending.
• Age – the presence of young children in a household
reduces restaurant spending.
• Geography – variations in cost of living, general
economy and lifestyles.
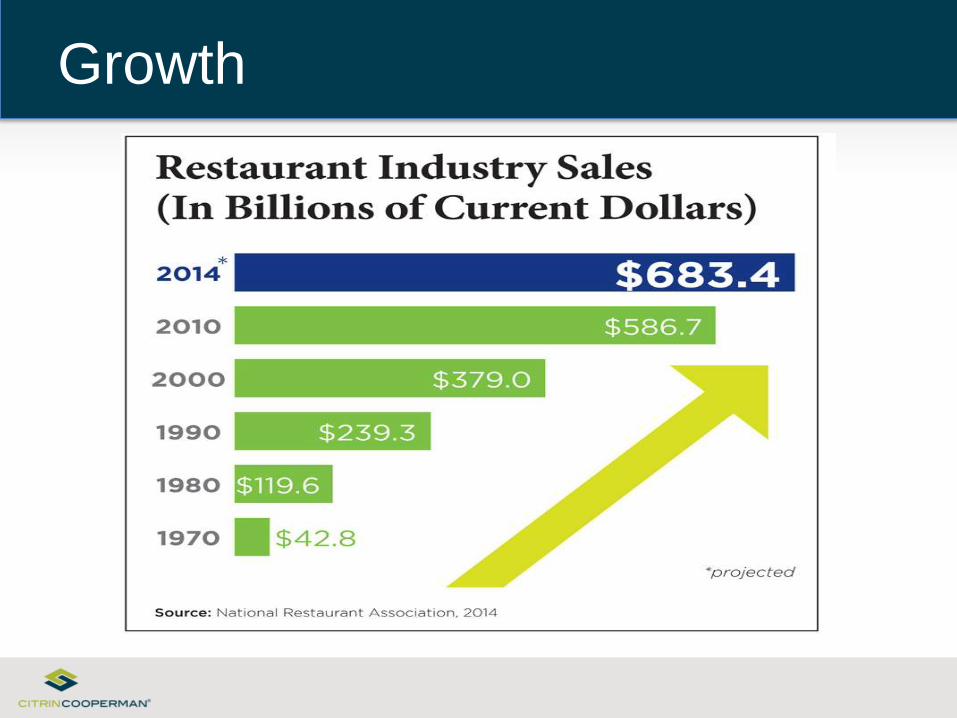
Growth
Source: IBISWorld
Source: National Restaurant Association
30
Trends

Trends
• Interact via Social media (e.g. Facebook, Twitter, etc.)
• View menus or make reservations online
• In-store ordering kiosks
• Smartphone apps
32
Trends
Source: National Restaurant Association
OWNERSHIP
CHARACTERISTICS OF
INTEREST BEING SOLD
33
• Determine the type of ownership interest
• Understand the classes of equity ownership
• Consider valuation adjustments - Discounts
34
Ownership Characteristics
Source: Statement on Standards for Valuation Services #1, AICPA, June 2007
• One size fits all
• Mis-matching multiples
• Misjudging the risk
• Ignoring Management
• Ignoring Real Estate / Lease
35
Common Errors

BEST PRACTICES
36
• Report income
• Fully use your POS system
• Measure of success
• Financial statements
• Health inspection reports
• Brag book
• Lease negotiations
37
Best Practices

38
QUESTIONS?
About the Presenters
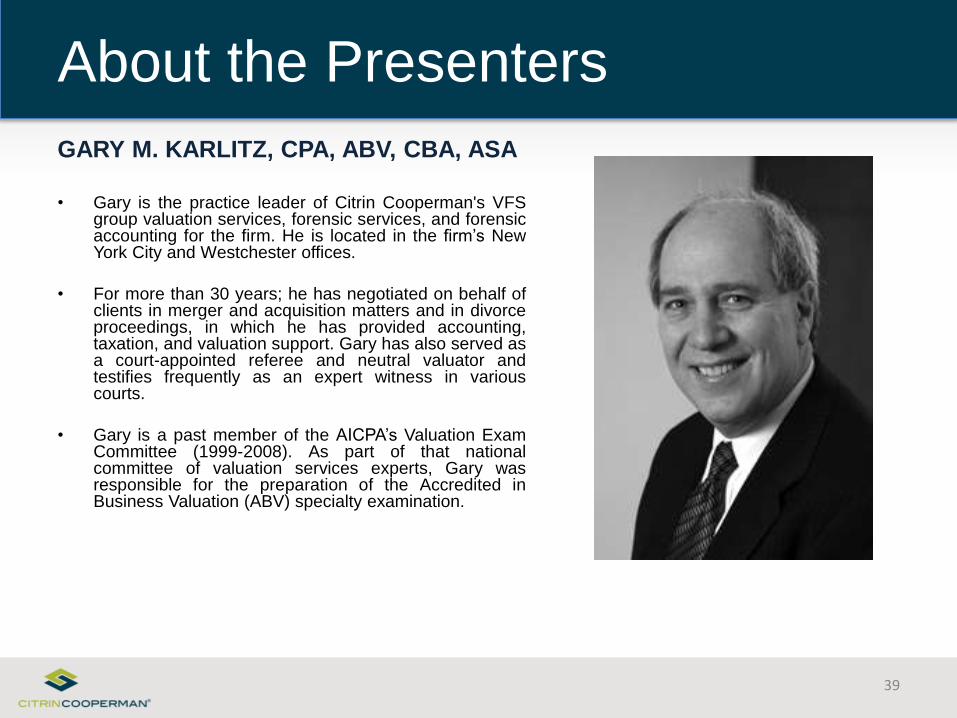
GARY M. KARLITZ, CPA, ABV, CBA, ASA
• Gary is the practice leader of Citrin Cooperman's VFSgroup valuation services, forensic services, and forensicaccounting for the firm. He is located in the firm’s NewYork City and Westchester offices.
• For more than 30 years; he has negotiated on behalf ofclients in merger and acquisition matters and in divorceproceedings, in which he has provided accounting,taxation, and valuation support. Gary has also served asa court-appointed referee and neutral valuator andtestifies frequently as an expert witness in variouscourts.
• Gary is a past member of the AICPA’s Valuation ExamCommittee (1999-2008). As part of that nationalcommittee of valuation services experts, Gary wasresponsible for the preparation of the Accredited inBusiness Valuation (ABV) specialty examination.
39

About the Presenters
MANDEEP SIHOTA, CFA, ASA
• Mandeep, is a principal in Citrin Cooperman's VFS group. She leads thevaluation team and manages the preparation and delivery of valuations ofbusinesses, private equity, professional practices and income generatingassets such as derivatives and intellectual property.
• She has prepared hundreds of complex valuations and economicdamages calculations for a variety of purposes including: mergers andacquisitions, estate and gift tax planning, corporate financial planning,shareholder actions, matrimonial actions, commercial damages and otherdisputes.
• Mandeep has experience in a diverse range of industry verticals includingstaffing, hedge funds and other alternative investments, technology,construction, hospitality and a broad variety of service, manufacturing,and wholesale distribution industries.
• Mandeep has an Bcomm from the University of Toronto and an MBAfrom the Schulich School of Business, York University in Canada. She isa Chartered Financial Analyst (CFA) designation holder, an AccreditedSenior Appraiser (ASA) with the American Society of Appraisers and amember of the CFA Institute and the New York Society of SecurityAnalysts.
• Mandeep is qualified as an expert witness before the Supreme Court ofthe State of New York and testified before the September 11th VictimCompensation Fund regarding the economic damages suffered as aresult of the wrongful death of a New York City firefighter, during theSeptember 11, 2001 terrorist attack.
40

CONNECTICUT | NEW JERSEY | NEW YORK | PENNSYLVANIA
CITRINCOOPERMAN.COM