Embed Size (px)
Citation preview

1
Domestic and international market development for high-‐value cattle and beef in South-‐East Cambodia
ACIAR Project No. AH/2010/046
Working Paper No.3
Ho Chi Minh City beef market demand and supply report
Nam Hoang

2
3
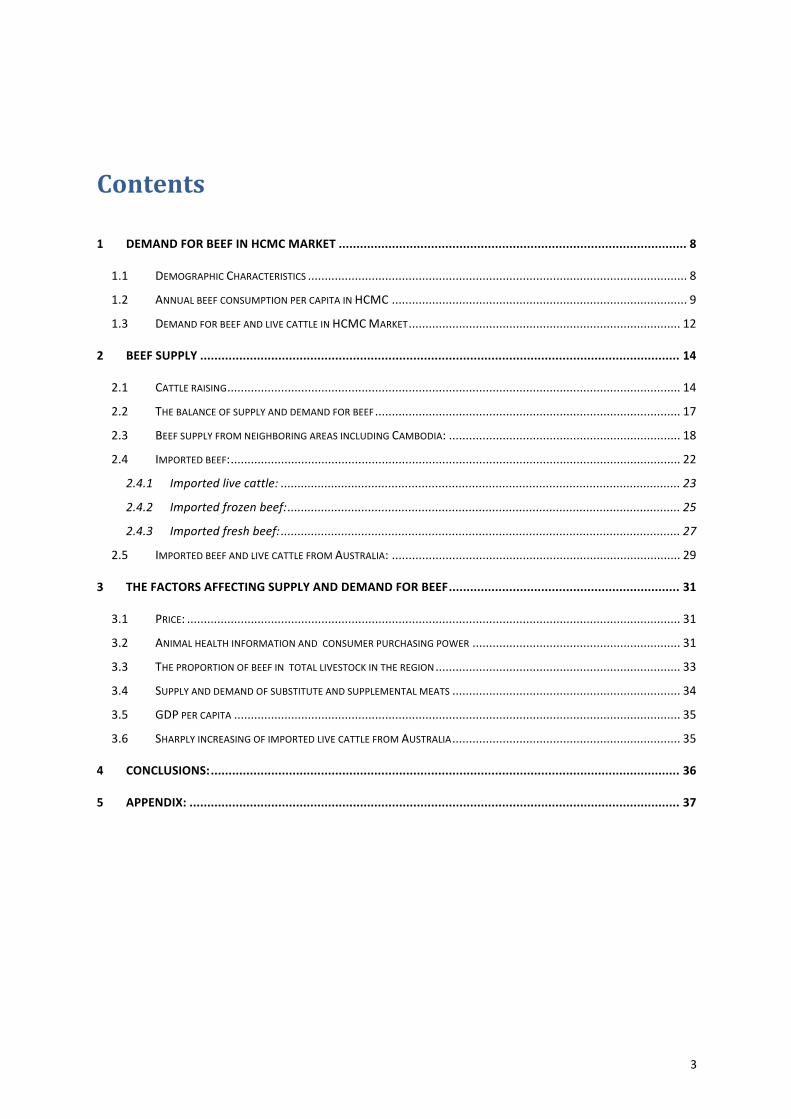
Contents
1 DEMAND FOR BEEF IN HCMC MARKET .................................................................................................. 8
1.1 DEMOGRAPHIC CHARACTERISTICS ................................................................................................................. 8
1.2 ANNUAL BEEF CONSUMPTION PER CAPITA IN HCMC ........................................................................................ 9
1.3 DEMAND FOR BEEF AND LIVE CATTLE IN HCMC MARKET ................................................................................. 12
2 BEEF SUPPLY ....................................................................................................................................... 14
2.1 CATTLE RAISING ....................................................................................................................................... 14
2.2 THE BALANCE OF SUPPLY AND DEMAND FOR BEEF ........................................................................................... 17
2.3 BEEF SUPPLY FROM NEIGHBORING AREAS INCLUDING CAMBODIA: ..................................................................... 18
2.4 IMPORTED BEEF: ...................................................................................................................................... 22
2.4.1 Imported live cattle: ....................................................................................................................... 23
2.4.2 Imported frozen beef: ..................................................................................................................... 25
2.4.3 Imported fresh beef: ....................................................................................................................... 27
2.5 IMPORTED BEEF AND LIVE CATTLE FROM AUSTRALIA: ...................................................................................... 29
3 THE FACTORS AFFECTING SUPPLY AND DEMAND FOR BEEF ................................................................. 31
3.1 PRICE: ................................................................................................................................................... 31
3.2 ANIMAL HEALTH INFORMATION AND CONSUMER PURCHASING POWER .............................................................. 31
3.3 THE PROPORTION OF BEEF IN TOTAL LIVESTOCK IN THE REGION ......................................................................... 33
3.4 SUPPLY AND DEMAND OF SUBSTITUTE AND SUPPLEMENTAL MEATS .................................................................... 34
3.5 GDP PER CAPITA ..................................................................................................................................... 35
3.6 SHARPLY INCREASING OF IMPORTED LIVE CATTLE FROM AUSTRALIA .................................................................... 35
4 CONCLUSIONS: .................................................................................................................................... 36
5 APPENDIX: .......................................................................................................................................... 37
4
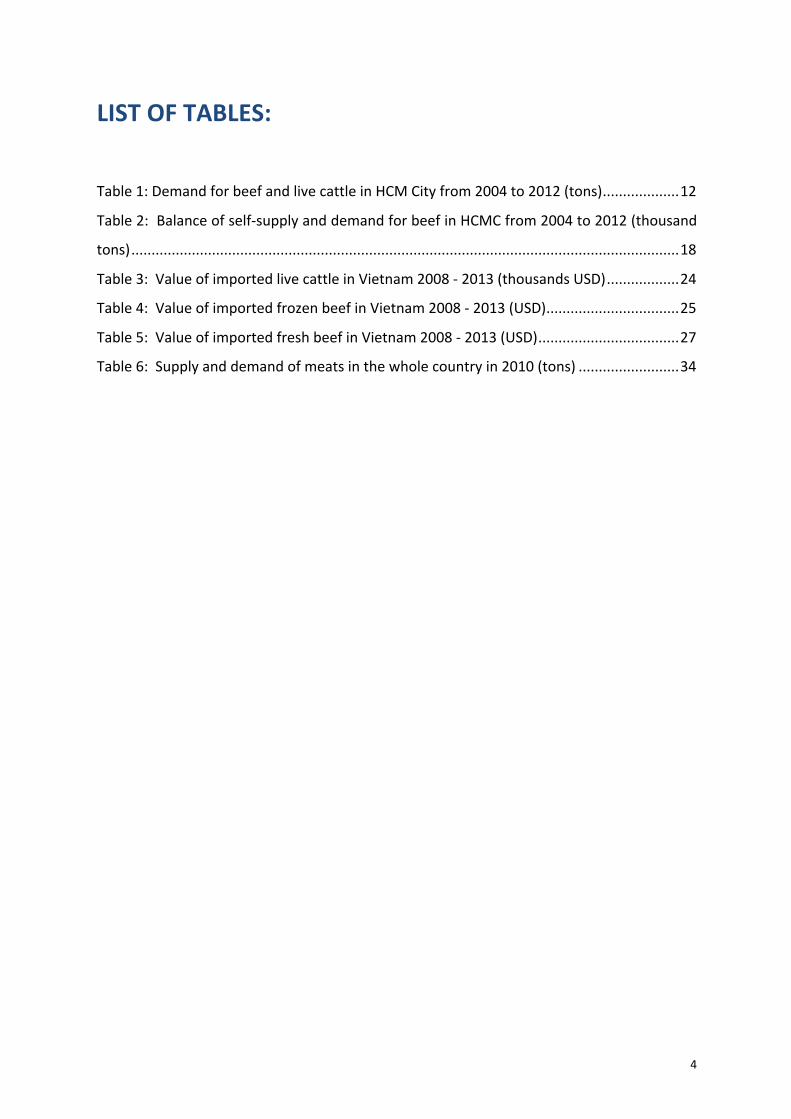
LIST OF TABLES:
Table 1: Demand for beef and live cattle in HCM City from 2004 to 2012 (tons) ................... 12
Table 2: Balance of self-‐supply and demand for beef in HCMC from 2004 to 2012 (thousand
tons) ........................................................................................................................................ 18
Table 3: Value of imported live cattle in Vietnam 2008 -‐ 2013 (thousands USD) .................. 24
Table 4: Value of imported frozen beef in Vietnam 2008 -‐ 2013 (USD) ................................. 25
Table 5: Value of imported fresh beef in Vietnam 2008 -‐ 2013 (USD) ................................... 27
Table 6: Supply and demand of meats in the whole country in 2010 (tons) ......................... 34
5
LIST OF FIGURES:
Figure 1: HCMC population and growth rate from 2004 -‐ 2012 .............................................. 8
Figure 2: Annual income per capita in HCMC and Vietnam from 2004 to 2012 (USD) ............. 9
Figure 3: Annual beef consumption per capita in 2008 and 2010 (kg) ................................... 10
Figure 4: Annual beef consumption per capita in HCMC, Hanoi and Vietnam (2004 -‐2010)
(kg) .......................................................................................................................................... 10
Figure 5: Annual consumption per capita of chicken, beef and pork in HCMC (2004 -‐2010)
(kg) .......................................................................................................................................... 11
Figure 6: Beef consumption per capita in 5 HCMC income groups from 2004 -‐ 2010 ............ 12
Figure 7: The number of cattle heads in HCMC from 1996 to 2012 (thousand) ..................... 14
Figure 8: Structure of cattle herds in HCMC from 2001 to 2012 (thousand heads) ............... 15
Figure 9: Weight of slaughtered cows in HCMC in 2001-‐2012 (kg/head) ............................... 17
Figure 10: Total output of slaughtered cows in HCMC in 1996-‐2012 (thousand tons) .......... 17
Figure 11: Total supply of live cattle in HCMC and neighboring provinces (tons/year) ......... 18
Figure 12: Volume of live cattle/buffalo slaughtered in neighboring provinces and destined
to HCMC’s beef market in 2010 .............................................................................................. 20
Figure 13: Volume and origin of live cattle/buffalo slaughtered in HCMC in 2010 ............... 21
Figure 14: Beef production of some neighboring provinces that could supply for HCMC in
2012 (tons) .............................................................................................................................. 21
Figure 15: Balance of supply and demand for beef in HCMC and whole country in 2010
(tons) ....................................................................................................................................... 22
Figure 16: Value of imported beef and live cattle in Vietnam 2008-‐2013 (millions USD) ..... 23
Figure 17: Value of imported live cattle in Vietnam 2008 -‐ 2013 (USD) ................................ 24
Figure 18: Monthly value of imported live cattle in Vietnam 2008-‐2013 (USD) .................... 25
Figure 19: Monthly value of imported fozen beef in Vietnam 2008-‐2013 (USD) .................. 26
Figure 20: Value of imported fresh beef in Vietnam 2008-‐2013 ( USD) ................................ 28
Figure 21: Monthly value of imported fresh beef in Vietnam 2008-‐2013 (USD) ................... 28
Figure 22: Value of imported beef from Australia 2008-‐2013 (USD) ..................................... 29
Figure 23: Imported live cattle from Australia in 2013 (USD) .............................................. 29
Figure 24: Silverside retail price in HCMC market 2008 -‐ 2013 (VND/kg) ............................... 31
Figure 25: Comparing retail average prices for beef and pork in HCMC 2008 -‐2013 (VND/kg)
6
................................................................................................................................................ 32
Figure 26: Growth of total retail sales of goods and services in Vietnam 2006-‐2015 (%,
compared with the previous year) ......................................................................................... 32
Figure 27: Proportion of live cattle, pig and and chicken in HCMC 1996-‐2012 (%) ............... 33
Figure 28: Proportion of live cattle, pig and and chicken in the South East of Vietnam 1996-‐
2012 (%) .................................................................................................................................. 33
Figure 29: Supply and demand of meats in 2010 (tons) ........................................................ 34
7
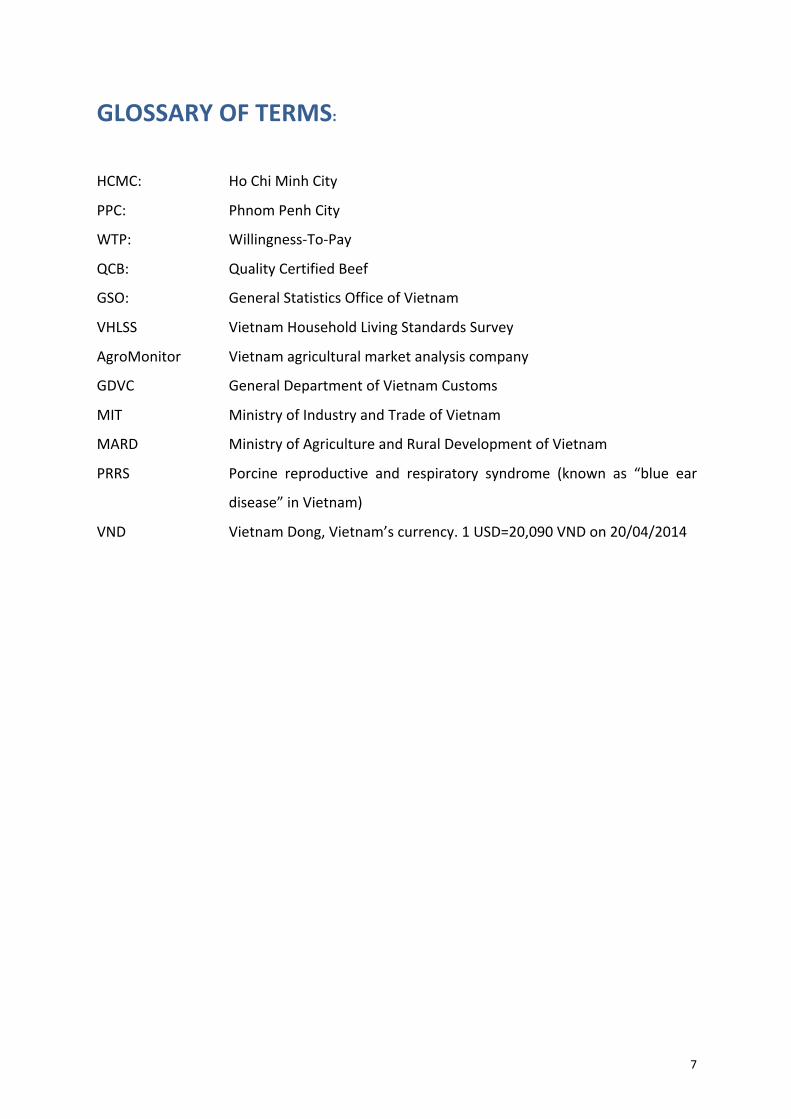
GLOSSARY OF TERMS:
HCMC: Ho Chi Minh City
PPC: Phnom Penh City
WTP: Willingness-‐To-‐Pay
QCB: Quality Certified Beef
GSO: General Statistics Office of Vietnam
VHLSS Vietnam Household Living Standards Survey
AgroMonitor Vietnam agricultural market analysis company
GDVC General Department of Vietnam Customs
MIT Ministry of Industry and Trade of Vietnam
MARD Ministry of Agriculture and Rural Development of Vietnam
PRRS Porcine reproductive and respiratory syndrome (known as “blue ear
disease” in Vietnam)
VND Vietnam Dong, Vietnam’s currency. 1 USD=20,090 VND on 20/04/2014

8
1 Demand for Beef in HCMC Market
1.1 Demographic characteristics According to data released by the General Statistics Office of Vietnam at the end of 2012,
the total population of HCMC was about 7.75 million people, an increase of 2.2% from 2011.
After a period of rapid increase in population with growth rate about 3.37% per year from
2005 to 2010, the population growth rate of Ho Chi Minh City from 2011 has slowed down
since 2011.
Figure 1: HCMC population and growth rate from 2004 -‐ 2012
Source: General Statistics Office of Vietnam
With a population density of 3,666 people per km2 in 2012, HCMC continues to lead the country in this criteria, 13.7 times higher than the country density and 1.78 times higher than that of Hanoi.
During the period 2002-‐2012, data from GSO_VN shows that the annual income per capita
in HCMC was increasing rapidly and it is much higher than the national average.
3.42 3.72
4.05 3.74
3.28 3.60
2.53
1.94 2.18
-‐ 0.50 1.00 1.50 2.00 2.50 3.00 3.50 4.00 4.50
0 1000 2000 3000 4000 5000 6000 7000 8000 9000
2004 2005 2006 2007 2008 2009 2010 2011 2012
Population (thousand people) Growth rate (%)
9
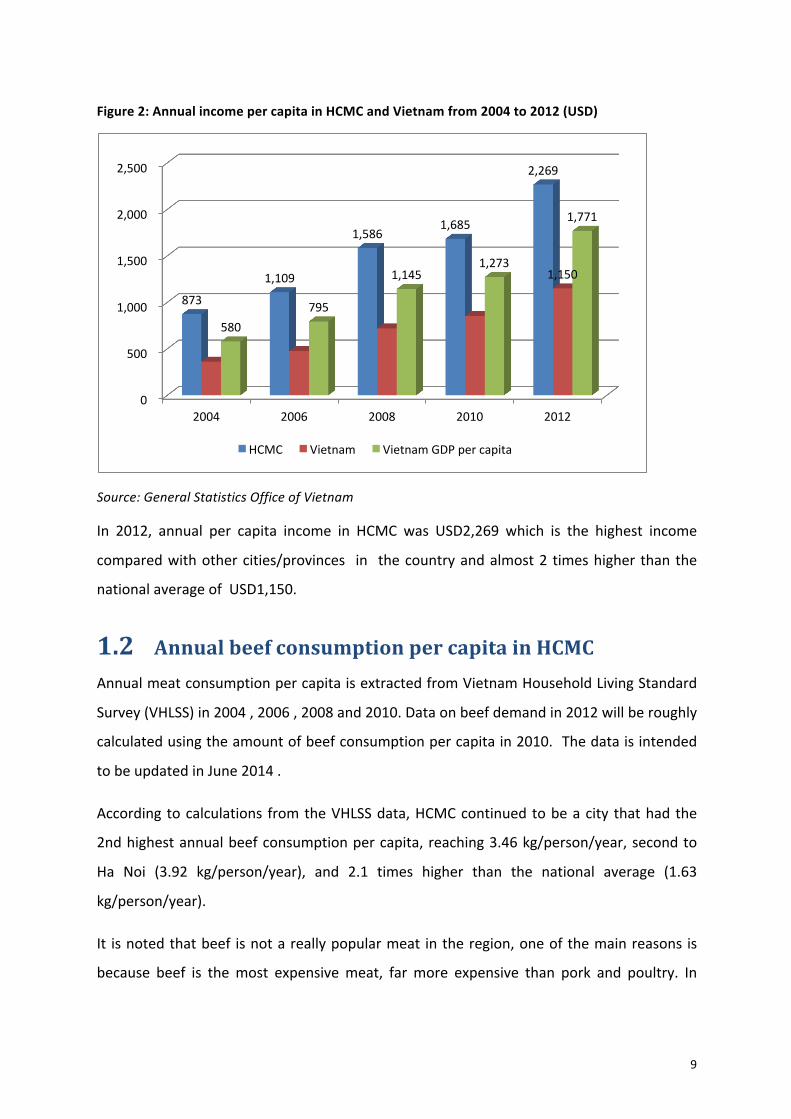
Figure 2: Annual income per capita in HCMC and Vietnam from 2004 to 2012 (USD)
Source: General Statistics Office of Vietnam
In 2012, annual per capita income in HCMC was USD2,269 which is the highest income
compared with other cities/provinces in the country and almost 2 times higher than the
national average of USD1,150.
1.2 Annual beef consumption per capita in HCMC Annual meat consumption per capita is extracted from Vietnam Household Living Standard
Survey (VHLSS) in 2004 , 2006 , 2008 and 2010. Data on beef demand in 2012 will be roughly
calculated using the amount of beef consumption per capita in 2010. The data is intended
to be updated in June 2014 .
According to calculations from the VHLSS data, HCMC continued to be a city that had the
2nd highest annual beef consumption per capita, reaching 3.46 kg/person/year, second to
Ha Noi (3.92 kg/person/year), and 2.1 times higher than the national average (1.63
kg/person/year).
It is noted that beef is not a really popular meat in the region, one of the main reasons is
because beef is the most expensive meat, far more expensive than pork and poultry. In
0
500
1,000
1,500
2,000
2,500
2004 2006 2008 2010 2012
873
1,109
1,586 1,685
2,269
1,150
580 795
1,145 1,273
1,771
HCMC Vietnam Vietnam GDP per capita
10
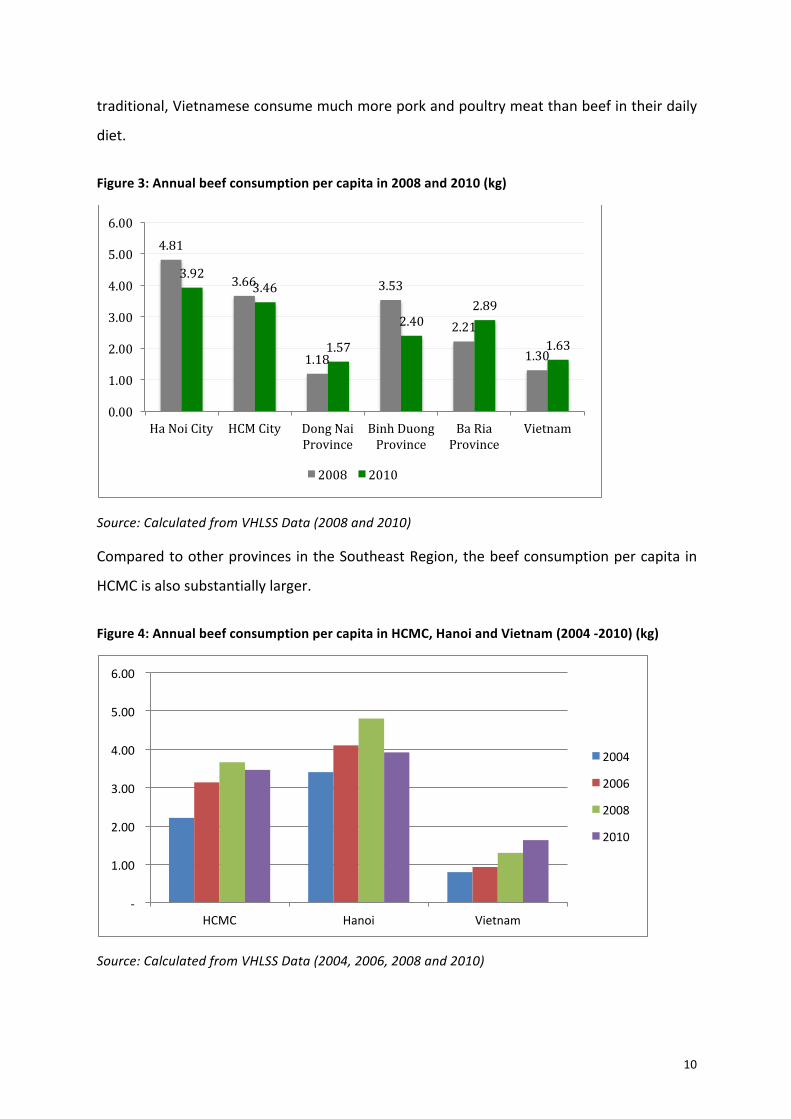
traditional, Vietnamese consume much more pork and poultry meat than beef in their daily
diet.
Figure 3: Annual beef consumption per capita in 2008 and 2010 (kg)
Source: Calculated from VHLSS Data (2008 and 2010)
Compared to other provinces in the Southeast Region, the beef consumption per capita in
HCMC is also substantially larger.
Figure 4: Annual beef consumption per capita in HCMC, Hanoi and Vietnam (2004 -‐2010) (kg)
Source: Calculated from VHLSS Data (2004, 2006, 2008 and 2010)
4.81
3.66
1.18
3.53
2.21
1.30
3.92 3.46
1.57
2.40 2.89
1.63
0.00
1.00
2.00
3.00
4.00
5.00
6.00
Ha Noi City HCM City Dong Nai Province
Binh Duong Province
Ba Ria Province
Vietnam
2008 2010
-‐
1.00
2.00
3.00
4.00
5.00
6.00
HCMC Hanoi Vietnam
2004
2006
2008
2010
11
As can be seen from the graph, beef consumption per capita in the country generally tends
to increase , however in 2010, in 2 cities that had largest beef consumption in Vietnam,
HCMC and Hanoi, it declined. This can be attributed to the economic downturn which leads
to the reduce of consumer purchasing power in 2010
To see the picture of demand for beef in HCMC, we will consider meat consumption in
general
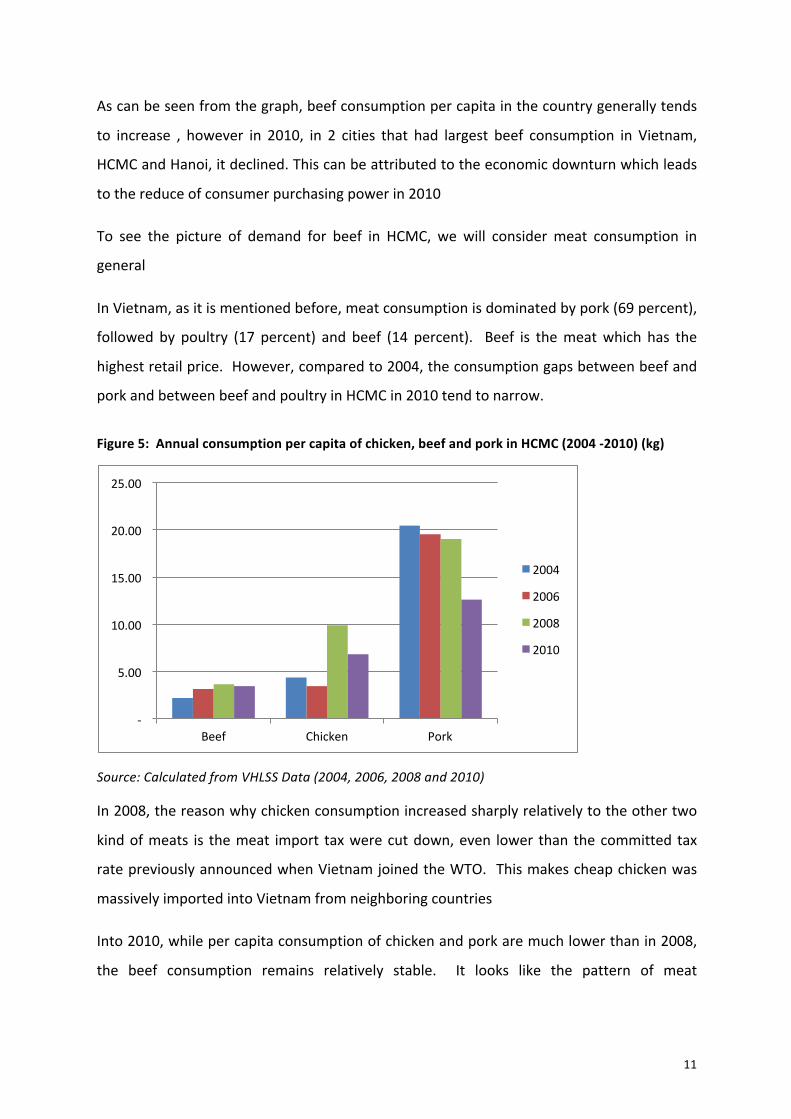
In Vietnam, as it is mentioned before, meat consumption is dominated by pork (69 percent),
followed by poultry (17 percent) and beef (14 percent). Beef is the meat which has the
highest retail price. However, compared to 2004, the consumption gaps between beef and
pork and between beef and poultry in HCMC in 2010 tend to narrow.
Figure 5: Annual consumption per capita of chicken, beef and pork in HCMC (2004 -‐2010) (kg)
Source: Calculated from VHLSS Data (2004, 2006, 2008 and 2010)
In 2008, the reason why chicken consumption increased sharply relatively to the other two
kind of meats is the meat import tax were cut down, even lower than the committed tax
rate previously announced when Vietnam joined the WTO. This makes cheap chicken was
massively imported into Vietnam from neighboring countries
Into 2010, while per capita consumption of chicken and pork are much lower than in 2008,
the beef consumption remains relatively stable. It looks like the pattern of meat
-‐
5.00
10.00
15.00
20.00
25.00
Beef Chicken Pork
2004
2006
2008
2010
12
consumption slowly shifts toward consuming less pork and chicken while more beef is
needed
As can be seen in Figure 5, comparing with pork and poultry consumption in the city, beef
consumption has less erratic fluctuation.
1.3 Demand for beef and live cattle in HCMC Market According to the conversion chart suggested by the General Statistics Office of Vietnam, 1
kg of live cattle is equivalent to 0.4 kg of beef cut. With the above information on per capita
consumption in HCMC, we can calculate the demand for beef and live cattle in HCMC
market:
Table 1: Demand for beef and live cattle in HCM City from 2004 to 2012 (tons)
Year Population (thousand)
Beef consumption per capita (kg)
Total demand for beef (tons)
Total demand for live cattle (tons)
Growth rate
2004 6,007.60 2.21 13,276.80 29,673.00 2006 6,483.10 3.14 20,356.93 47,931.00 61.5% 2008 6,946.10 3.66 25,422.73 60,496.00 26.2% 2010 7,378.00 3.46 25,527.88 63,980.00 5.8% 2012 7,681.70 3.46 26,578.68 66,446.71 3.9%
Source: Calculated from VHLSS Data (2004, 2006, 2008 and 2010)
Table 1 indicates that, compared with 2008, beef consumption per capita in HCMC in 2010 decreases about 0.2 kg/person. However, due to population growth, the total consumption of beef has increased in HCMC in 2010, reaching about 25.6 thousand tons, 1,000 tons higher than in 2008 . Provisional figures for 2012 using 2010 per capita consumption has reached nearly 66.5 thousand tons of live cattle.
Analysis beef demand in HCMC market of 5 consumer groups by differentiated by income-‐
level
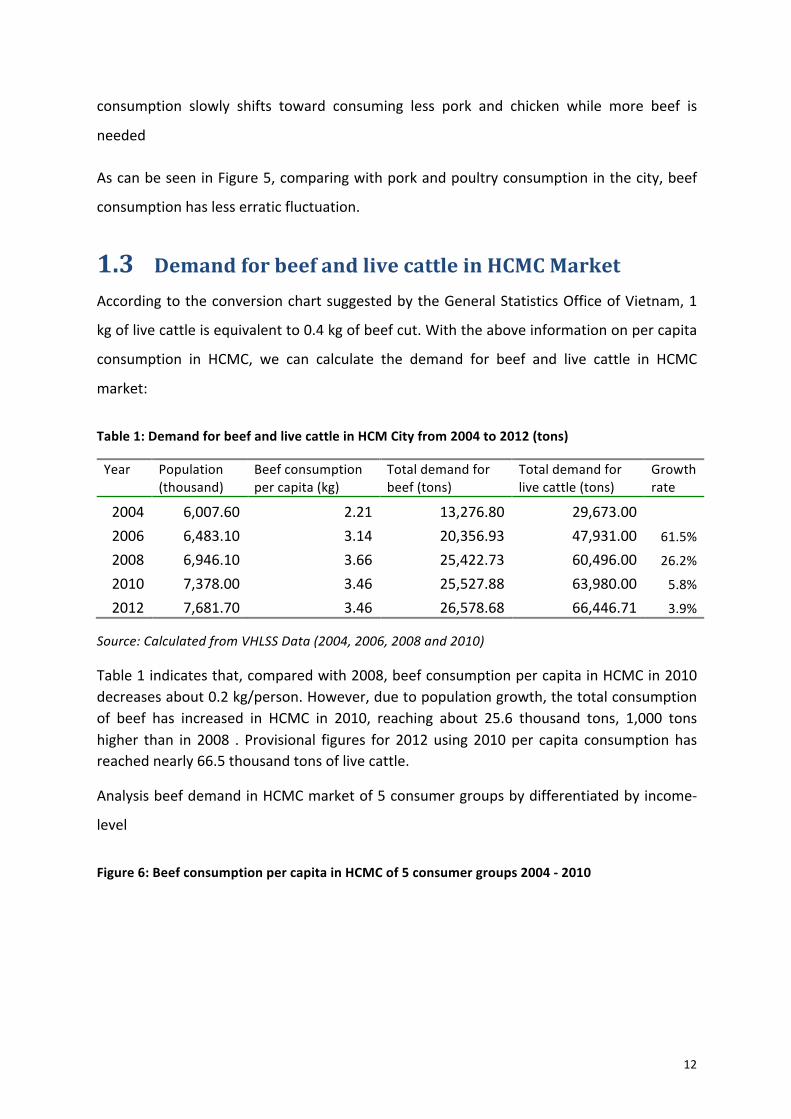
Figure 6: Beef consumption per capita in HCMC of 5 consumer groups 2004 -‐ 2010
13
Source: Calculated from VHLSS Data (2004, 2006, 2008 and 2010)
Please note that consumers are grouped according to five quintiles of national income per
capita and because there are no people in HCMC who are in the lowest income quintile
included in the VHLSS survey, the plot for the lowest income quintile is always equal to 0
and not relevant in the graph.
Analysis of annual beef consumption per capita in HCMC under 5 income quintiles shows
that the highest income group (top 20%) is the group with the most beef consumption, far
more than the high income group (next 20%). However, beef consumption of middle-‐
income quintile and high income quintile also increase a lot in recent years. We can expect
that the increase in per capita income, especially the rapid increase of the middle income
class will quickly raise beef demand in Ho Chi Minh City
0.00 0.50 1.00 1.50 2.00 2.50 3.00 3.50 4.00 4.50 5.00
2004 2006 2008 2010
Lowest
Low
Medium
High
Highest
14
2 Beef Supply
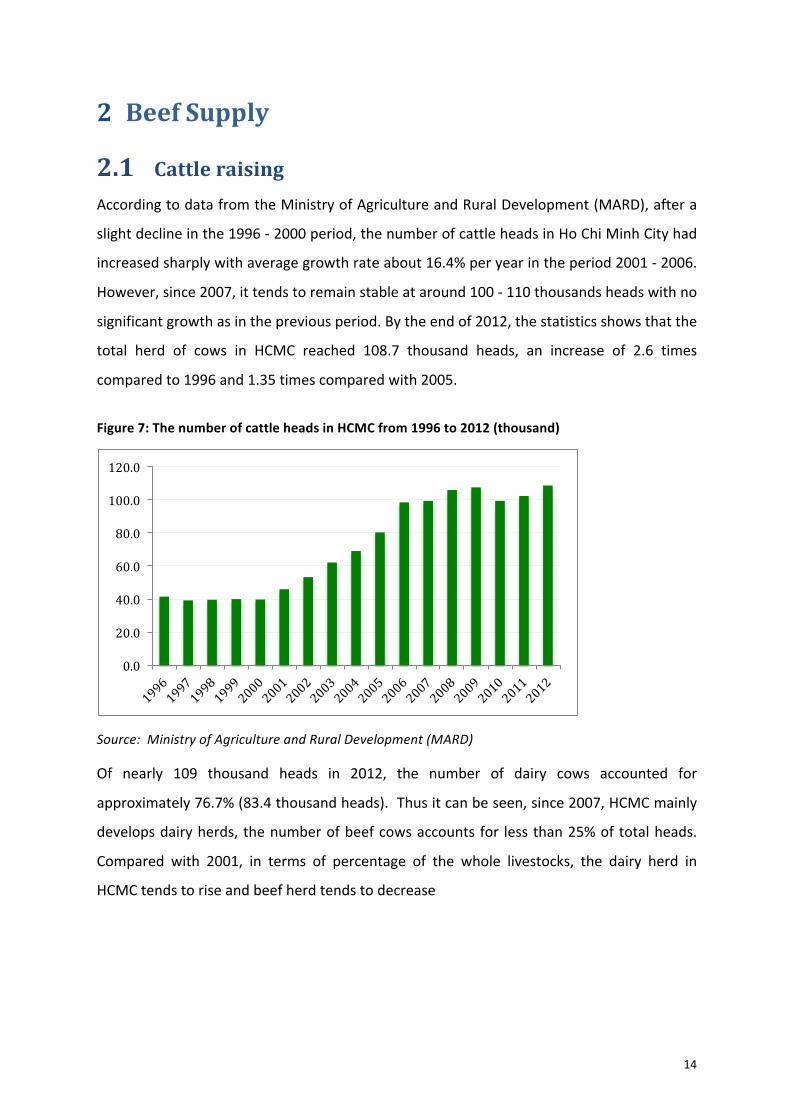
2.1 Cattle raising According to data from the Ministry of Agriculture and Rural Development (MARD), after a
slight decline in the 1996 -‐ 2000 period, the number of cattle heads in Ho Chi Minh City had
increased sharply with average growth rate about 16.4% per year in the period 2001 -‐ 2006.
However, since 2007, it tends to remain stable at around 100 -‐ 110 thousands heads with no
significant growth as in the previous period. By the end of 2012, the statistics shows that the
total herd of cows in HCMC reached 108.7 thousand heads, an increase of 2.6 times
compared to 1996 and 1.35 times compared with 2005.
Figure 7: The number of cattle heads in HCMC from 1996 to 2012 (thousand)
Source: Ministry of Agriculture and Rural Development (MARD)
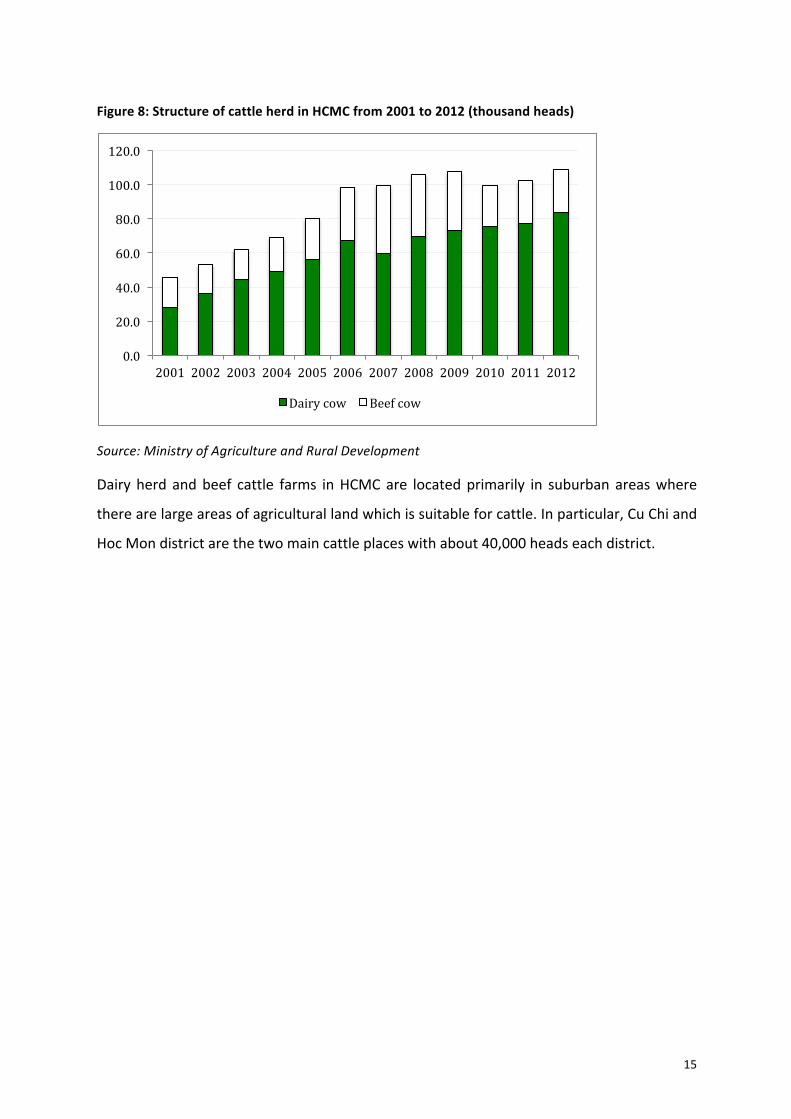
Of nearly 109 thousand heads in 2012, the number of dairy cows accounted for
approximately 76.7% (83.4 thousand heads). Thus it can be seen, since 2007, HCMC mainly
develops dairy herds, the number of beef cows accounts for less than 25% of total heads.
Compared with 2001, in terms of percentage of the whole livestocks, the dairy herd in
HCMC tends to rise and beef herd tends to decrease
0.0
20.0
40.0
60.0
80.0
100.0
120.0
15
Figure 8: Structure of cattle herd in HCMC from 2001 to 2012 (thousand heads)
Source: Ministry of Agriculture and Rural Development
Dairy herd and beef cattle farms in HCMC are located primarily in suburban areas where
there are large areas of agricultural land which is suitable for cattle. In particular, Cu Chi and
Hoc Mon district are the two main cattle places with about 40,000 heads each district.
0.0
20.0
40.0
60.0
80.0
100.0
120.0
2001 2002 2003 2004 2005 2006 2007 2008 2009 2010 2011 2012
Dairy cow Beef cow
16
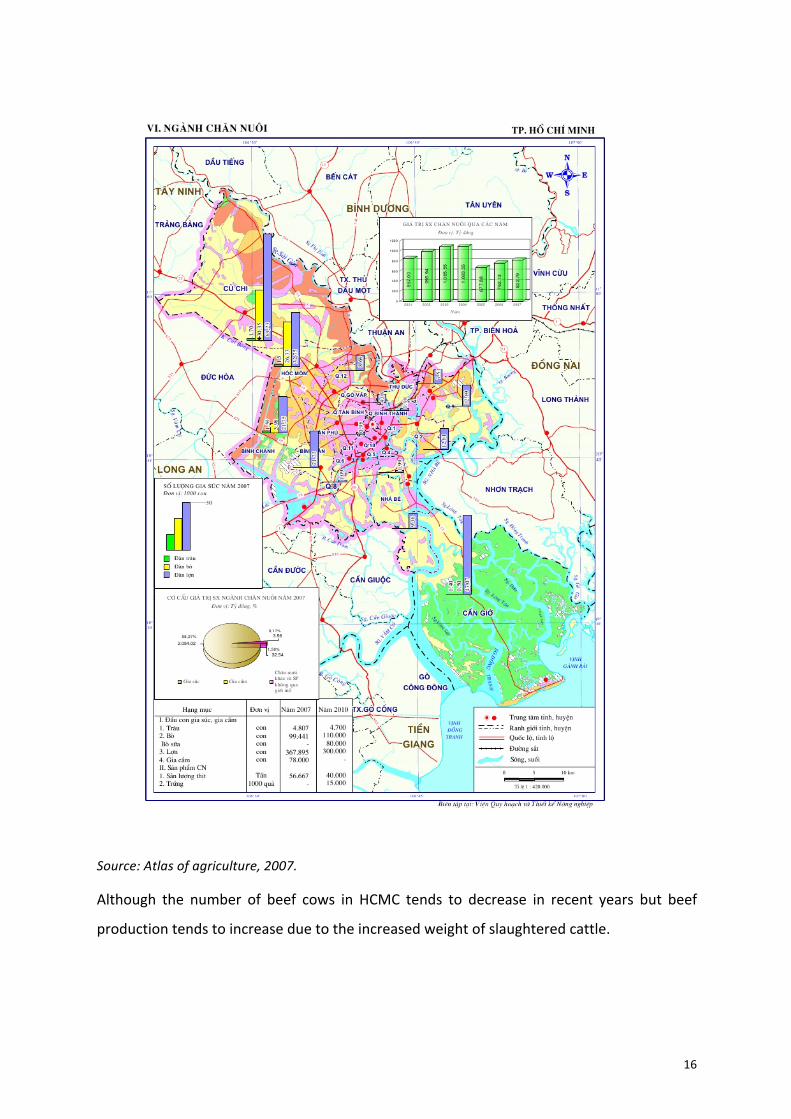
Source: Atlas of agriculture, 2007.
Although the number of beef cows in HCMC tends to decrease in recent years but beef
production tends to increase due to the increased weight of slaughtered cattle.
17
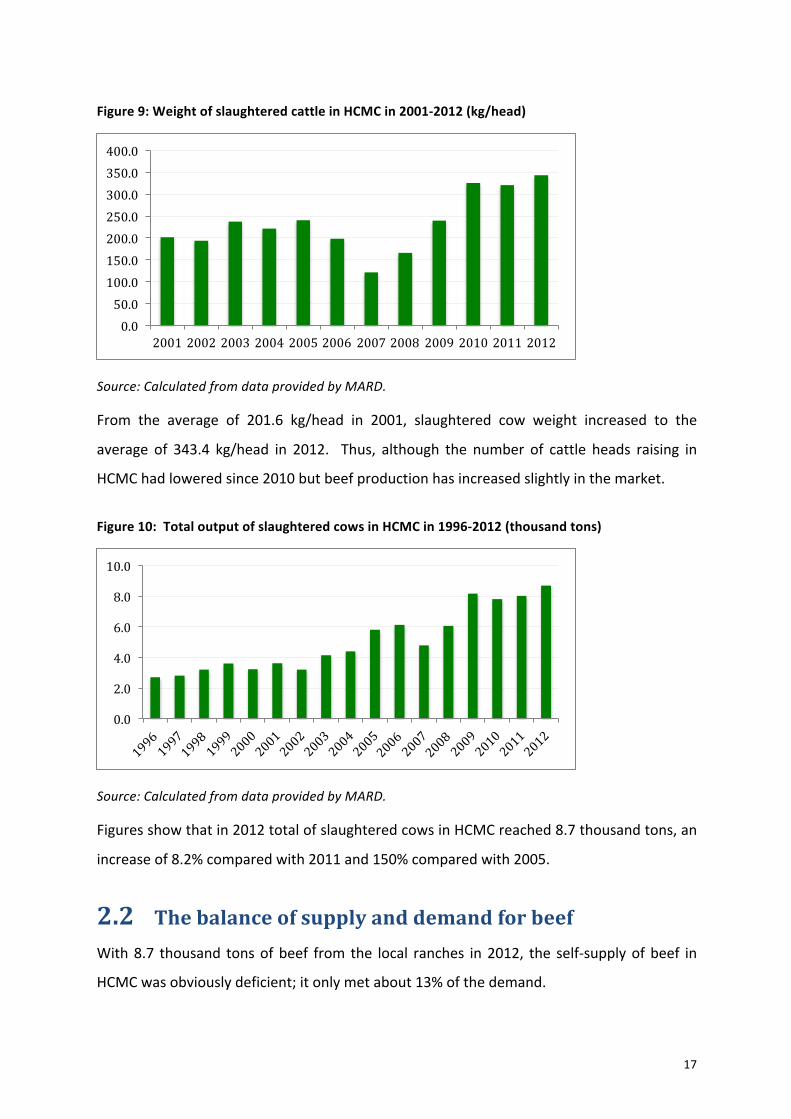
Figure 9: Weight of slaughtered cattle in HCMC in 2001-‐2012 (kg/head)
Source: Calculated from data provided by MARD.
From the average of 201.6 kg/head in 2001, slaughtered cow weight increased to the
average of 343.4 kg/head in 2012. Thus, although the number of cattle heads raising in
HCMC had lowered since 2010 but beef production has increased slightly in the market.
Figure 10: Total output of slaughtered cows in HCMC in 1996-‐2012 (thousand tons)
Source: Calculated from data provided by MARD.
Figures show that in 2012 total of slaughtered cows in HCMC reached 8.7 thousand tons, an
increase of 8.2% compared with 2011 and 150% compared with 2005.
2.2 The balance of supply and demand for beef With 8.7 thousand tons of beef from the local ranches in 2012, the self-‐supply of beef in
HCMC was obviously deficient; it only met about 13% of the demand.
0.0 50.0 100.0 150.0 200.0 250.0 300.0 350.0 400.0
2001 2002 2003 2004 2005 2006 2007 2008 2009 2010 2011 2012
0.0
2.0
4.0
6.0
8.0
10.0

18
Table 2: Balance of self-‐supply and demand for beef in HCMC from 2004 to 2012 (tons)
Year Beef
demand
live cattle
demand
Live cattle
self-‐suply
Gap Self-‐suply/
demand
2004 13,277 29,673 4,396 25,277 14.81%
2006 20,357 47,931 6,135 41,796 12.80%
2008 25,423 60,496 6,055 54,441 10.01%
2010 25,528 63,980 7,815 56,165 12.21%
2012 26,579 66,447 8,687 57,760 13.07%
Table 2 shows that the self-‐supply for beef from locally raised cattle only meet 10% of the
demand for beef in HCMC in 2008, 13% in 2012. Consequently, to clear this very large
shortage, the additional beef supply for HCMC originates from two main channels:
• Local live cattle “imported” from the neighboring areas: as the South East provinces,
the Mekong Delta region including from South-‐East Cambodia, even from the central
highland and northern provinces
• Imports of live cattle, fresh beef and frozen beef from many countries around the
world
2.3 Beef supply from neighboring areas including Cambodia:
Beef imported from the neighboring provinces of HCMC as : Dong Nai , Binh Duong , An
Giang, Kien Giang , Ben Tre ... According to the GSO, number of herbs in these neighboring
provinces from 1996 to 2012 as follows:
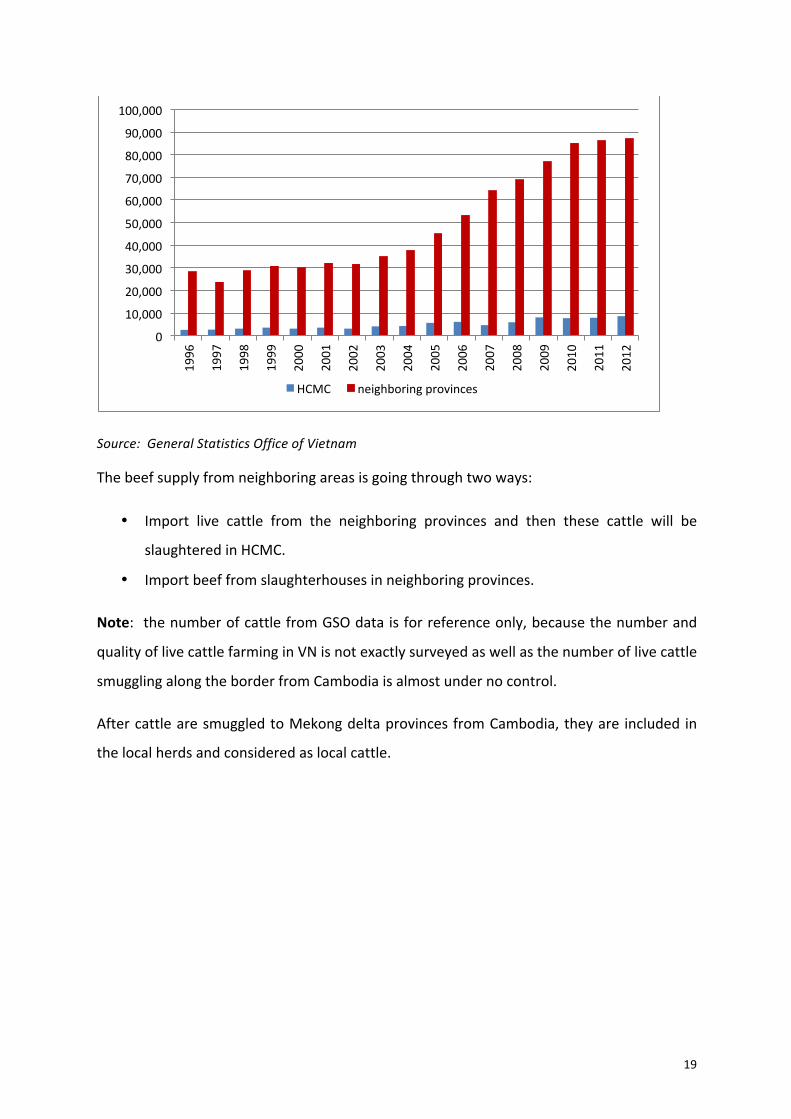
Figure 11: Total supply of live cattle in HCMC and neighboring provinces (tons/year)
19
Source: General Statistics Office of Vietnam
The beef supply from neighboring areas is going through two ways:
• Import live cattle from the neighboring provinces and then these cattle will be
slaughtered in HCMC.
• Import beef from slaughterhouses in neighboring provinces.
Note: the number of cattle from GSO data is for reference only, because the number and
quality of live cattle farming in VN is not exactly surveyed as well as the number of live cattle
smuggling along the border from Cambodia is almost under no control.
After cattle are smuggled to Mekong delta provinces from Cambodia, they are included in
the local herds and considered as local cattle.
0
10,000
20,000
30,000
40,000
50,000
60,000
70,000
80,000
90,000
100,000
1996
1997
1998
1999
2000
2001
2002
2003
2004
2005
2006
2007
2008
2009
2010
2011
2012
HCMC neighboring provinces

20
Figure 12: Volume of live cattle/buffalo slaughtered in neighboring provinces and destined to
HCMC’s beef market in 2010
Source: Report from ACIAR project AH/2006/025
The figures show that Long An, Tay Ninh and Dong Nai provinces slaughter 74 percent of all
cattle and buffaloes destined to HCMC market.
As mentioned previously, beef consumed in HCMC is also procured from local
slaughterhouses. As such the meat originates to some extent from local animals (kept in
HCMC) but to a greater extent from animals “imported” live from neighboring provinces.
The following figure shows the provenance of live cattle/buffalo traded live into HCMC and
slaughtered at slaughterhouses within the city in 2010.
120,909 68,076
36,950 30,860
20,361 15,471 11,172
60
-‐ 40,000 80,000 120,000
Long An Tay Ninh Dong Nai
Tien Giang Binh Duong Dong Nai Ben Tre
Other provinces
Heads
Provinces o
f orig
in
Volume (in heads) of live cattle/buffaloes slaughtered in neighbouring provinces and sold to HCMC in 2010
Heads
21
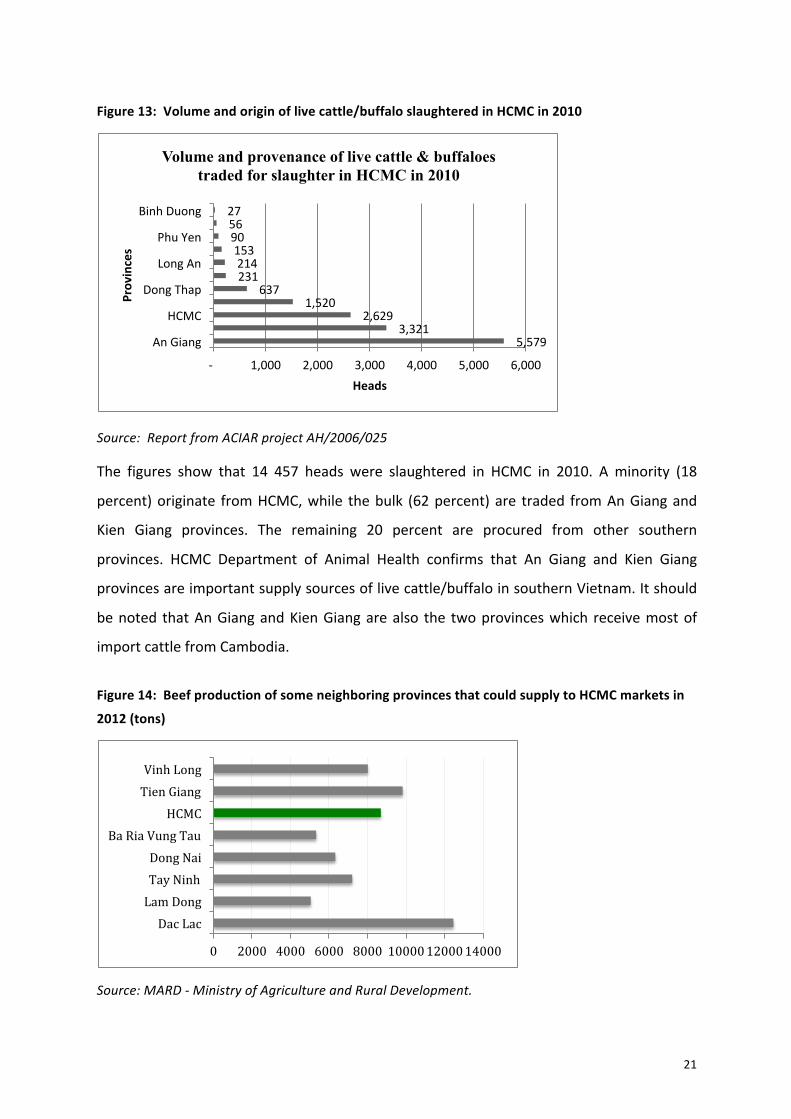
Figure 13: Volume and origin of live cattle/buffalo slaughtered in HCMC in 2010
Source: Report from ACIAR project AH/2006/025
The figures show that 14 457 heads were slaughtered in HCMC in 2010. A minority (18
percent) originate from HCMC, while the bulk (62 percent) are traded from An Giang and
Kien Giang provinces. The remaining 20 percent are procured from other southern
provinces. HCMC Department of Animal Health confirms that An Giang and Kien Giang
provinces are important supply sources of live cattle/buffalo in southern Vietnam. It should
be noted that An Giang and Kien Giang are also the two provinces which receive most of
import cattle from Cambodia.
Figure 14: Beef production of some neighboring provinces that could supply to HCMC markets in
2012 (tons)
Source: MARD -‐ Ministry of Agriculture and Rural Development.
5,579 3,321
2,629 1,520
637 231 214 153 90 56 27
-‐ 1,000 2,000 3,000 4,000 5,000 6,000
An Giang
HCMC
Dong Thap
Long An
Phu Yen
Binh Duong
Heads
Provinces
Volume and provenance of live cattle & buffaloes traded for slaughter in HCMC in 2010
0 2000 4000 6000 8000 10000 12000 14000
Dac Lac Lam Dong Tay Ninh Dong Nai
Ba Ria Vung Tau HCMC
Tien Giang Vinh Long
22
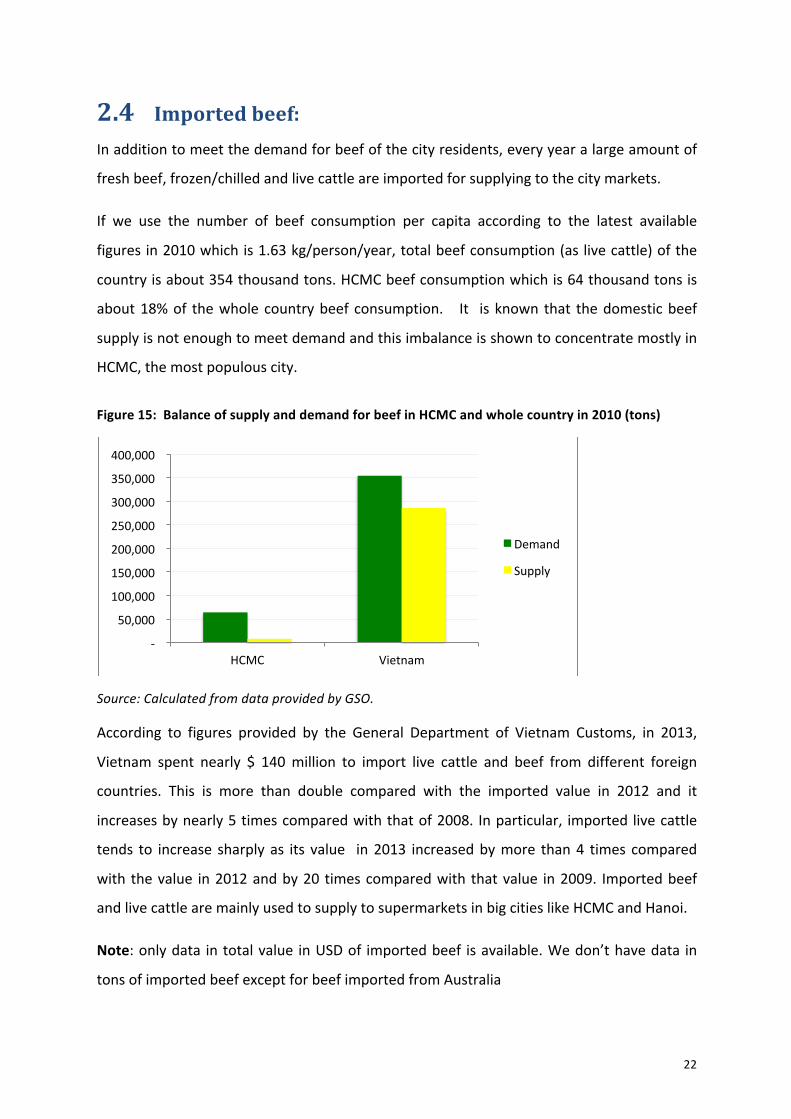
2.4 Imported beef: In addition to meet the demand for beef of the city residents, every year a large amount of
fresh beef, frozen/chilled and live cattle are imported for supplying to the city markets.
If we use the number of beef consumption per capita according to the latest available
figures in 2010 which is 1.63 kg/person/year, total beef consumption (as live cattle) of the
country is about 354 thousand tons. HCMC beef consumption which is 64 thousand tons is
about 18% of the whole country beef consumption. It is known that the domestic beef
supply is not enough to meet demand and this imbalance is shown to concentrate mostly in
HCMC, the most populous city.
Figure 15: Balance of supply and demand for beef in HCMC and whole country in 2010 (tons)
Source: Calculated from data provided by GSO.
According to figures provided by the General Department of Vietnam Customs, in 2013,
Vietnam spent nearly $ 140 million to import live cattle and beef from different foreign
countries. This is more than double compared with the imported value in 2012 and it
increases by nearly 5 times compared with that of 2008. In particular, imported live cattle
tends to increase sharply as its value in 2013 increased by more than 4 times compared
with the value in 2012 and by 20 times compared with that value in 2009. Imported beef
and live cattle are mainly used to supply to supermarkets in big cities like HCMC and Hanoi.
Note: only data in total value in USD of imported beef is available. We don’t have data in
tons of imported beef except for beef imported from Australia
-‐
50,000
100,000
150,000
200,000
250,000
300,000
350,000
400,000
HCMC Vietnam
Demand
Supply
23
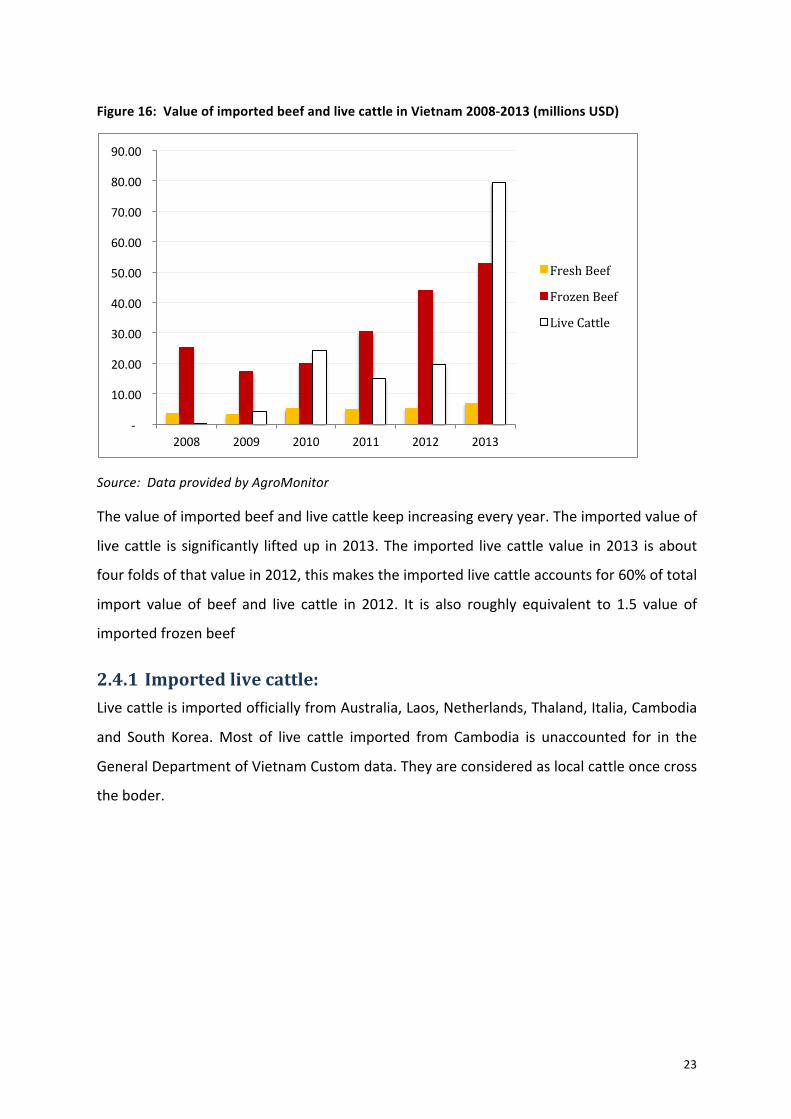
Figure 16: Value of imported beef and live cattle in Vietnam 2008-‐2013 (millions USD)
Source: Data provided by AgroMonitor
The value of imported beef and live cattle keep increasing every year. The imported value of
live cattle is significantly lifted up in 2013. The imported live cattle value in 2013 is about
four folds of that value in 2012, this makes the imported live cattle accounts for 60% of total
import value of beef and live cattle in 2012. It is also roughly equivalent to 1.5 value of
imported frozen beef
2.4.1 Imported live cattle: Live cattle is imported officially from Australia, Laos, Netherlands, Thaland, Italia, Cambodia
and South Korea. Most of live cattle imported from Cambodia is unaccounted for in the
General Department of Vietnam Custom data. They are considered as local cattle once cross
the boder.
-‐
10.00
20.00
30.00
40.00
50.00
60.00
70.00
80.00
90.00
2008 2009 2010 2011 2012 2013
Fresh Beef
Frozen Beef
Live Cattle

24
Table 3: Value of imported live cattle in Vietnam 2008 -‐ 2013 (thousands USD)
2008 2009 2010 2011 2012 2013 Total %
Australia
1,206.8 3,989.7 1,744.5 3,987.1 60,961.3 71,889.5 50.5% Laos
17.2
21.2
38.4 0.0%
Netherlands
1,679.6
1,679.6 1.2% New Zealand
10,674.2 11,143.3 6,297.7
28,115.2 19.7%
Thailand 11.1 2,642.8 7,849.0 2,083.6 9,373.2 18,557.4 40,517.1 28.4% Italia
122.9
122.9 0.1%
Cambodia
16.2
16.2 0.0% South Korea
81.0
81.0 0.1%
Total 11 4,054 24,210 14,971 19,695 79,519 142,460 100% Growth Rate 36418% 497% -‐38% 32% 304%
Source: General Department of Vietnam Customs
Table 3 shows that live cattle is imported to Vietnam with stable suppliers from Australia,
New Zealand and Thailand. The major change of this business happens in 2013 when
Vietnam only officially imports live cattle from Australia and Thailand in which live cattle
from Australis accounted for 76.7% of total imported value. The jump in 2013 of live cattle
imported from Australia makes the import value from Australia accounts for 50% of total
import value in the last five years.
Figure 17: Value of imported live cattle in Vietnam 2008 -‐ 2013 (USD)
Source: General Department of Vietnam Customs
0
10000000
20000000
30000000
40000000
50000000
60000000
70000000
2008
2009
2010
2011
2012
2013

25
Figure 18: Monthly value of imported live cattle in Vietnam 2008-‐2013 (USD)
Source: General Department of Vietnam Customs
The live cattle imported in 2013 increased significantly starting in April. It decreased in
September because of the new custom regulation implemented and then keep increasing
sharply again in the last months of 2013
The price of live cattle imported from Australia in 2013 fluctuates in the range 2.27 to 2.42
USD/kg. Using these prices, we could indicate that Vietnam imports about 30 thousand tons
live cattle from Australia in 2013
2.4.2 Imported frozen beef:
Frozen meat is the traditional imported meat for food market in Vietnam
Table 4: Value of imported frozen beef in Vietnam 2008 -‐ 2013 (USD)
2008 2009 2010 2011 2012 2013 %
Argentina 481,916 255,061 193,133 81,595 33,852 0.55% Australia 1,715,423 1,678,146 2,922,238 4,503,323 9,309,815 8,616,667 15.17% Austria 46,313 20,096 0.04% Brazil 42,427 0.02% Canada 57,424 179,639 151,989 116,872 73,958 0.31% Chile 1,416 0.00% Egypt 77,000 0.04% France 4,796 1,438 457 0.00% Hong Kong 731,782 0.39% India 18,198,357 13,501,698 13,584,041 20,341,499 26,264,010 30,083,624 64.36% Indonesia 193,519 159,600 0.19% Japan 14,212 0.01%
0 2000000 4000000 6000000 8000000 10000000 12000000 14000000 16000000 18000000
Jan Feb Mar Apr May Jun Jul Aug Sep Oct Nov Dec
2008 2009 2010 2011 2012 2013

26
Sooth Korea 140,872 102,945 0.13% Malaysia 731,894 0.39% Mexico 61,594 0.03% Netherlands 13,424 0.01% New Zealand 1,017,366 170,519 369,360 506,079 660,820 973,324 1.95% Norway 3,834 1,688 0.00% Paraguay 82,566 89,628 0.09% Singapore 112,766 349 2,976 7,123 0.07% USA 2,251,068 1,158,088 2,586,853 4,353,015 7,427,296 12,971,750 16.22%
Uruguay 91,208 0.05%
Total 25,044,607 17,181,538 19,978,981 30,561,381 43,817,494 52,941,743 100.00%
Source: General Department of Vietnam Customs
Based on data provided by General Department of Vietnam Customs, from 2008 to 2013,
frozen beef is imported from 23 countries. The largest source is from India (64.36%)
following by USA (16.22%) and Australia (15.11%). In Vietnamese markets, consumers have
high regards to imported beef and accept to pay much more for imported beef from Japan,
USA and Australia. Imported beef from the rest countries is considered as local beef by
consumers and they pay the same price as the price of local beef. Indeed, only imported
beef from Japan, USA and Australia is labeled in supermarkets. All other imported beefs are
unlabeled and treated as local beefs
Figure 19: Monthly value of imported fozen beef in Vietnam 2008-‐2013 (USD)
Source: General Department of Vietnam Customs
In general, frozen beef is imported more during the last months of the year to meet the high
demand of the festival season. This does not happen in 2013, imported beef reduced
0 1,000,000 2,000,000 3,000,000 4,000,000 5,000,000 6,000,000 7,000,000 8,000,000
Jan Feb Mar Apr May Jun Jul Aug Sep Oct Nov Dec
2008 2009 2010 2011 2012 2013
27
substantially during the last three months. This can be explained by the sharply increase in
live cattle imported from Australia in the same months
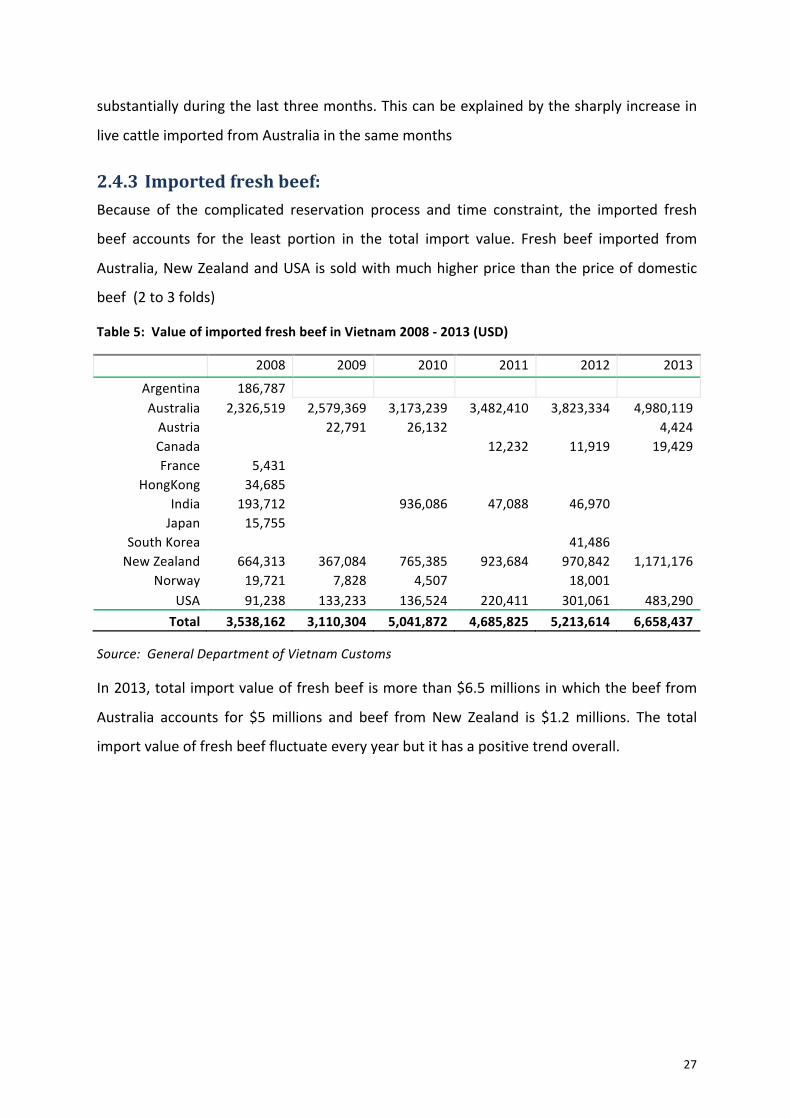
2.4.3 Imported fresh beef: Because of the complicated reservation process and time constraint, the imported fresh
beef accounts for the least portion in the total import value. Fresh beef imported from
Australia, New Zealand and USA is sold with much higher price than the price of domestic
beef (2 to 3 folds)
Table 5: Value of imported fresh beef in Vietnam 2008 -‐ 2013 (USD)
2008 2009 2010 2011 2012 2013
Argentina 186,787 Australia 2,326,519 2,579,369 3,173,239 3,482,410 3,823,334 4,980,119 Austria
22,791 26,132
4,424
Canada
12,232 11,919 19,429 France 5,431
HongKong 34,685 India 193,712
936,086 47,088 46,970 Japan 15,755
South Korea
41,486 New Zealand 664,313 367,084 765,385 923,684 970,842 1,171,176
Norway 19,721 7,828 4,507
18,001 USA 91,238 133,233 136,524 220,411 301,061 483,290
Total 3,538,162 3,110,304 5,041,872 4,685,825 5,213,614 6,658,437
Source: General Department of Vietnam Customs
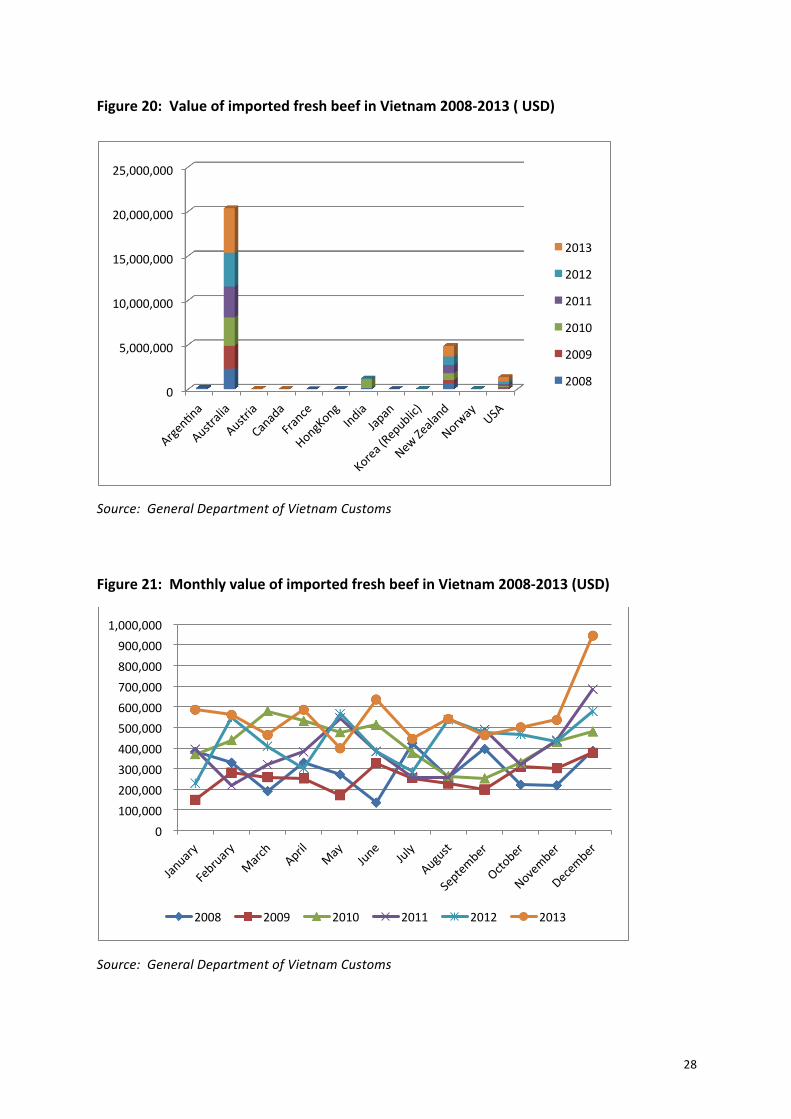
In 2013, total import value of fresh beef is more than $6.5 millions in which the beef from
Australia accounts for $5 millions and beef from New Zealand is $1.2 millions. The total
import value of fresh beef fluctuate every year but it has a positive trend overall.
28
Figure 20: Value of imported fresh beef in Vietnam 2008-‐2013 ( USD)
Source: General Department of Vietnam Customs
Figure 21: Monthly value of imported fresh beef in Vietnam 2008-‐2013 (USD)
Source: General Department of Vietnam Customs
0
5,000,000
10,000,000
15,000,000
20,000,000
25,000,000
2013
2012
2011
2010
2009
2008
0 100,000 200,000 300,000 400,000 500,000 600,000 700,000 800,000 900,000
1,000,000
2008 2009 2010 2011 2012 2013

29
2.5 Imported beef and live cattle from Australia: As analysis in section 2.4, Australia is the largest and fastest growth import market of
Vietnam in all three kinds of meat: live cattle, frozen beef and fresh beef
Figure 22: Value of imported beef from Australia 2008-‐2013 (USD)
Source: General Department of Vietnam Customs
Australia live cattle exported to Vietnam have increased about 20-‐fold during the period
2012-‐2013, from 3.500 to 66.951 live cattle. Imported value correspondingly increases from
$4 millions to $61 millions. Recent data released from Ministry of Trade signals that this
growth is not slowing down as there were 40.000 cattle have been exported to Vietnam
from Australia in the first 3 months of 2014
Figure 23: Imported live cattle from Australia in 2013 (USD)
In early March 2014, a government and business delegation, leaded by the Minister of
Northern Australia Industries Van Holthe, visited the cattle fattening and slaughtering places
in Ho Chi Minh City and Hai Phong City. The CEO of Livestock Exporters Association of
-‐
10,000,000
20,000,000
30,000,000
40,000,000
50,000,000
60,000,000
70,000,000
2008 2009 2010 2011 2012 2013
Fresh Beef
Frozen Beef
Live Canle
-‐ 2,000,000 4,000,000 6,000,000 8,000,000
10,000,000 12,000,000 14,000,000 16,000,000
1 2 3 4 5 6 7 8 9 10 11 12
30
Northern Australia, Ben Hindle said that Vietnamese importing companies have invested
heavily in infrastructure to meet the requirements by Australian live cattle exporters,
especially on ranch facilities, fattening areas and slaughtering places
It is expected that in 2014, Vietnam will import 150.000 live cattle from Australia, surpasses
Israel (98.000 cattle in 2013) to become the second largest export market for Australia live
cattle, second only to Indonesia (450.000 cattle in 2013).
Beef processed from live cattle imported from Australia in future could be provided for
Phnom Penh supermarkets. This will have a significant impact on the market for beef in both
HCMC and Phnom Penh. In near future, we expect beef from Australia live cattle will be
considered by consumers in HCMC as local beef like beef from other countries such as India,
Urugoay, Argentina, … The price for Australive live catte-‐beef will be the same as the
domestic beef supplied from local provinces as well as from Cambodia. This new changes in
market places farmers who are raising cattle in Vietnam and Cambodia in a tougher
competitive condition. The domestic beef price is expected to go down slightly in 2014.
It is agreed that the reason live cattle imported from Australia has reached a large number
in a short period is due to the low import tax rate on live cattle (5%) compared with tax rate
on frozen meat (10%). Rather than import frozen meat, many businesses are switching
swiftly to import live catte and set up slaughterhouses to process beef for domestic
demand.

31
3 The factors affecting supply and demand for beef
3.1 Price: Because the supply does not meet demand for beef so that the retail price for beef keeps
increasing continuously starting in 2008. By the end of 2013, retail price for silverside
climbed to nearly 240,000 VND/kg, an increase of 2.5 times compared with the price set in
early 2008. Especially in the 3 years from 2011 to 2013, beef price in HCMC goes up quickly
as the supply could not keep up with the demand and the gap between them is getting
bigger.
Figure 24: Silverside retail price in HCMC market 2008 -‐ 2013 (VND/kg)
Source: Data provided by AgroMonitor
3.2 Animal health information and consumer purchasing power
Considering the retail market for beef and pork in the city, it shows that the pork retail price
reduced significantly in 2013 and in the first half of 2013 due to the PRRS virus disease
(know as “blue ear disease” in Vietnam) in pig and the decline in consumer purchasing
power due to the economic downturn. The price of beef remains bullish. The explanation
for this phenomenom is that the supply for beef from domestic and foreign sources still do
not meet with the quick increase of the demand for beef.
40000
90000
140000
190000
240000
290000
1 4 7 10 1 4 7 10 2 5 8 11 2 5 8 11 2 5 8 11 2 5 8 11
2008 2009 2010 2011 2012 2013

32
Figure 25: Comparing retail average prices for beef and pork in HCMC 2008 -‐2013 (VND/kg)
Source: Data provided by AgroMonitor
However, because of the quick deline in the consumer purchasing power and the
supplemental imports, especially with live cattle imported from Australia, the rise in beef
price is slowing down in 2013. According to data provided by Ministry of Industry and Trade,
the growth of total retail sales and consumer service revenue in 2013 fells to the lowest
level since 2006, reaching 12.6%
Figure 26: Growth of total retail sales of goods and services in Vietnam 2006-‐2015 (%, compared with the previous year)
Source: Ministry of Industry and Trade of Vietnam
70000 90000 110000 130000 150000 170000 190000 210000 230000 250000 270000
40000 50000 60000 70000 80000 90000 100000 110000 120000 130000
1 4 7 10 1 4 7 10 2 5 8 11 2 5 8 11 2 5 8 11 2 5 8 11
2008 2009 2010 2011 2012 2013
Pork Beef
24.1 25.2
35.0
22.9
30.4
23.8
16.4 12.6
14.7 18.1
0.0
5.0
10.0
15.0
20.0
25.0
30.0
35.0
40.0
2006 2007 2008 2009 2010 2011 2012 2013 2014 (DB)
2015 (DB)
33
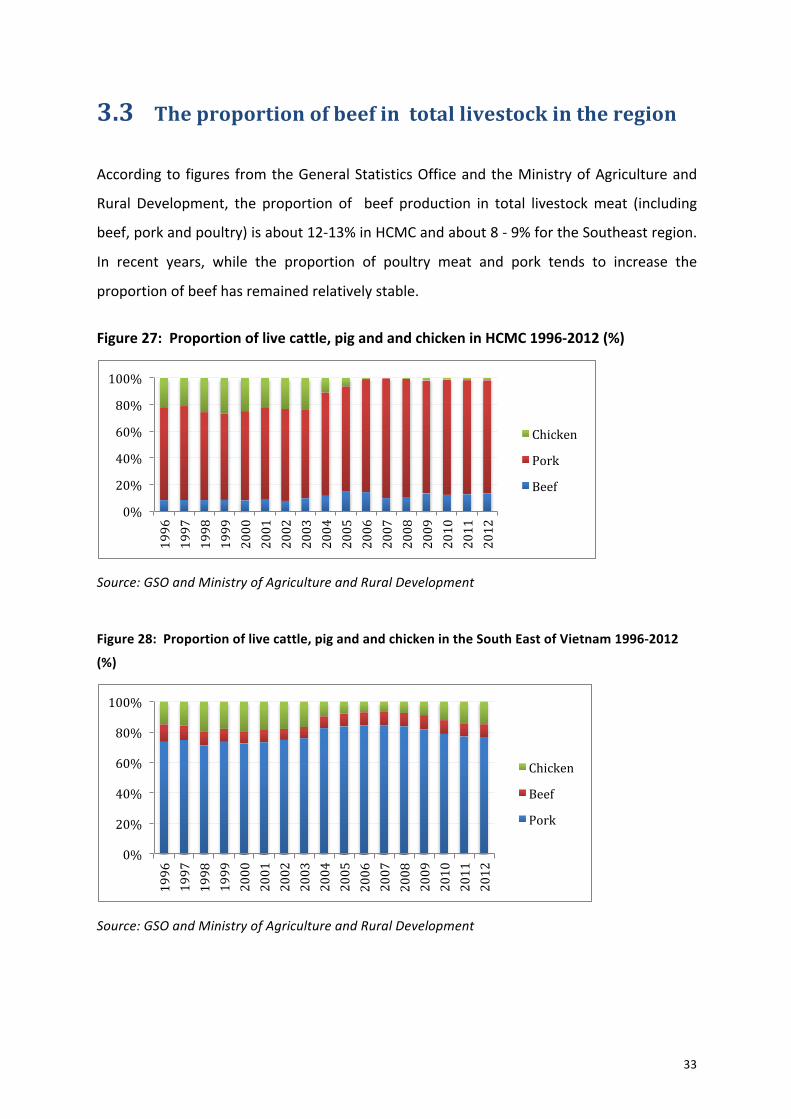
3.3 The proportion of beef in total livestock in the region
According to figures from the General Statistics Office and the Ministry of Agriculture and
Rural Development, the proportion of beef production in total livestock meat (including
beef, pork and poultry) is about 12-‐13% in HCMC and about 8 -‐ 9% for the Southeast region.
In recent years, while the proportion of poultry meat and pork tends to increase the
proportion of beef has remained relatively stable.
Figure 27: Proportion of live cattle, pig and and chicken in HCMC 1996-‐2012 (%)
Source: GSO and Ministry of Agriculture and Rural Development
Figure 28: Proportion of live cattle, pig and and chicken in the South East of Vietnam 1996-‐2012
(%)
Source: GSO and Ministry of Agriculture and Rural Development
0%
20%
40%
60%
80%
100%
1996
1997
1998
1999
2000
2001
2002
2003
2004
2005
2006
2007
2008
2009
2010
2011
2012
Chicken
Pork
Beef
0%
20%
40%
60%
80%
100%
1996
1997
1998
1999
2000
2001
2002
2003
2004
2005
2006
2007
2008
2009
2010
2011
2012
Chicken
Beef
Pork

34
3.4 Supply and demand of substitute and supplemental meats
By calculations from VHLSS 2010, the average consumption of pork, beef, chicken per capita
in the whole country reached 13.54 kg, 1.63kg and 5.51 kg respectively . Multiply these
number by the population of the country in 2010 and convert into live weight, we then have
the numbers in the table below:
Table 6: Supply and demand of meats in the country in 2010 (tons)
Beef Chicken Pork
Demand 354,250 563,527 1,961,777
Supply 285,500 522,834 3,216,900
Source: Calculated from VHLSS 2010
As we could see from the table, while the supply of beef and chicken are not enough to
meet domestic demand, supply of pork is excess demand by a large amount which is more
than 1 million tons / year (the demand here is not including the meat used for food
processing industries such as sausage, ham, rolls, rolls, candy ...). Therefore, every year
Vietnam exports a large number of live pigs to China through the northern border or exports
fresh/frozen/ chilled pork to some Asian markets such as Hong Kong, Malaysia, Singapore ...
Figure 29: Supply and demand of meats in 2010 (tons)
Source: data provided by AgroMonitor
-‐
500,000
1,000,000
1,500,000
2,000,000
2,500,000
3,000,000
3,500,000
Beef Chicken Pork
Demand
Supply
35
3.5 GDP per capita Per capita income in HCMC has been going up relatively fast, roughly round 8-‐10% per year
during the last 12 years, especially the 20% highest income group is getting richer
considerably fast. This leads to the fact that the consumption of a more expensive meat like
beef has increased substantially.
3.6 Sharply increasing of imported live cattle from Australia
Beef demand in this report is generally calculated based on the beef consumption in HCMC
before 2012 while imported beef from US, Japan and Australia were sold with much higher
price compared with price of domestic beef. With the significantly increasing of imported
live cattle from Australia, the supply is raised to an unexpected high level, this makes
Australian beef price is going down considerablely to approach local beef price. Vietnamese
consumers are very happy with beef that processed from live cattle imported from Australia
and the demand for that imported live cattle is going up quickly.
Beef will become more and more popular meat with acceptable price in HCMC , Mekong
region and also Phnom Penh City. The demand for beef is expected to rise in those regions.
In the next phase of the project, we could invest time and effort to study about the impact
of this market change on HCMC and Phnom Penh beef market.
36
4 CONCLUSIONS: HCMC is the most populous city in the country, it also has a high population density. Along
with the rise of per capita income, the demand for beef in the city has continued to
increase. Beef supply from the suburban areas as well as from neighboring provinces still
could not meet the demand by the city markets. The retail price for beef in the city
fluctuates frequently and shows a clearly positive time trend.
The domestic beef supply across the country can hardly increase due to the limited
agriculture land, production technology and grazing condition. The imported live cattle and
beef is considered as the effective supplemental source to clear the beef market
Vietnam is preparing to join the TPP in late 2014 and CEPT/AFTA in 2015 and most of import
tariffs are expected to drop to 0% in the near future. Thus, imports of beef and live cattle
from the countries in those trade agreements is expected to rise sharply, including Australia,
U.S, Japan (TPP) and Cambodia , Laos, Thailand (CEPT).
Vietnam is becoming the Australia’s second largest export market for live cattle. It is
expected that live cattle import from Australia will keep increasing quickly in the years to
come. This will change the picture of supply and demand as well as the beef consumer
behaviors in the region. Consumers in HCMC and Phnom Penh now could approach to beef
originates from Australia with acceptable price
It is worth to invest time and resource to investigate the impact of this change on the beef
market in HCMC and Phnom Penh.

37
5 Appendix: Raw data is collect from many different sources: MARD, GSO, GDVC, MIT, VHLSS 2002, 2004,
2006, 2008, 2010 and from AgriMonitor company. We also collect the quarterly meat report
in Vietnam markets 2008-‐2013