Embed Size (px)
Citation preview
Mobility & Energy Futures Series
Energy Leeds
EMPLOYMENT STRUCTURES AND WORKING PRACTICES
WHAT’S NEXT FOR TRAVEL DEMAND AND ENERGY IN TRANSPORT?
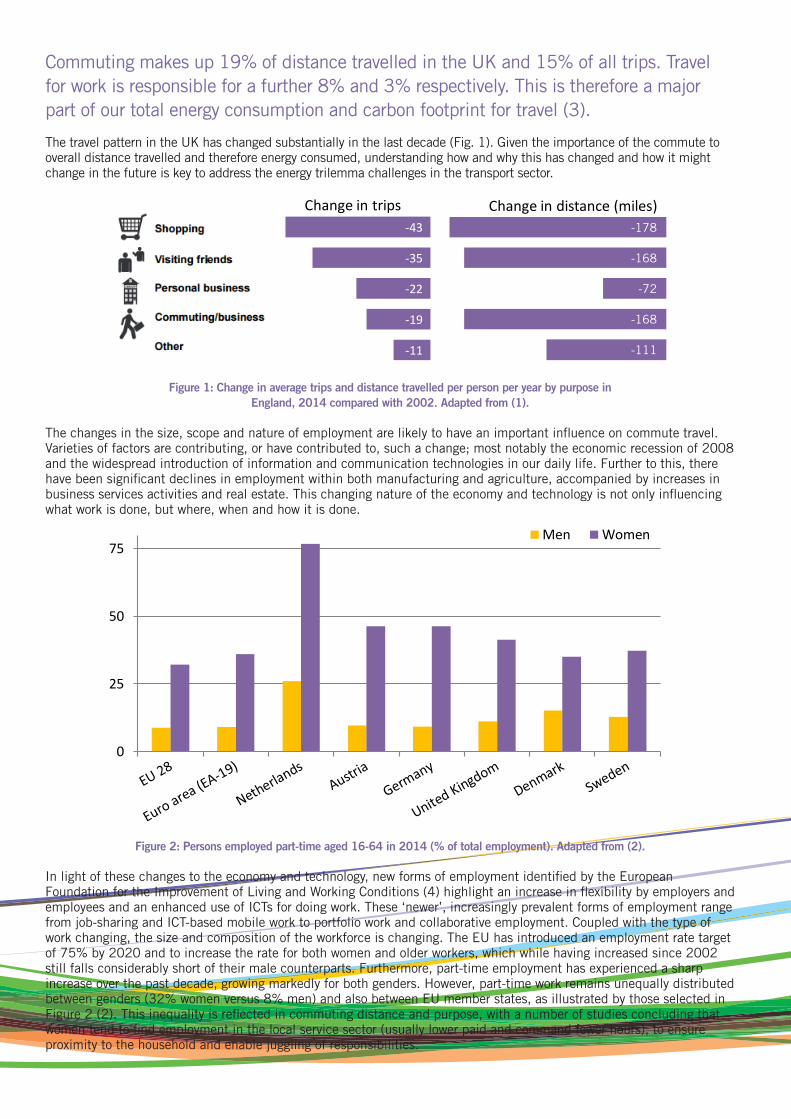
Commuting makes up 19% of distance travelled in the UK and 15% of all trips. Travel for work is responsible for a further 8% and 3% respectively. This is therefore a major part of our total energy consumption and carbon footprint for travel (3).
The travel pattern in the UK has changed substantially in the last decade (Fig. 1). Given the importance of the commute to overall distance travelled and therefore energy consumed, understanding how and why this has changed and how it might change in the future is key to address the energy trilemma challenges in the transport sector.
Figure 1: Change in average trips and distance travelled per person per year by purpose in England, 2014 compared with 2002. Adapted from (1).
The changes in the size, scope and nature of employment are likely to have an important influence on commute travel. Varieties of factors are contributing, or have contributed to, such a change; most notably the economic recession of 2008 and the widespread introduction of information and communication technologies in our daily life. Further to this, there have been significant declines in employment within both manufacturing and agriculture, accompanied by increases in business services activities and real estate. This changing nature of the economy and technology is not only influencing what work is done, but where, when and how it is done.
Figure 2: Persons employed part-time aged 16-64 in 2014 (% of total employment). Adapted from (2).
In light of these changes to the economy and technology, new forms of employment identified by the European Foundation for the Improvement of Living and Working Conditions (4) highlight an increase in flexibility by employers and employees and an enhanced use of ICTs for doing work. These ‘newer’, increasingly prevalent forms of employment range from job-sharing and ICT-based mobile work to portfolio work and collaborative employment. Coupled with the type of work changing, the size and composition of the workforce is changing. The EU has introduced an employment rate target of 75% by 2020 and to increase the rate for both women and older workers, which while having increased since 2002 still falls considerably short of their male counterparts. Furthermore, part-time employment has experienced a sharp increase over the past decade, growing markedly for both genders. However, part-time work remains unequally distributed between genders (32% women versus 8% men) and also between EU member states, as illustrated by those selected in Figure 2 (2). This inequality is reflected in commuting distance and purpose, with a number of studies concluding that women tend to find employment in the local service sector (usually lower paid and command fewer hours), to ensure proximity to the household and enable juggling of responsibilities.
0
25
50
75Men Women
Change in trips Change in distance (miles)Shopping -43 -178Visiting friends -35 -168Personal business -22 -72Commuting/business -19 -168Other -11 -111
Perons employed part-timeMen Women
EU 28 8.8 32.2Euro area (EA-19) 9.1 36Netherlands 26.1 76.7Austria 9.6 46.3Germany 9.2 46.3United Kingdom 11.2 41.3Denmark 15.2 35Sweden 12.8 37.3
-43
-35
-22
-19
-11
Change in trips Change in distance (miles)
0
25
50
75
-178
-168
-72
-168
-111
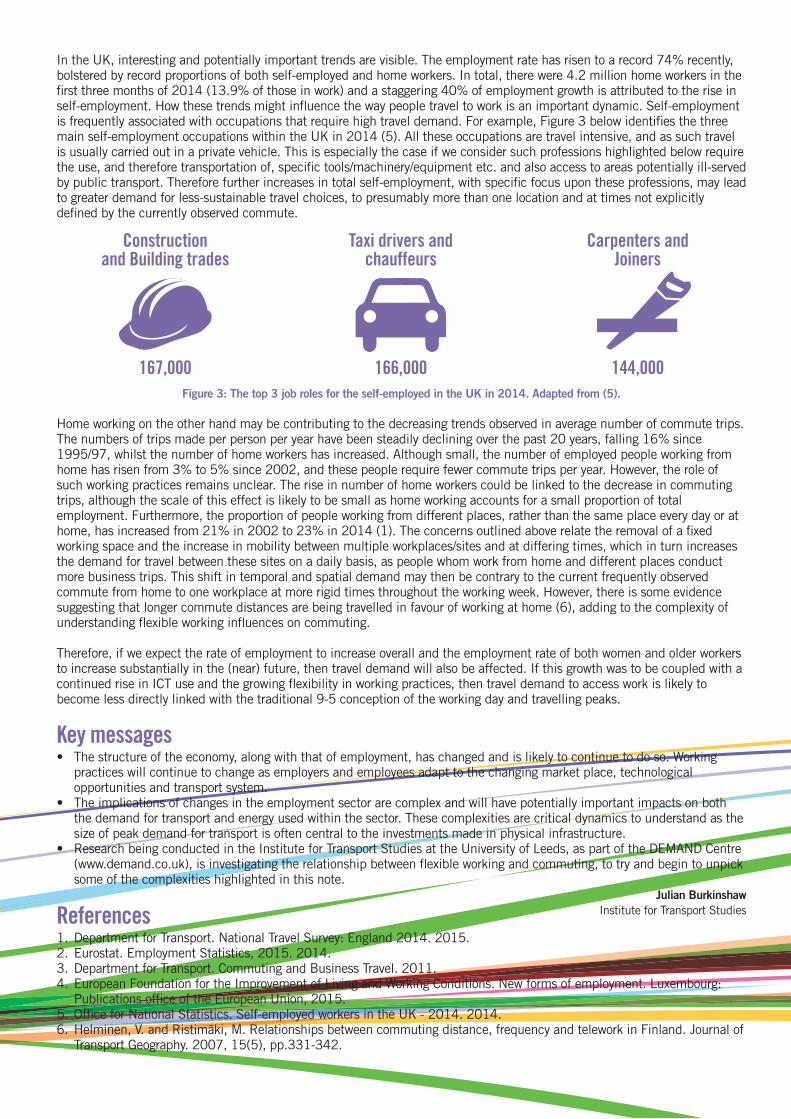
In the UK, interesting and potentially important trends are visible. The employment rate has risen to a record 74% recently, bolstered by record proportions of both self-employed and home workers. In total, there were 4.2 million home workers in the first three months of 2014 (13.9% of those in work) and a staggering 40% of employment growth is attributed to the rise in self-employment. How these trends might influence the way people travel to work is an important dynamic. Self-employment is frequently associated with occupations that require high travel demand. For example, Figure 3 below identifies the three main self-employment occupations within the UK in 2014 (5). All these occupations are travel intensive, and as such travel is usually carried out in a private vehicle. This is especially the case if we consider such professions highlighted below require the use, and therefore transportation of, specific tools/machinery/equipment etc. and also access to areas potentially ill-served by public transport. Therefore further increases in total self-employment, with specific focus upon these professions, may lead to greater demand for less-sustainable travel choices, to presumably more than one location and at times not explicitly defined by the currently observed commute.
Figure 3: The top 3 job roles for the self-employed in the UK in 2014. Adapted from (5).
Home working on the other hand may be contributing to the decreasing trends observed in average number of commute trips. The numbers of trips made per person per year have been steadily declining over the past 20 years, falling 16% since 1995/97, whilst the number of home workers has increased. Although small, the number of employed people working from home has risen from 3% to 5% since 2002, and these people require fewer commute trips per year. However, the role of such working practices remains unclear. The rise in number of home workers could be linked to the decrease in commuting trips, although the scale of this effect is likely to be small as home working accounts for a small proportion of total employment. Furthermore, the proportion of people working from different places, rather than the same place every day or at home, has increased from 21% in 2002 to 23% in 2014 (1). The concerns outlined above relate the removal of a fixed working space and the increase in mobility between multiple workplaces/sites and at differing times, which in turn increases the demand for travel between these sites on a daily basis, as people whom work from home and different places conduct more business trips. This shift in temporal and spatial demand may then be contrary to the current frequently observed commute from home to one workplace at more rigid times throughout the working week. However, there is some evidence suggesting that longer commute distances are being travelled in favour of working at home (6), adding to the complexity of understanding flexible working influences on commuting.
Therefore, if we expect the rate of employment to increase overall and the employment rate of both women and older workers to increase substantially in the (near) future, then travel demand will also be affected. If this growth was to be coupled with a continued rise in ICT use and the growing flexibility in working practices, then travel demand to access work is likely to become less directly linked with the traditional 9-5 conception of the working day and travelling peaks.
Key messages• Thestructureoftheeconomy,alongwiththatofemployment,haschangedandislikelytocontinuetodoso.Working
practices will continue to change as employers and employees adapt to the changing market place, technological opportunities and transport system.
• Theimplicationsofchangesintheemploymentsectorarecomplexandwillhavepotentiallyimportantimpactsonboththe demand for transport and energy used within the sector. These complexities are critical dynamics to understand as the size of peak demand for transport is often central to the investments made in physical infrastructure.
• ResearchbeingconductedintheInstituteforTransportStudiesattheUniversityofLeeds,aspartoftheDEMANDCentre(www.demand.co.uk), is investigating the relationship between flexible working and commuting, to try and begin to unpick some of the complexities highlighted in this note.
Julian Burkinshaw Institute for Transport StudiesReferences
1.DepartmentforTransport.NationalTravelSurvey:England2014.2015.2. Eurostat. Employment Statistics, 2015. 2014.3.DepartmentforTransport.CommutingandBusinessTravel.2011.4. EuropeanFoundationfortheImprovementofLivingandWorkingConditions.Newformsofemployment.Luxembourg:
Publications office of the Eu ropean Union, 2015.5.OfficeforNationalStatistics.Self-employedworkersintheUK-2014.2014.6. Helminen,V.andRistimäki,M.Relationshipsbetweencommutingdistance,frequencyandteleworkinFinland.Journalof
Transport Geography. 2007, 15(5), pp.331-342.
Construction and Building trades
167,000 166,000 144,000
Taxi drivers and chauffeurs
Carpenters and Joiners
University ofLeedsLeeds, United Kingdom
LS29JTTel. 0113 243 1751
www.leeds.ac.uk
Energy LeedsUniversity of LeedsLeeds,LS29JTTel:+44(0)1133434609Email:[email protected]
Mobility & Energy Futures Series
Transport consumes a fifth of global energy and has a near-exclusive reliance on petroleum. As such it has an important role to play in the Energy Trilemma of reducing energy consumption and associated greenhouse gas emission, creating an energy system built on secure supplies and developing the system in ways which are affordable.
Addressing the Energy Trilemma in the transport and mobility sector is especially challenging due to the continued growth in demand for the movement of goods and people, the technical, regulatory and social challenges of moving away from an oil based system of mobility and a complex and fragmented set of stakeholders required to work together to deliver change.
DrawingontheexpertiseandopinionsoftheUniversityofLeedsacademicsfromdifferentdisciplines,thisserieswillhighlightthedrivers, gaps and opportunities in reducing the energy consumption and carbon emissions from the transport sector in future. This is the second briefing in the series.
Other issues in the series are available online at www.its.leeds.ac.uk/research/mobility-energy-futures-series
Editors:
Zia Wadud CentreforIntegratedEnergyResearchEmail:[email protected]:+44 (0)113 343 7733
Greg Marsden Institute for Transport StudiesEmail:[email protected]:+44 (0)113 343 5358