Embed Size (px)
Citation preview
Economic Impacts and Implications of Waterborne Litter
TWCA Annual Conference March 2, 2016
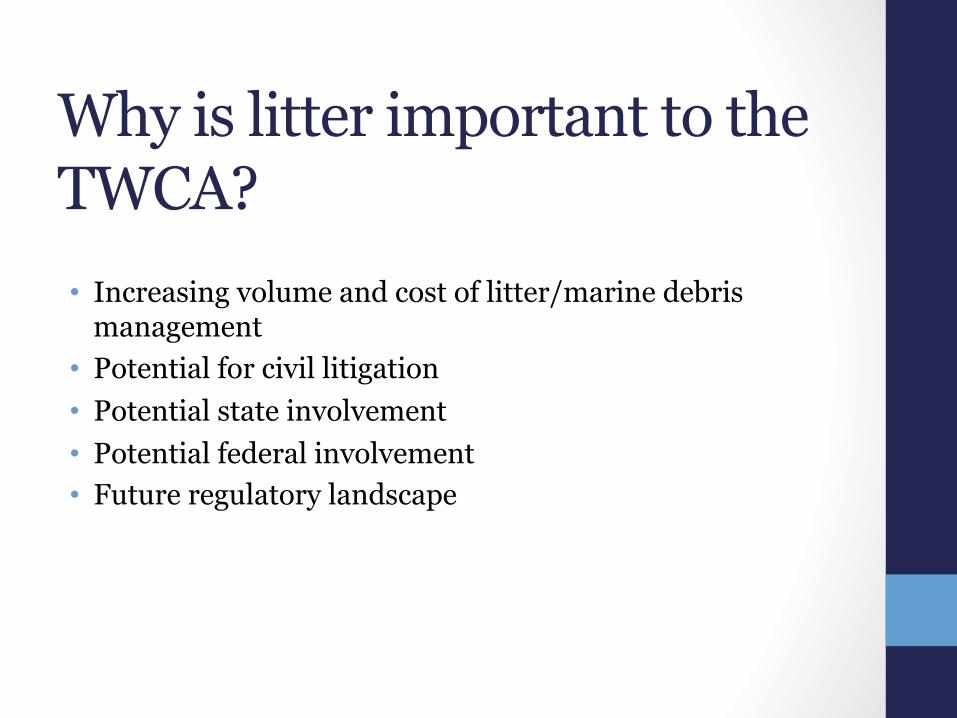
Why is litter important to the TWCA? • Increasing volume and cost of litter/marine debris
management • Potential for civil litigation • Potential state involvement • Potential federal involvement • Future regulatory landscape
What is litter?
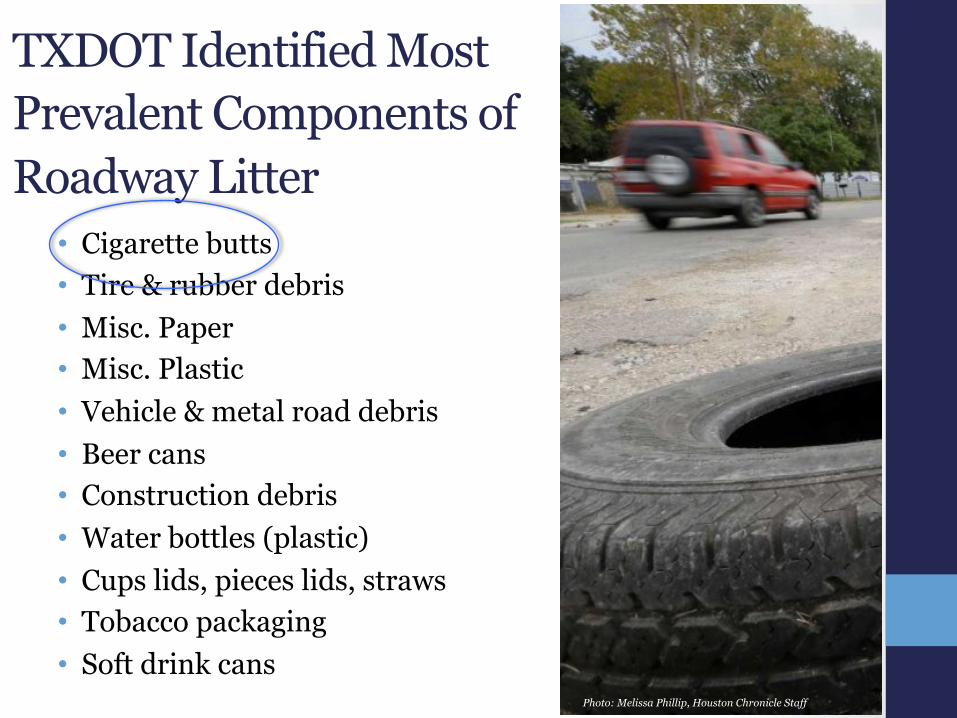
TXDOT Identified Most Prevalent Components of Roadway Litter
• Cigarette butts • Tire & rubber debris • Misc. Paper • Misc. Plastic • Vehicle & metal road debris • Beer cans • Construction debris • Water bottles (plastic) • Cups lids, pieces lids, straws • Tobacco packaging • Soft drink cans
Photo: Melissa Phillip, Houston Chronicle Staff
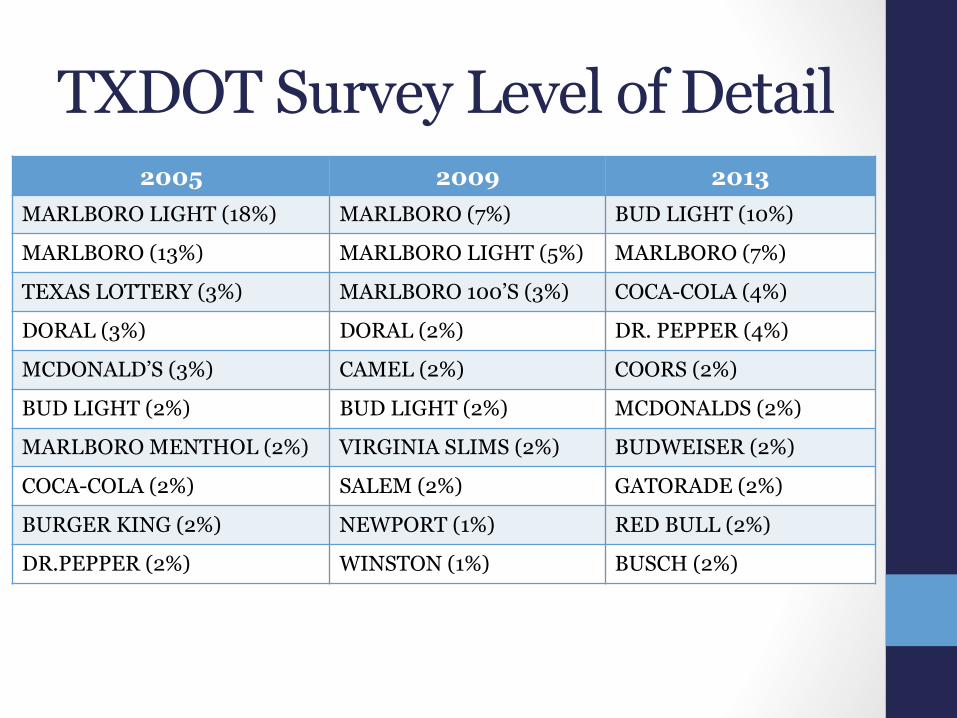
TXDOT Survey Level of Detail 2005 2009 2013
MARLBORO LIGHT (18%) MARLBORO (7%) BUD LIGHT (10%)
MARLBORO (13%) MARLBORO LIGHT (5%) MARLBORO (7%)
TEXAS LOTTERY (3%) MARLBORO 100’S (3%) COCA-COLA (4%)
DORAL (3%) DORAL (2%) DR. PEPPER (4%)
MCDONALD’S (3%) CAMEL (2%) COORS (2%)
BUD LIGHT (2%) BUD LIGHT (2%) MCDONALDS (2%)
MARLBORO MENTHOL (2%) VIRGINIA SLIMS (2%) BUDWEISER (2%)
COCA-COLA (2%) SALEM (2%) GATORADE (2%)
BURGER KING (2%) NEWPORT (1%) RED BULL (2%)
DR.PEPPER (2%) WINSTON (1%) BUSCH (2%)
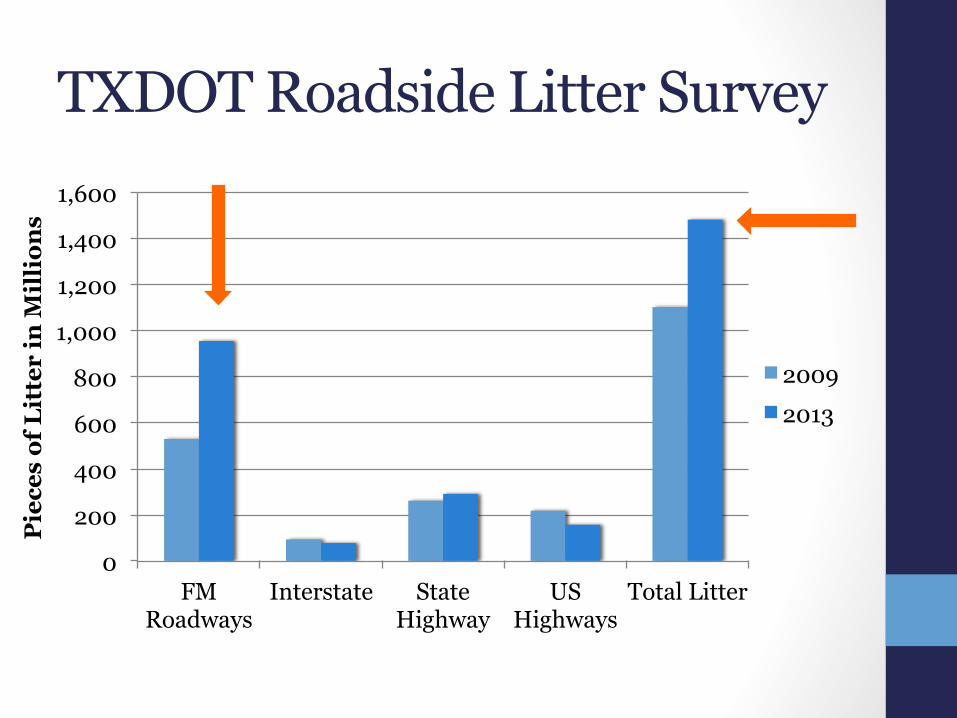
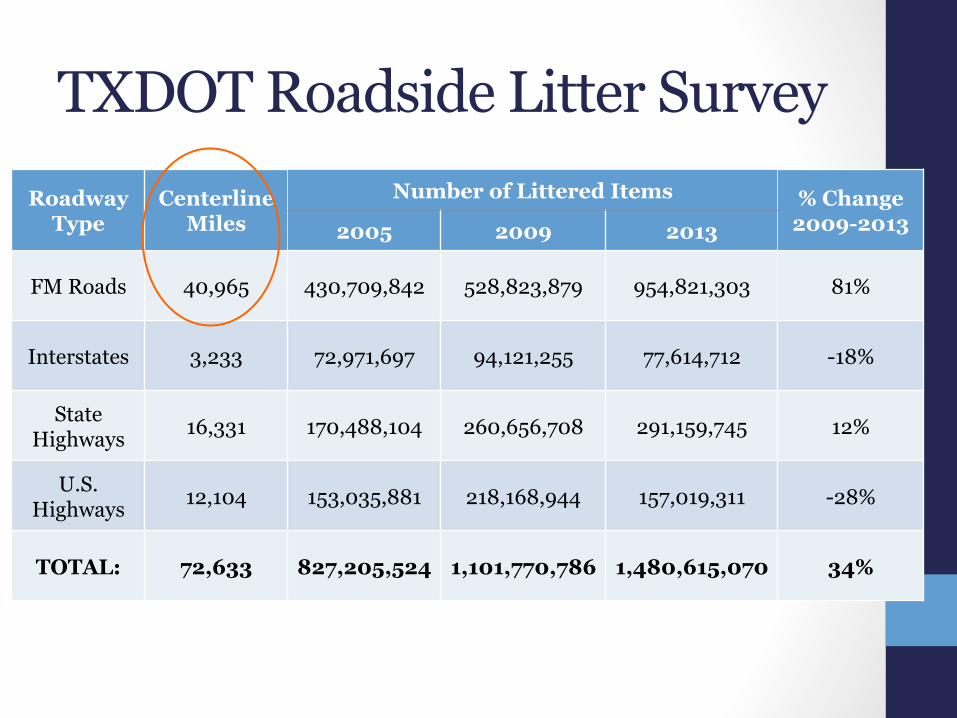
TXDOT Roadside Litter Survey
0
200
400
600
800
1,000
1,200
1,400
1,600
FM Roadways
Interstate State Highway
US Highways
Total Litter
2009 2013
Pie
ces
of L
itte
r in
Mil
lion
s
Roadway Type
Centerline Miles
Number of Littered Items % Change 2009-2013 2005 2009 2013
FM Roads 40,965 430,709,842 528,823,879 954,821,303 81%
Interstates 3,233 72,971,697 94,121,255 77,614,712 -18%
State Highways 16,331 170,488,104 260,656,708 291,159,745 12%
U.S. Highways 12,104 153,035,881 218,168,944 157,019,311 -28%
TOTAL: 72,633 827,205,524 1,101,770,786 1,480,615,070 34%
TXDOT Roadside Litter Survey
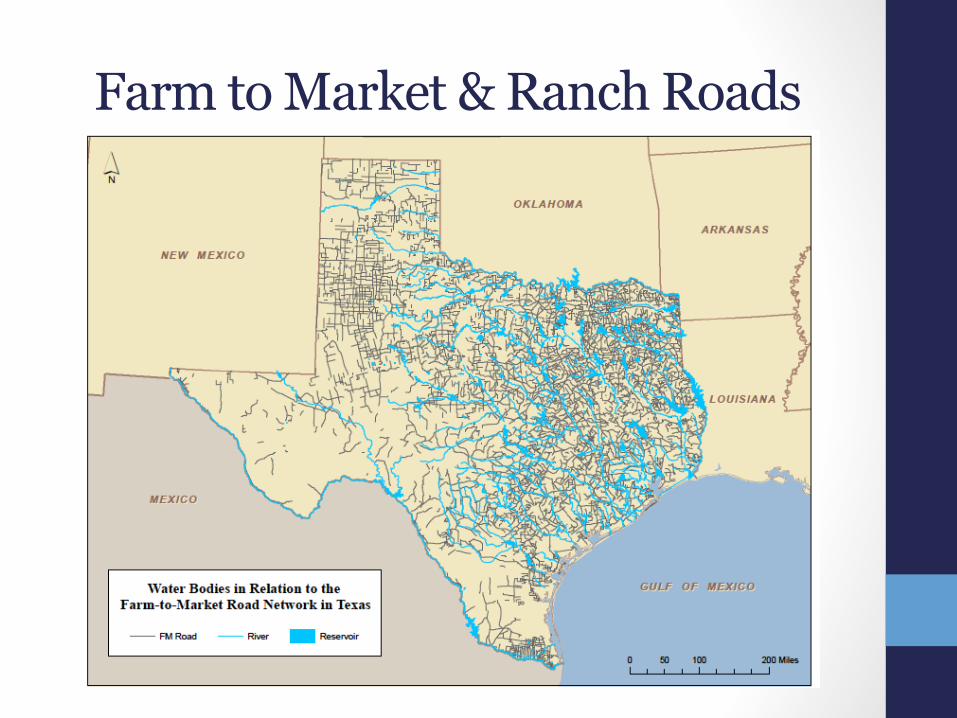
Farm to Market & Ranch Roads
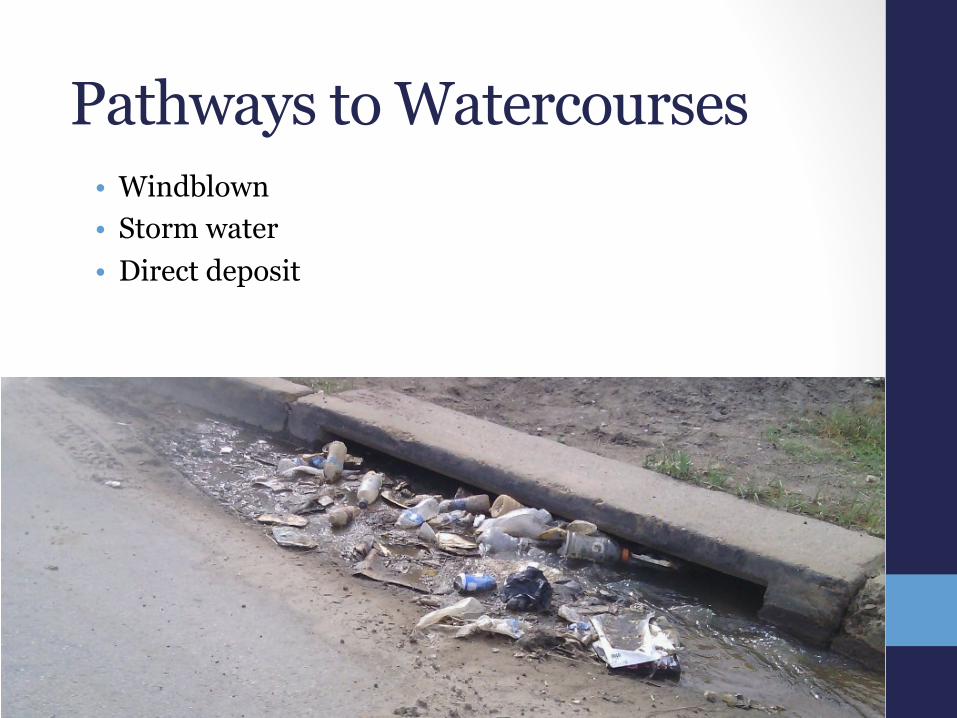
Pathways to Watercourses • Windblown • Storm water • Direct deposit
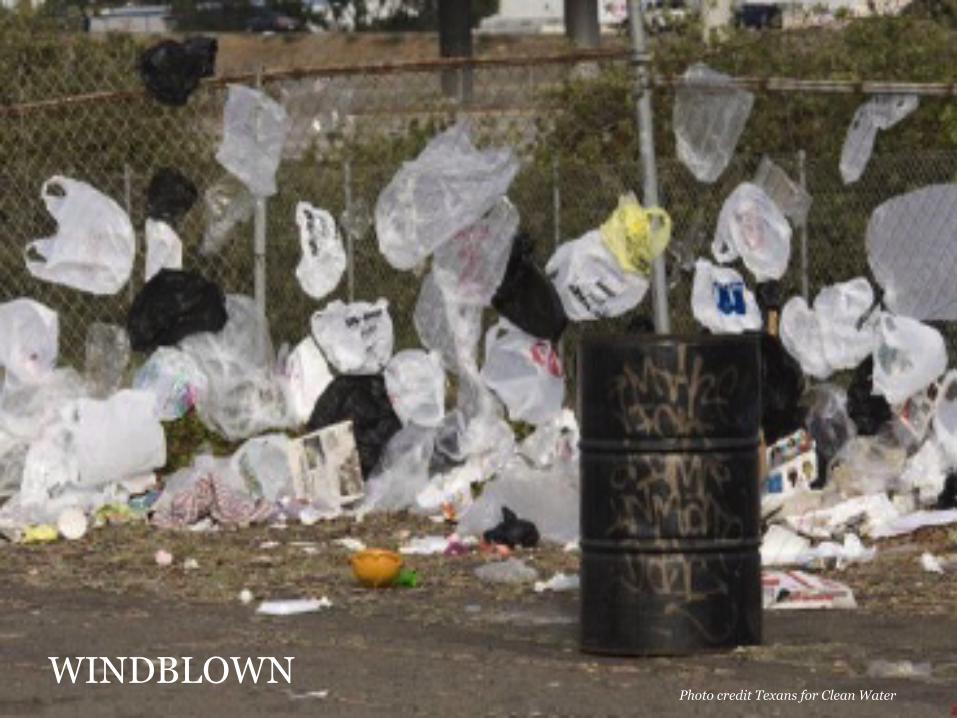
WINDBLOWN Photo credit Texans for Clean Water
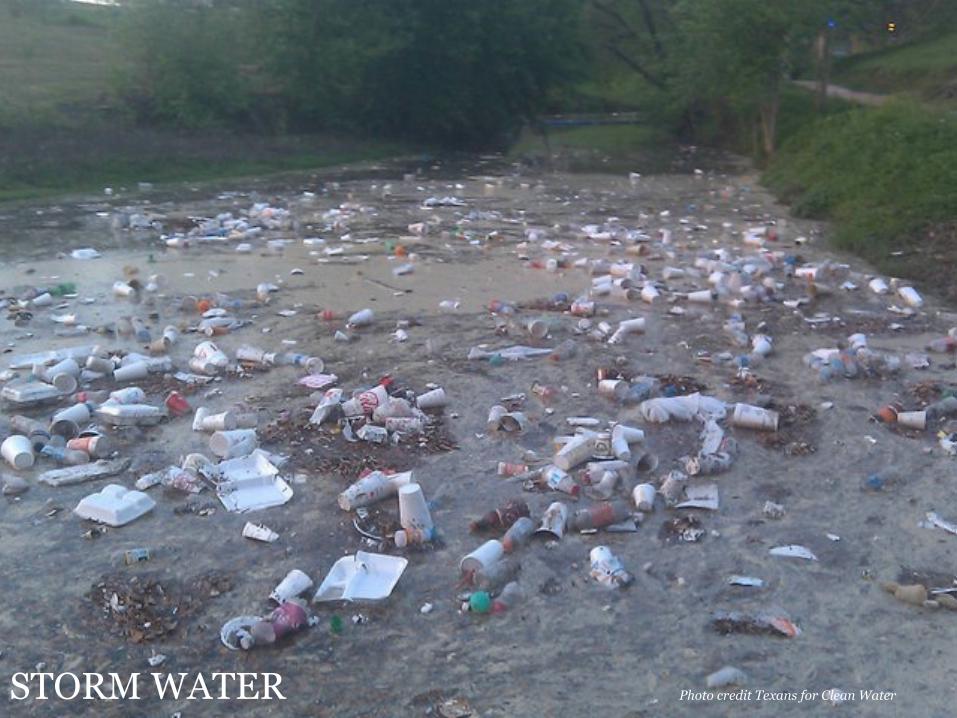
STORM WATER Photo credit Texans for Clean Water
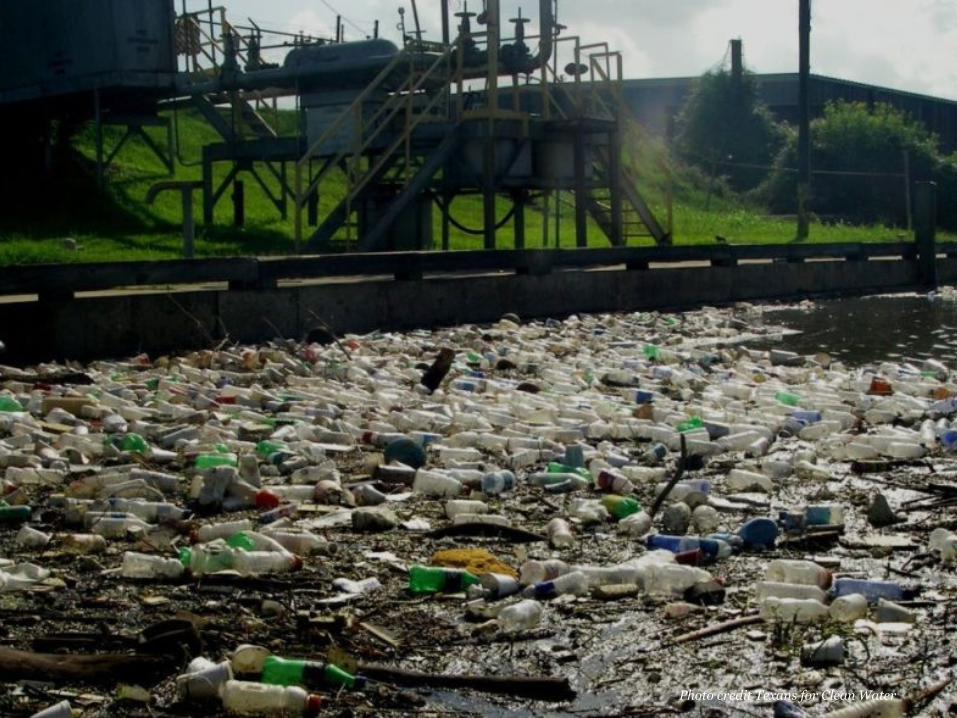
Photo credit Texans for Clean Water
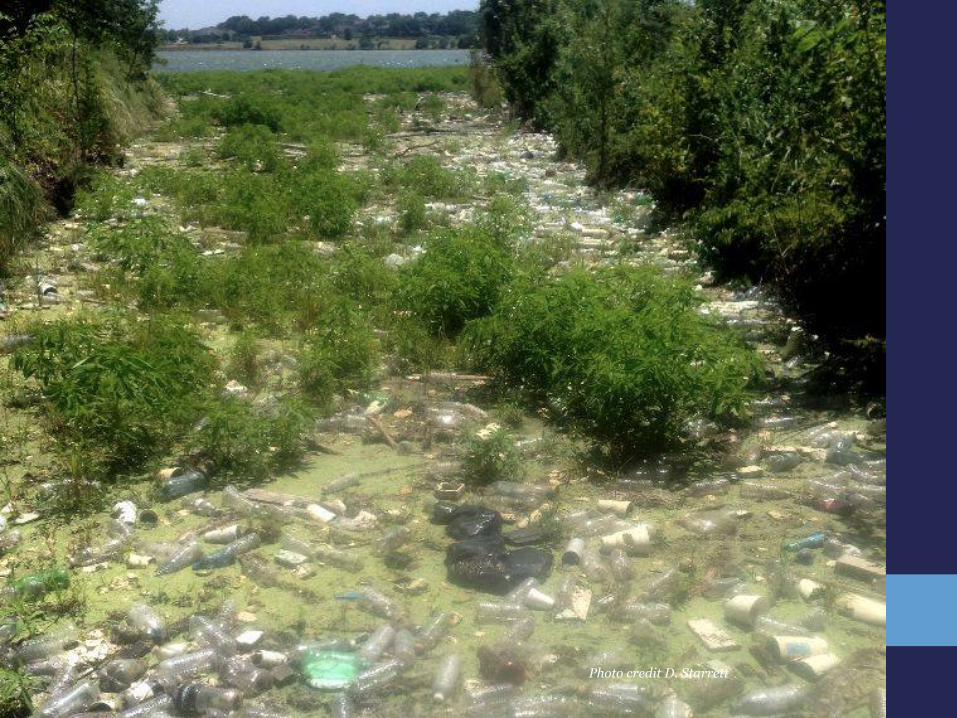
Photo credit D. Starrett
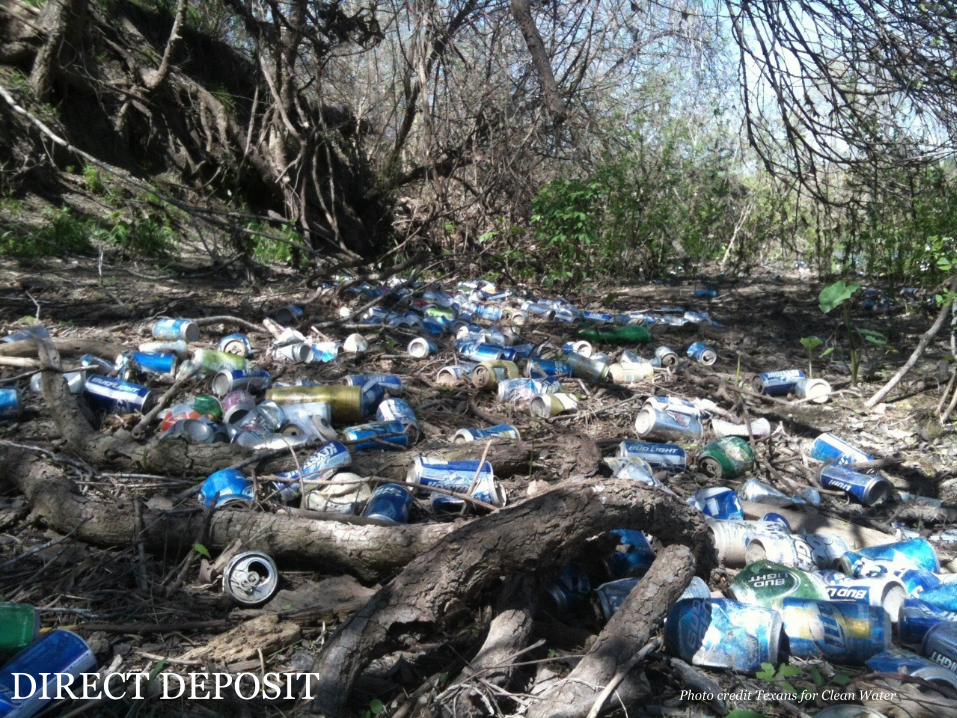
DIRECT DEPOSIT Photo credit Texans for Clean Water
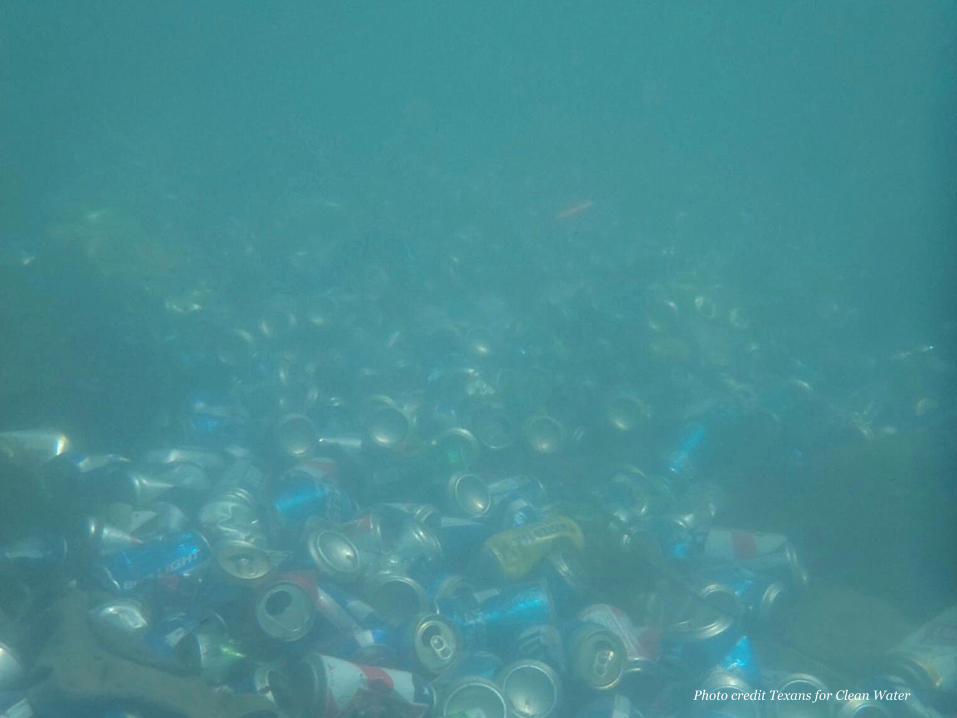
Photo credit Texans for Clean Water
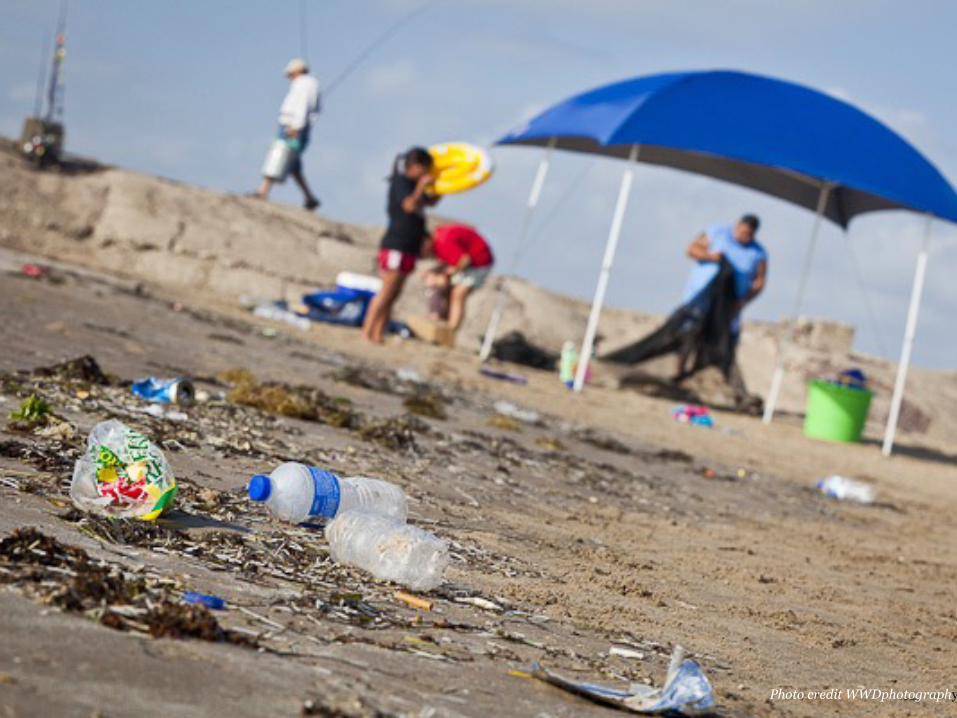
Photo credit WWDphotography
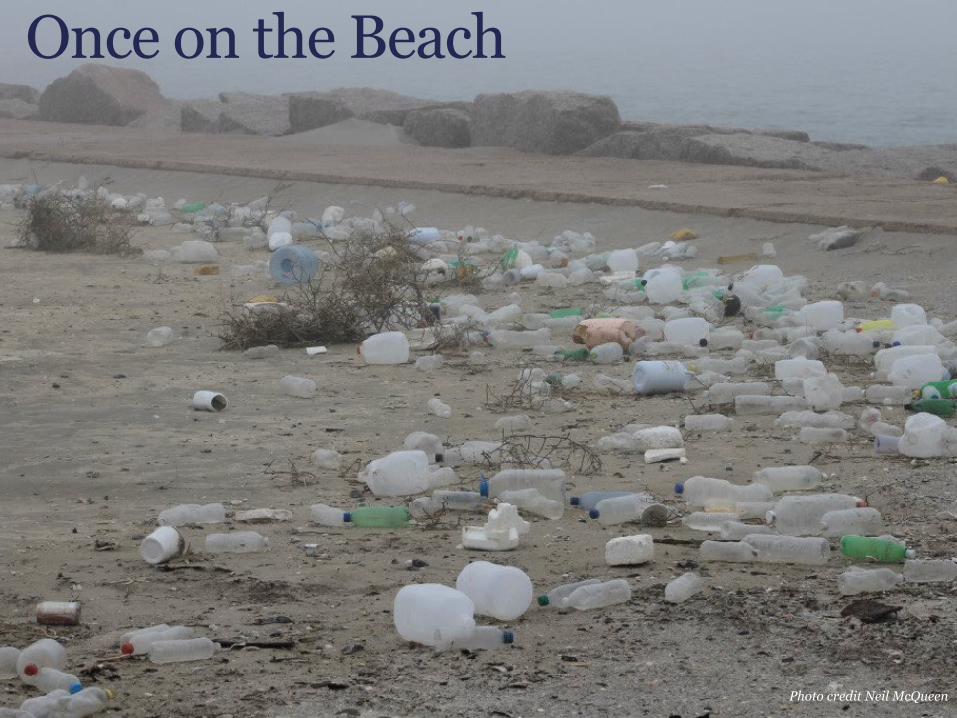
Once on the Beach
Photo credit Neil McQueen
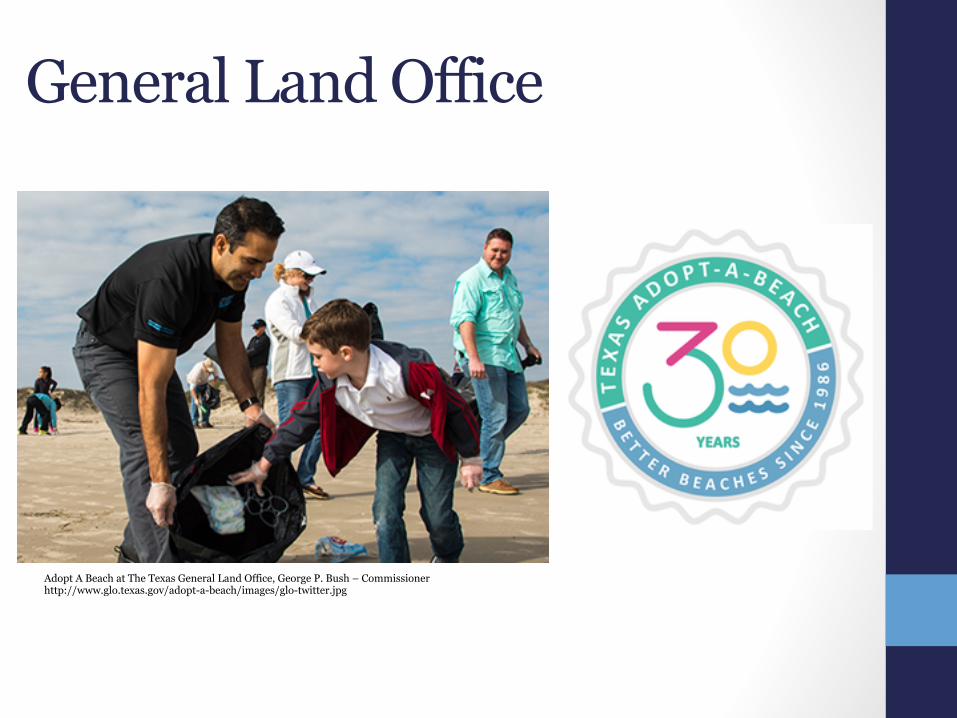
General Land Office
Adopt A Beach at The Texas General Land Office, George P. Bush – Commissioner http://www.glo.texas.gov/adopt-a-beach/images/glo-twitter.jpg
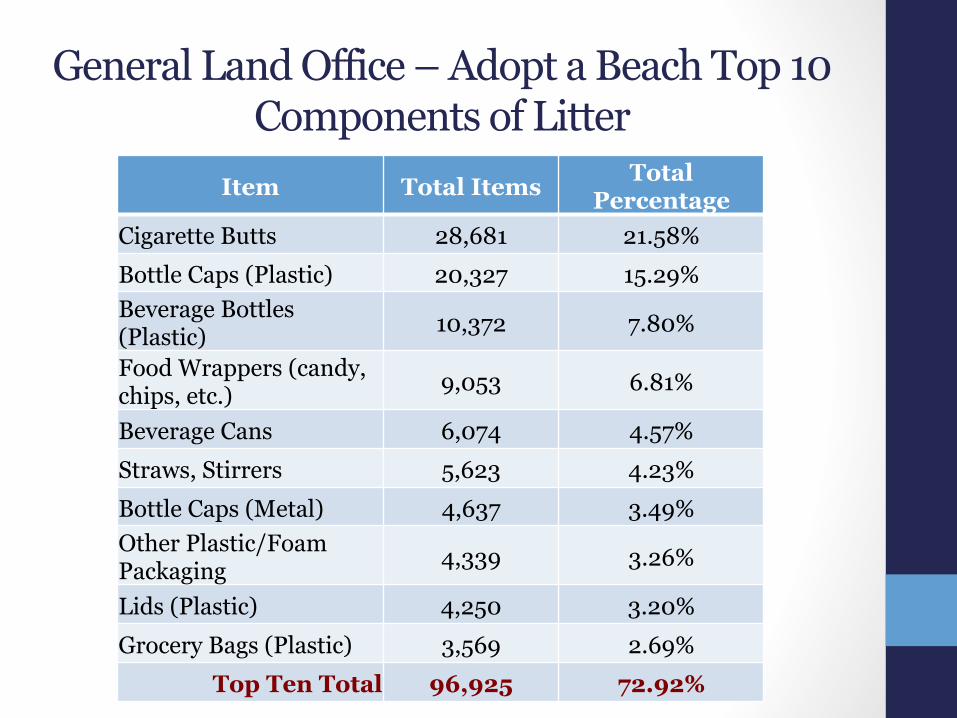
General Land Office – Adopt a Beach Top 10 Components of Litter
Item Total Items Total Percentage
Cigarette Butts 28,681 21.58% Bottle Caps (Plastic) 20,327 15.29% Beverage Bottles (Plastic) 10,372 7.80%
Food Wrappers (candy, chips, etc.) 9,053 6.81%
Beverage Cans 6,074 4.57% Straws, Stirrers 5,623 4.23% Bottle Caps (Metal) 4,637 3.49% Other Plastic/Foam Packaging 4,339 3.26%
Lids (Plastic) 4,250 3.20% Grocery Bags (Plastic) 3,569 2.69%
Top Ten Total 96,925 72.92%
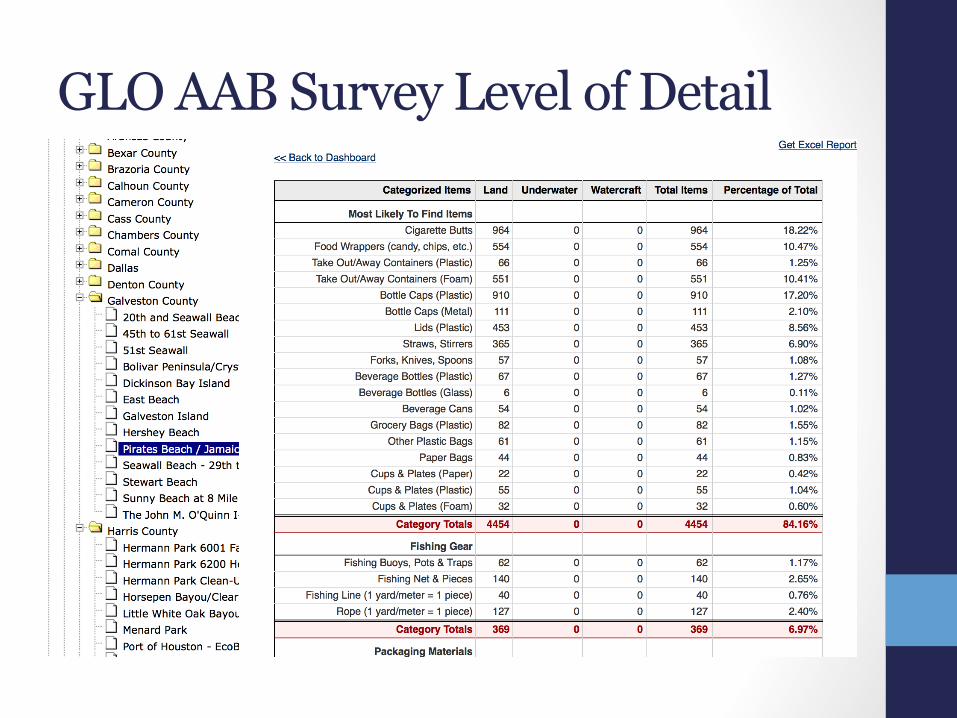
GLO AAB Survey Level of Detail
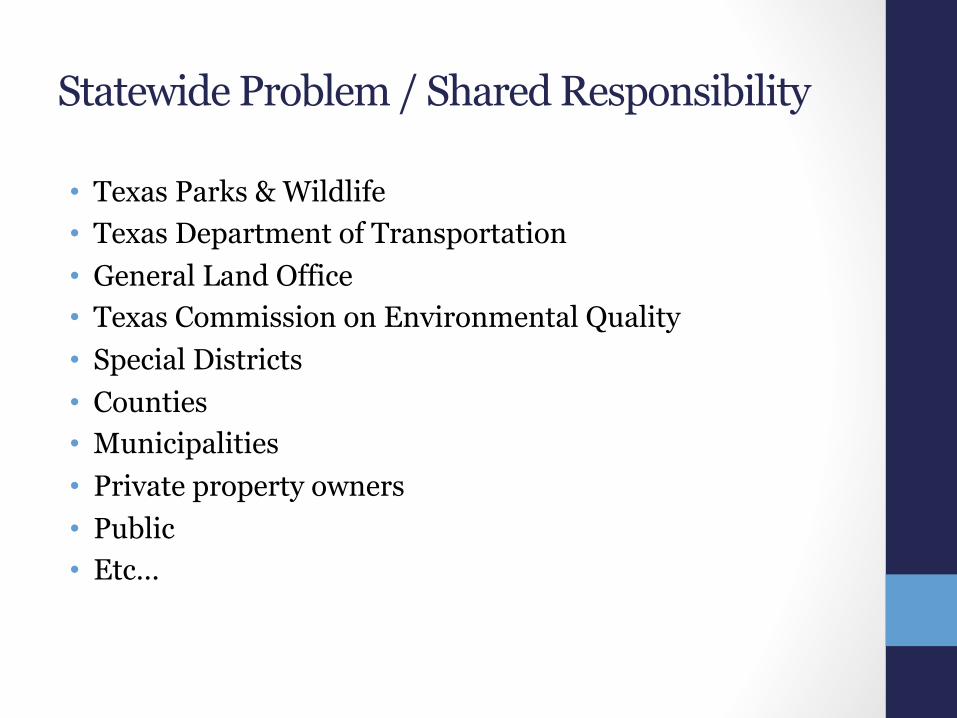
Statewide Problem / Shared Responsibility
• Texas Parks & Wildlife • Texas Department of Transportation • General Land Office • Texas Commission on Environmental Quality • Special Districts • Counties • Municipalities • Private property owners • Public • Etc…
Potential Legal/Regulatory Implications
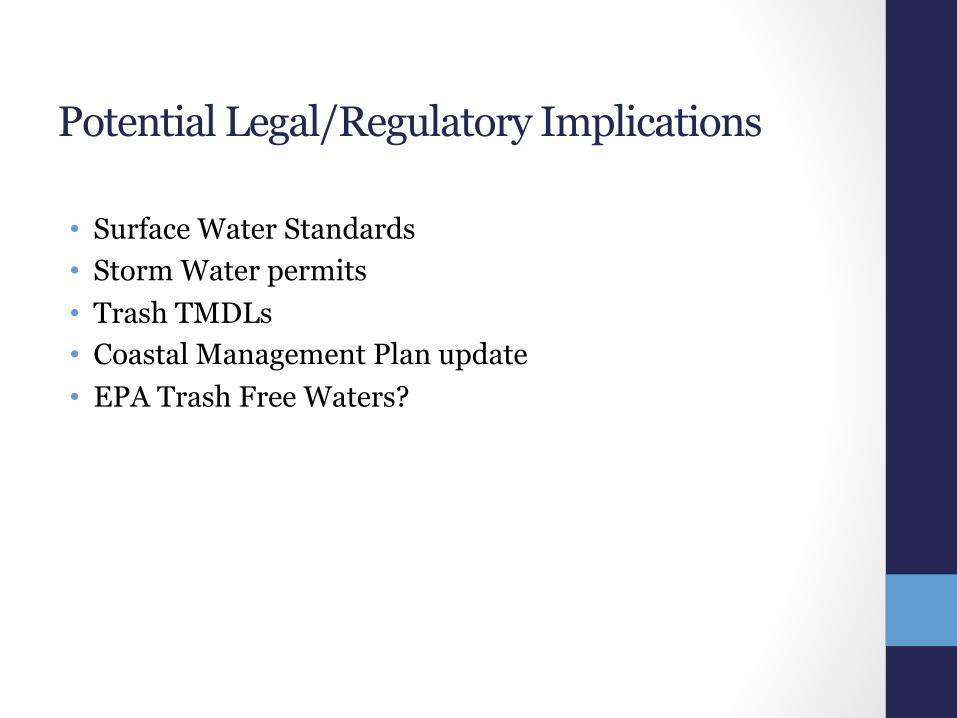
Potential Legal/Regulatory Implications
• Surface Water Standards • Storm Water permits • Trash TMDLs • Coastal Management Plan update • EPA Trash Free Waters?
Legal definitions and standards
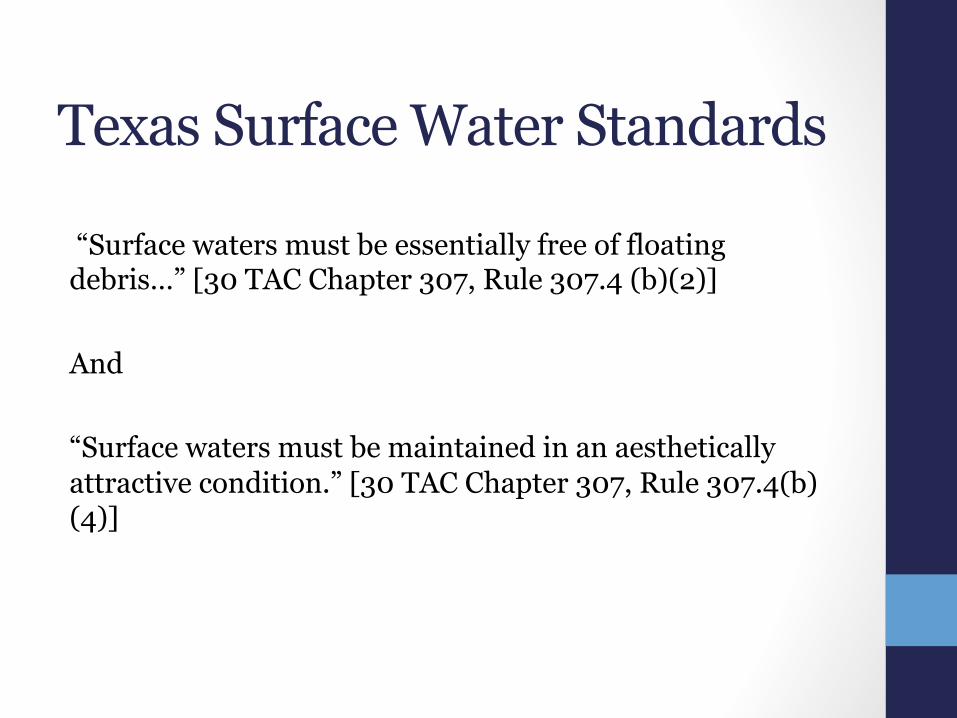
Texas Surface Water Standards
“Surface waters must be essentially free of floating debris…” [30 TAC Chapter 307, Rule 307.4 (b)(2)] And “Surface waters must be maintained in an aesthetically attractive condition.” [30 TAC Chapter 307, Rule 307.4(b)(4)]
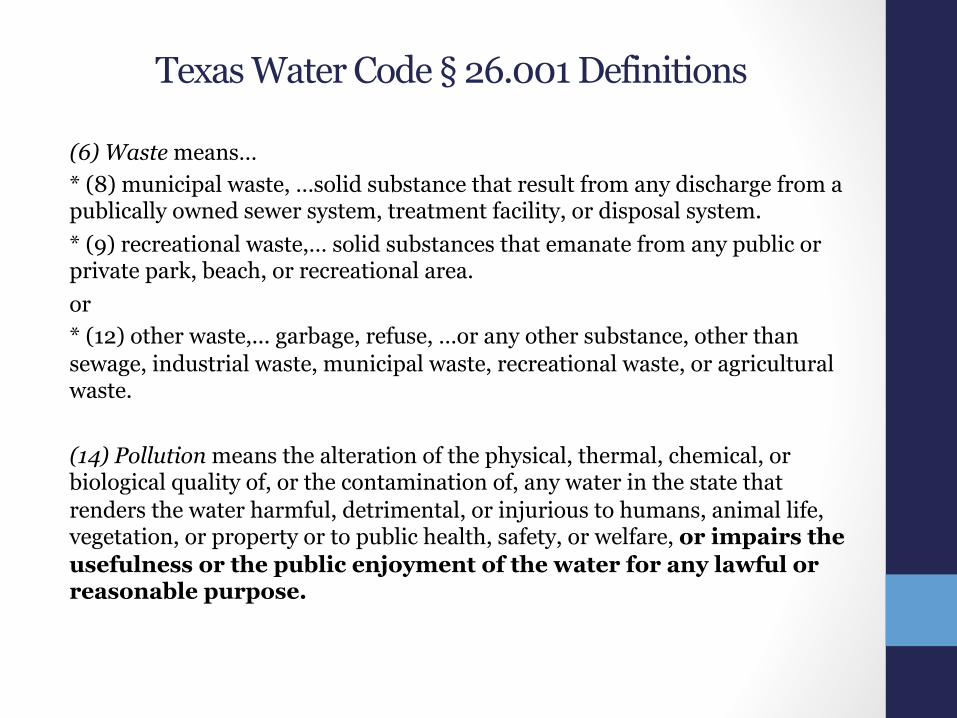
Texas Water Code § 26.001 Definitions
(6) Waste means… * (8) municipal waste, …solid substance that result from any discharge from a publically owned sewer system, treatment facility, or disposal system. * (9) recreational waste,… solid substances that emanate from any public or private park, beach, or recreational area. or * (12) other waste,... garbage, refuse, …or any other substance, other than sewage, industrial waste, municipal waste, recreational waste, or agricultural waste. (14) Pollution means the alteration of the physical, thermal, chemical, or biological quality of, or the contamination of, any water in the state that renders the water harmful, detrimental, or injurious to humans, animal life, vegetation, or property or to public health, safety, or welfare, or impairs the usefulness or the public enjoyment of the water for any lawful or reasonable purpose.
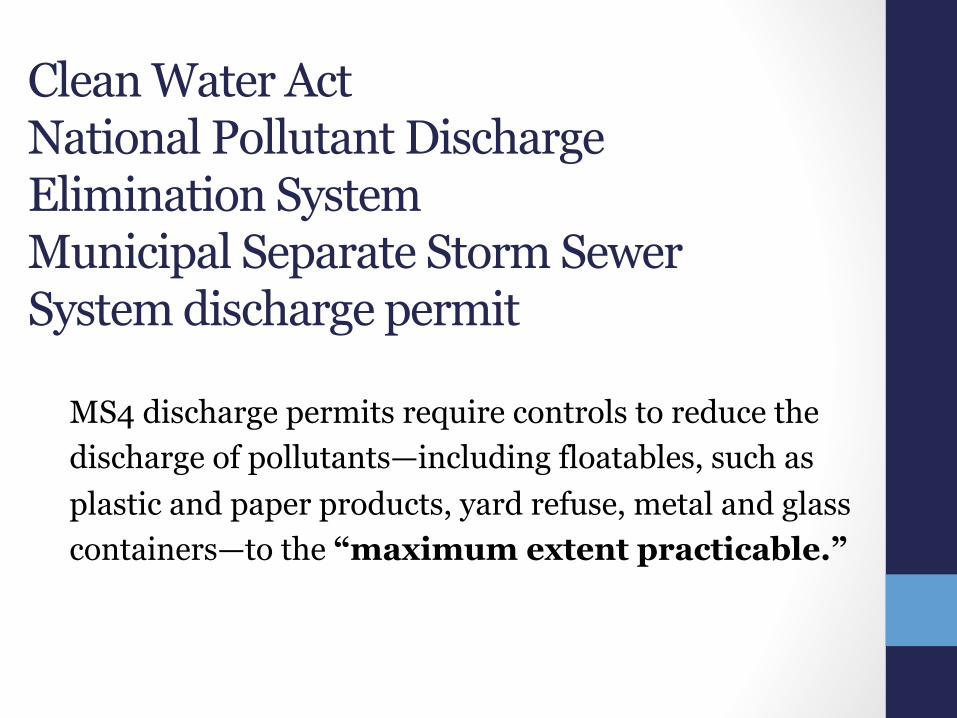
Clean Water Act National Pollutant Discharge Elimination System Municipal Separate Storm Sewer System discharge permit
MS4 discharge permits require controls to reduce the discharge of pollutants—including floatables, such as plastic and paper products, yard refuse, metal and glass containers—to the “maximum extent practicable.”
Economic Impacts: Direct Costs
• Personnel (non-administrative) • Disposal • Equipment • Infrastructure
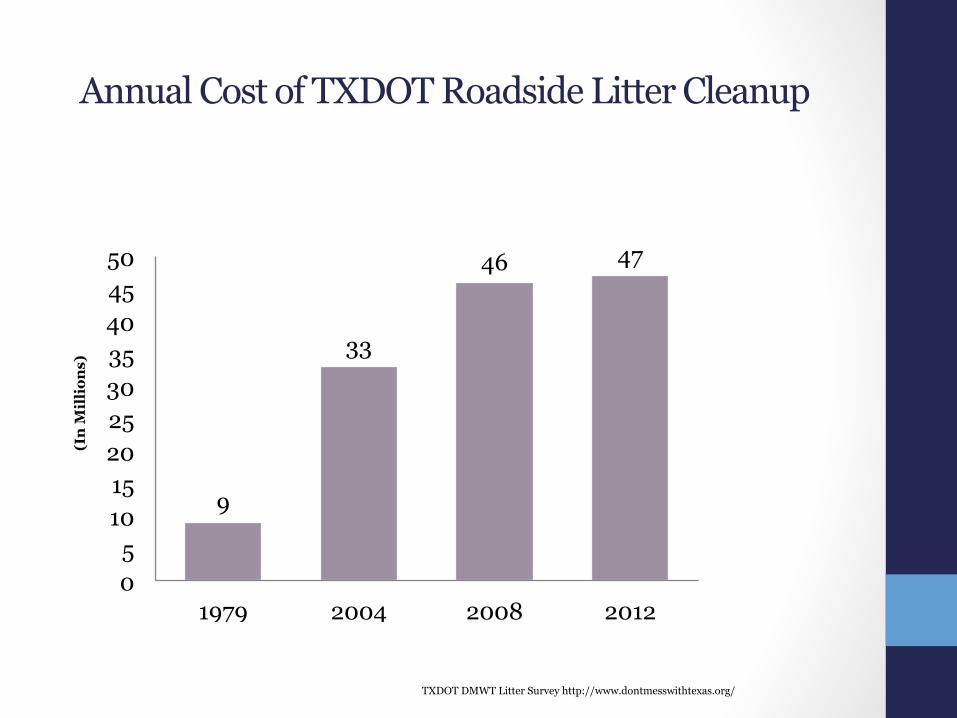
Annual Cost of TXDOT Roadside Litter Cleanup
9
33
46 47
0 5
10 15 20 25 30 35 40 45 50
1979 2004 2008 2012
(In
Mil
lion
s)
TXDOT DMWT Litter Survey http://www.dontmesswithtexas.org/
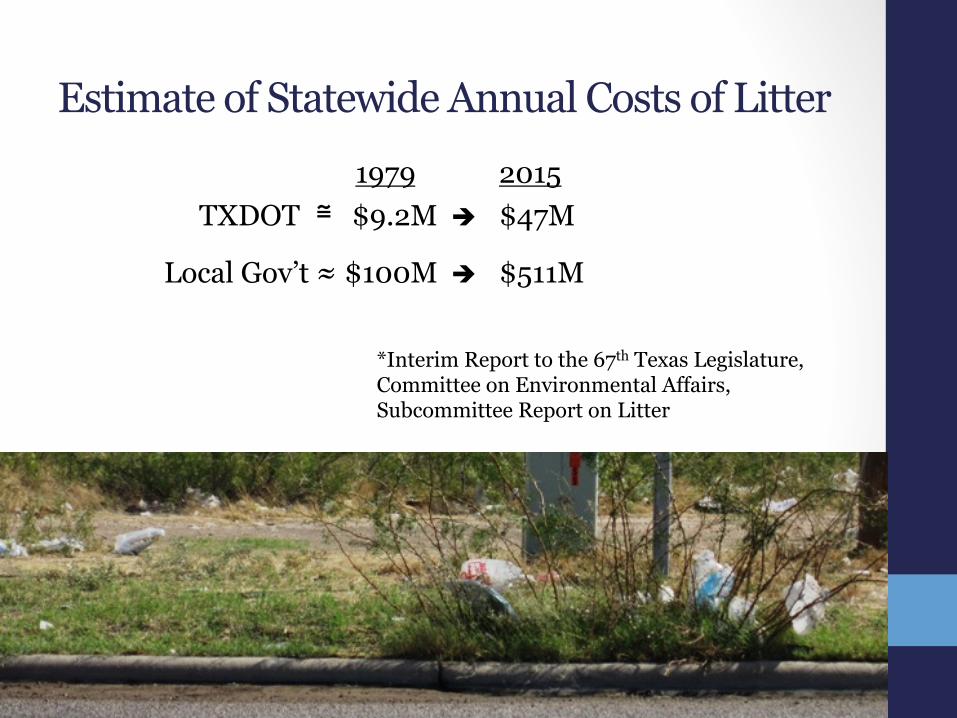
Estimate of Statewide Annual Costs of Litter 1979 2015
TXDOT ≅ $9.2M è $47M Local Gov’t ≈ $100M è $511M
*Interim Report to the 67th Texas Legislature, Committee on Environmental Affairs, Subcommittee Report on Litter
“Case Study” Direct Costs
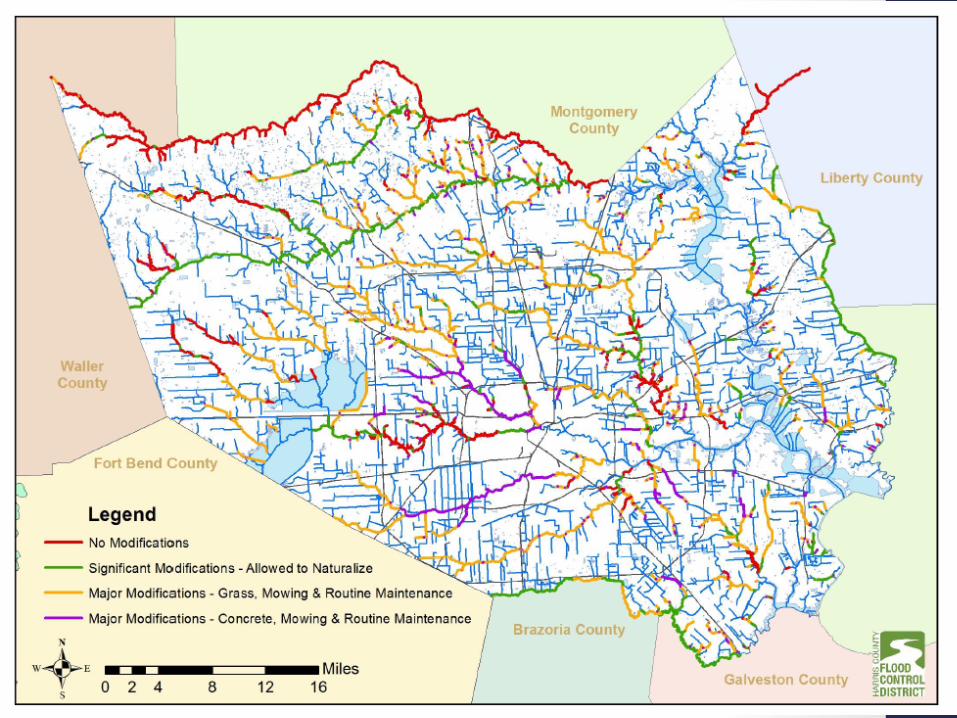
MAP
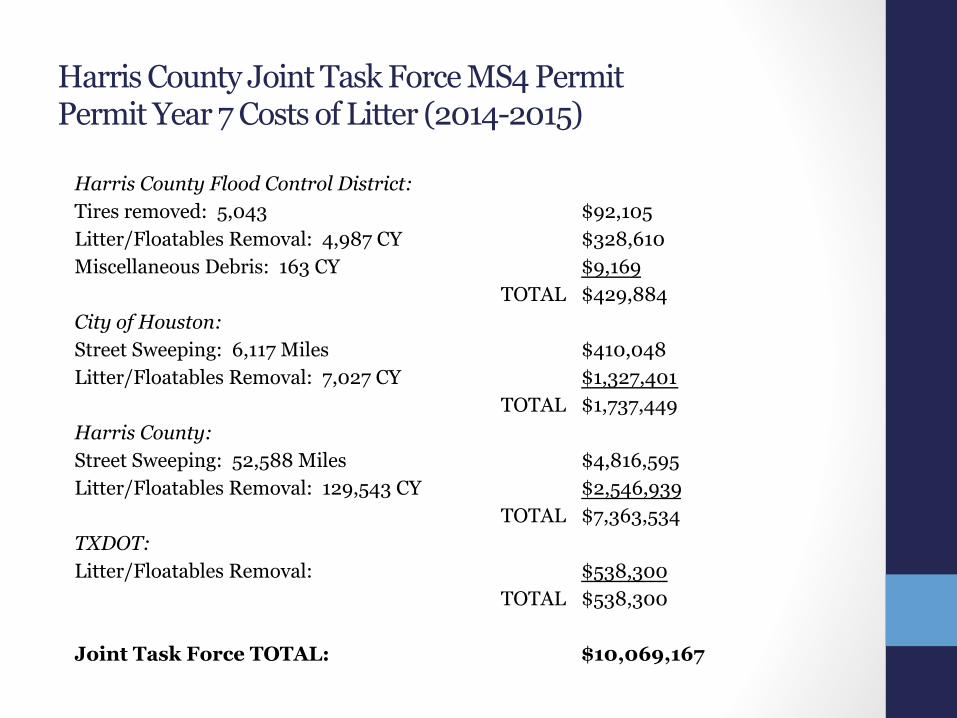
Harris County Flood Control District: Tires removed: 5,043 $92,105 Litter/Floatables Removal: 4,987 CY $328,610 Miscellaneous Debris: 163 CY $9,169
TOTAL $429,884 City of Houston: Street Sweeping: 6,117 Miles $410,048 Litter/Floatables Removal: 7,027 CY $1,327,401
TOTAL $1,737,449 Harris County: Street Sweeping: 52,588 Miles $4,816,595 Litter/Floatables Removal: 129,543 CY $2,546,939
TOTAL $7,363,534 TXDOT: Litter/Floatables Removal: $538,300
TOTAL $538,300
Joint Task Force TOTAL: $10,069,167
Harris County Joint Task Force MS4 Permit Permit Year 7 Costs of Litter (2014-2015)
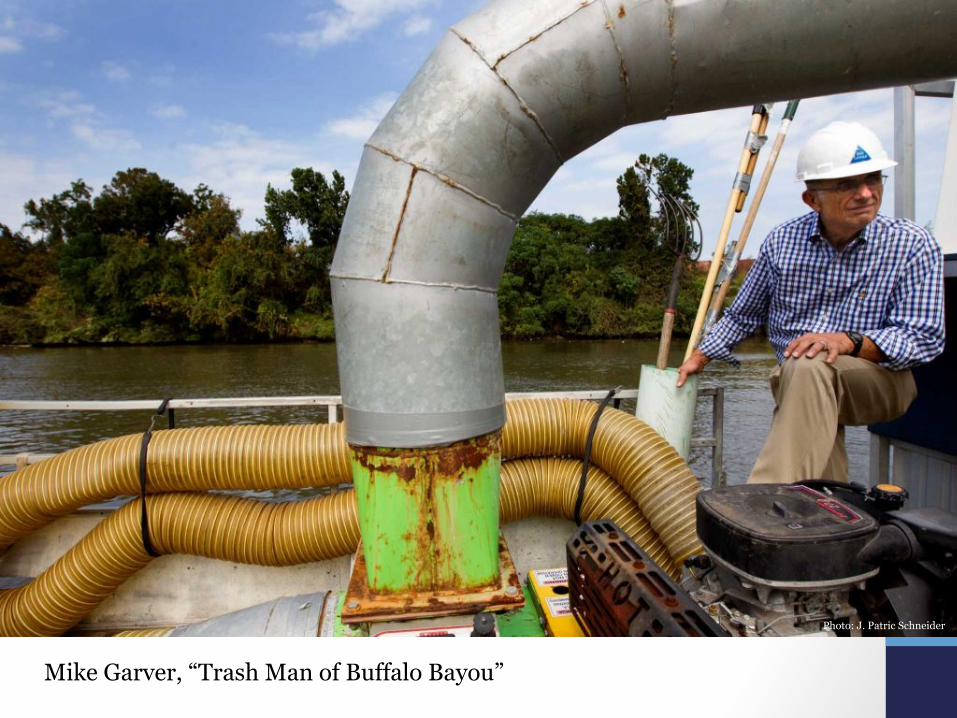
Photo: J. Patric Schneider
Mike Garver, “Trash Man of Buffalo Bayou”
Economic Impacts: Indirect Costs, Infrastructure and Capital Investments
• Recreation & Tourism • Waterfront development • Environmental “costs” • Federal funding
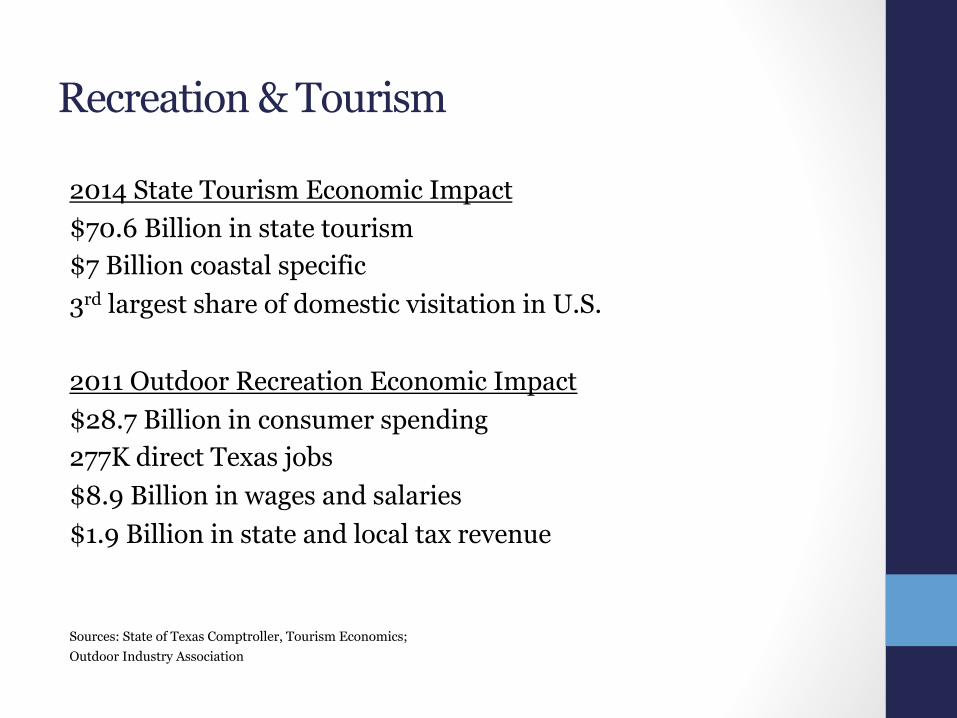
Recreation & Tourism
2014 State Tourism Economic Impact $70.6 Billion in state tourism $7 Billion coastal specific 3rd largest share of domestic visitation in U.S. 2011 Outdoor Recreation Economic Impact $28.7 Billion in consumer spending 277K direct Texas jobs $8.9 Billion in wages and salaries $1.9 Billion in state and local tax revenue Sources: State of Texas Comptroller, Tourism Economics; Outdoor Industry Association
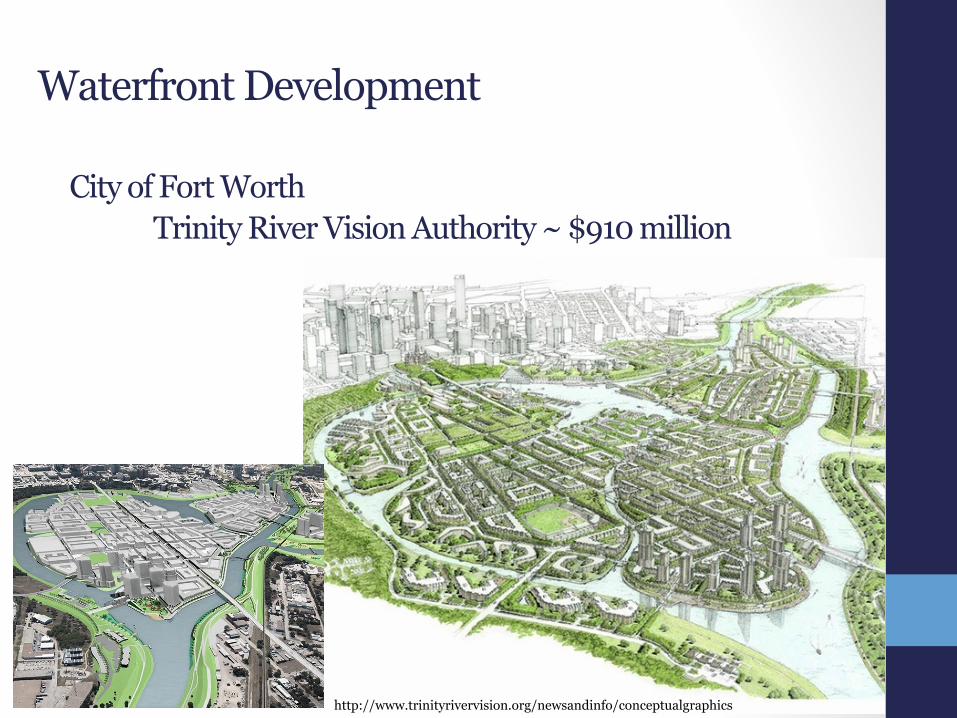
City of Fort Worth Trinity River Vision Authority ~ $910 million
http://www.trinityrivervision.org/newsandinfo/conceptualgraphics
Waterfront Development
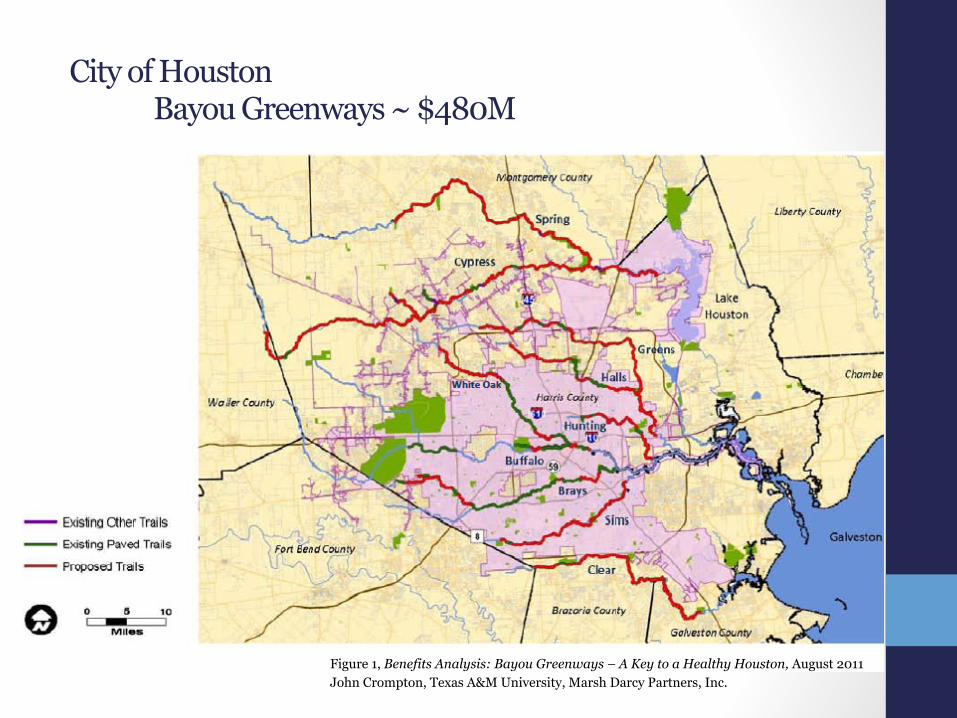
City of Houston Bayou Greenways ~ $480M
Figure 1, Benefits Analysis: Bayou Greenways – A Key to a Healthy Houston, August 2011 John Crompton, Texas A&M University, Marsh Darcy Partners, Inc.
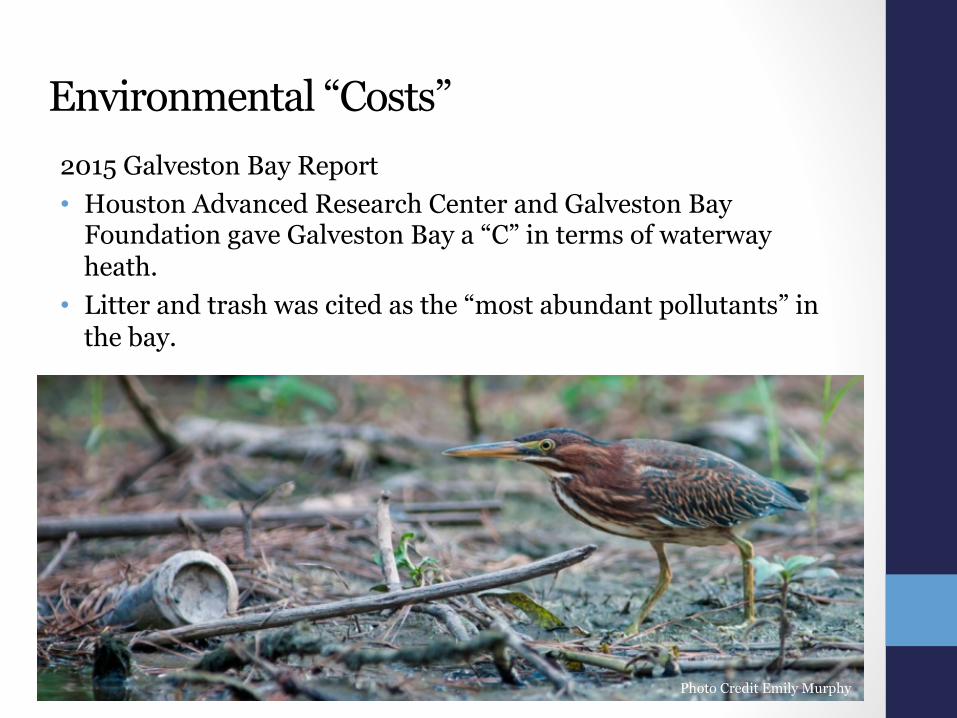
2015 Galveston Bay Report • Houston Advanced Research Center and Galveston Bay
Foundation gave Galveston Bay a “C” in terms of waterway heath.
• Litter and trash was cited as the “most abundant pollutants” in the bay.
Environmental “Costs”
Photo Credit Emily Murphy
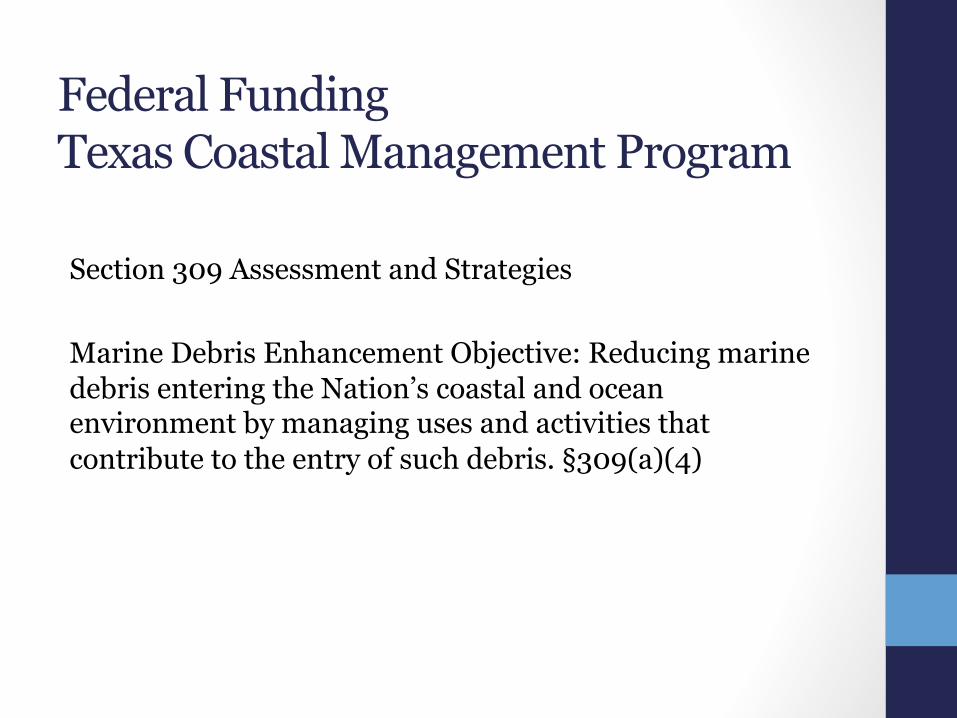
Federal Funding Texas Coastal Management Program Section 309 Assessment and Strategies Marine Debris Enhancement Objective: Reducing marine debris entering the Nation’s coastal and ocean environment by managing uses and activities that contribute to the entry of such debris. §309(a)(4)
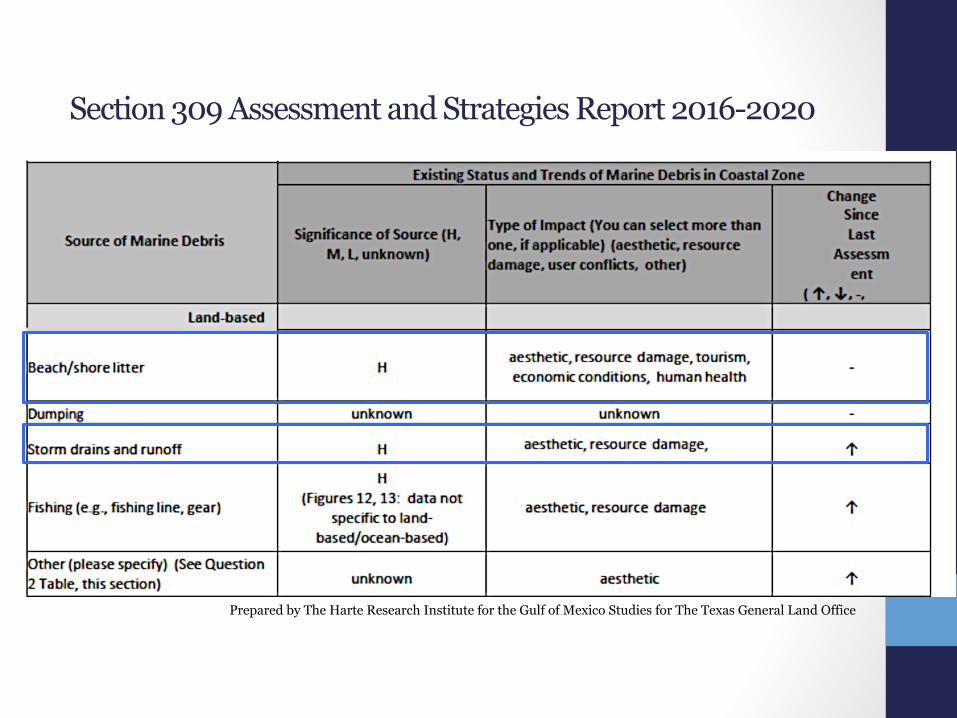
Section 309 Assessment and Strategies Report 2016-2020
Prepared by The Harte Research Institute for the Gulf of Mexico Studies for The Texas General Land Office
Solutions Through Partnerships
• Infrastructure development and management • Education campaign and promotion • Clean up events

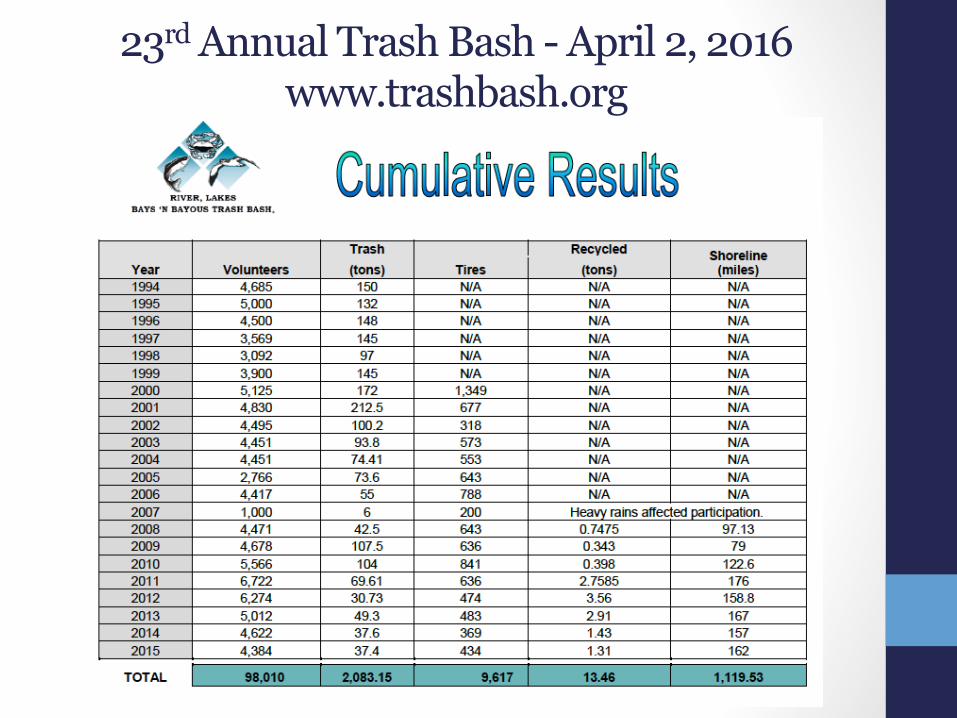
23rd Annual Trash Bash - April 2, 2016 www.trashbash.org
Next steps – local, regional, state
• Local government ordinances • NGO efforts • Regional coordination of efforts • Law enforcement education • State government • Legislative efforts • You!
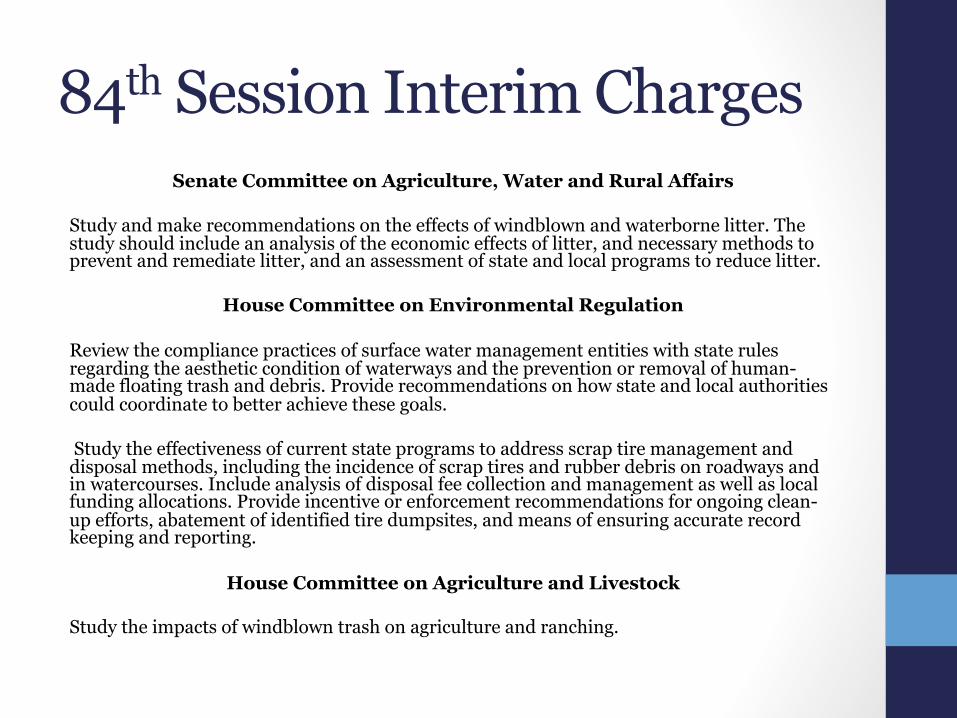
84th Session Interim Charges Senate Committee on Agriculture, Water and Rural Affairs
Study and make recommendations on the effects of windblown and waterborne litter. The study should include an analysis of the economic effects of litter, and necessary methods to prevent and remediate litter, and an assessment of state and local programs to reduce litter.
House Committee on Environmental Regulation Review the compliance practices of surface water management entities with state rules regarding the aesthetic condition of waterways and the prevention or removal of human-made floating trash and debris. Provide recommendations on how state and local authorities could coordinate to better achieve these goals. Study the effectiveness of current state programs to address scrap tire management and disposal methods, including the incidence of scrap tires and rubber debris on roadways and in watercourses. Include analysis of disposal fee collection and management as well as local funding allocations. Provide incentive or enforcement recommendations for ongoing clean-up efforts, abatement of identified tire dumpsites, and means of ensuring accurate record keeping and reporting.
House Committee on Agriculture and Livestock Study the impacts of windblown trash on agriculture and ranching.

THANK YOU
Contact information:
Michael Booth, Principal Counsel [email protected]
Maia Corbitt, Governmental Consultant
Office: 512.472.3263