Embed Size (px)
Citation preview
Simon Upton
OECD, Director for the Environment
Economic Instruments to
Achieve Sustainable
Development
Sustainable Development Forum 2014
Prague, 28 November 2014
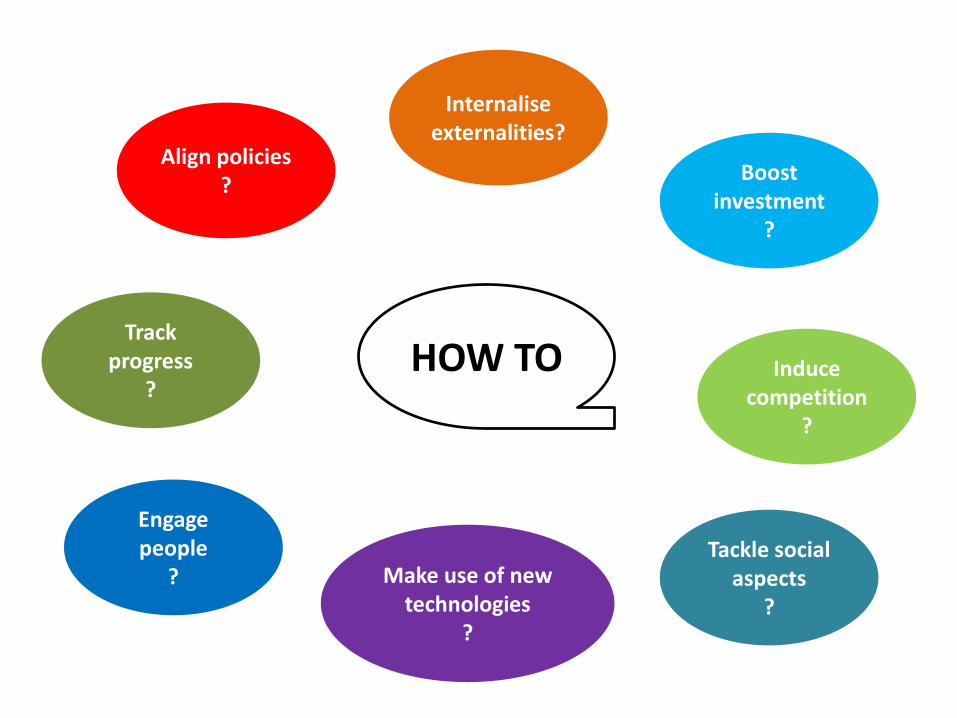
HOW TO
Internalise externalities?
Induce competition
?
Boostinvestment
?
Track progress
?
Align policies?
Engage people
? Make use of new technologies
?
Tackle social aspects
?
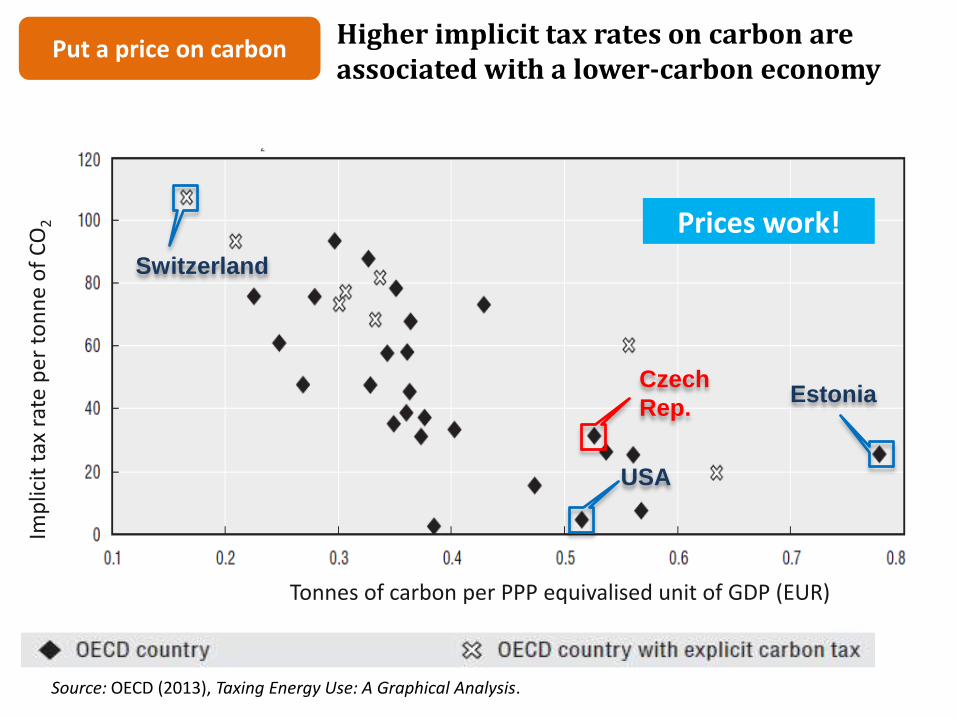
Tonnes of carbon per PPP equivalised unit of GDP (EUR)
Imp
licit
tax
rat
e p
er
ton
ne
of
CO
2
USA
Estonia
Switzerland
Source: OECD (2013), Taxing Energy Use: A Graphical Analysis.
Higher implicit tax rates on carbon are associated with a lower-carbon economy
Prices work!
Czech
Rep.
Put a price on carbon
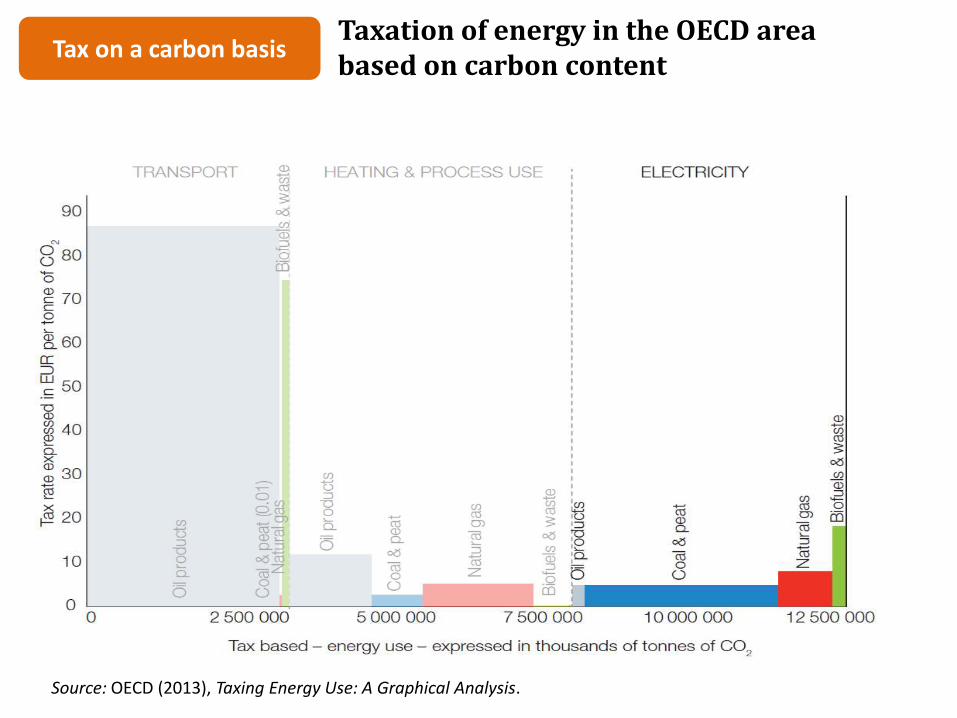
Taxation of energy in the OECD areabased on carbon content
Source: OECD (2013), Taxing Energy Use: A Graphical Analysis.
Tax on a carbon basis
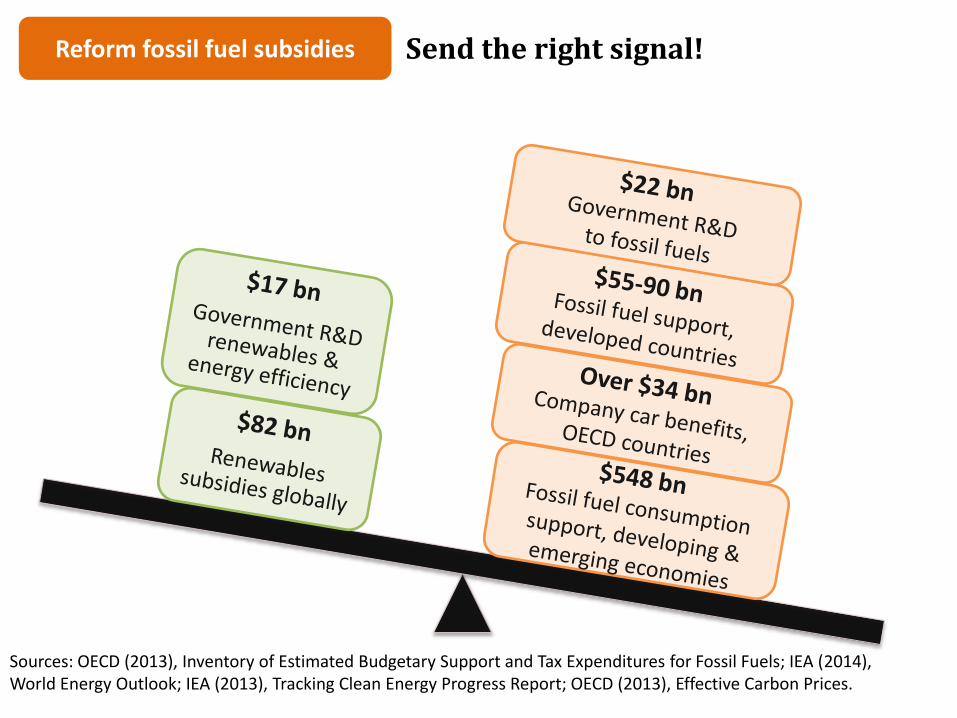
Sources: OECD (2013), Inventory of Estimated Budgetary Support and Tax Expenditures for Fossil Fuels; IEA (2014), World Energy Outlook; IEA (2013), Tracking Clean Energy Progress Report; OECD (2013), Effective Carbon Prices.
Reform fossil fuel subsidies Send the right signal!
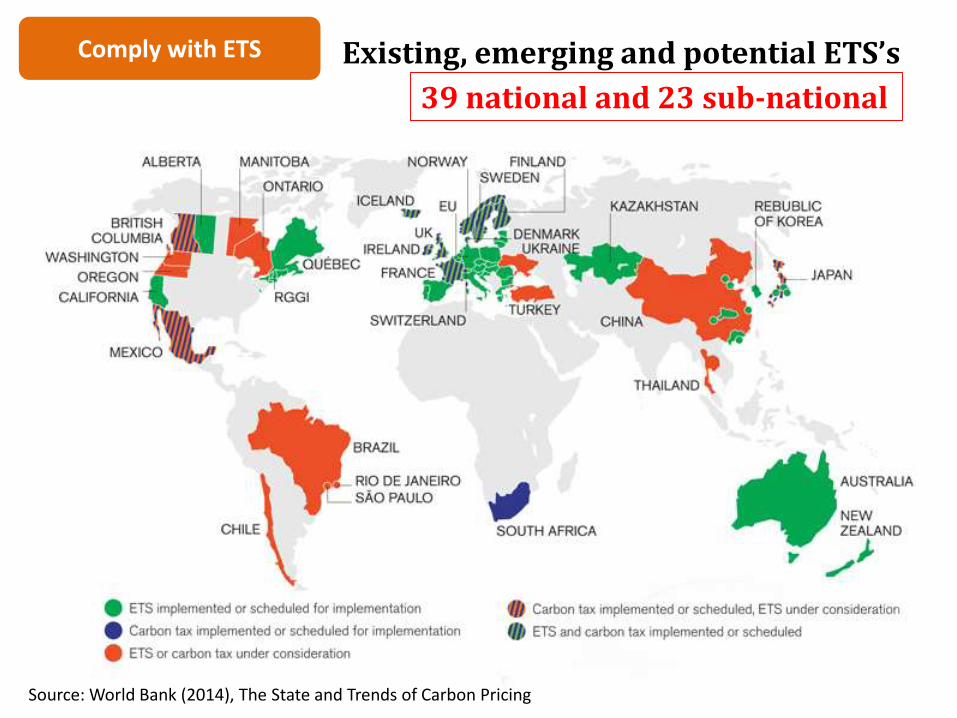
Existing, emerging and potential ETS’s
6Source: World Bank (2014), The State and Trends of Carbon Pricing
Comply with ETS
39 national and 23 sub-national

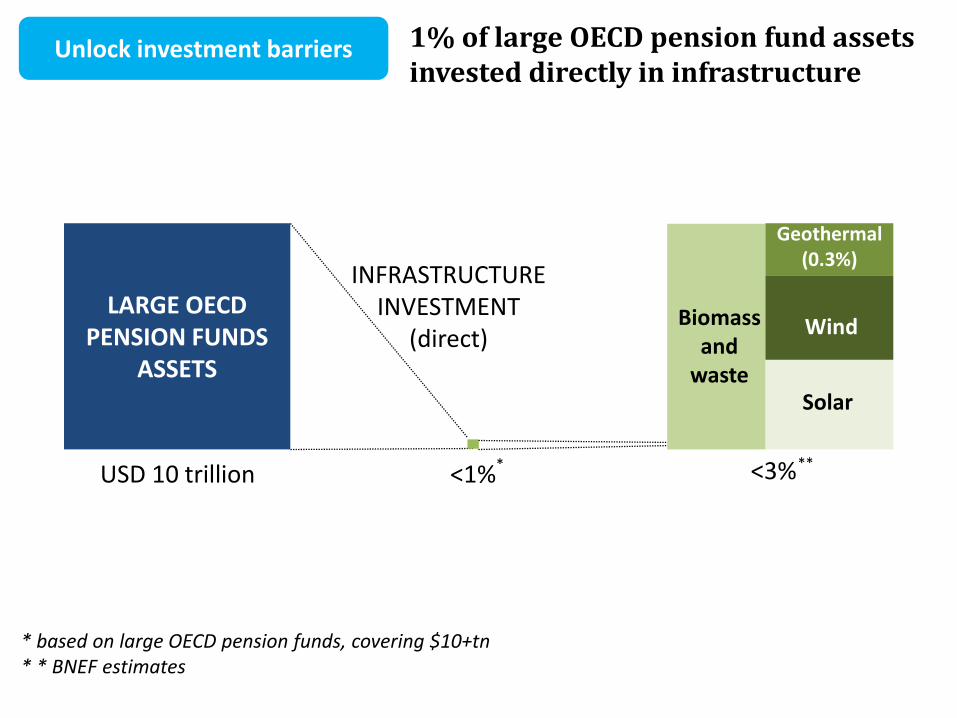
1% of large OECD pension fund assets invested directly in infrastructure
LARGE OECD PENSION FUNDS
ASSETS
USD 10 trillion
* based on large OECD pension funds, covering $10+tn* * BNEF estimates
<1%
INFRASTRUCTURE INVESTMENT
(direct)
* <3%
.**
GREEN INFRASTRUCTURE INVESTMENT
(direct)
GREENINFRASTRUCTURE
INVESTMENT(direct)
Biomass and
waste
Geothermal (0.3%)
Wind
Solar
Unlock investment barriers

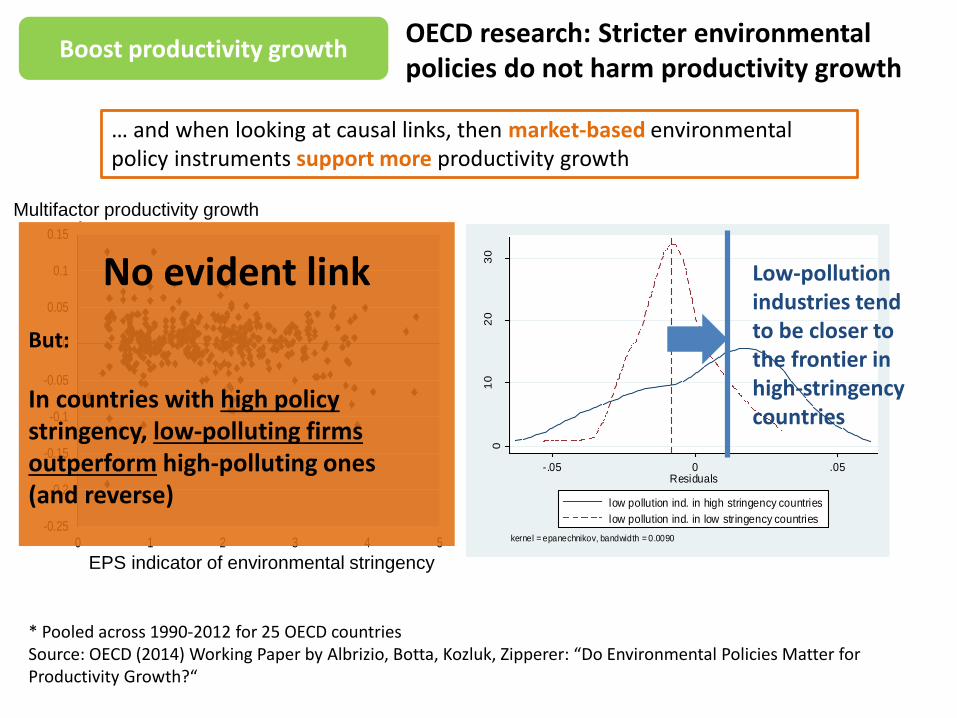
OECD research: Stricter environmental policies do not harm productivity growth
10
* Pooled across 1990-2012 for 25 OECD countriesSource: OECD (2014) Working Paper by Albrizio, Botta, Kozluk, Zipperer: “Do Environmental Policies Matter for Productivity Growth?“
Boost productivity growth
A. MFP growth and EPS levels B. MFP growth and EPS change (3-year moving average)
-0.25
-0.2
-0.15
-0.1
-0.05
0
0.05
0.1
0.15
0 1 2 3 4 5EPS indicator - level
MFP growth
-0.25
-0.2
-0.15
-0.1
-0.05
0
0.05
0.1
0.15
-0.4 -0.2 0 0.2 0.4 0.6 0.8
EPS indicator - change (3 year average)
MFP growth
EPS indicator of environmental stringency
Multifactor productivity growth
No evident link
But:
In countries with high policy stringency, low-polluting firms outperform high-polluting ones (and reverse)
… and when looking at causal links, then market-based environmental policy instruments support more productivity growth
01
02
03
0
De
nsity
-.05 0 .05Residuals
low pollution ind. in high stringency countries
low pollution ind. in low stringency countries
kernel = epanechnikov, bandwidth = 0.0090
Low-pollution industries tend to be closer to the frontier in high-stringency countries

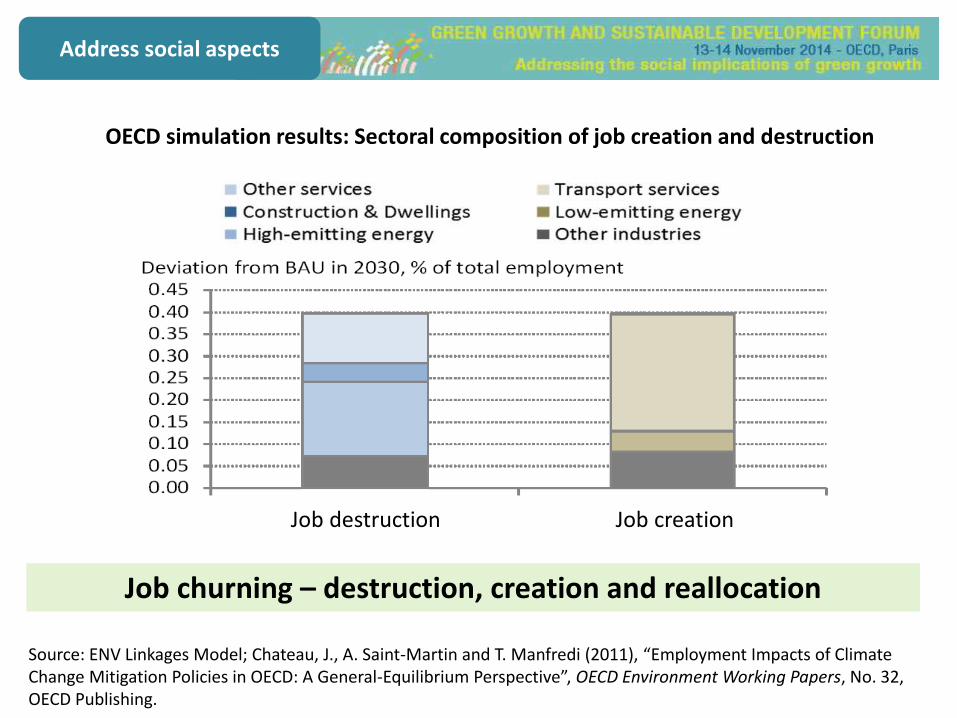
Address social aspects
Job churning – destruction, creation and reallocation
Source: ENV Linkages Model; Chateau, J., A. Saint-Martin and T. Manfredi (2011), “Employment Impacts of Climate Change Mitigation Policies in OECD: A General-Equilibrium Perspective”, OECD Environment Working Papers, No. 32, OECD Publishing.
Job destruction Job creation
OECD simulation results: Sectoral composition of job creation and destruction
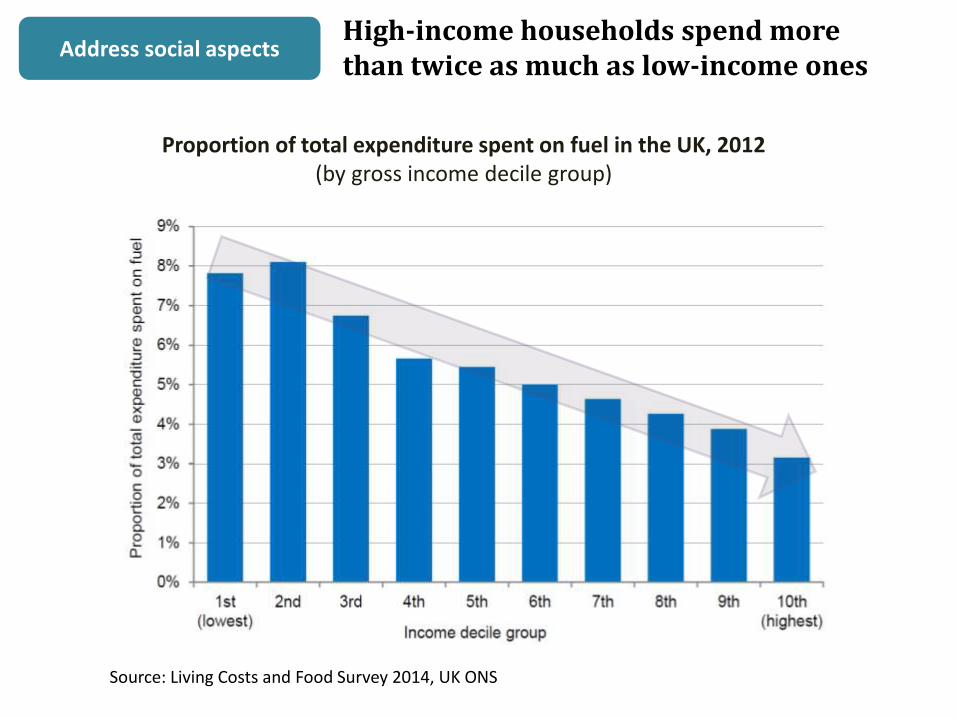
High-income households spend more than twice as much as low-income ones
Source: Living Costs and Food Survey 2014, UK ONS
Proportion of total expenditure spent on fuel in the UK, 2012 (by gross income decile group)
Address social aspects

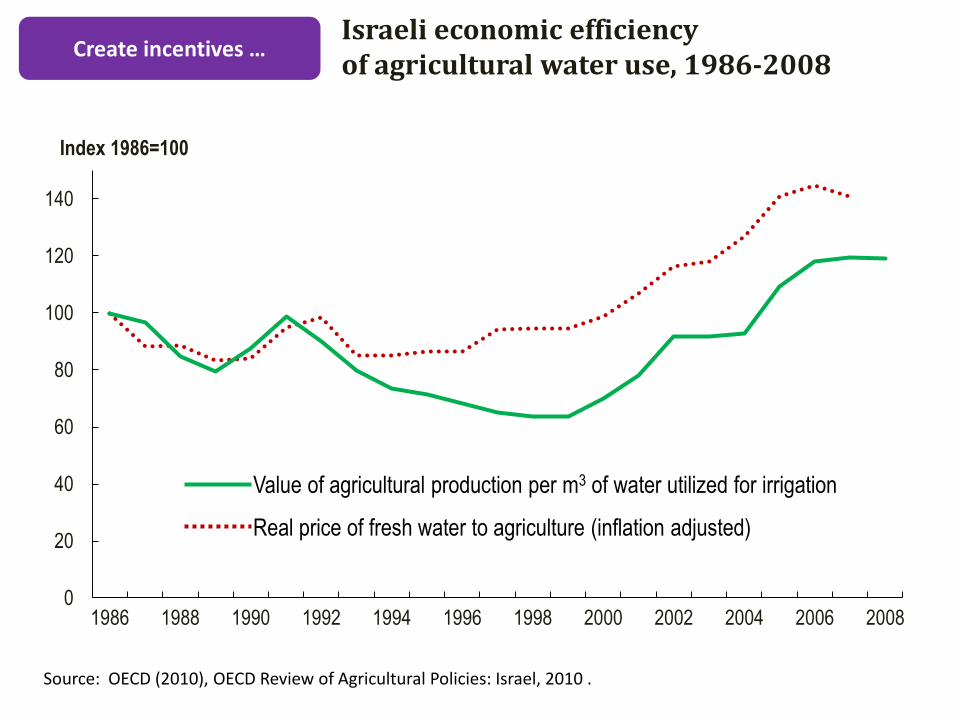
Israeli economic efficiency of agricultural water use, 1986-2008
Source: OECD (2010), OECD Review of Agricultural Policies: Israel, 2010 .
0
20
40
60
80
100
120
140
1986 1988 1990 1992 1994 1996 1998 2000 2002 2004 2006 2008
Index 1986=100
Value of agricultural production per m3 of water utilized for irrigation
Real price of fresh water to agriculture (inflation adjusted)
Create incentives …
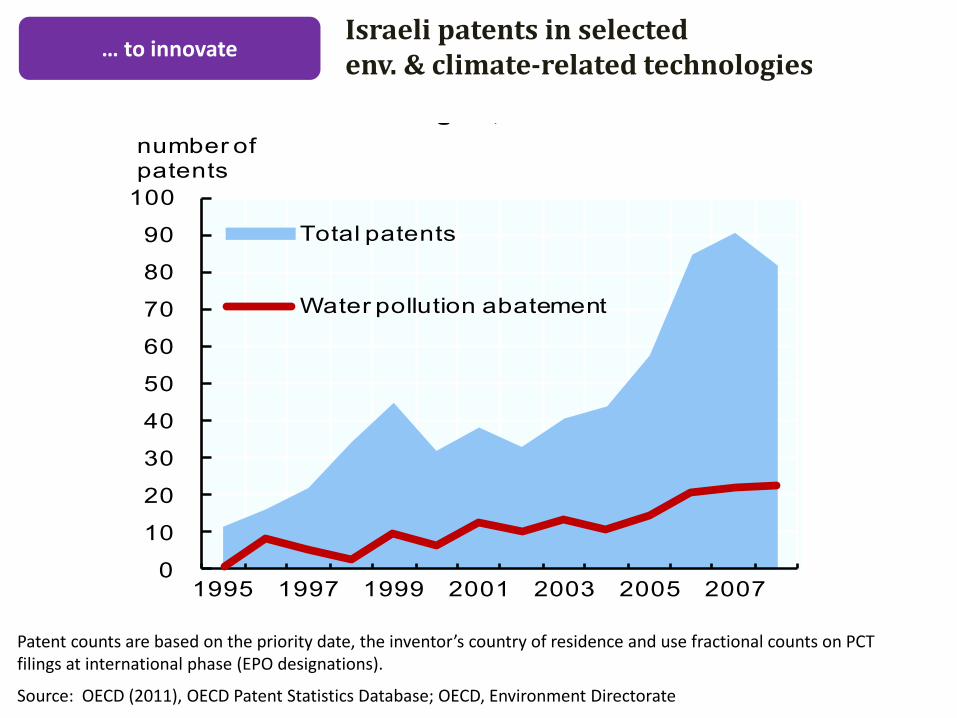
Israeli patents in selected env. & climate-related technologies
0
10
20
30
40
50
60
70
80
90
100
1995 1997 1999 2001 2003 2005 2007
General environmental management
technologies, 1995-2008
Total patents
Water pollution abatement
number of patents
Patent counts are based on the priority date, the inventor’s country of residence and use fractional counts on PCT filings at international phase (EPO designations).
Source: OECD (2011), OECD Patent Statistics Database; OECD, Environment Directorate
… to innovate

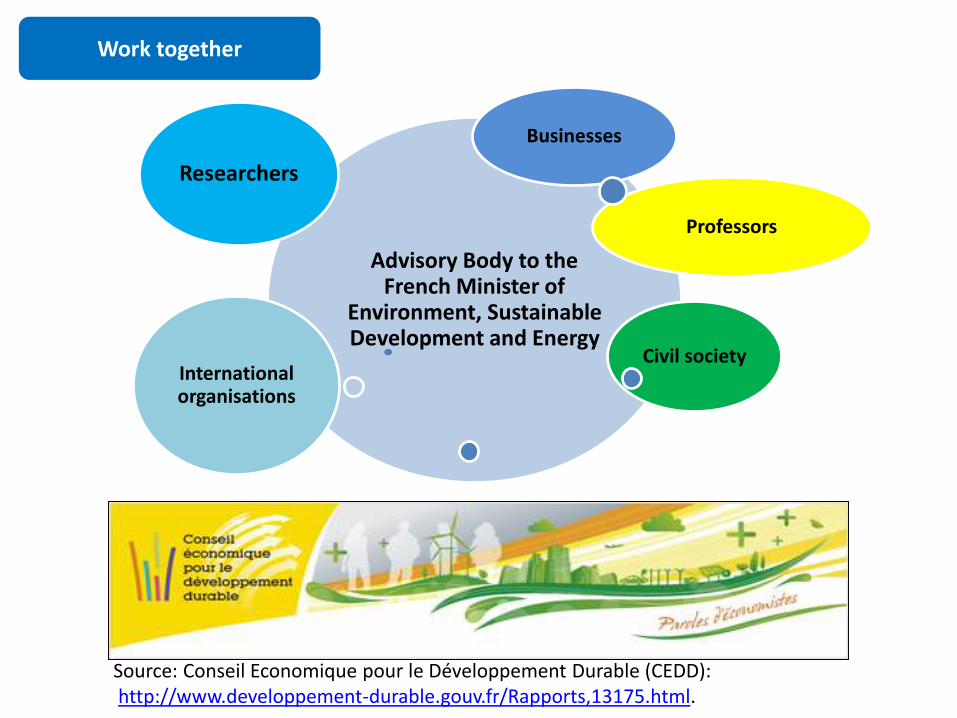
Internationalorganisations
Advisory Body to the French Minister of
Environment, Sustainable Development and Energy
Researchers
Professors
Civil society
Businesses
International organisations
Source: Conseil Economique pour le Développement Durable (CEDD):http://www.developpement-durable.gouv.fr/Rapports,13175.html.
Work together

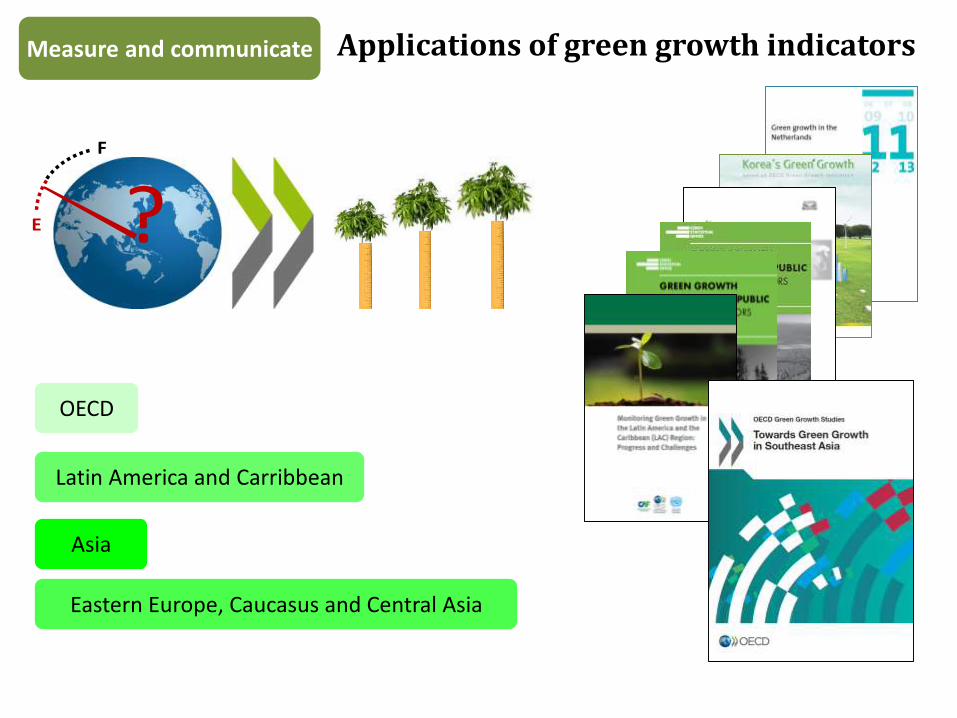
Measure and communicate
?F
E
OECD
Latin America and Carribbean
Eastern Europe, Caucasus and Central Asia
Asia
Applications of green growth indicators

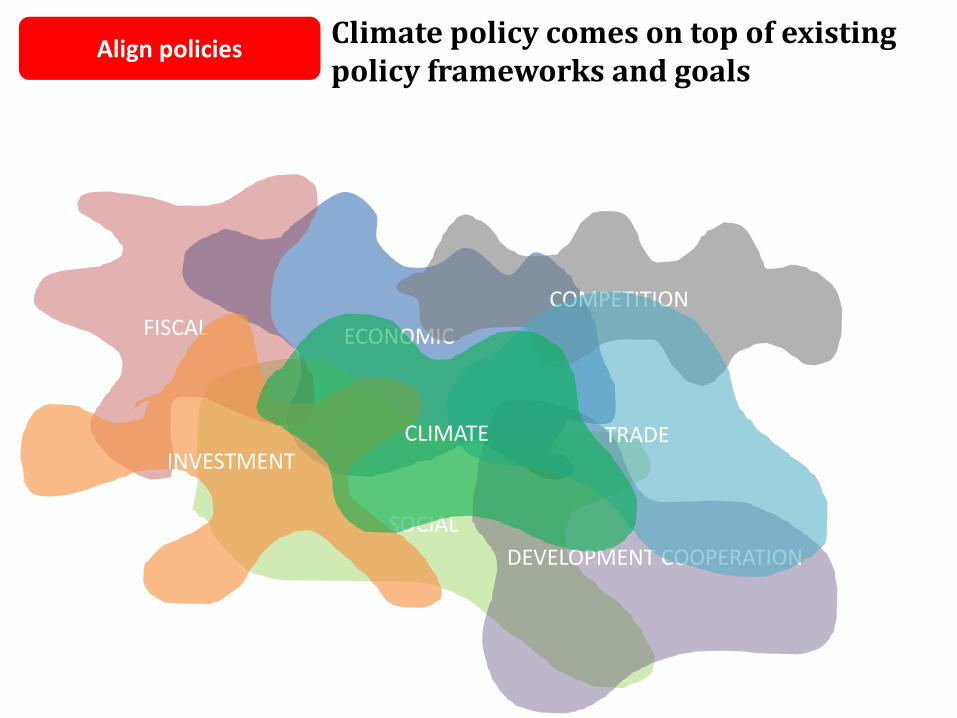
ECONOMIC
Climate policy comes on top of existing policy frameworks and goals
SOCIAL
COMPETITIONFISCAL
DEVELOPMENT COOPERATION
TRADEINVESTMENT
CLIMATE
Align policies

Thank you for your attention!
www.oecd.org/env
@OECD_ENV
OECD ENVIRONMENT playlist