Embed Size (px)
Citation preview
Stormwater in the Coastal Plain – Virginia Beach, December 3, 2014
Stormwater in the Coastal Plain – Virginia Beach, December 3, 2014
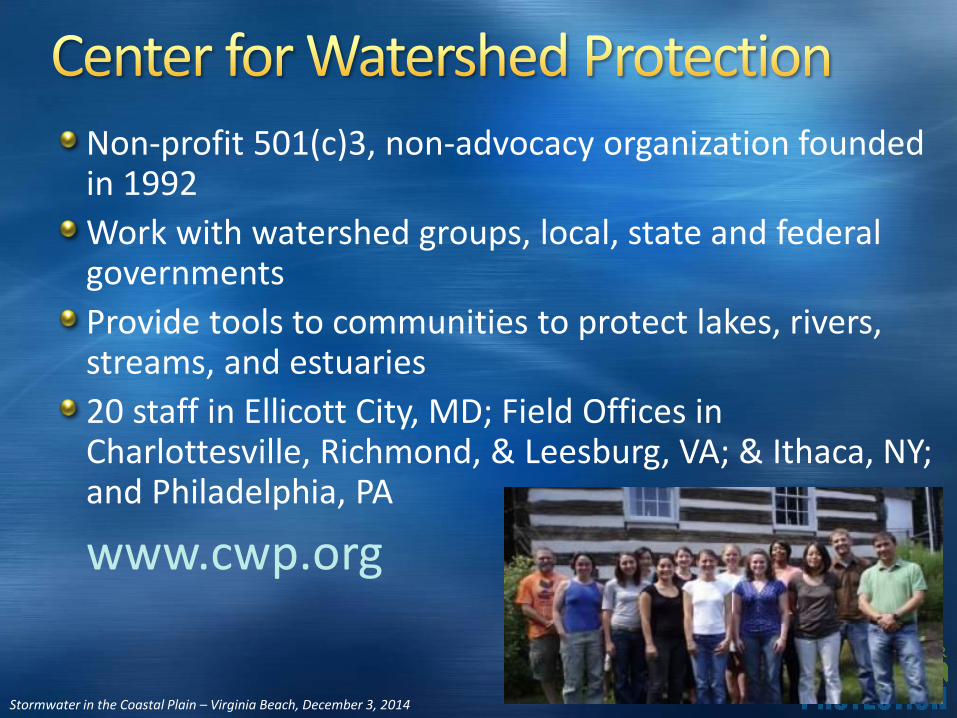
Non-profit 501(c)3, non-advocacy organization founded in 1992
Work with watershed groups, local, state and federal governments
Provide tools to communities to protect lakes, rivers, streams, and estuaries
20 staff in Ellicott City, MD; Field Offices in Charlottesville, Richmond, & Leesburg, VA; & Ithaca, NY; and Philadelphia, PA
www.cwp.org
Stormwater in the Coastal Plain – Virginia Beach, December 3, 2014
Welcome and Introductions
Historical Perspective
Today’s Perspective
break
Connecting the VRRM Dots: Quality
lunch
Connecting the VRRM Dots: Quantity
break
Meet the BMPs (Coastal Plain Adaptations)
Design Examples & Discussion
Stormwater in the Coastal Plain – Virginia Beach, December 3, 2014
Goal of Today’s Workshop:Understand the differences (and similarities) between the old (Part IIC) & the new (Part IIB) criteria;
Become familiar with the new menu of BMPs and their respective performance credits;
Identify issues and/or specific topics for future training opportunities
Stormwater in the Coastal Plain – Virginia Beach, December 3, 2014
Detailed design instructions for BMPs;
Detailed analysis of life-cycle cost of BMPs;
Computational Hydrology & Hydraulics;
Easy solution for stormwater design on challenging sites:• Tidal influenced drainage system;
• High water table;
• Flat terrain.

Stormwater in the Coastal Plain – Virginia Beach, December 3, 2014
Be engaged
Ask critical questions
Share your expertise
Respect your colleagues:
Stormwater in the Coastal Plain – Virginia Beach, December 3, 2014
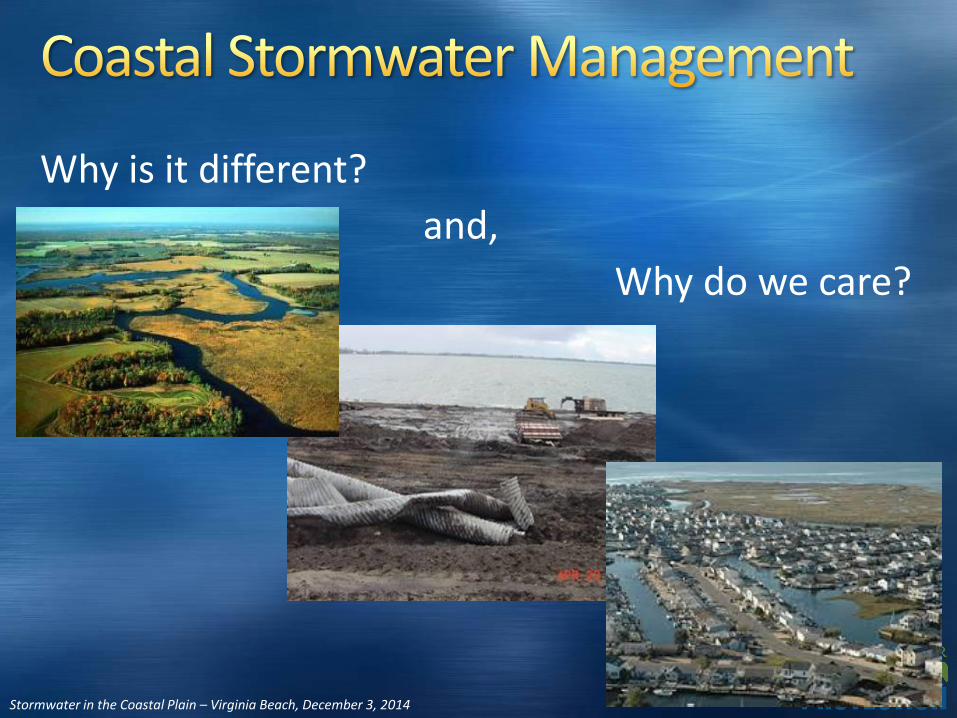
Why is it different?
and,
Why do we care?
Stormwater in the Coastal Plain – Virginia Beach, December 3, 2014
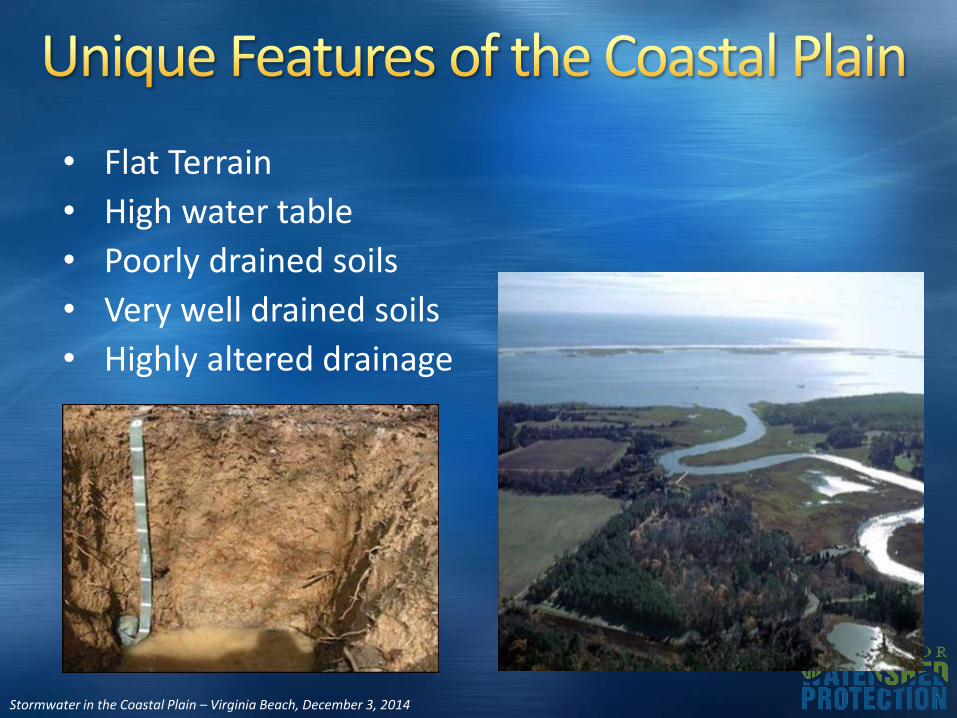
• Flat Terrain
• High water table
• Poorly drained soils
• Very well drained soils
• Highly altered drainage
Stormwater in the Coastal Plain – Virginia Beach, December 3, 2014
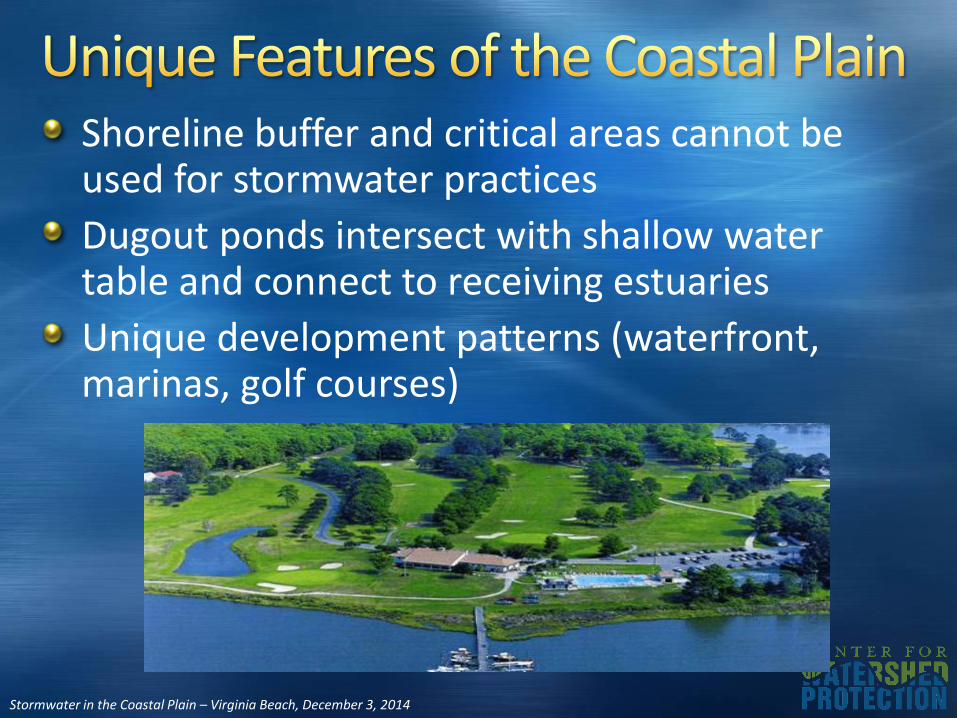
Shoreline buffer and critical areas cannot be used for stormwater practices
Dugout ponds intersect with shallow water table and connect to receiving estuaries
Unique development patterns (waterfront, marinas, golf courses)
Stormwater in the Coastal Plain – Virginia Beach, December 3, 2014
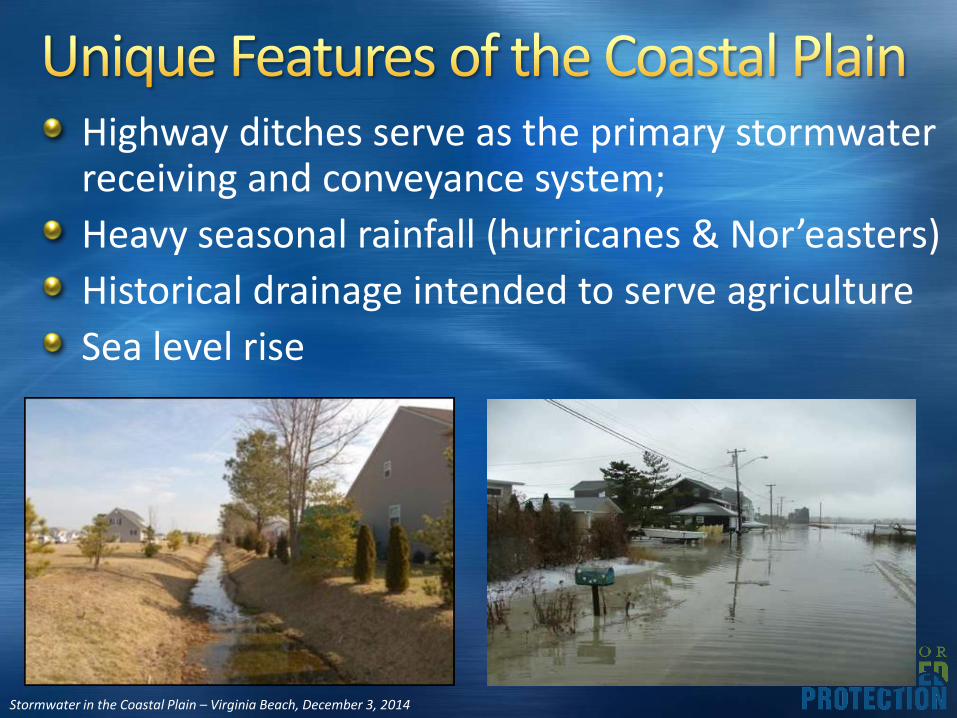
Highway ditches serve as the primary stormwater receiving and conveyance system;
Heavy seasonal rainfall (hurricanes & Nor’easters)
Historical drainage intended to serve agriculture
Sea level rise
Stormwater in the Coastal Plain – Virginia Beach, December 3, 2014
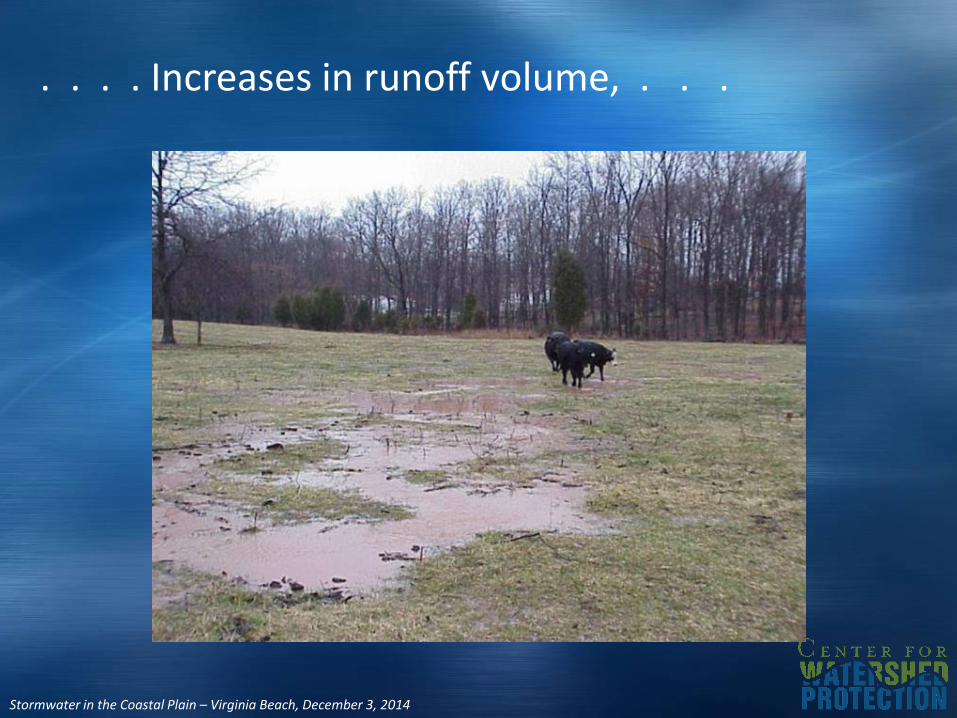
Stormwater in the Coastal Plain – Virginia Beach, December 3, 2014
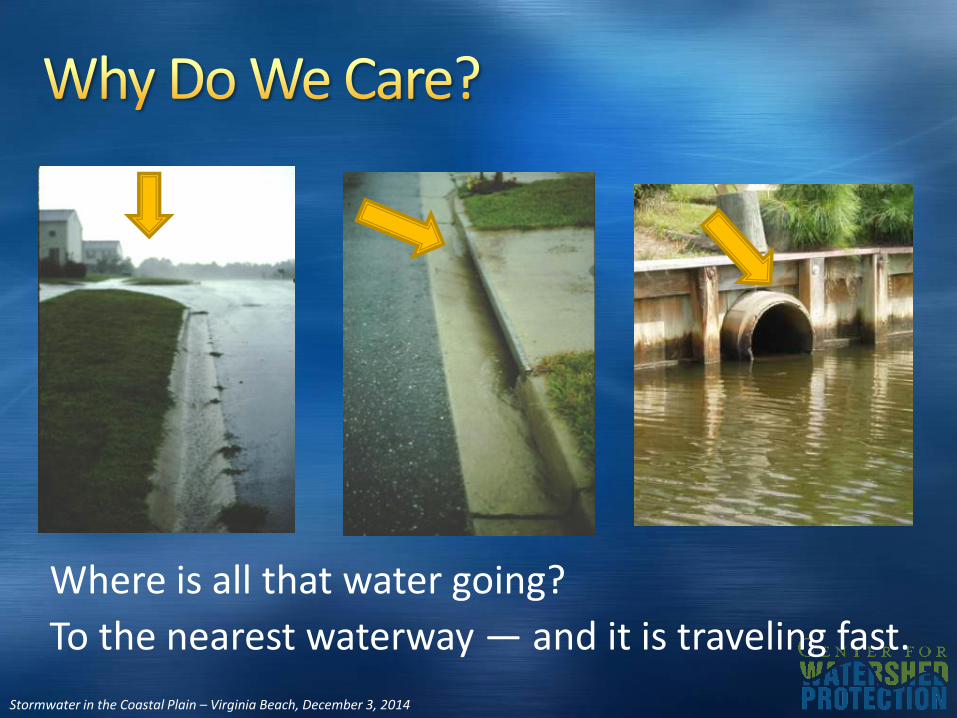
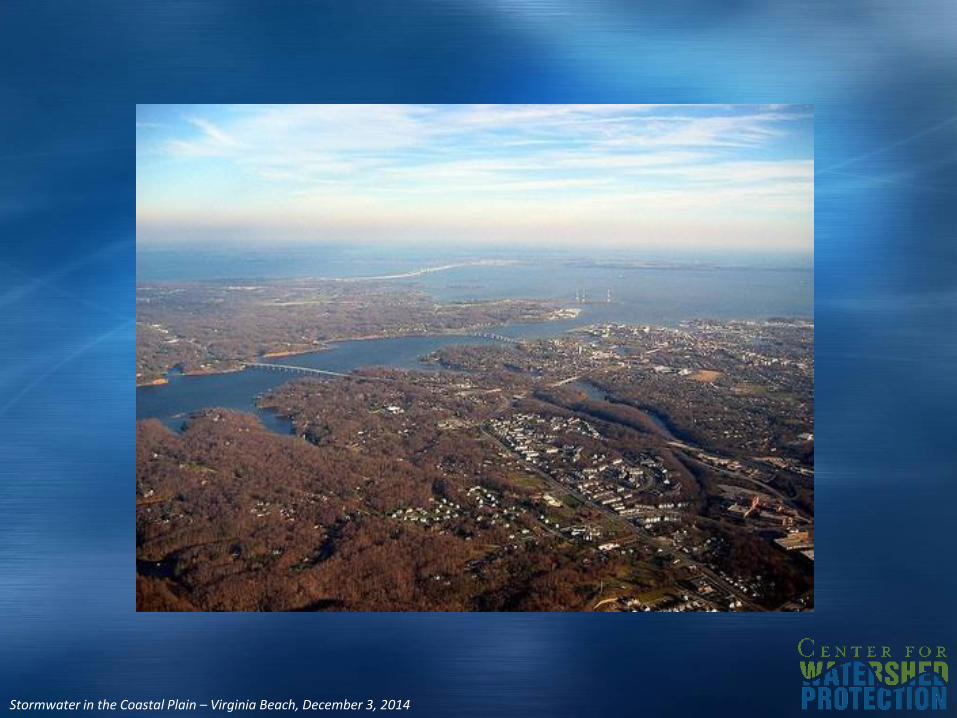
Where is all that water going?
To the nearest waterway — and it is traveling fast.
Stormwater in the Coastal Plain – Virginia Beach, December 3, 2014
The Economic Benefits of Cleaning Up the Chesapeake
Chesapeake Bay Foundation, 2014
Annual economic benefits derived from the land and waters of the Chesapeake Bay region ~ $107 billion
Continued/Improved implementation of multiple targeted programs (Chesapeake Clean Water Blueprint) are expected to increase the value 21% (~ $130 billion);
Stormwater in the Coastal Plain – Virginia Beach, December 3, 2014
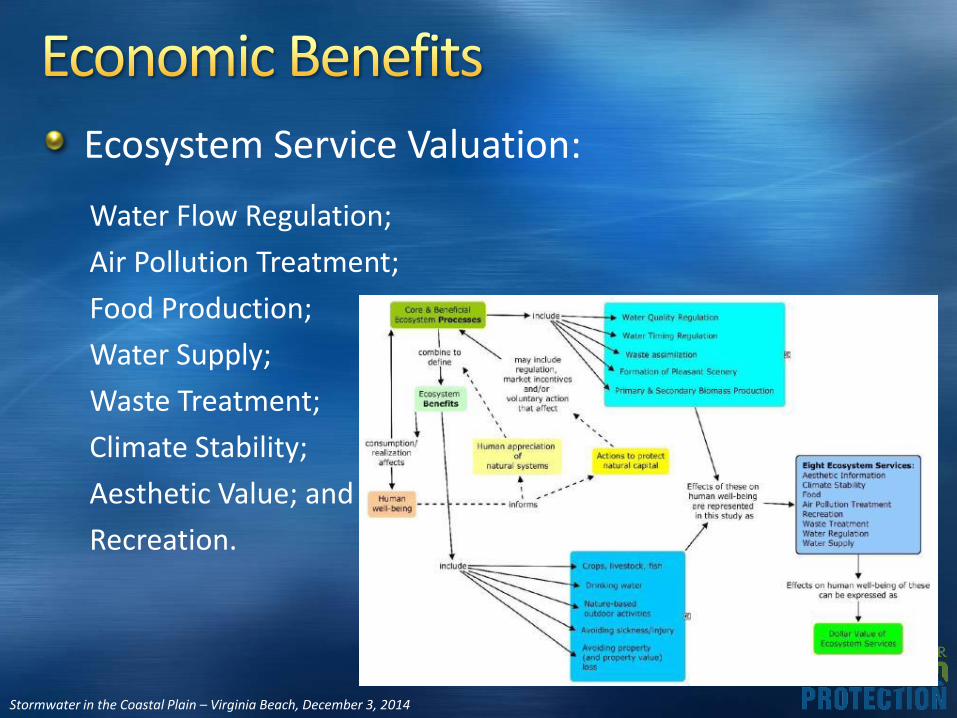
Ecosystem Service Valuation:
Water Flow Regulation;
Air Pollution Treatment;
Food Production;
Water Supply;
Waste Treatment;
Climate Stability;
Aesthetic Value; and
Recreation.
Stormwater in the Coastal Plain – Virginia Beach, December 3, 2014
•• Extreme storms eventsExtreme storms events
•• Population growth & rapid Population growth & rapid
developmentdevelopment
•• Wetland, contiguous forest, Wetland, contiguous forest,
& upland habitat preservation& upland habitat preservation
•• Wastewater disposalWastewater disposal
•• Shellfish prohibitionsShellfish prohibitions
•• Harmful algal bloomsHarmful algal blooms
•• Pollution preventionPollution prevention–– NitrogenNitrogen
–– BacteriaBacteria
•• Maintain waterMaintain water--based based
recreation recreation
Coastal ConcernsCoastal ConcernsCoastal Concerns
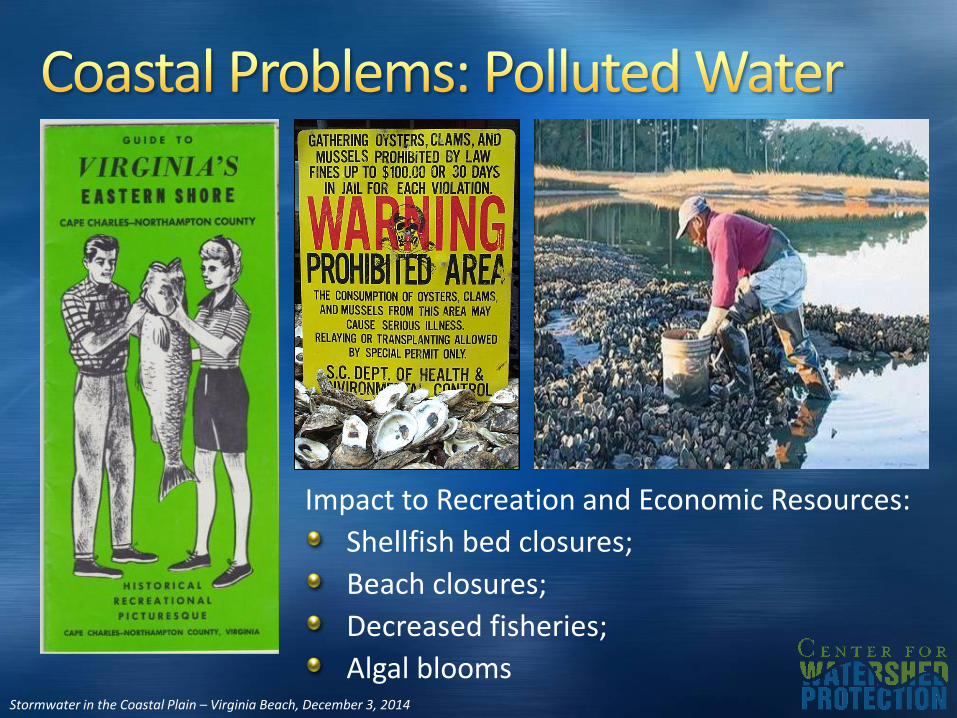
Impact to Recreation and Economic Resources:
Shellfish bed closures;
Beach closures;
Decreased fisheries;
Algal blooms
Stormwater in the Coastal Plain – Virginia Beach, December 3, 2014
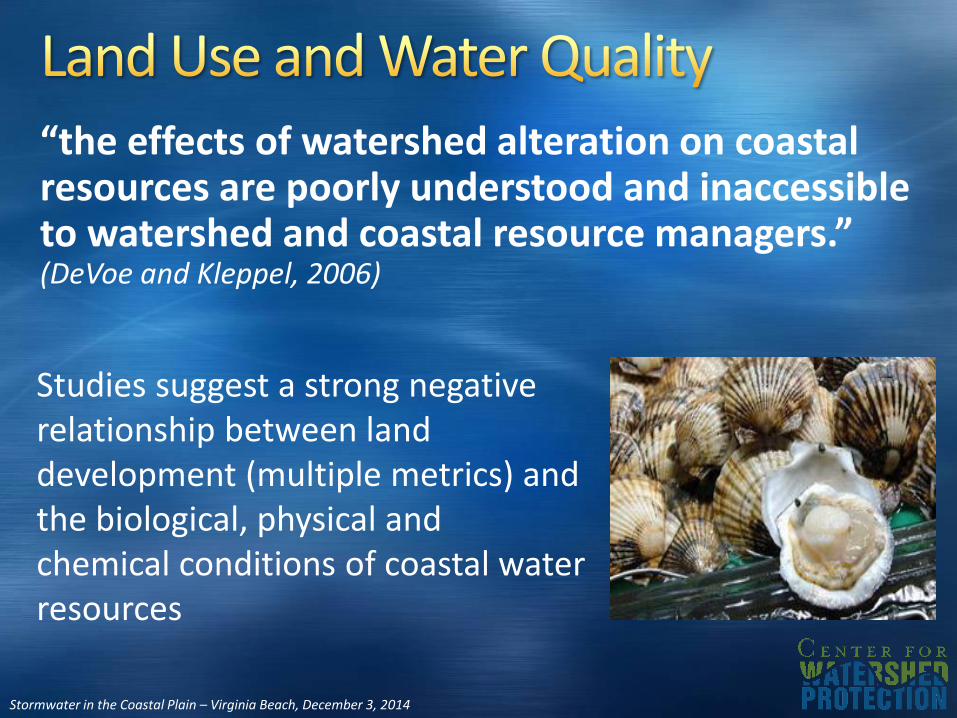
“the effects of watershed alteration on coastal resources are poorly understood and inaccessible to watershed and coastal resource managers.” (DeVoe and Kleppel, 2006)
Studies suggest a strong negative relationship between land development (multiple metrics) and the biological, physical and chemical conditions of coastal water resources
Stormwater in the Coastal Plain – Virginia Beach, December 3, 2014
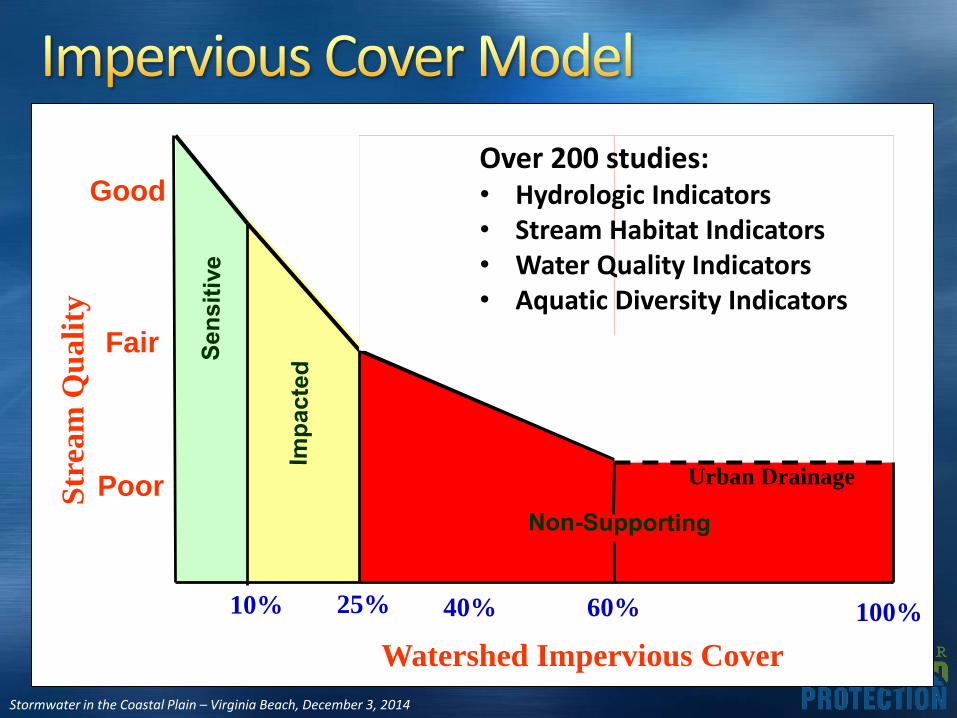
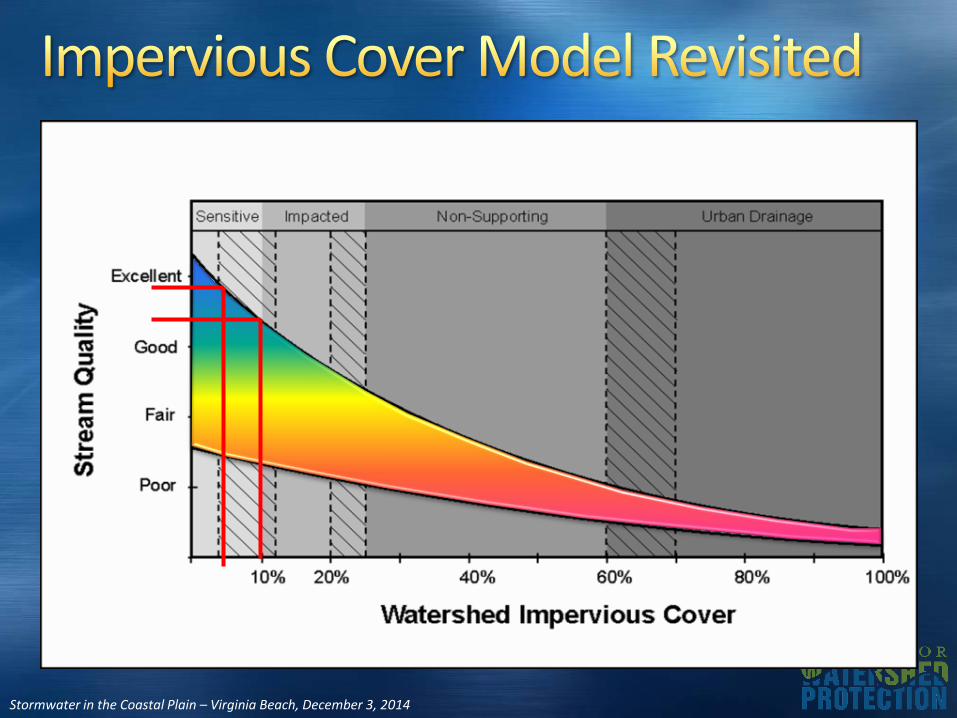
10% 40%25%
Good
Fair
Poor
Watershed Impervious Cover
Str
eam
Qu
ali
ty
60% 100%
Urban Drainage
Over 200 studies:• Hydrologic Indicators• Stream Habitat Indicators• Water Quality Indicators• Aquatic Diversity Indicators
Stormwater in the Coastal Plain – Virginia Beach, December 3, 2014
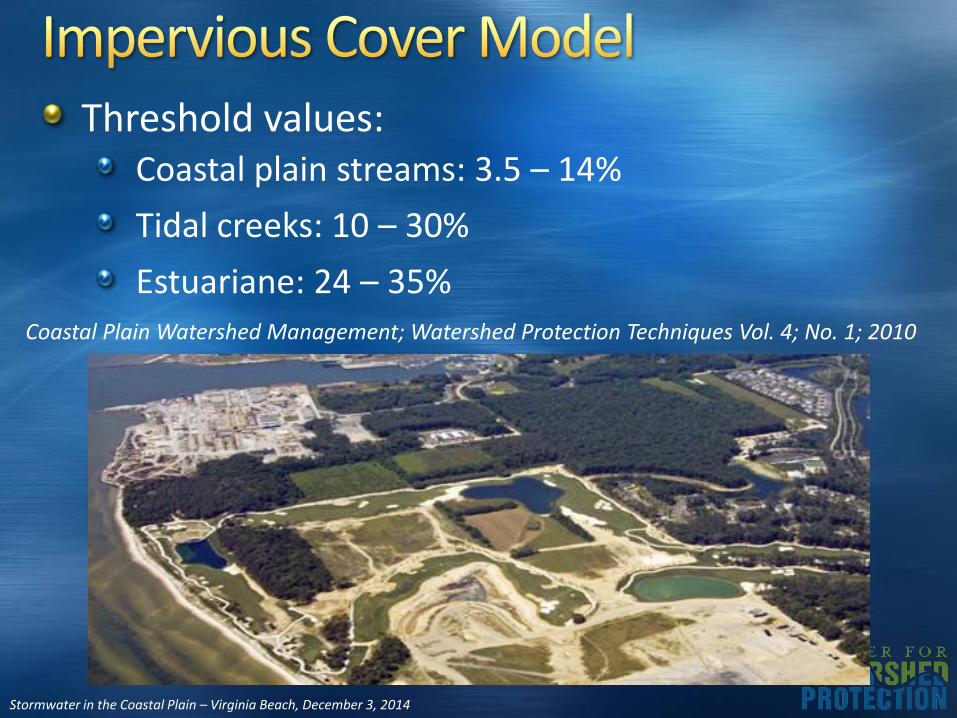
Threshold values:Coastal plain streams: 3.5 – 14%
Tidal creeks: 10 – 30%
Estuariane: 24 – 35% Coastal Plain Watershed Management; Watershed Protection Techniques Vol. 4; No. 1; 2010
Stormwater in the Coastal Plain – Virginia Beach, December 3, 2014
Stormwater in the Coastal Plain – Virginia Beach, December 3, 2014
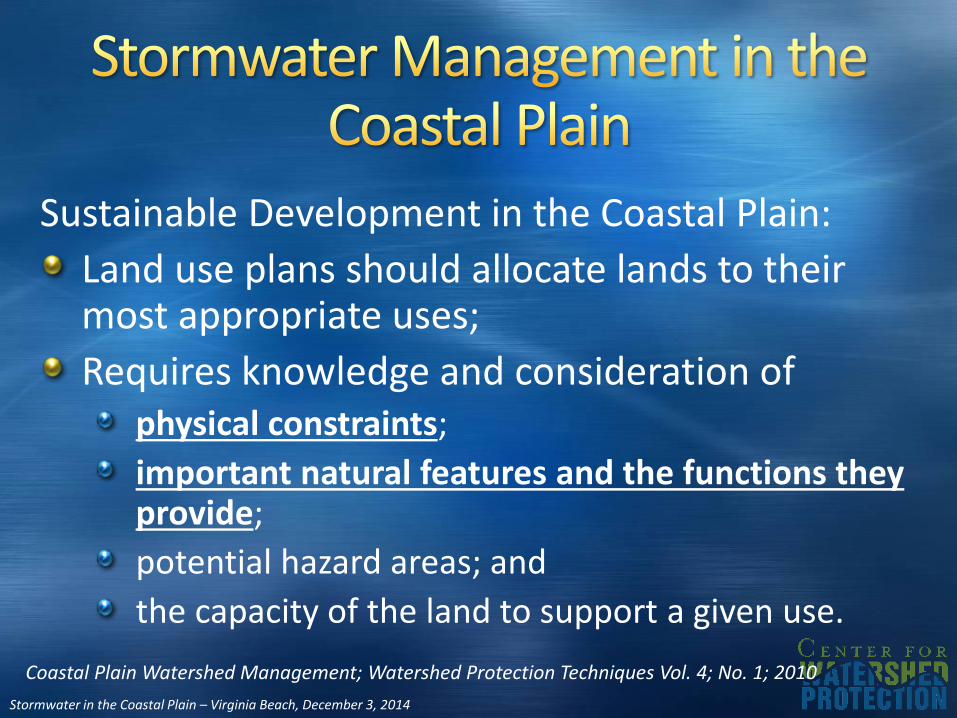
Sustainable Development in the Coastal Plain:
Land use plans should allocate lands to their most appropriate uses;
Requires knowledge and consideration of physical constraints;
important natural features and the functions they provide;
potential hazard areas; and
the capacity of the land to support a given use.
Coastal Plain Watershed Management; Watershed Protection Techniques Vol. 4; No. 1; 2010
Stormwater in the Coastal Plain – Virginia Beach, December 3, 2014
Stormwater in the Coastal Plain – Virginia Beach, December 3, 2014
Stormwater in the Coastal Plain – Virginia Beach, December 3, 2014
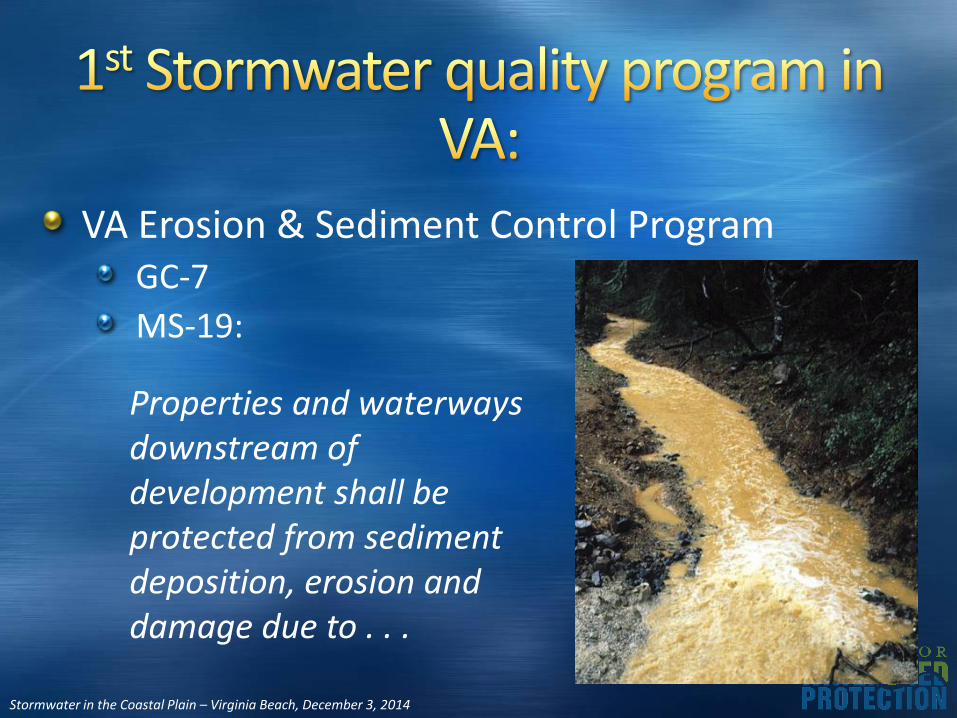
VA Erosion & Sediment Control ProgramGC-7
MS-19:
Properties and waterways downstream of development shall be protected from sediment deposition, erosion and damage due to . . .
Stormwater in the Coastal Plain – Virginia Beach, December 3, 2014
. . . . Increases in runoff volume, . . .
Stormwater in the Coastal Plain – Virginia Beach, December 3, 2014
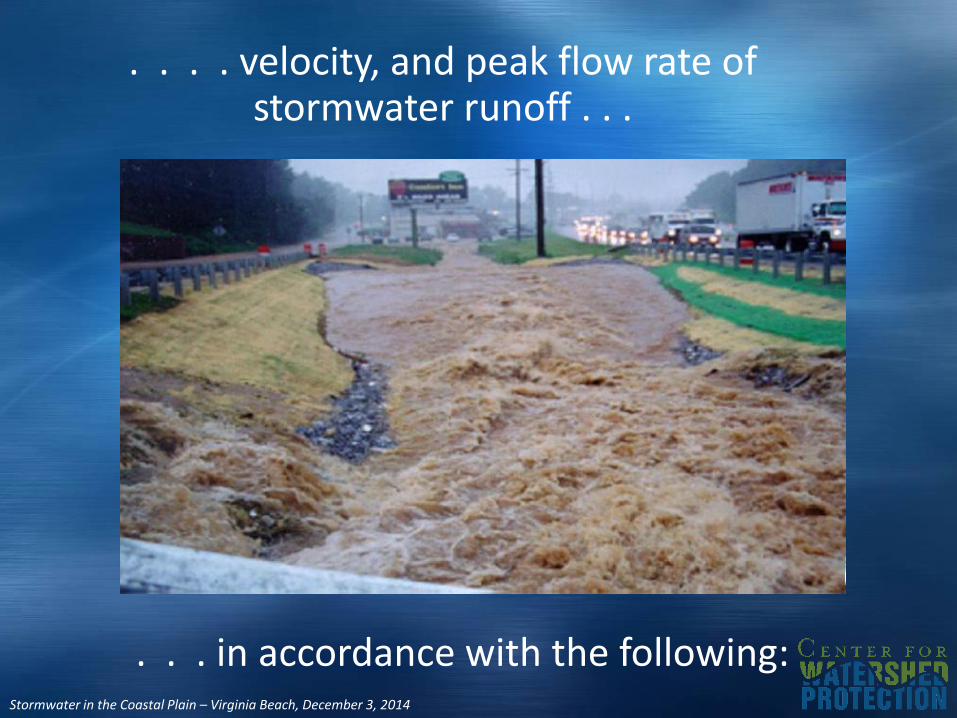
. . . . velocity, and peak flow rate of stormwater runoff . . .
. . . in accordance with the following:
Stormwater in the Coastal Plain – Virginia Beach, December 3, 2014
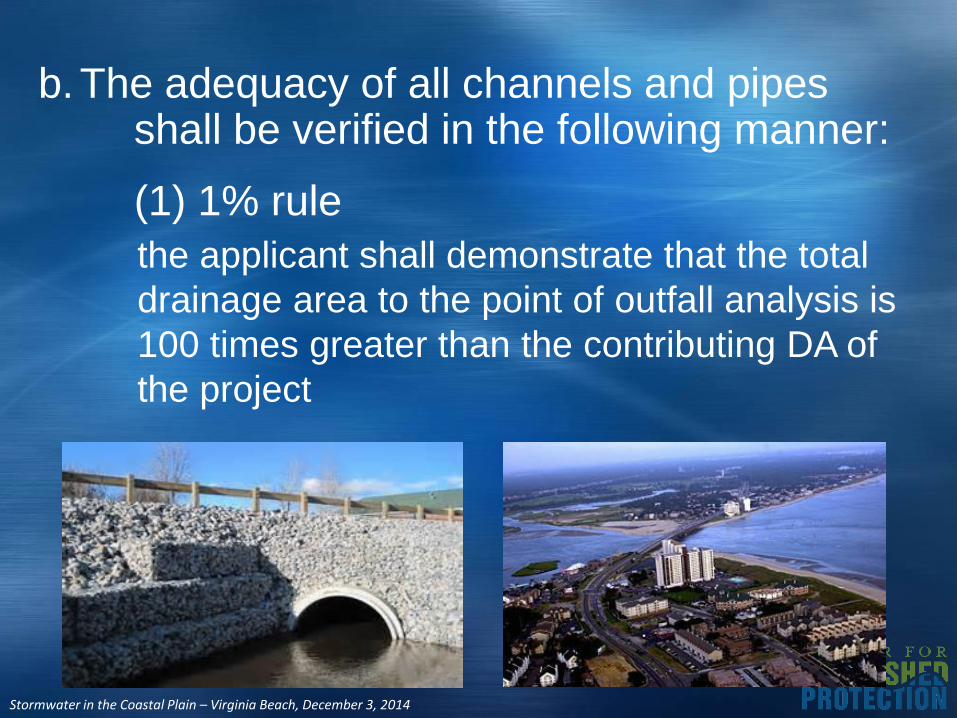
b. The adequacy of all channels and pipes shall be verified in the following manner:
(1) 1% rule
the applicant shall demonstrate that the total
drainage area to the point of outfall analysis is
100 times greater than the contributing DA of
the project
Stormwater in the Coastal Plain – Virginia Beach, December 3, 2014
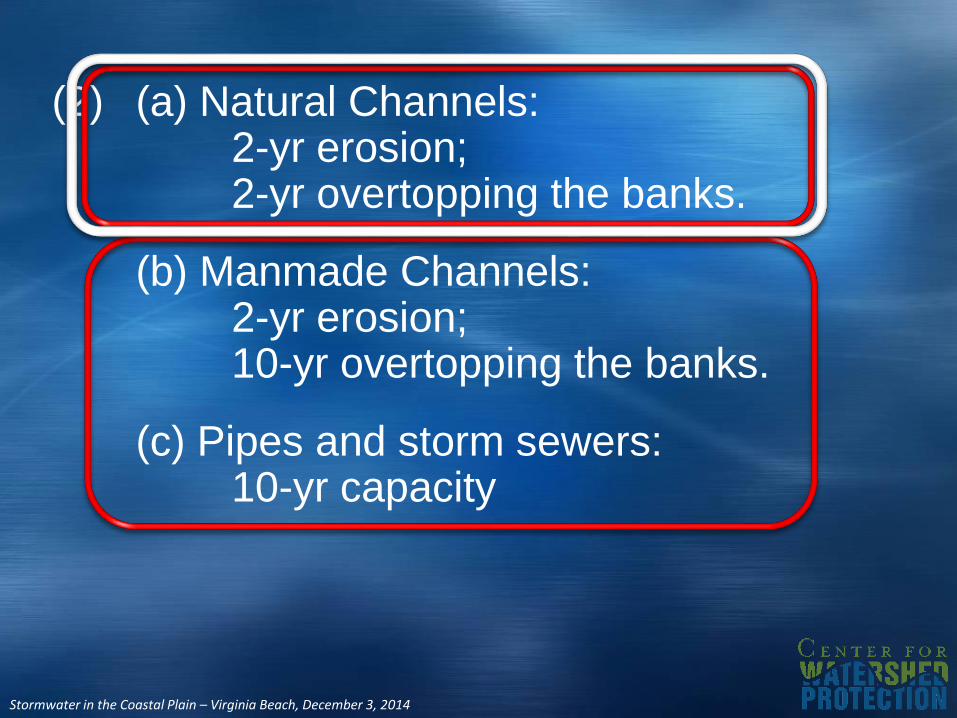
(2) (a) Natural Channels: 2-yr erosion; 2-yr overtopping the banks.
(b) Manmade Channels:2-yr erosion;10-yr overtopping the banks.
(c) Pipes and storm sewers:10-yr capacity
Stormwater in the Coastal Plain – Virginia Beach, December 3, 2014
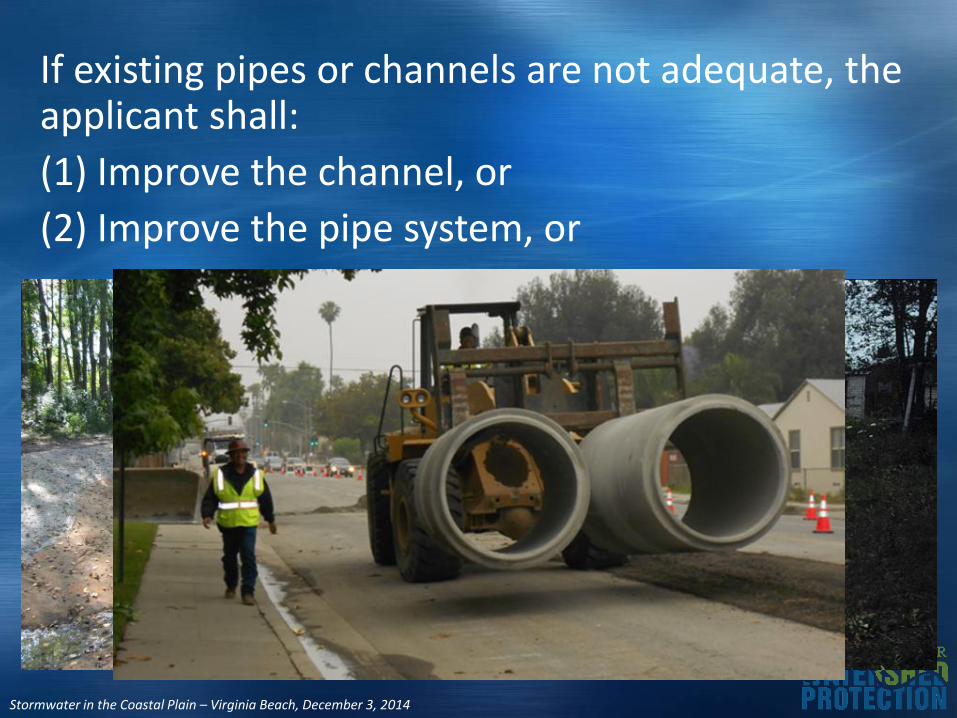
If existing pipes or channels are not adequate, the applicant shall:
(1) Improve the channel, or
(2) Improve the pipe system, or
Stormwater in the Coastal Plain – Virginia Beach, December 3, 2014
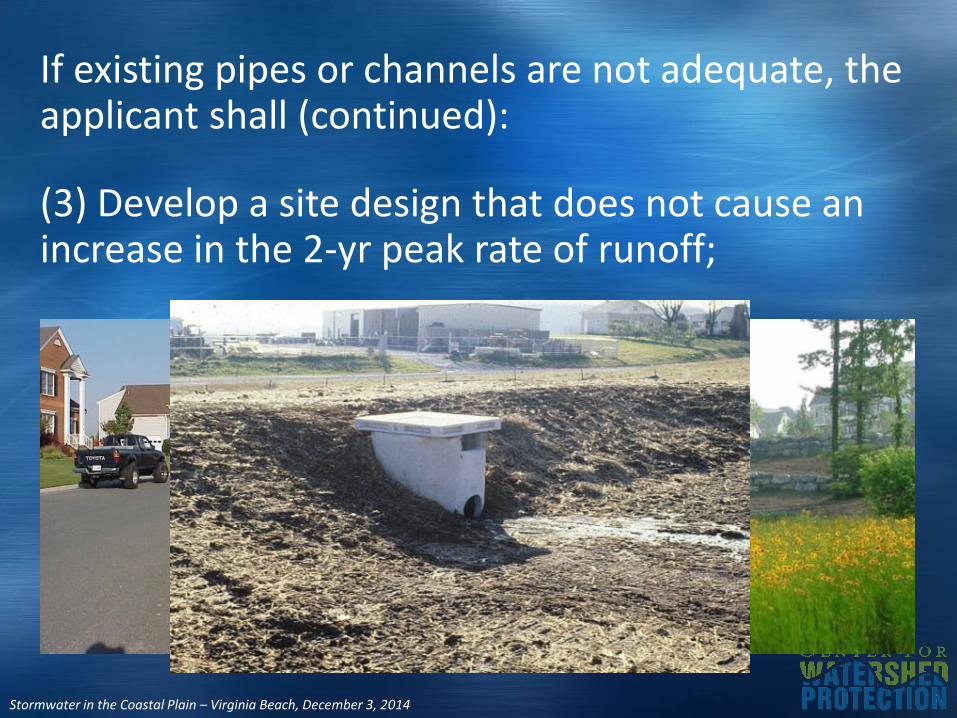
If existing pipes or channels are not adequate, the applicant shall (continued):
(3) Develop a site design that does not cause an increase in the 2-yr peak rate of runoff;
Stormwater in the Coastal Plain – Virginia Beach, December 3, 2014
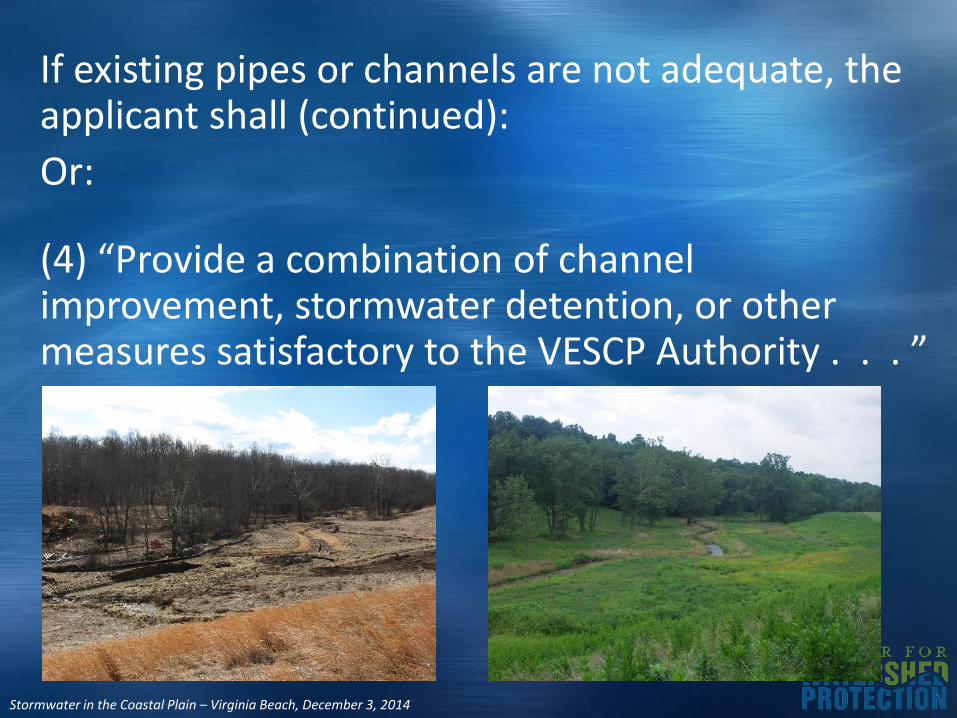
If existing pipes or channels are not adequate, the applicant shall (continued):
Or:
(4) “Provide a combination of channel improvement, stormwater detention, or other measures satisfactory to the VESCP Authority . . . ”
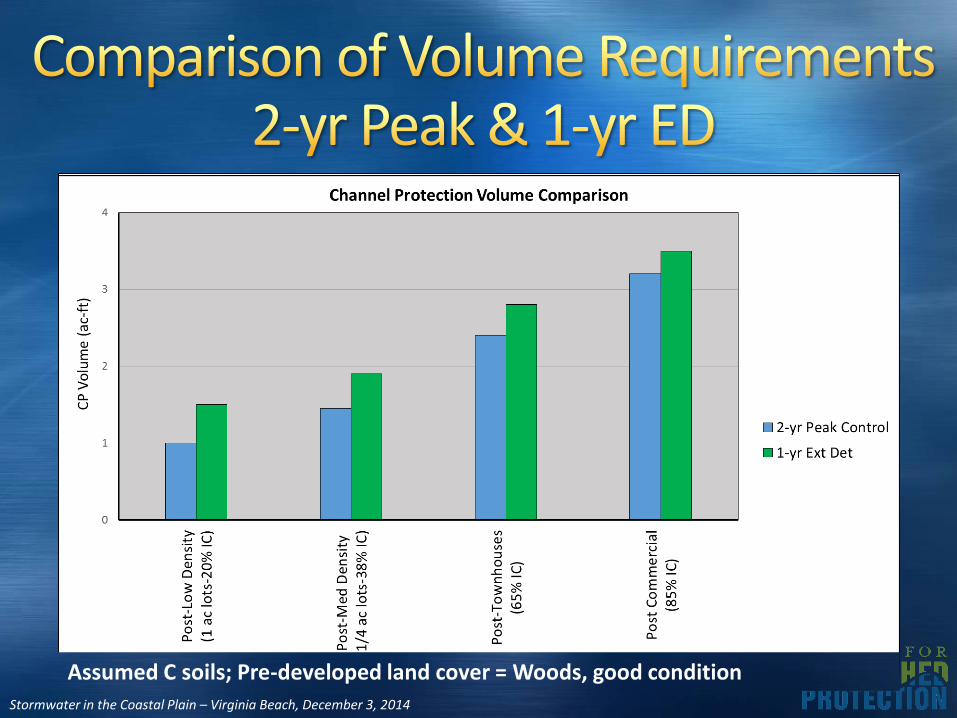
Stormwater in the Coastal Plain – Virginia Beach, December 3, 2014
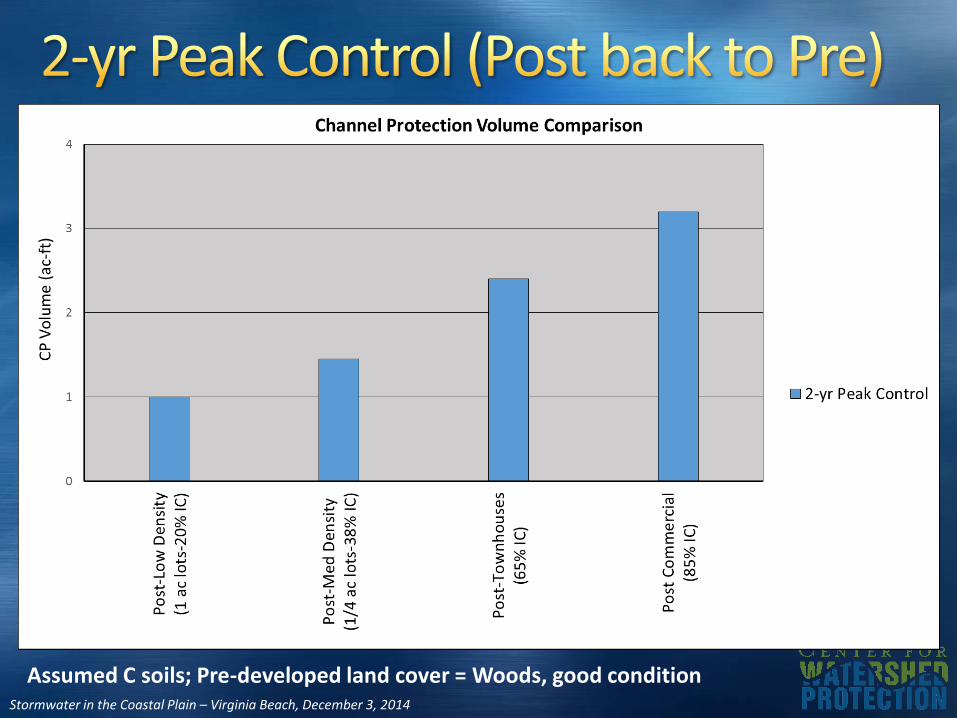
Assumed C soils; Pre-developed land cover = Woods, good condition
Stormwater in the Coastal Plain – Virginia Beach, December 3, 2014
1988 Chesapeake Bay Preservation Act
(§ 62.1‐44.15:67)
&
The Chesapeake Bay Preservation Area Designation
and Management Regulations
(9VAC25-830)
Stormwater in the Coastal Plain – Virginia Beach, December 3, 2014
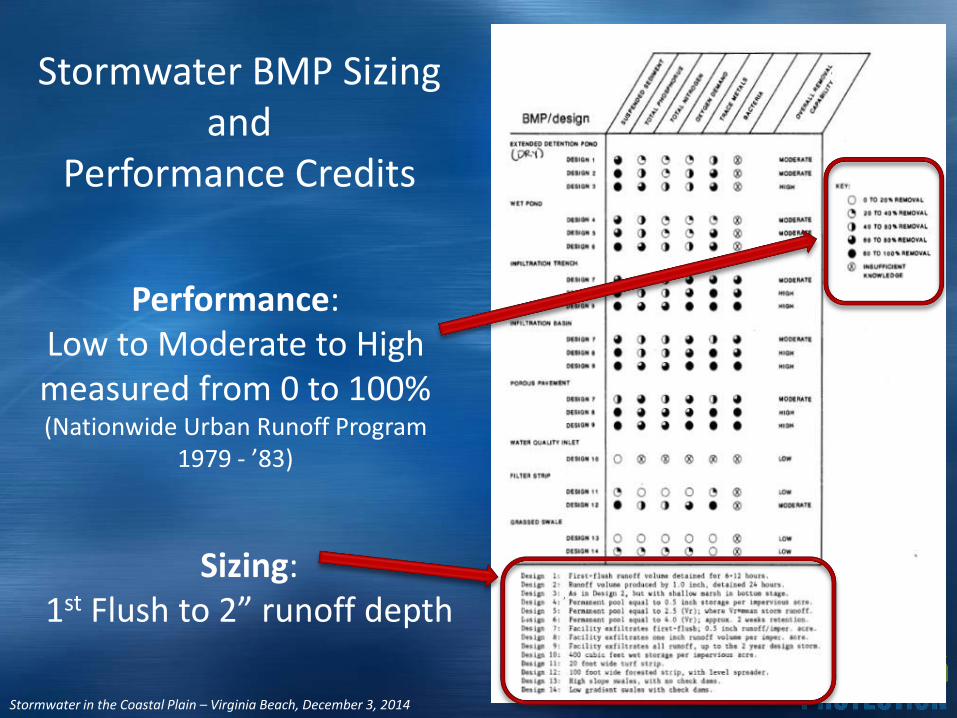
Stormwater BMP Sizing and
Performance Credits
Performance: Low to Moderate to High measured from 0 to 100%(Nationwide Urban Runoff Program
1979 - ’83)
Sizing: 1st Flush to 2” runoff depth
Stormwater in the Coastal Plain – Virginia Beach, December 3, 2014
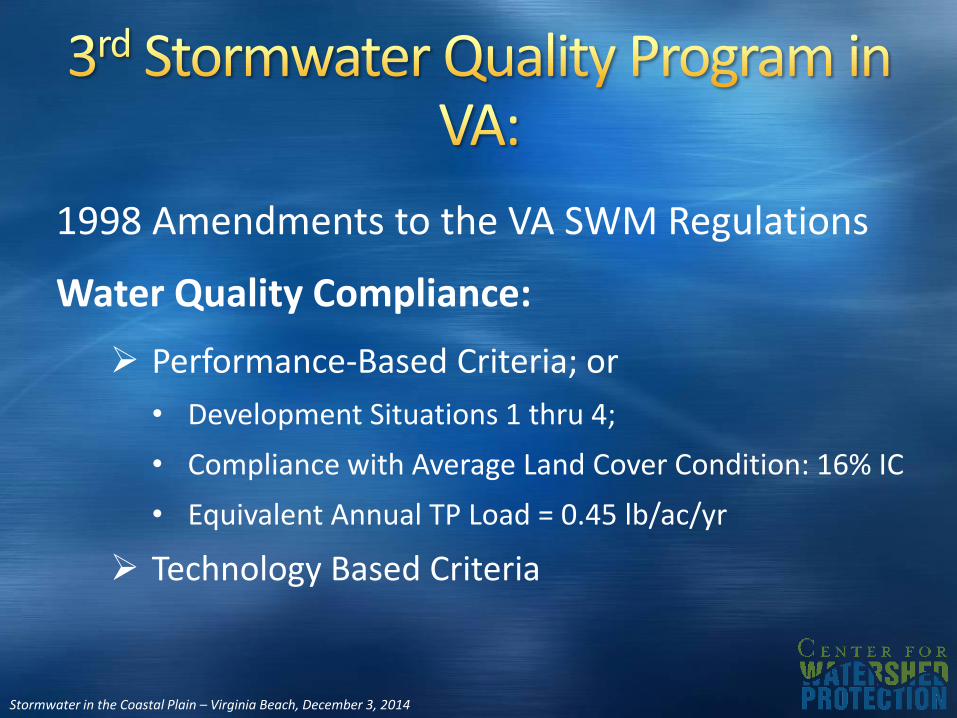
1998 Amendments to the VA SWM Regulations
Water Quality Compliance:
Performance-Based Criteria; or
• Development Situations 1 thru 4;
• Compliance with Average Land Cover Condition: 16% IC
• Equivalent Annual TP Load = 0.45 lb/ac/yr
Technology Based Criteria

Stormwater in the Coastal Plain – Virginia Beach, December 3, 2014
Simple Method: Average Annual Load
𝐿𝑜𝑎𝑑 = 𝑃 × 𝑃𝑗 × 𝑅𝑣 × 𝐶 × 𝐴 × 2.72/12
P = average annual rainfall depth (inches) = 43 inches (VA)
Pj = fraction of rainfall events that produce runoff = 0.9
Rv = volumetric runoff coefficient = 0.05 + (0.009 × I); I = impervious cover
C = flow-weighted event mean concentration (EMC) of TP = (mg/L) = 0.26 mg/L
A = contributing drainage area (acres)
2.72 = unit conversion factor: L to ft3, mg to lb, and acres to ft2
12 = unit conversion factor: rainfall inches to feet
Stormwater in the Coastal Plain – Virginia Beach, December 3, 2014
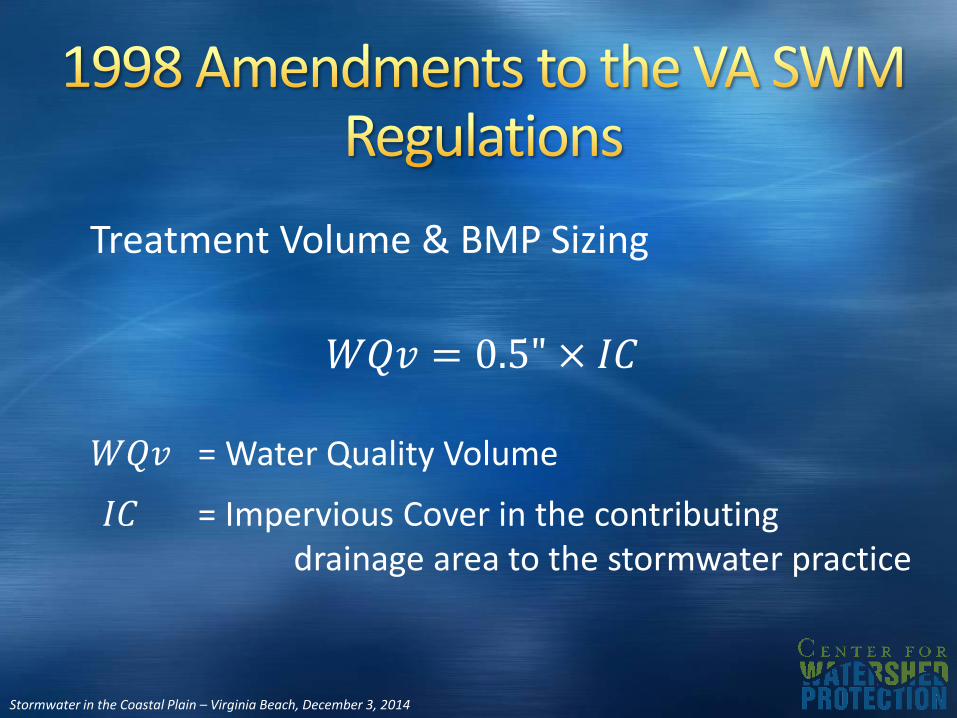
Treatment Volume & BMP Sizing
𝑊𝑄𝑣 = Water Quality Volume
𝐼𝐶 = Impervious Cover in the contributing drainage area to the stormwater practice
𝑊𝑄𝑣 = 0.5" × 𝐼𝐶
Stormwater in the Coastal Plain – Virginia Beach, December 3, 2014
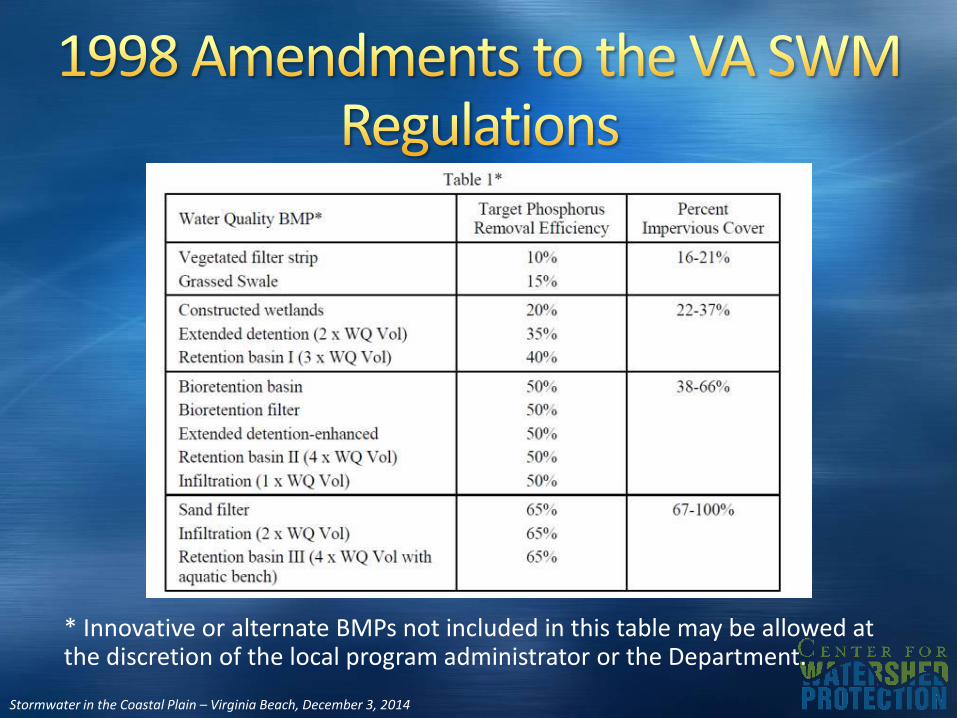
* Innovative or alternate BMPs not included in this table may be allowed at the discretion of the local program administrator or the Department.
Stormwater in the Coastal Plain – Virginia Beach, December 3, 2014
Water Quantity Compliance:
Properties and receiving waterways downstream of any land development project shall be protected from erosion and damage due to increases in volume, velocity and peak flow rate of stormwater runoff in accordance with . . .
Stormwater in the Coastal Plain – Virginia Beach, December 3, 2014
Water Quantity Compliance:
Minimum Standard 19 of the ESC Regulations; or
The plan approving authority may determine that some receiving stream systems require enhanced criteria to address increased frequency of bankfullflows and therefore require:
24-hour Extended Detention of the runoff from the 1-year 24-hour storm
Stormwater in the Coastal Plain – Virginia Beach, December 3, 2014
Water Quantity Compliance:
2-yr post back to pre vs 1-yr ED
Moderate development (32% IC):
• > 2 x increase in runoff volume
• 4 to 8 x increased Frequency of bankfull flows;
. . . . significant reduction in stream channel erosion below facilities designed for 24-hour ED of the 1-yr frequency runoff (Galli, MWCOG 1992)
Stormwater in the Coastal Plain – Virginia Beach, December 3, 2014
Assumed C soils; Pre-developed land cover = Woods, good condition

Stormwater in the Coastal Plain – Virginia Beach, December 3, 2014
Stormwater in the Coastal Plain – Virginia Beach, December 3, 2014
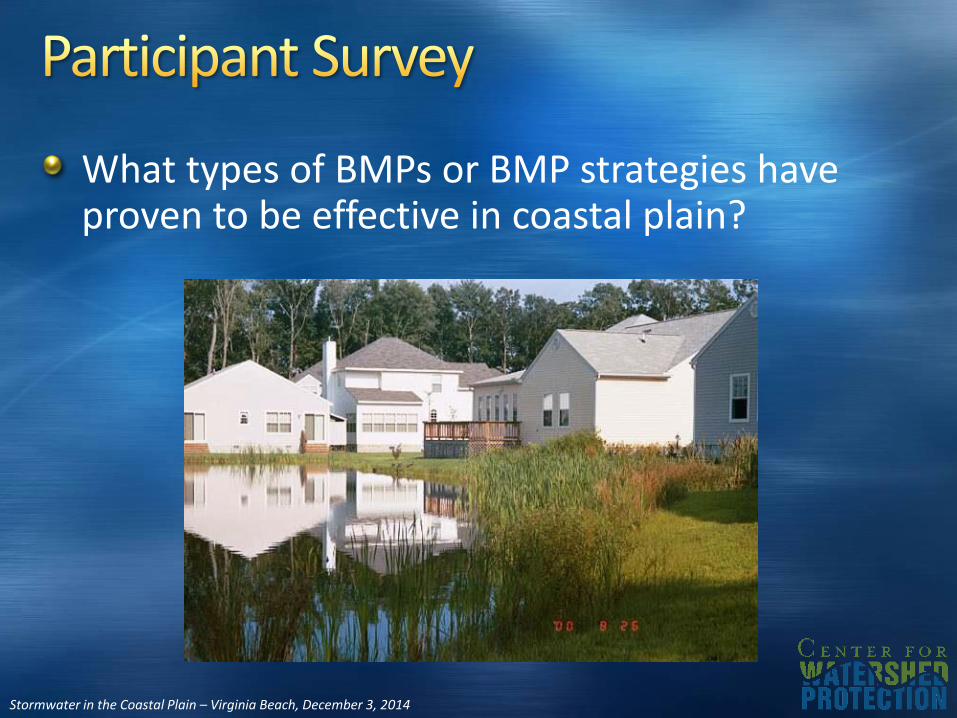
What types of BMPs or BMP strategies have proven to be effective in coastal plain?
Stormwater in the Coastal Plain – Virginia Beach, December 3, 2014
Stormwater in the Coastal Plain – Virginia Beach, December 3, 2014
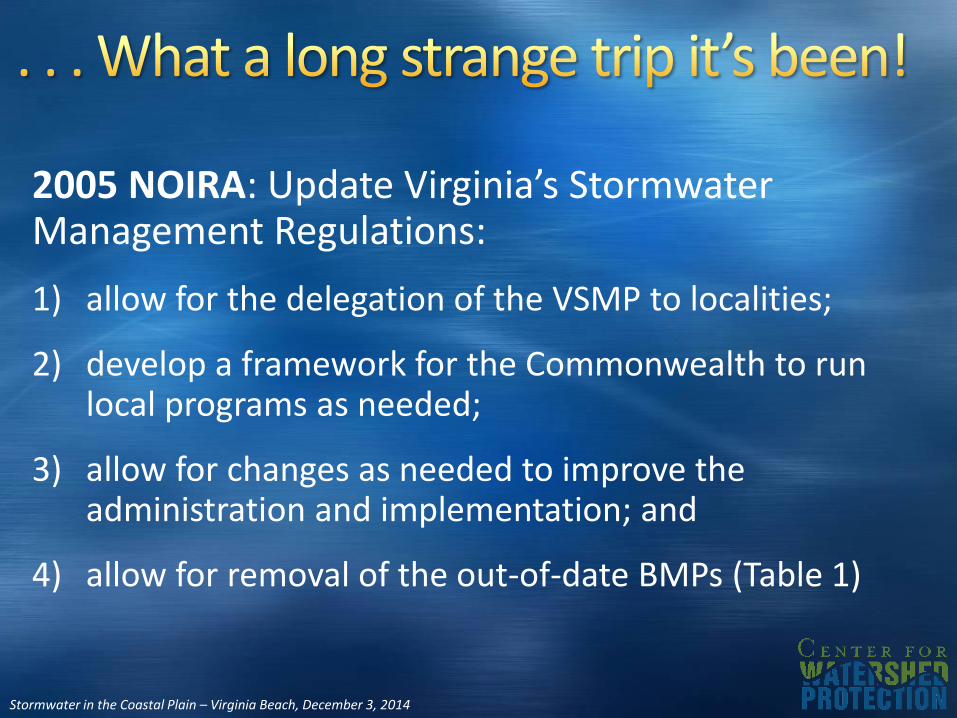
2005 NOIRA: Update Virginia’s Stormwater Management Regulations:
1) allow for the delegation of the VSMP to localities;
2) develop a framework for the Commonwealth to run local programs as needed;
3) allow for changes as needed to improve the administration and implementation; and
4) allow for removal of the out-of-date BMPs (Table 1)
Stormwater in the Coastal Plain – Virginia Beach, December 3, 2014
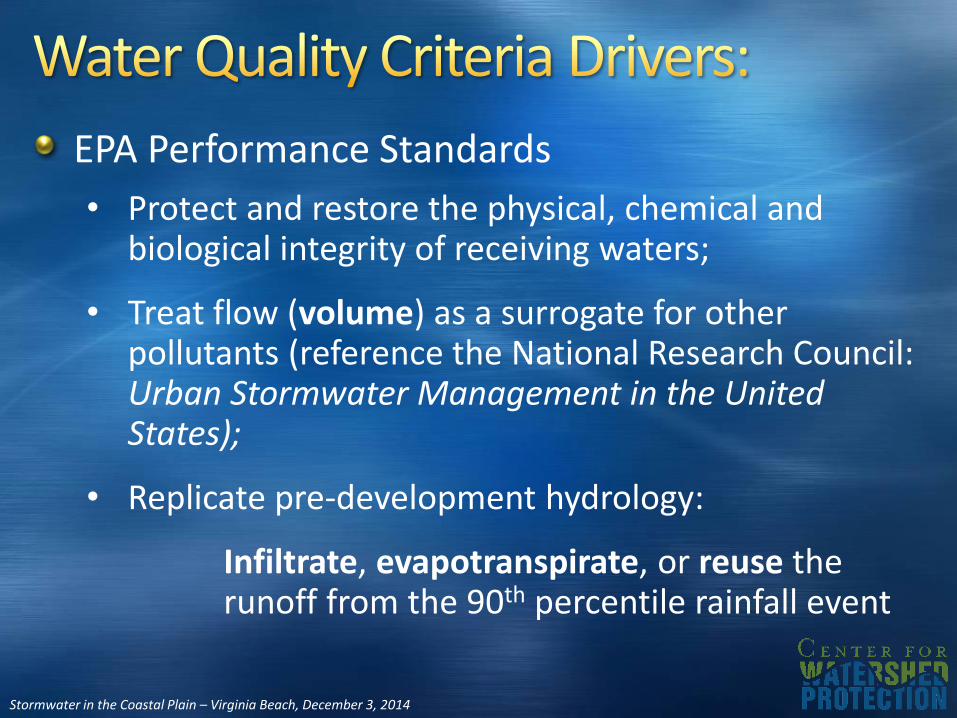
EPA Performance Standards
• Protect and restore the physical, chemical and biological integrity of receiving waters;
• Treat flow (volume) as a surrogate for other pollutants (reference the National Research Council: Urban Stormwater Management in the United States);
• Replicate pre-development hydrology:
Infiltrate, evapotranspirate, or reuse the runoff from the 90th percentile rainfall event
Stormwater in the Coastal Plain – Virginia Beach, December 3, 2014
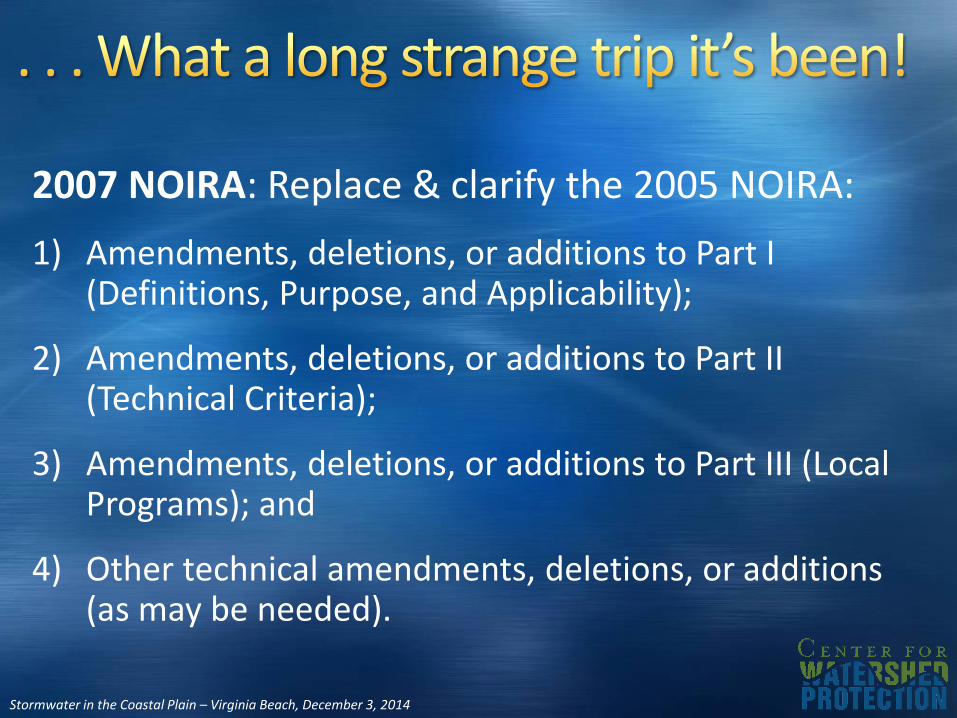
2007 NOIRA: Replace & clarify the 2005 NOIRA:
1) Amendments, deletions, or additions to Part I (Definitions, Purpose, and Applicability);
2) Amendments, deletions, or additions to Part II (Technical Criteria);
3) Amendments, deletions, or additions to Part III (Local Programs); and
4) Other technical amendments, deletions, or additions (as may be needed).
Stormwater in the Coastal Plain – Virginia Beach, December 3, 2014
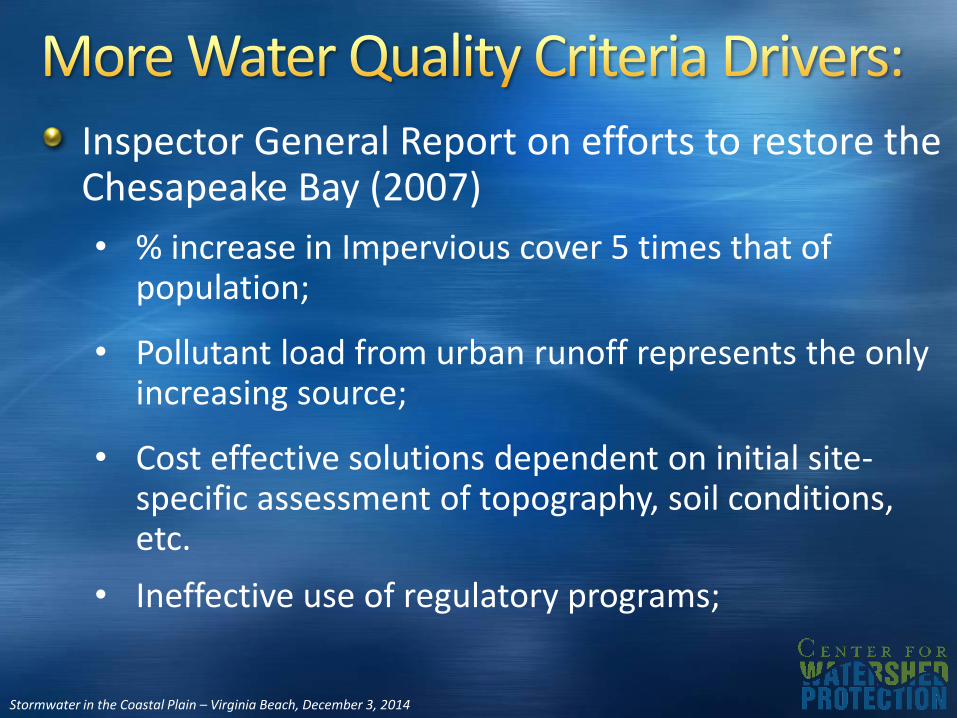
Inspector General Report on efforts to restore the Chesapeake Bay (2007)
• % increase in Impervious cover 5 times that of population;
• Pollutant load from urban runoff represents the only increasing source;
• Cost effective solutions dependent on initial site-specific assessment of topography, soil conditions, etc.
• Ineffective use of regulatory programs;
Stormwater in the Coastal Plain – Virginia Beach, December 3, 2014
2009 NOIRA:
0.28 lb/ac/yr
Stormwater in the Coastal Plain – Virginia Beach, December 3, 2014
Stormwater in the Coastal Plain – Virginia Beach, December 3, 2014
Stormwater in the Coastal Plain – Virginia Beach, December 3, 2014
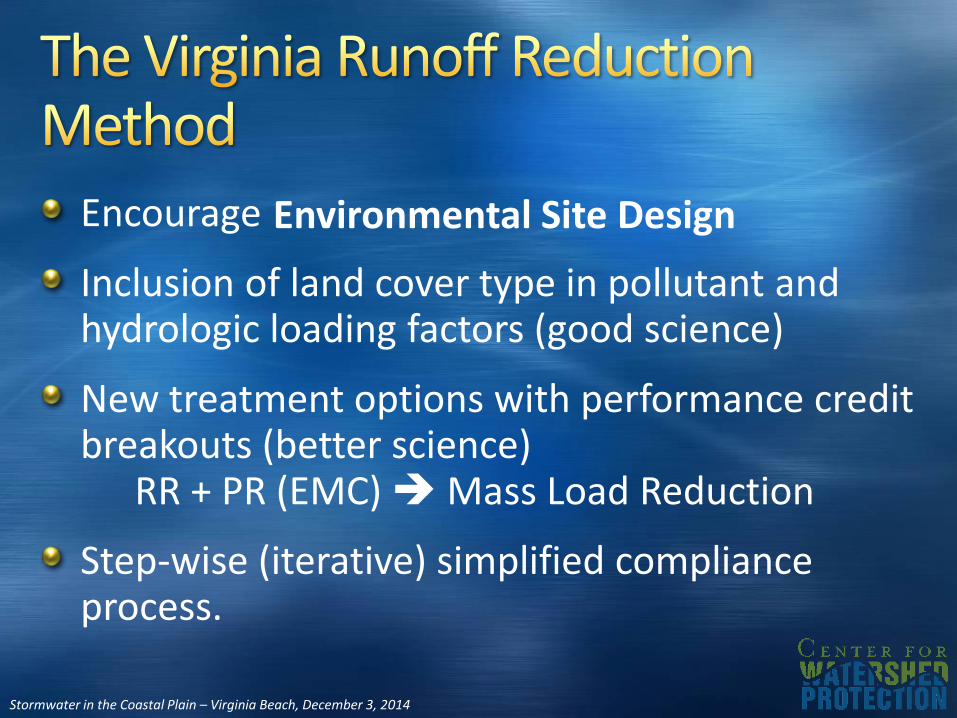
Encourage Low Impact Development
Inclusion of land cover type in pollutant and hydrologic loading factors (good science)
New treatment options with performance credit breakouts (better science)
RR + PR (EMC) Mass Load Reduction
Step-wise (iterative) simplified compliance process.
Environmental Site Design
Stormwater in the Coastal Plain – Virginia Beach, December 3, 2014
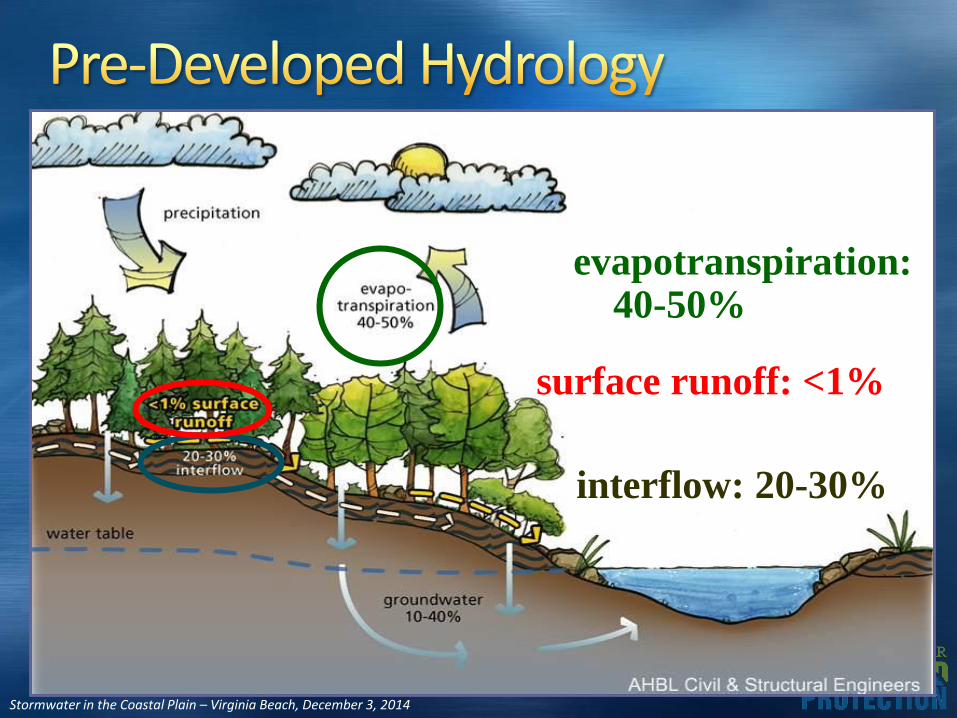
evapotranspiration:40-50%
interflow: 20-30%
surface runoff: <1%
Stormwater in the Coastal Plain – Virginia Beach, December 3, 2014
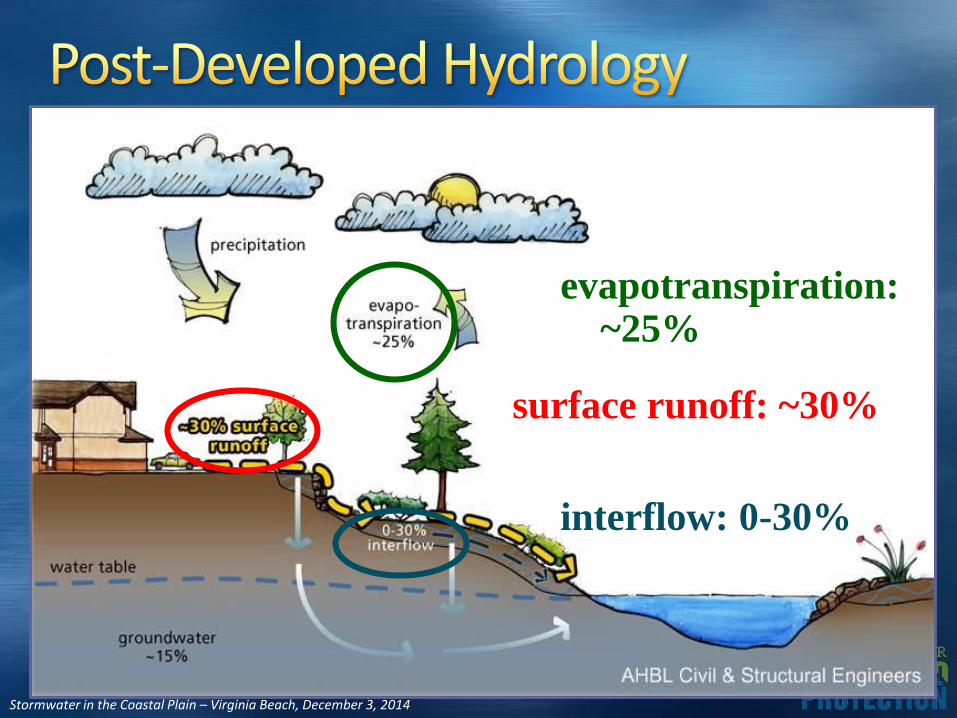
evapotranspiration:~25%
interflow: 0-30%
surface runoff: ~30%
Stormwater in the Coastal Plain – Virginia Beach, December 3, 2014
Research shows:
Extended Filtration mimics the hydrologic characteristics (meaning stormflow reaching a stream) of an undeveloped watershed.
Data also indicates that extended filtration releases water over a much longer period of time than an undeveloped (agricultural) watershed; and likely a comparable period of time as a forested watershed.
Hunt et al., NCSU 2010
Stormwater in the Coastal Plain – Virginia Beach, December 3, 2014
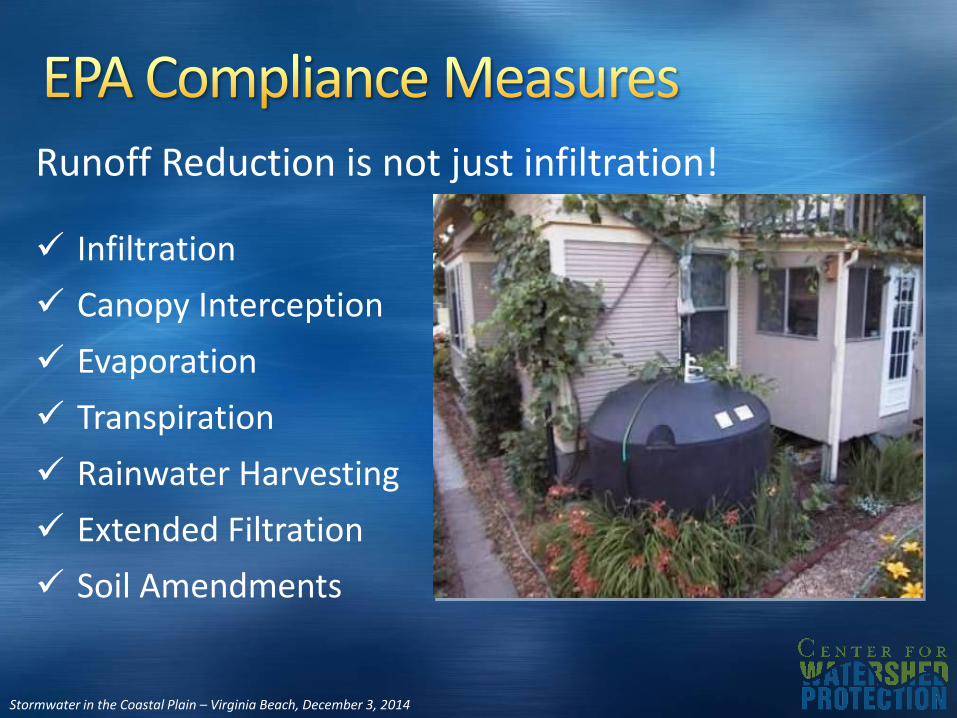
Runoff Reduction is not just infiltration!
Infiltration
Canopy Interception
Evaporation
Transpiration
Rainwater Harvesting
Extended Filtration
Soil Amendments

Stormwater in the Coastal Plain – Virginia Beach, December 3, 2014
Stormwater in the Coastal Plain – Virginia Beach, December 3, 2014
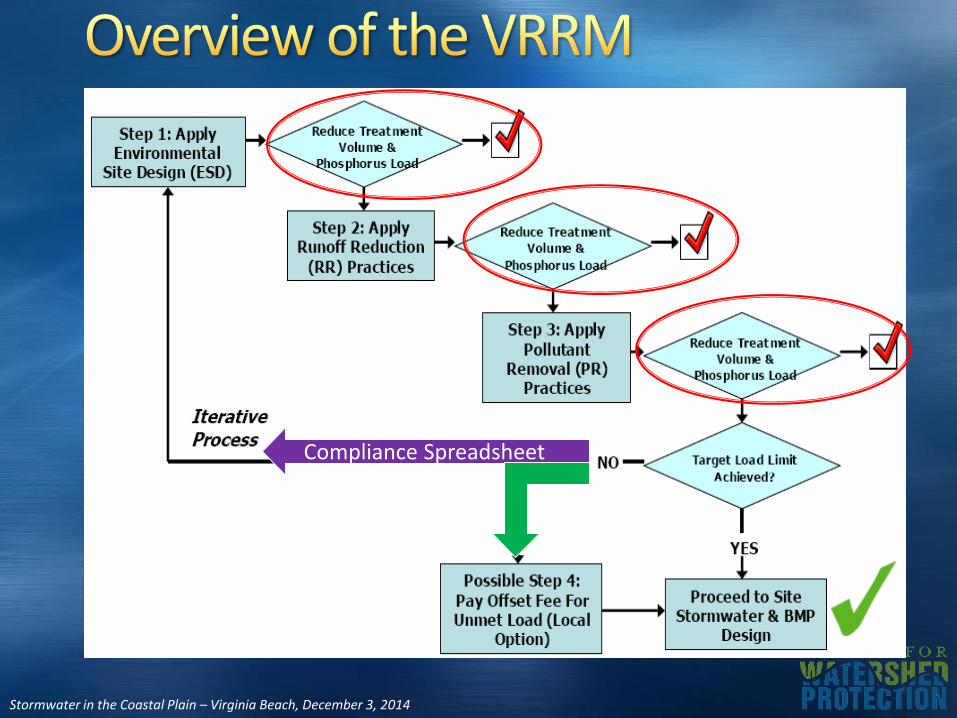
Compliance Spreadsheet
Stormwater in the Coastal Plain – Virginia Beach, December 3, 2014
Codifies & incentivizes minimization and avoidance
Goes beyond impervious cover as a water quality indicator
Utilizes latest BMP research for Total Performance (Total Mass Load Removal)
Credits total BMP performance
Stormwater in the Coastal Plain – Virginia Beach, December 3, 2014
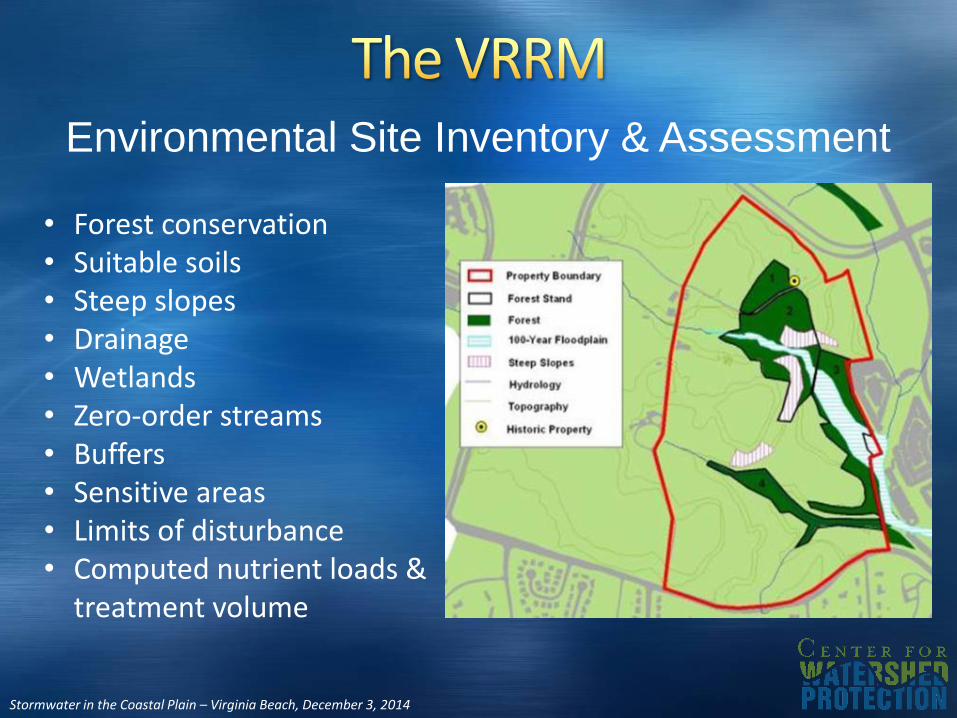
Environmental Site Inventory & Assessment
• Forest conservation• Suitable soils• Steep slopes• Drainage• Wetlands• Zero-order streams• Buffers• Sensitive areas • Limits of disturbance• Computed nutrient loads &
treatment volume
Stormwater in the Coastal Plain – Virginia Beach, December 3, 2014
Stormwater in the Coastal Plain – Virginia Beach, December 3, 2014
Stormwater in the Coastal Plain – Virginia Beach, December 3, 2014
Stormwater in the Coastal Plain – Virginia Beach, December 3, 2014
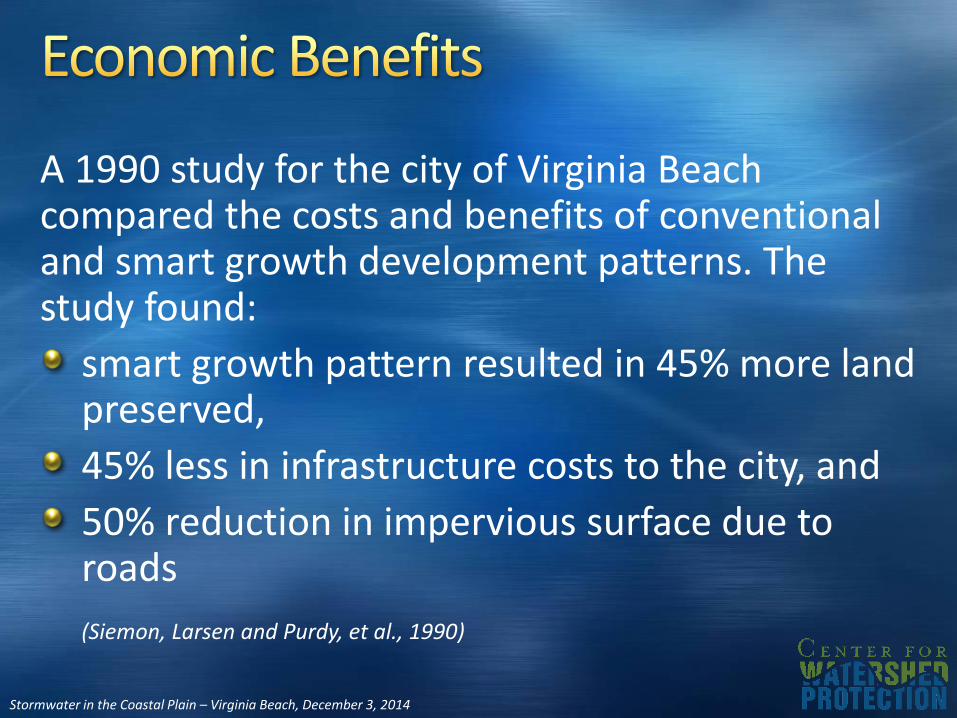
A 1990 study for the city of Virginia Beach compared the costs and benefits of conventional and smart growth development patterns. The study found:
smart growth pattern resulted in 45% more land preserved,
45% less in infrastructure costs to the city, and
50% reduction in impervious surface due to roads
(Siemon, Larsen and Purdy, et al., 1990)
Stormwater in the Coastal Plain – Virginia Beach, December 3, 2014
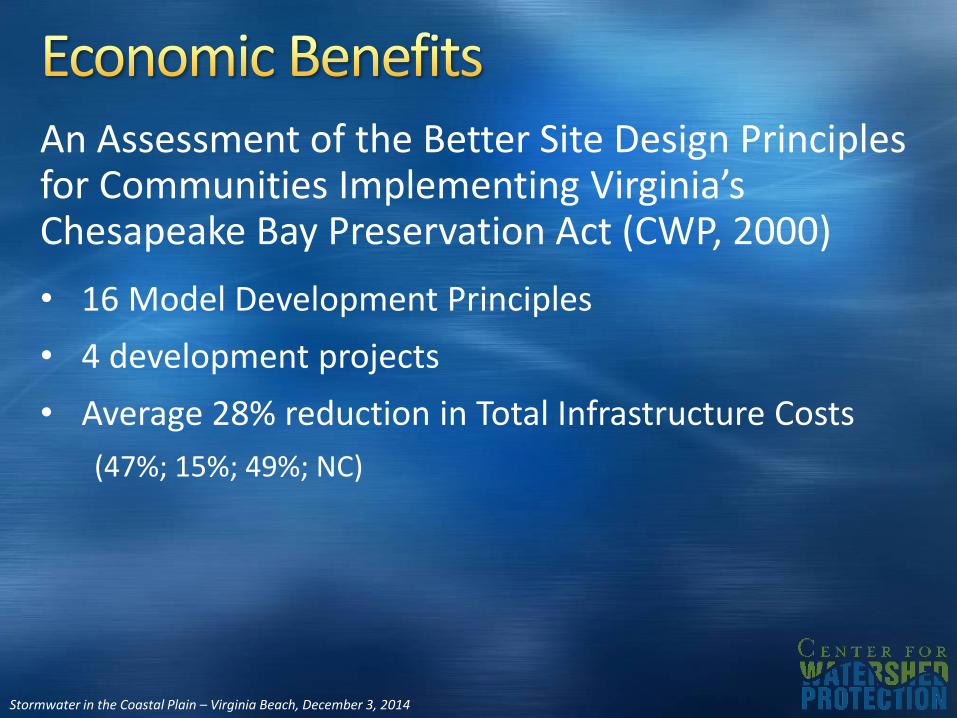
An Assessment of the Better Site Design Principles for Communities Implementing Virginia’s Chesapeake Bay Preservation Act (CWP, 2000)
• 16 Model Development Principles
• 4 development projects
• Average 28% reduction in Total Infrastructure Costs
(47%; 15%; 49%; NC)
Stormwater in the Coastal Plain – Virginia Beach, December 3, 2014
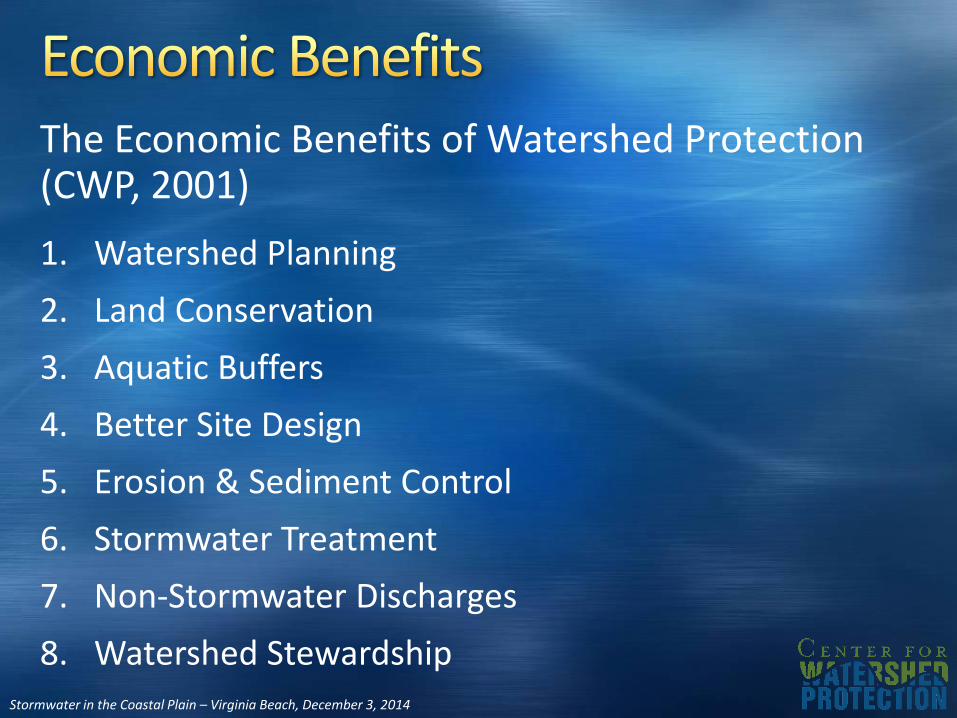
The Economic Benefits of Watershed Protection (CWP, 2001)
1. Watershed Planning
2. Land Conservation
3. Aquatic Buffers
4. Better Site Design
5. Erosion & Sediment Control
6. Stormwater Treatment
7. Non-Stormwater Discharges
8. Watershed Stewardship

Stormwater in the Coastal Plain – Virginia Beach, December 3, 2014
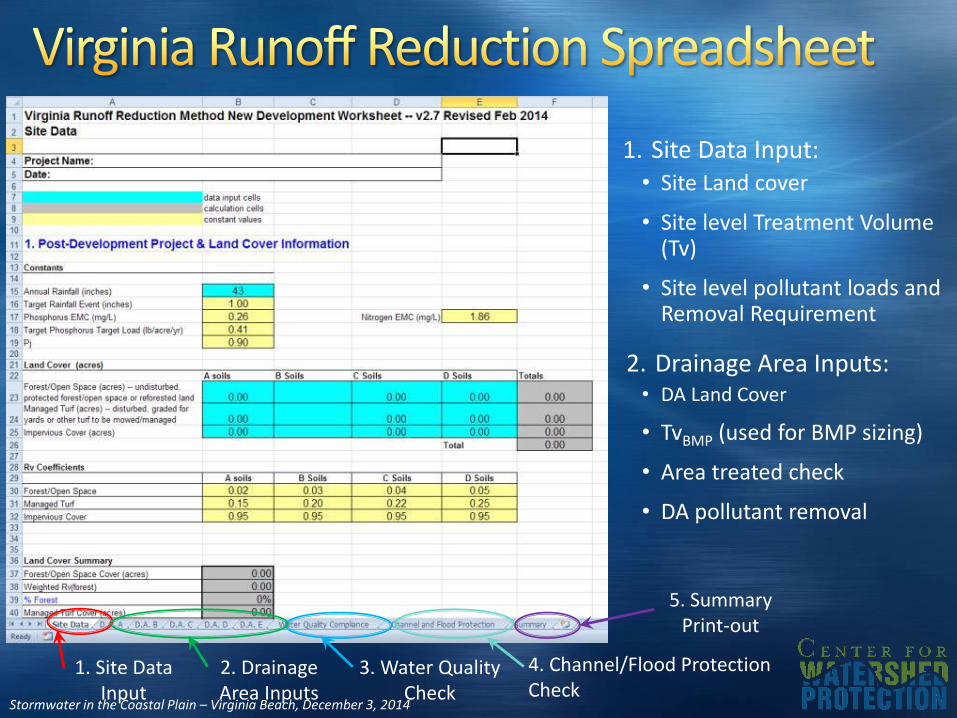
1. Site Data Input:• Site Land cover
• Site level Treatment Volume (Tv)
• Site level pollutant loads and Removal Requirement
2. Drainage Area Inputs:• DA Land Cover
• TvBMP (used for BMP sizing)
• Area treated check
• DA pollutant removal
1. Site Data Input
2. Drainage Area Inputs
4. Channel/Flood Protection Check
3. Water Quality Check
5. Summary Print-out
Stormwater in the Coastal Plain – Virginia Beach, December 3, 2014
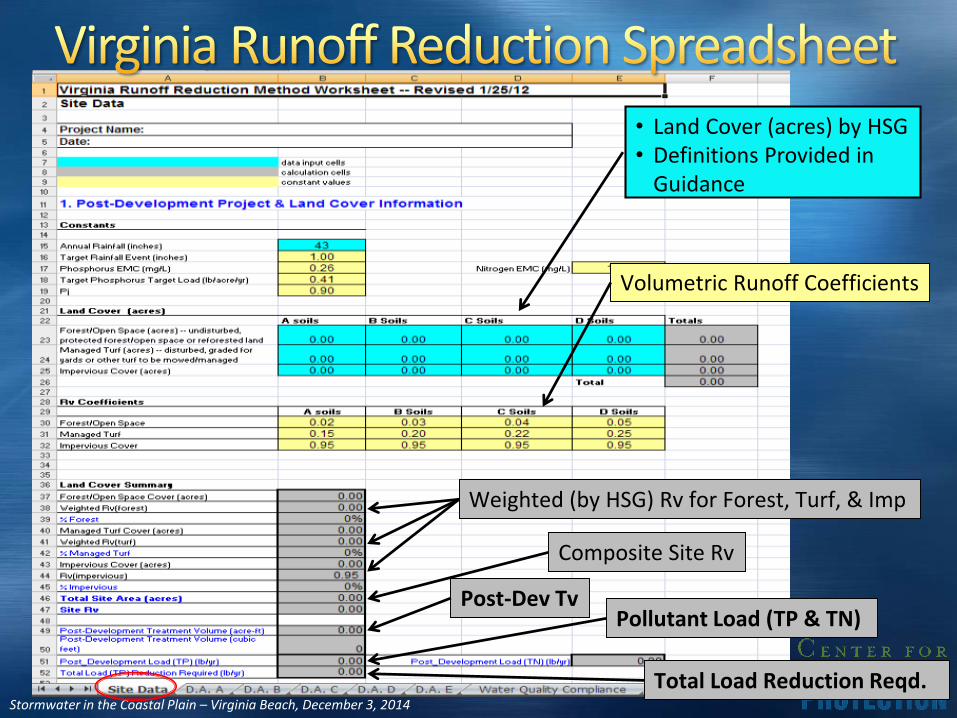
Volumetric Runoff Coefficients
• Land Cover (acres) by HSG• Definitions Provided in
Guidance
Composite Site Rv
Post-Dev TvPollutant Load (TP & TN)
Total Load Reduction Reqd.
Weighted (by HSG) Rv for Forest, Turf, & Imp
Stormwater in the Coastal Plain – Virginia Beach, December 3, 2014
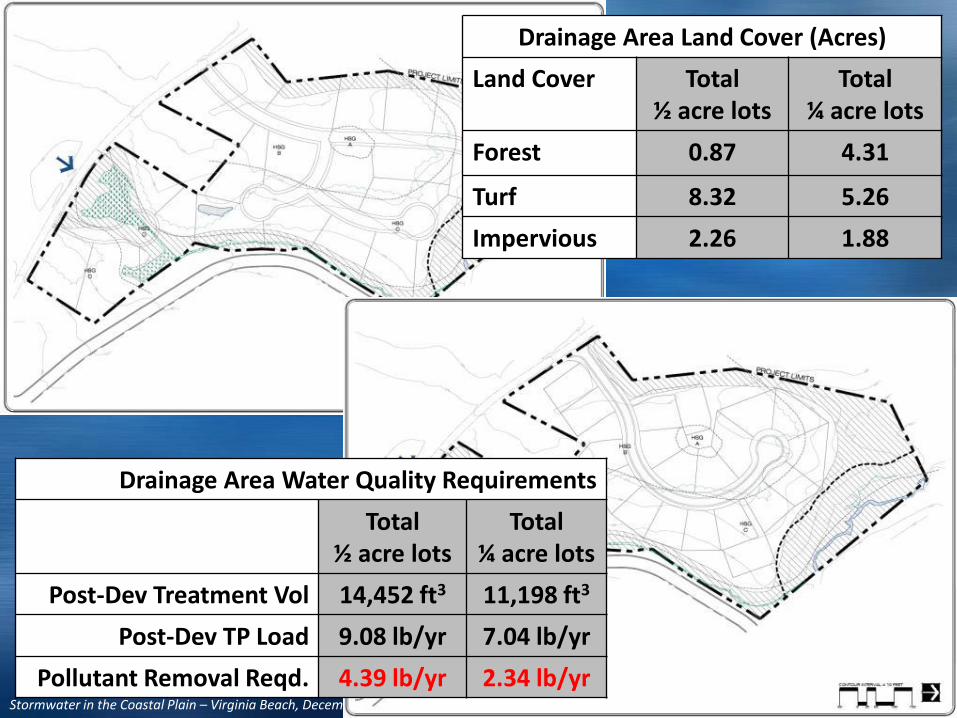
15 Acres25 ½ acre lots
Drainage Area Land Cover (Acres)
Land Cover Total½ acre lots
Total ¼ acre lots
Forest 0.87 4.31
Turf 8.32 5.26
Impervious 2.26 1.88
15 Acres25 ¼ acre lots
Drainage Area Water Quality Requirements
Total ½ acre lots
Total ¼ acre lots
Post-Dev Treatment Vol 14,452 ft3 11,198 ft3
Post-Dev TP Load 9.08 lb/yr 7.04 lb/yr
Pollutant Removal Reqd. 4.39 lb/yr 2.34 lb/yr
Stormwater in the Coastal Plain – Virginia Beach, December 3, 2014
Stormwater in the Coastal Plain – Virginia Beach, December 3, 2014
Stormwater in the Coastal Plain – Virginia Beach, December 3, 2014
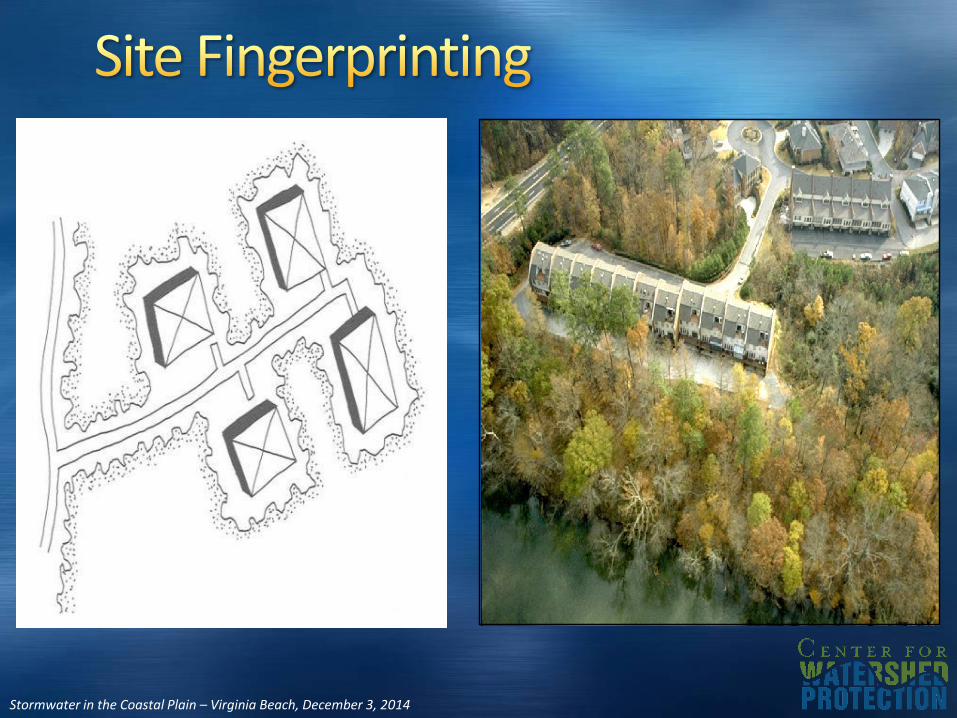
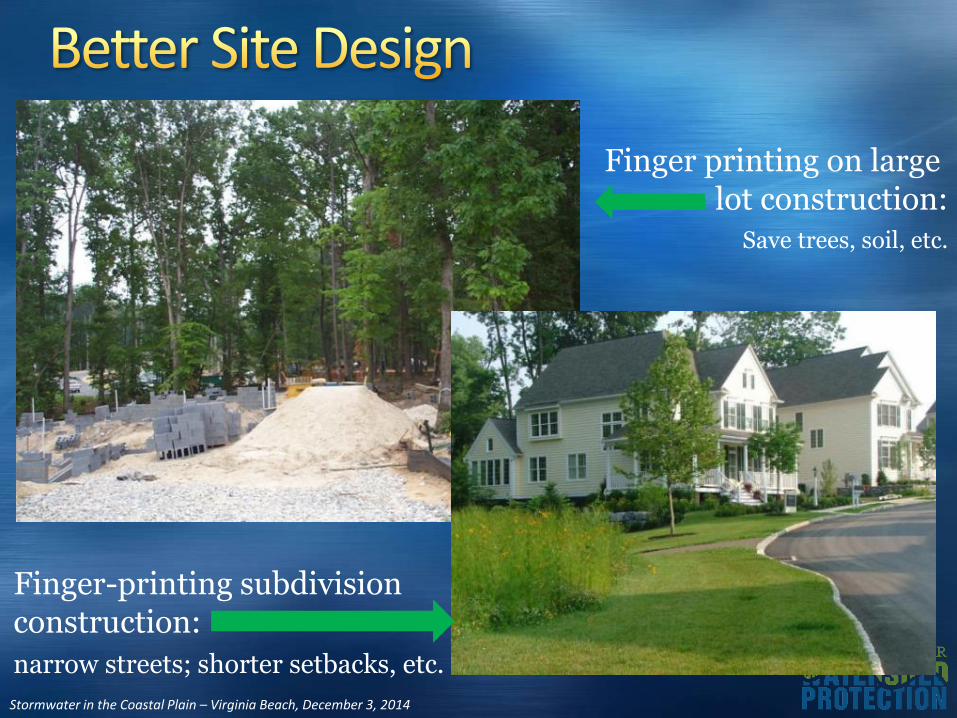
Finger printing on large lot construction:
Save trees, soil, etc.
Finger-printing subdivisionconstruction:
narrow streets; shorter setbacks, etc.
Stormwater in the Coastal Plain – Virginia Beach, December 3, 2014
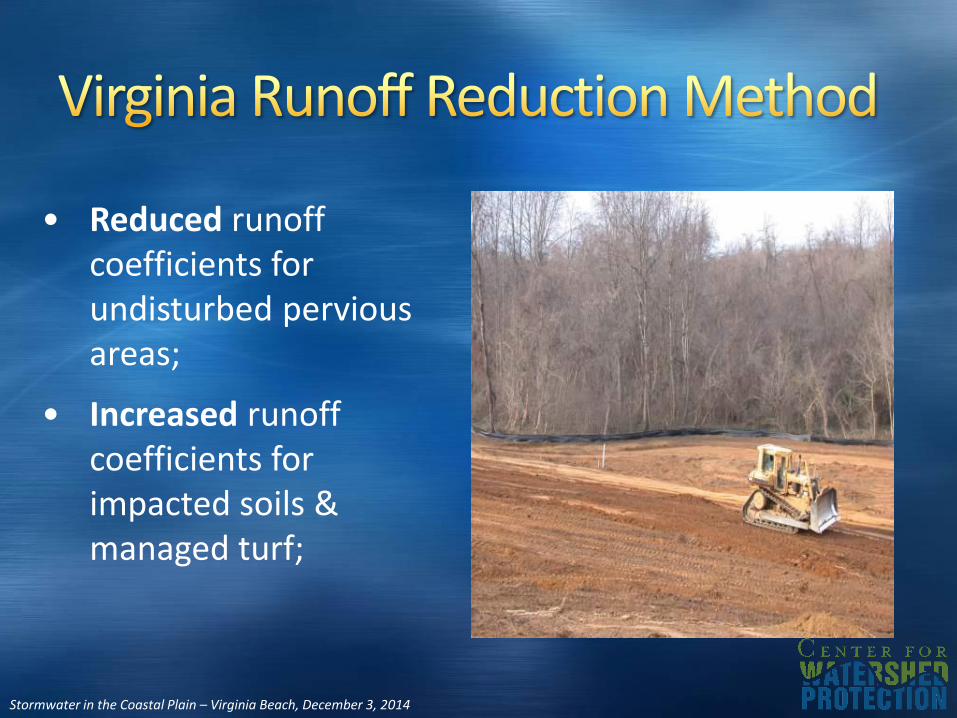
• Reduced runoff coefficients for undisturbed pervious areas;
• Increased runoff coefficients for impacted soils & managed turf;
Stormwater in the Coastal Plain – Virginia Beach, December 3, 2014
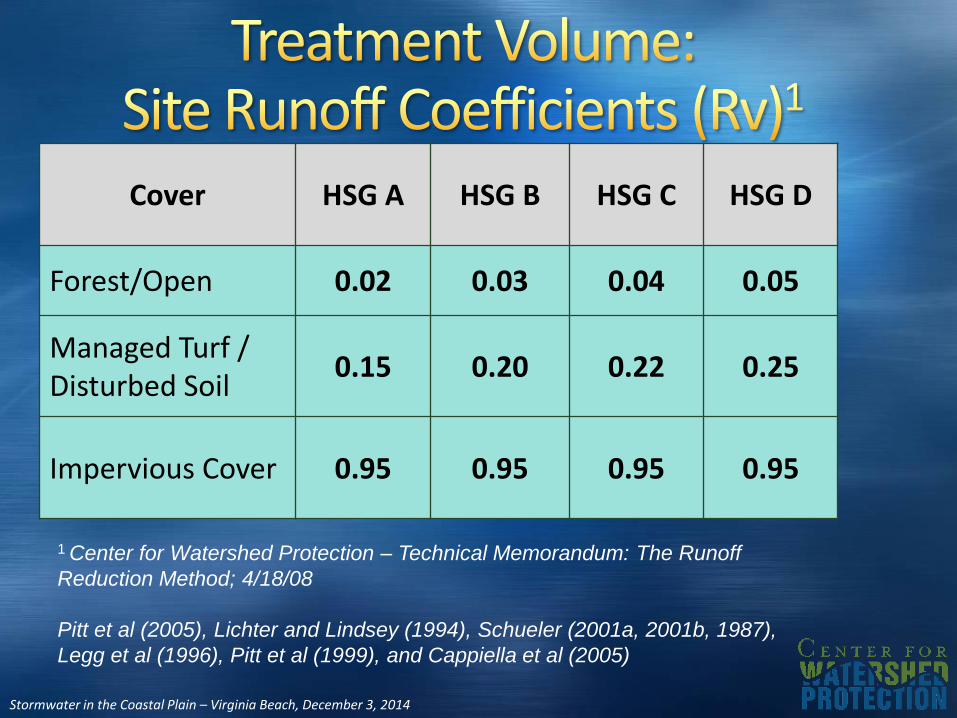
Cover HSG A HSG B HSG C HSG D
Forest/Open 0.02 0.03 0.04 0.05
Managed Turf / Disturbed Soil
0.15 0.20 0.22 0.25
Impervious Cover 0.95 0.95 0.95 0.95
1 Center for Watershed Protection – Technical Memorandum: The Runoff
Reduction Method; 4/18/08
Pitt et al (2005), Lichter and Lindsey (1994), Schueler (2001a, 2001b, 1987),
Legg et al (1996), Pitt et al (1999), and Cappiella et al (2005)
Stormwater in the Coastal Plain – Virginia Beach, December 3, 2014
Codifies & incentivizes minimization and avoidance
Goes beyond impervious cover as a water quality indicator
Utilizes latest BMP research for Total Performance (Total Mass Load Removal)
Credits total BMP performance
Stormwater in the Coastal Plain – Virginia Beach, December 3, 2014
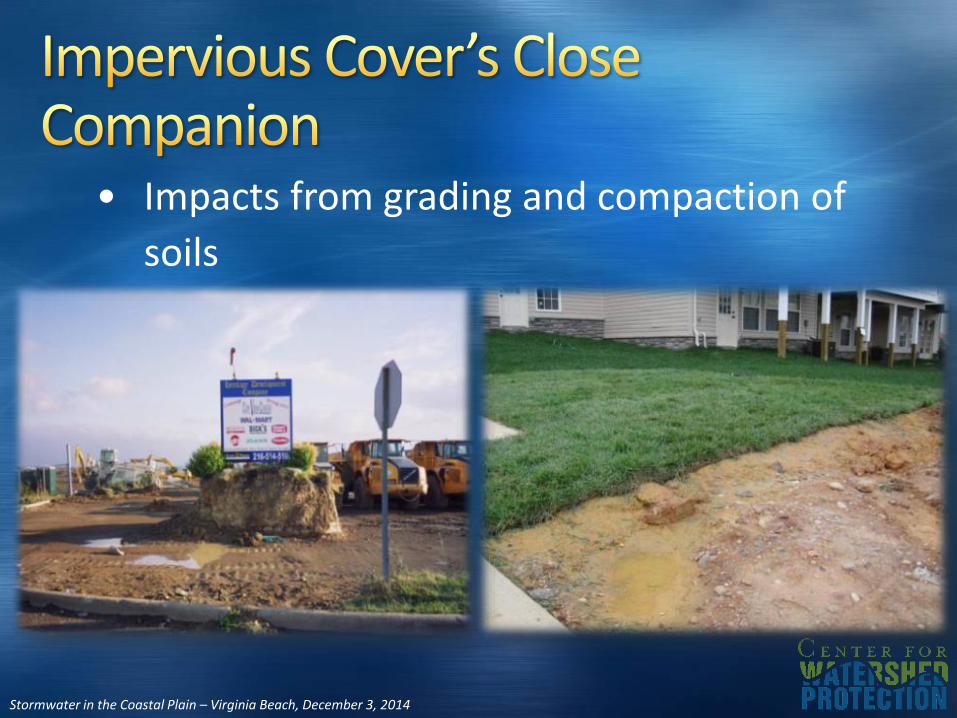
• Impacts from grading and compaction of
soils
Stormwater in the Coastal Plain – Virginia Beach, December 3, 2014
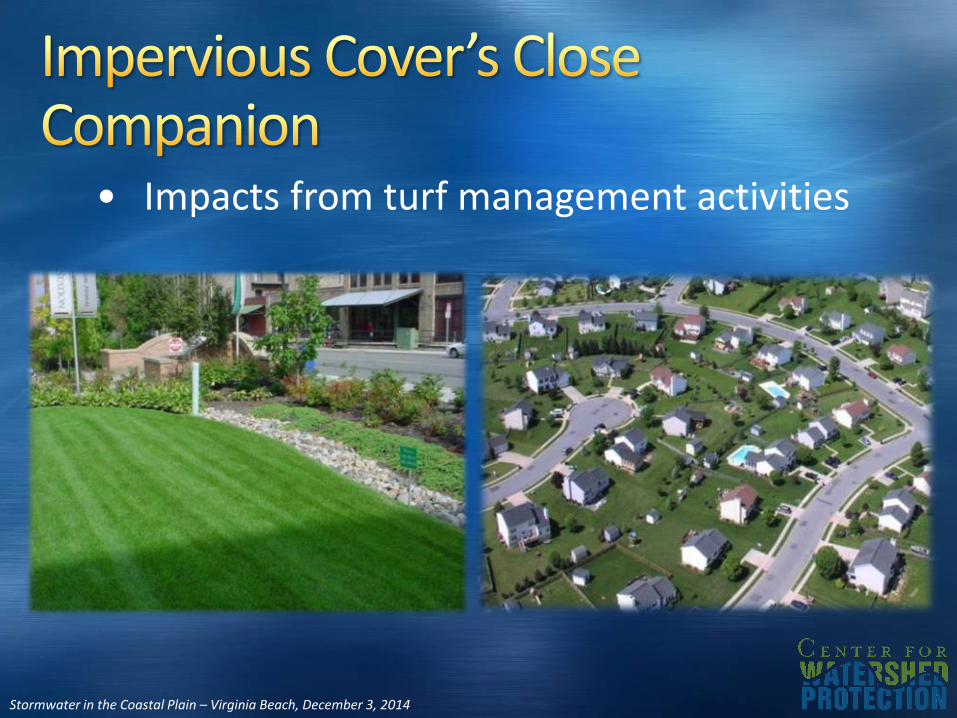
• Impacts from turf management activities
Stormwater in the Coastal Plain – Virginia Beach, December 3, 2014
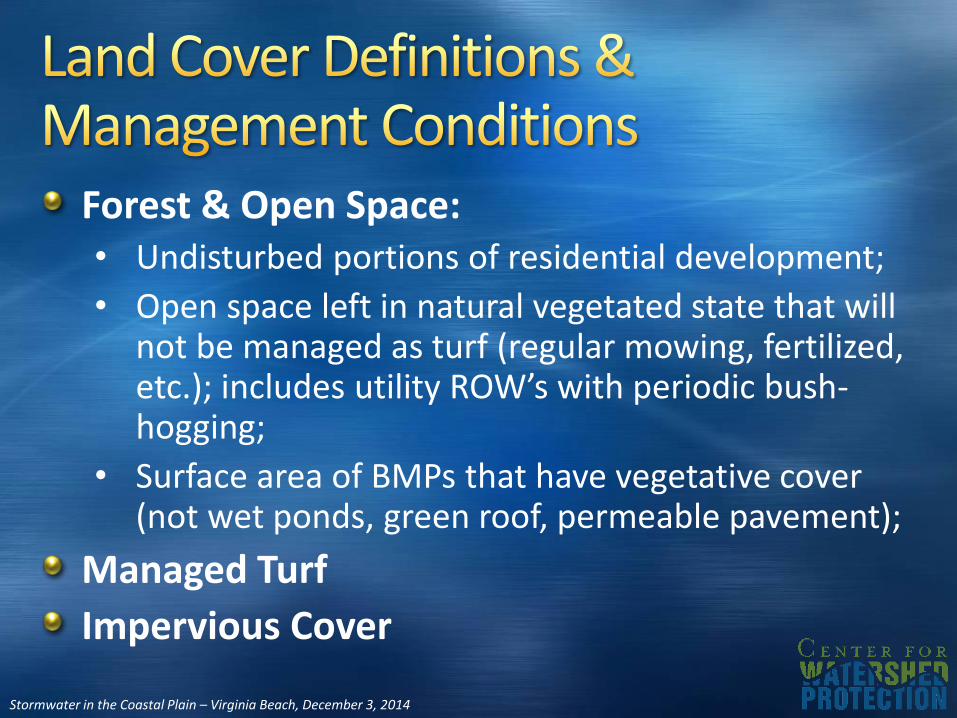
Forest & Open Space:• Undisturbed portions of residential development;
• Open space left in natural vegetated state that will not be managed as turf (regular mowing, fertilized, etc.); includes utility ROW’s with periodic bush-hogging;
• Surface area of BMPs that have vegetative cover (not wet ponds, green roof, permeable pavement);
Managed Turf
Impervious Cover
Stormwater in the Coastal Plain – Virginia Beach, December 3, 2014
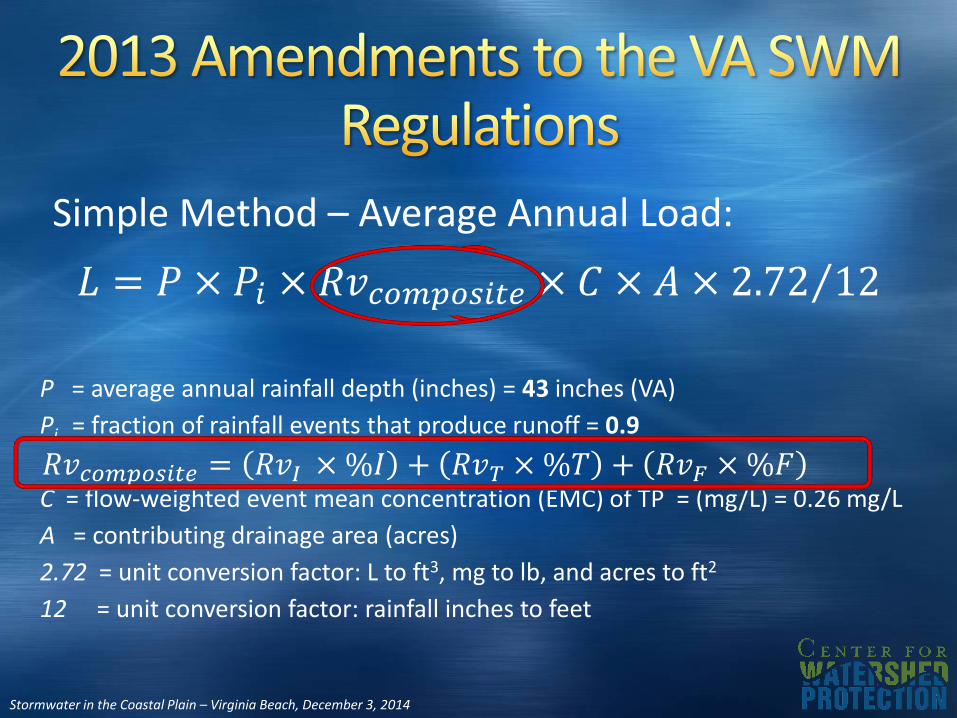
Simple Method – Average Annual Load:
𝐿𝑜𝑎𝑑 = 𝑃 × 𝑃𝑗 × 𝑅𝑣 × 𝐶 × 𝐴 × 2.72/12
P = average annual rainfall depth (inches) = 43 inches (VA)
Pj = fraction of rainfall events that produce runoff = 0.9
Rv = volumetric runoff coefficient = 0.05 + (0.009 × I); I = impervious cover
C = flow-weighted event mean concentration (EMC) of TP = (mg/L) = 0.26 mg/L
A = contributing drainage area (acres)
2.72 = unit conversion factor: L to ft3, mg to lb, and acres to ft2
12 = unit conversion factor: rainfall inches to feet
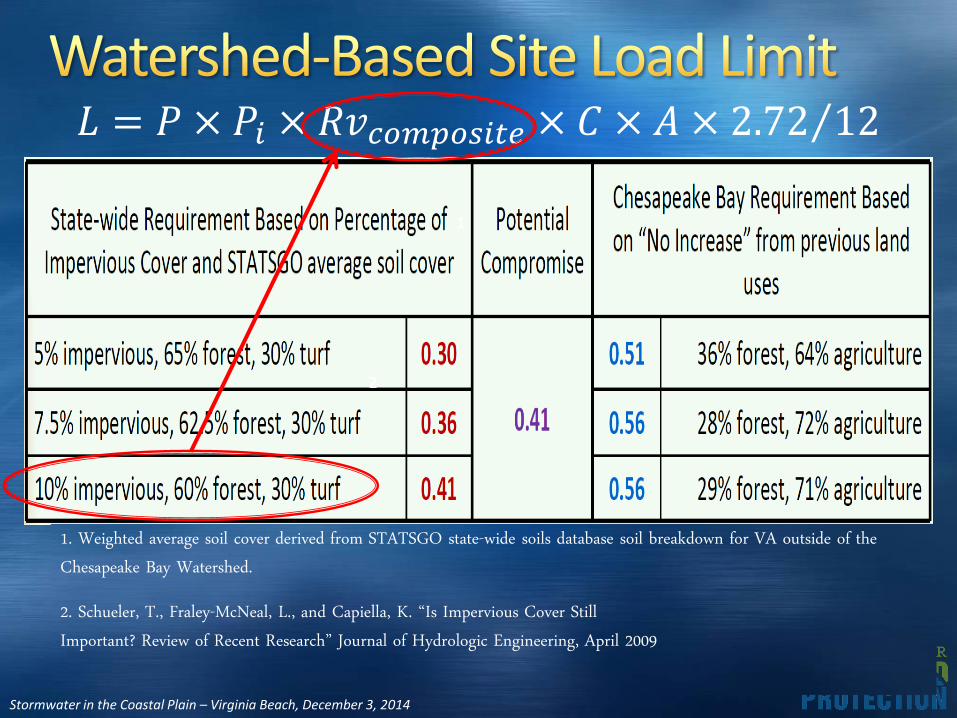
𝐿 = 𝑃 × 𝑃𝑖 × 𝑅𝑣𝑐𝑜𝑚𝑝𝑜𝑠𝑖𝑡𝑒 × 𝐶 × 𝐴 × 2.72 12
𝑅𝑣𝑐𝑜𝑚𝑝𝑜𝑠𝑖𝑡𝑒 = 𝑅𝑣𝐼 ×%𝐼 + 𝑅𝑣𝑇 ×%𝑇 + 𝑅𝑣𝐹 ×%𝐹
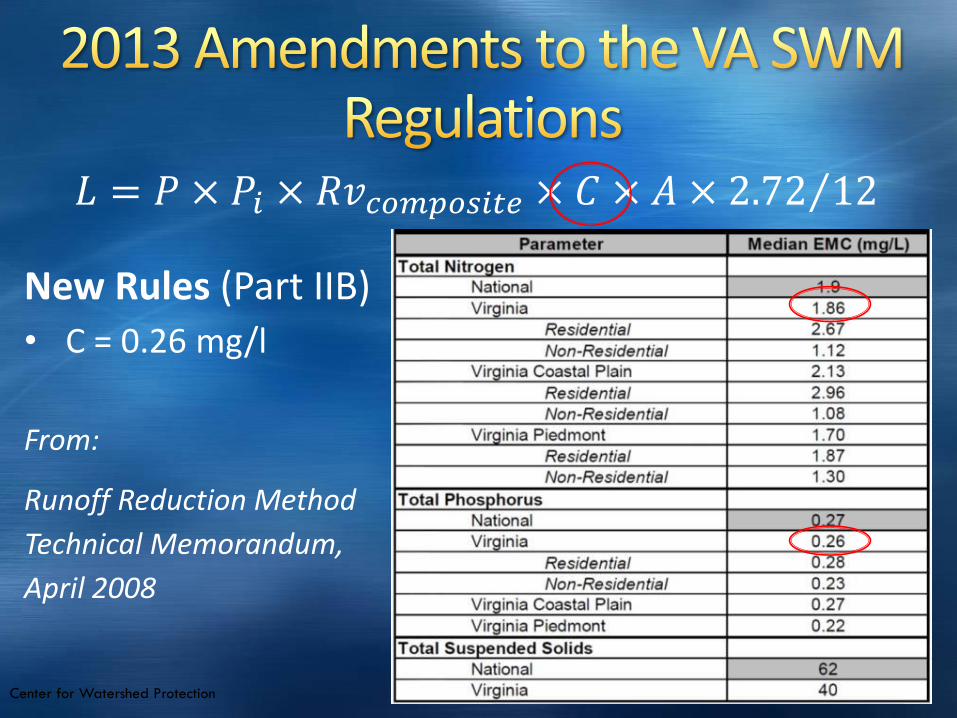
New Rules (Part IIB)
• C = 0.26 mg/l
From:
Runoff Reduction Method
Technical Memorandum,
April 2008
𝐿 = 𝑃 × 𝑃𝑖 × 𝑅𝑣𝑐𝑜𝑚𝑝𝑜𝑠𝑖𝑡𝑒 × 𝐶 × 𝐴 × 2.72 12
Center for Watershed Protection
Stormwater in the Coastal Plain – Virginia Beach, December 3, 2014
Stormwater in the Coastal Plain – Virginia Beach, December 3, 2014
1. Weighted average soil cover derived from STATSGO state-wide soils database soil breakdown for VA outside of the Chesapeake Bay Watershed.
2. Schueler, T., Fraley-McNeal, L., and Capiella, K. “Is Impervious Cover Still Important? Review of Recent Research” Journal of Hydrologic Engineering, April 2009
1
2
𝐿 = 𝑃 × 𝑃𝑖 × 𝑅𝑣𝑐𝑜𝑚𝑝𝑜𝑠𝑖𝑡𝑒 × 𝐶 × 𝐴 × 2.72 12
Stormwater in the Coastal Plain – Virginia Beach, December 3, 2014
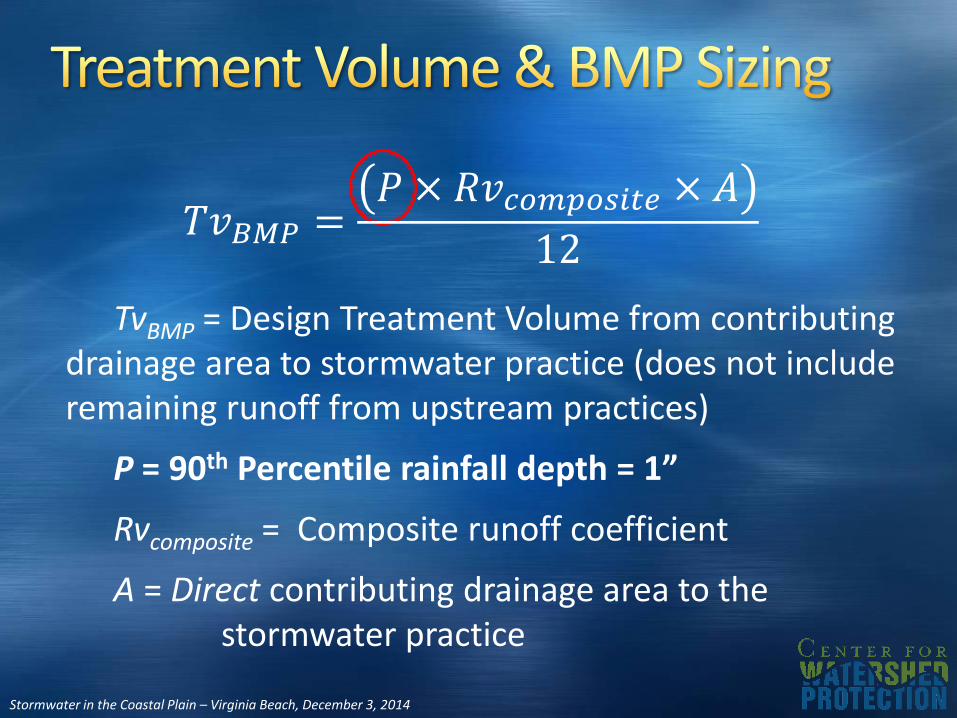
TvBMP = Design Treatment Volume from contributing drainage area to stormwater practice (does not include remaining runoff from upstream practices)
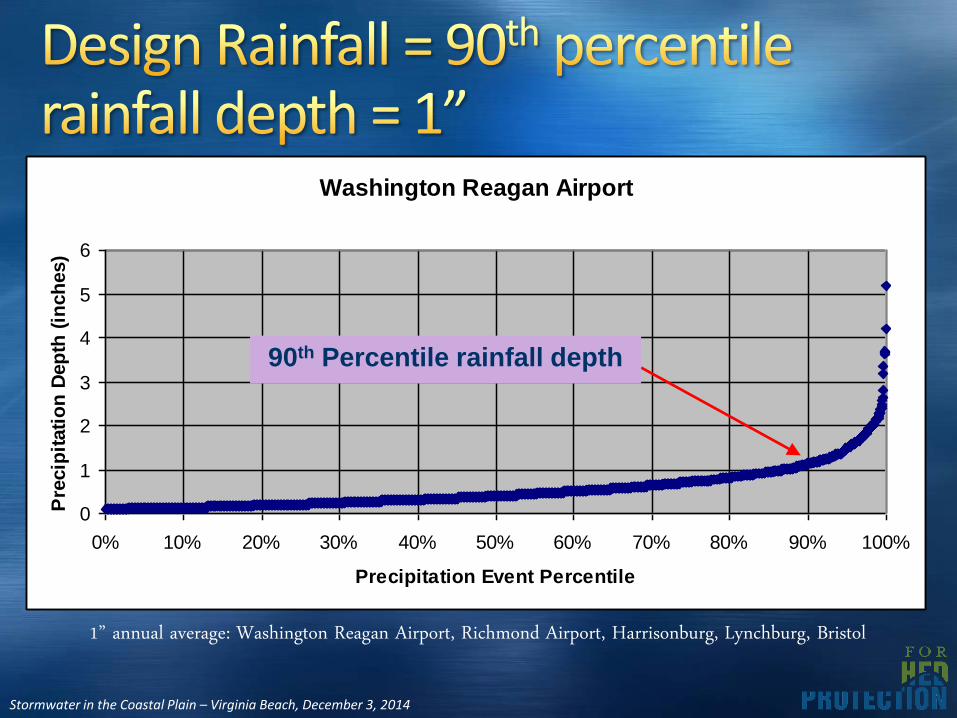
P = 90th Percentile rainfall depth = 1”
Rvcomposite = Composite runoff coefficient
A = Direct contributing drainage area to the stormwater practice
𝑇𝑣𝐵𝑀𝑃 =𝑃 × 𝑅𝑣𝑐𝑜𝑚𝑝𝑜𝑠𝑖𝑡𝑒 × 𝐴
12
Stormwater in the Coastal Plain – Virginia Beach, December 3, 2014
Washington Reagan Airport
0
1
2
3
4
5
6
0% 10% 20% 30% 40% 50% 60% 70% 80% 90% 100%
Precipitation Event Percentile
Pre
cip
itati
on
Dep
th (
inch
es)
90th Percentile rainfall depth
1” annual average: Washington Reagan Airport, Richmond Airport, Harrisonburg, Lynchburg, Bristol
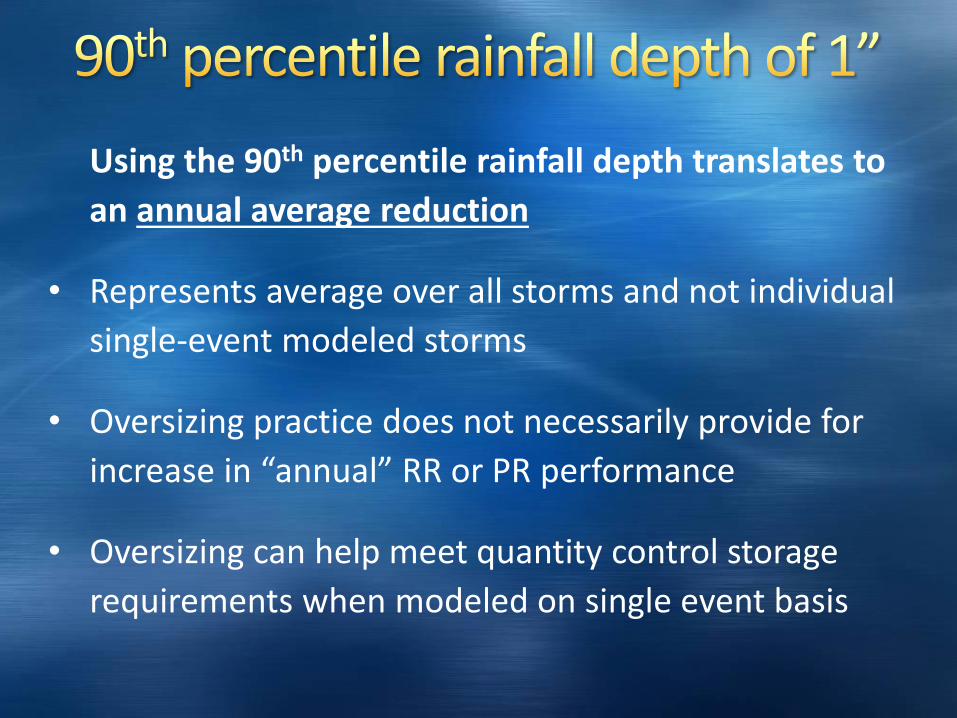
Using the 90th percentile rainfall depth translates to
an annual average reduction
• Represents average over all storms and not individual
single-event modeled storms
• Oversizing practice does not necessarily provide for
increase in “annual” RR or PR performance
• Oversizing can help meet quantity control storage
requirements when modeled on single event basis
Stormwater in the Coastal Plain – Virginia Beach, December 3, 2014
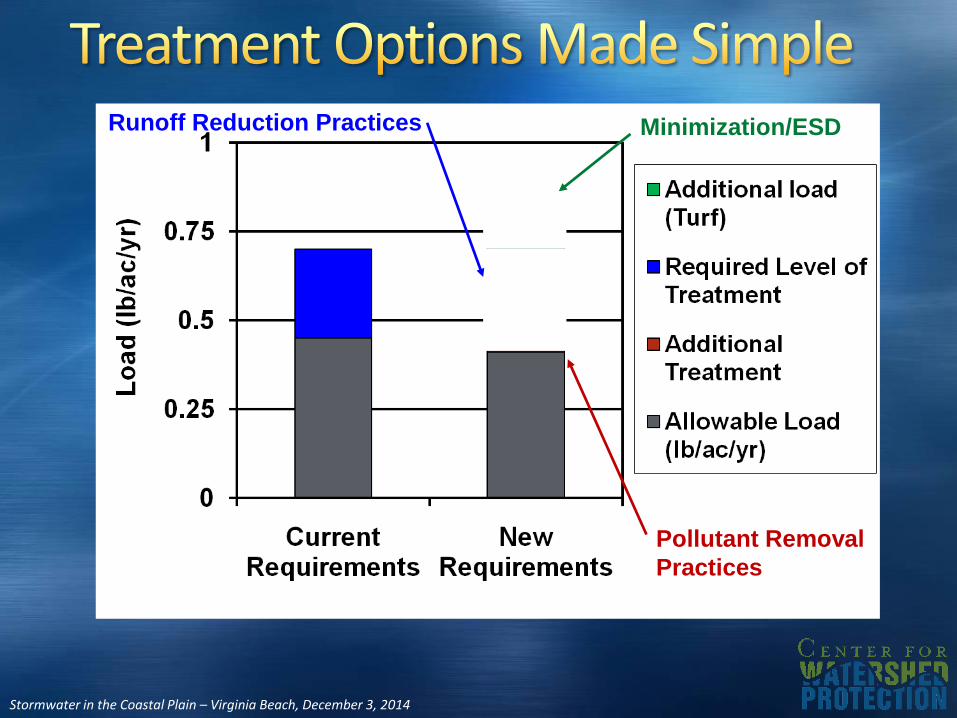
0
0.25
0.5
0.75
1L
oa
d (
lb/a
c/y
r)
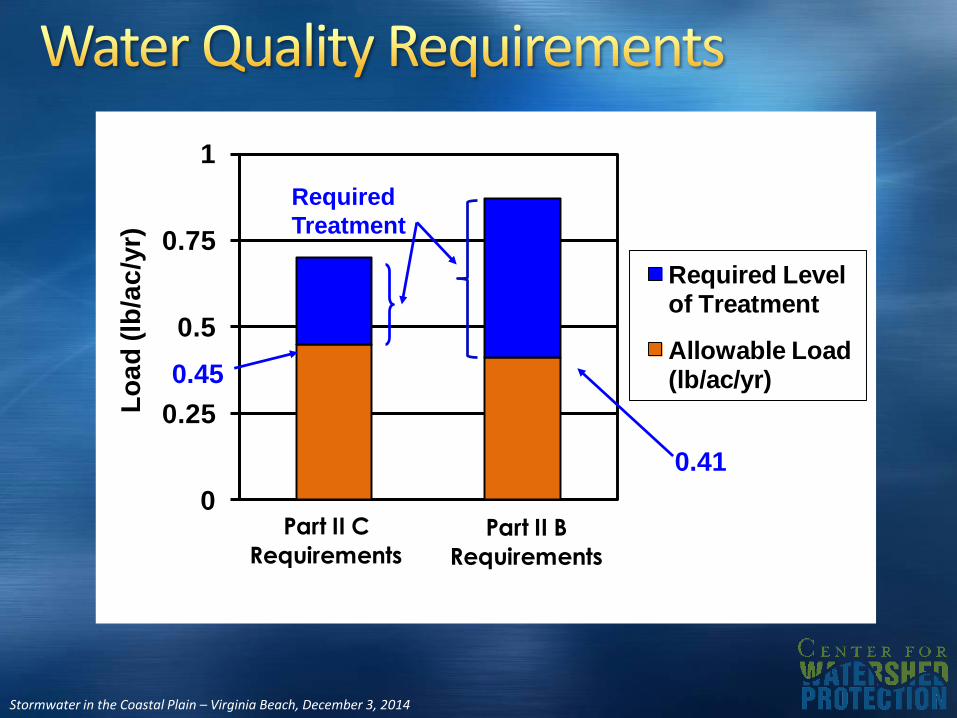
Required Level of Treatment
Allowable Load (lb/ac/yr)
Part II C
RequirementsPart II B
Requirements
Required
Treatment
0.45
0.41
Stormwater in the Coastal Plain – Virginia Beach, December 3, 2014
Pollutant Removal
Practices
Minimization/ESDRunoff Reduction Practices
Stormwater in the Coastal Plain – Virginia Beach, December 3, 2014
Codifies & incentivizes minimization and avoidance
Goes beyond impervious cover as a water quality indicator
Utilizes latest BMP research for Total Performance (Total Mass Load Removal)
Credits total BMP performance
Stormwater in the Coastal Plain – Virginia Beach, December 3, 2014
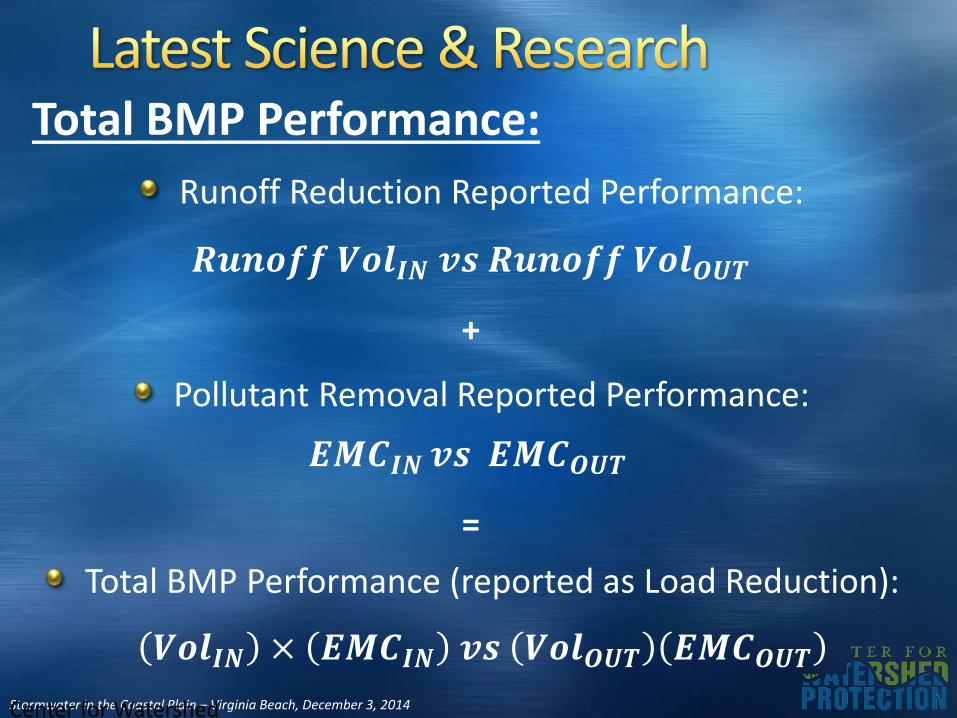
Total BMP Performance:
Runoff Reduction Reported Performance:
𝑹𝒖𝒏𝒐𝒇𝒇 𝑽𝒐𝒍𝑰𝑵 𝒗𝒔 𝑹𝒖𝒏𝒐𝒇𝒇 𝑽𝒐𝒍𝑶𝑼𝑻
+
Pollutant Removal Reported Performance:
𝑬𝑴𝑪𝑰𝑵 𝒗𝒔 𝑬𝑴𝑪𝑶𝑼𝑻
=
Total BMP Performance (reported as Load Reduction):
𝑽𝒐𝒍𝑰𝑵 × 𝑬𝑴𝑪𝑰𝑵 𝒗𝒔 𝑽𝒐𝒍𝑶𝑼𝑻 𝑬𝑴𝑪𝑶𝑼𝑻
Center for Watershed Protection
Stormwater in the Coastal Plain – Virginia Beach, December 3, 2014
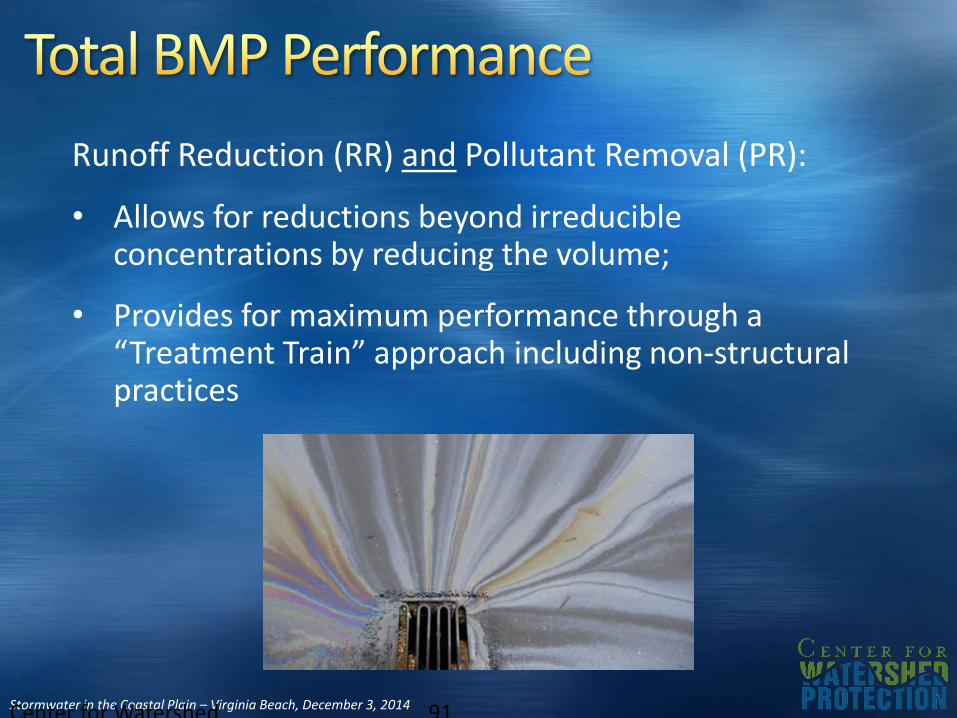
Runoff Reduction (RR) and Pollutant Removal (PR):
• Allows for reductions beyond irreducible concentrations by reducing the volume;
• Provides for maximum performance through a “Treatment Train” approach including non-structural practices
Center for Watershed 91
Stormwater in the Coastal Plain – Virginia Beach, December 3, 2014
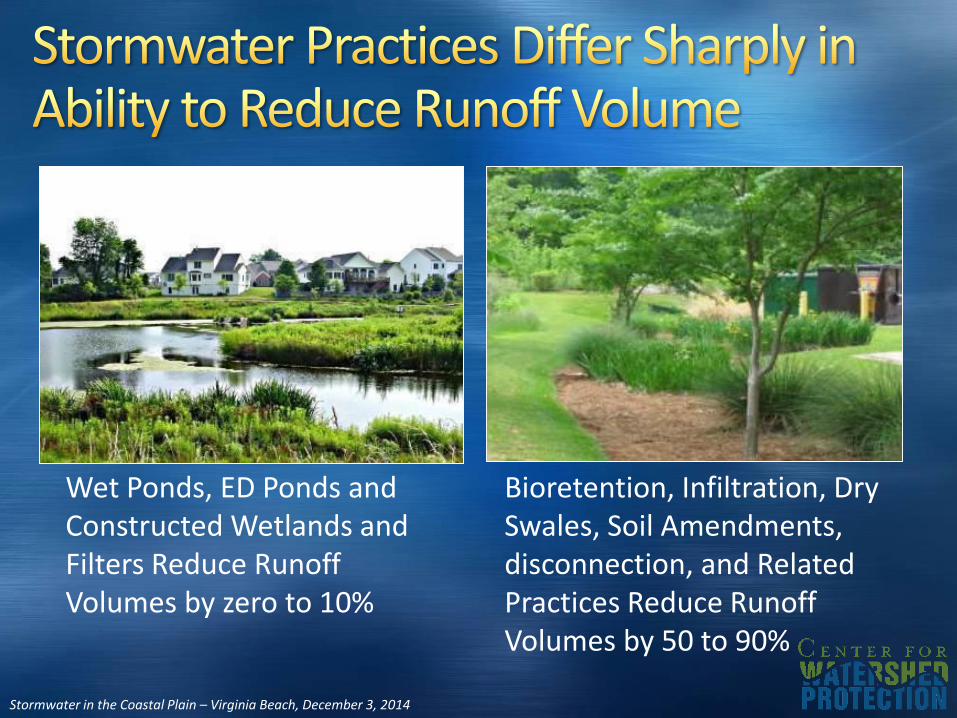
Bioretention, Infiltration, Dry Swales, Soil Amendments, disconnection, and Related Practices Reduce Runoff Volumes by 50 to 90%
Wet Ponds, ED Ponds and Constructed Wetlands and Filters Reduce Runoff Volumes by zero to 10%
Stormwater in the Coastal Plain – Virginia Beach, December 3, 2014
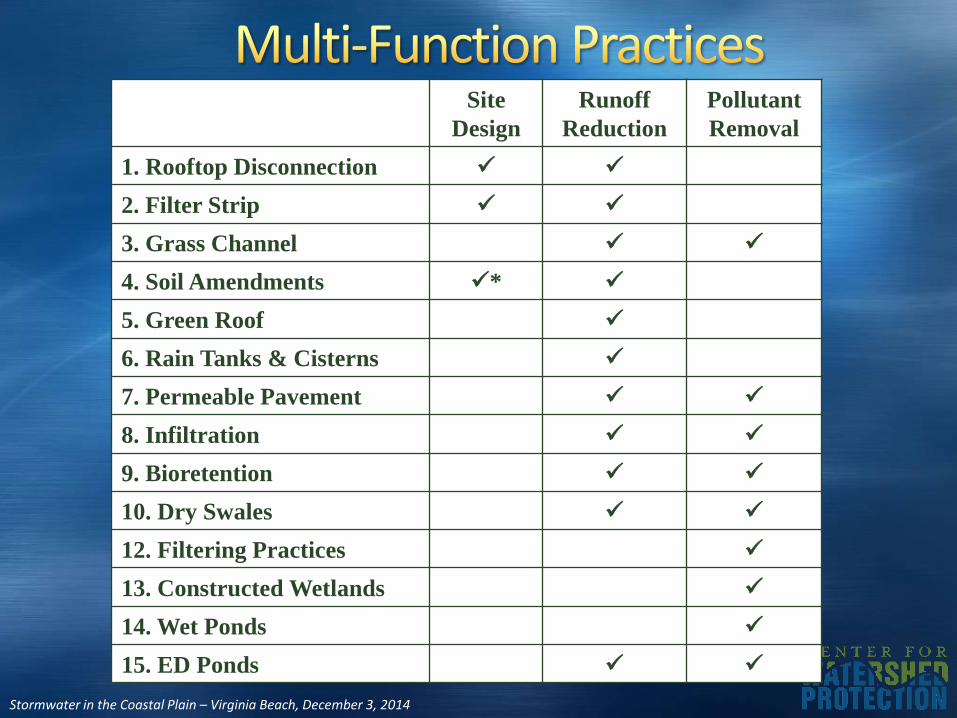
Site
Design
Runoff
Reduction
Pollutant
Removal
1. Rooftop Disconnection
2. Filter Strip
3. Grass Channel
4. Soil Amendments *
5. Green Roof
6. Rain Tanks & Cisterns
7. Permeable Pavement
8. Infiltration
9. Bioretention
10. Dry Swales
12. Filtering Practices
13. Constructed Wetlands
14. Wet Ponds
15. ED Ponds
Stormwater in the Coastal Plain – Virginia Beach, December 3, 2014
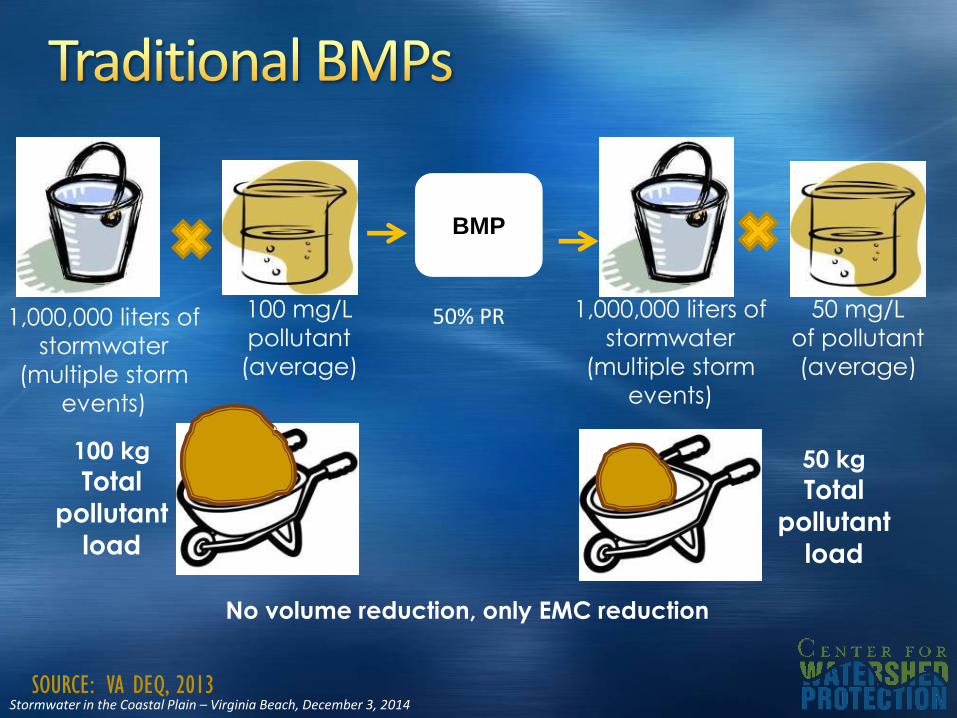
BMP
1,000,000 liters of
stormwater
(multiple storm
events)
100 mg/L
pollutant
(average)
1,000,000 liters of
stormwater
(multiple storm
events)
50 mg/L
of pollutant
(average)
No volume reduction, only EMC reduction
100 kg
Total
pollutant
load
50 kg
Total
pollutant
load
SOURCE: VA DEQ, 2013
50% PR
Stormwater in the Coastal Plain – Virginia Beach, December 3, 2014
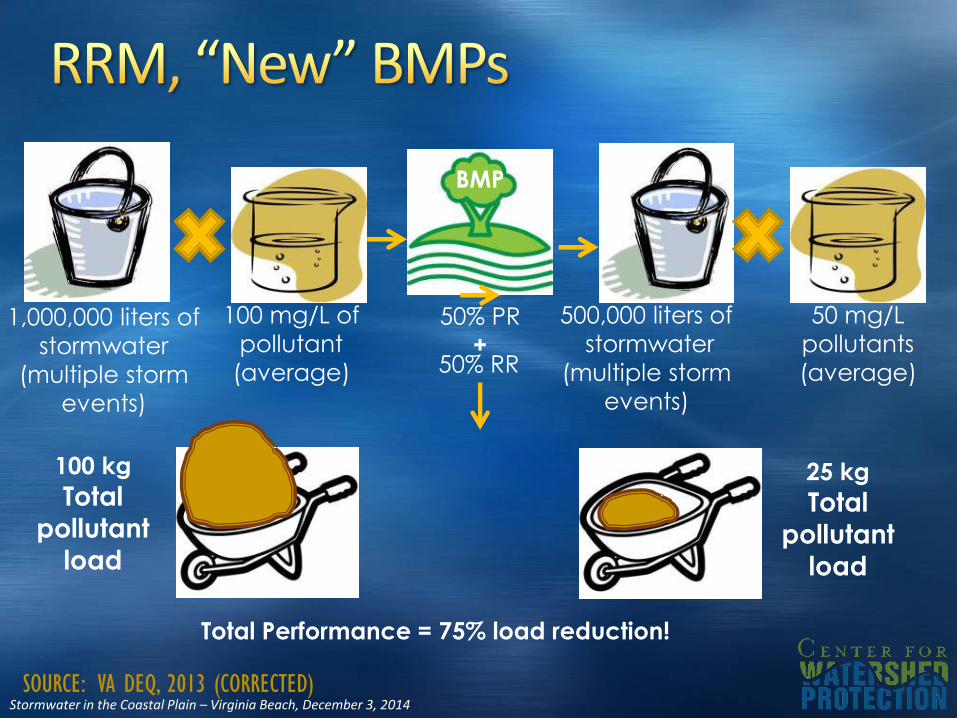
100 mg/L of
pollutant
(average)
500,000 liters of
stormwater
(multiple storm
events)
50 mg/L
pollutants
(average)
Total Performance = 75% load reduction!
25 kg
Total
pollutant
load
BMP
100 kg
Total
pollutant
load
SOURCE: VA DEQ, 2013 (CORRECTED)
1,000,000 liters of
stormwater
(multiple storm
events)
50% RR
50% PR
+
Stormwater in the Coastal Plain – Virginia Beach, December 3, 2014
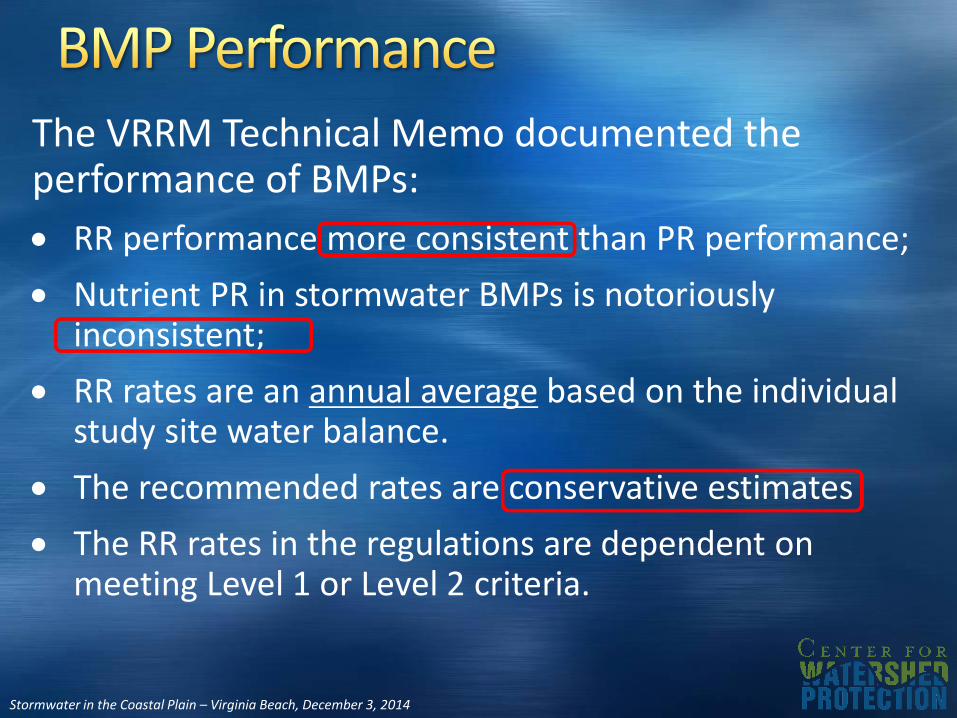
The VRRM Technical Memo documented the performance of BMPs:
RR performance more consistent than PR performance;
Nutrient PR in stormwater BMPs is notoriously inconsistent;
RR rates are an annual average based on the individual study site water balance.
The recommended rates are conservative estimates
The RR rates in the regulations are dependent on meeting Level 1 or Level 2 criteria.
Stormwater in the Coastal Plain – Virginia Beach, December 3, 2014
Codifies & incentivizes minimization and avoidance
Goes beyond impervious cover as a water quality indicator
Utilizes latest BMP research for Total Performance (Total Mass Load Removal)
Credits total BMP performance
Stormwater in the Coastal Plain – Virginia Beach, December 3, 2014
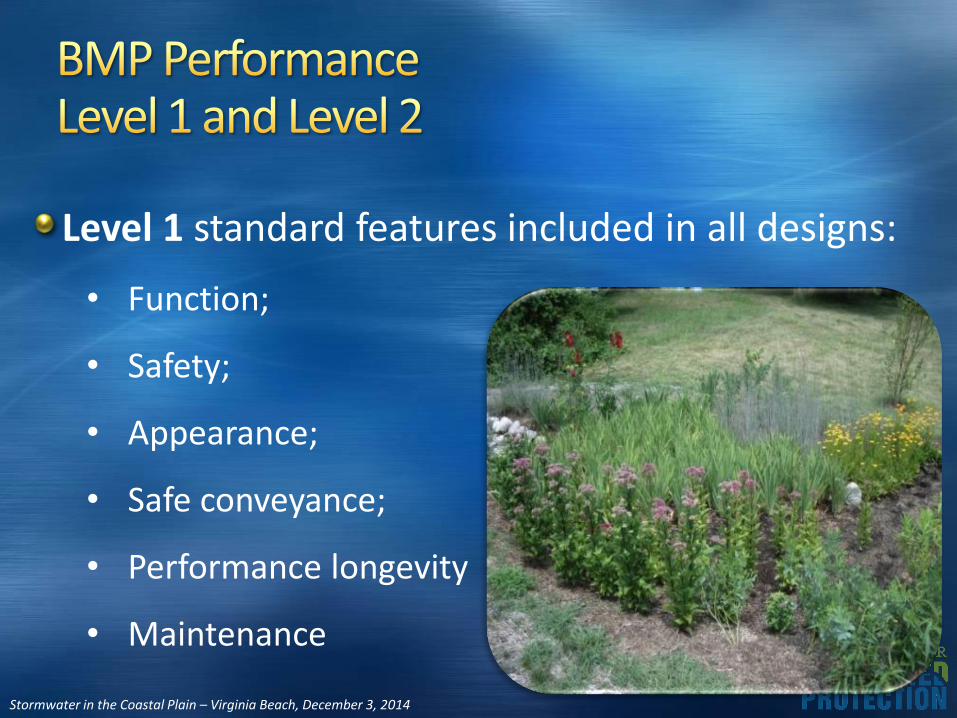
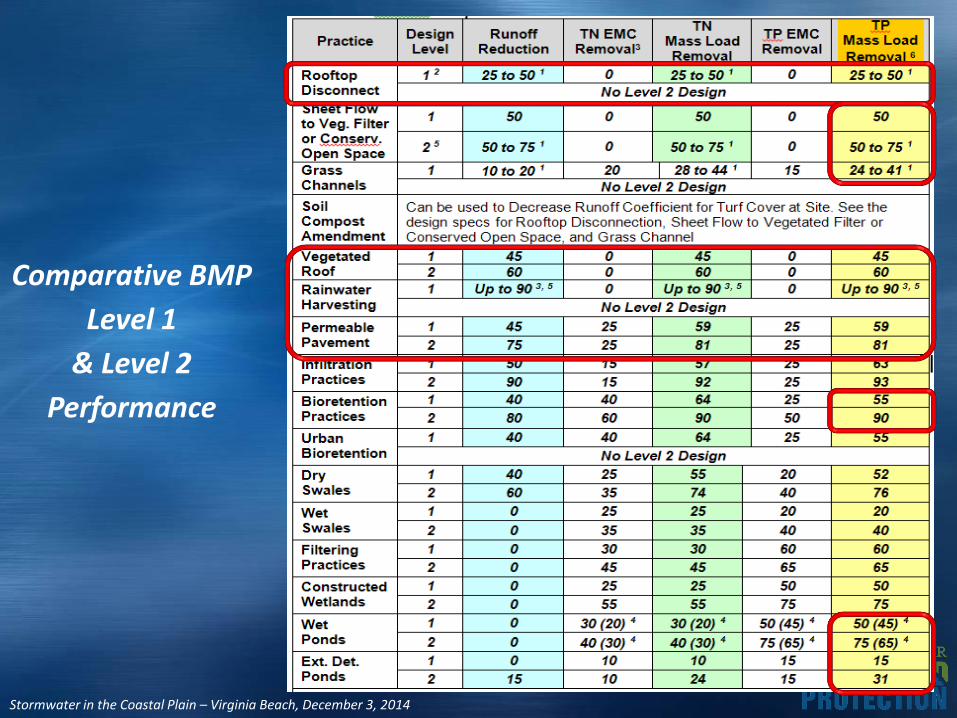
Level 1 standard features included in all designs:
• Function;
• Safety;
• Appearance;
• Safe conveyance;
• Performance longevity
• Maintenance
Stormwater in the Coastal Plain – Virginia Beach, December 3, 2014
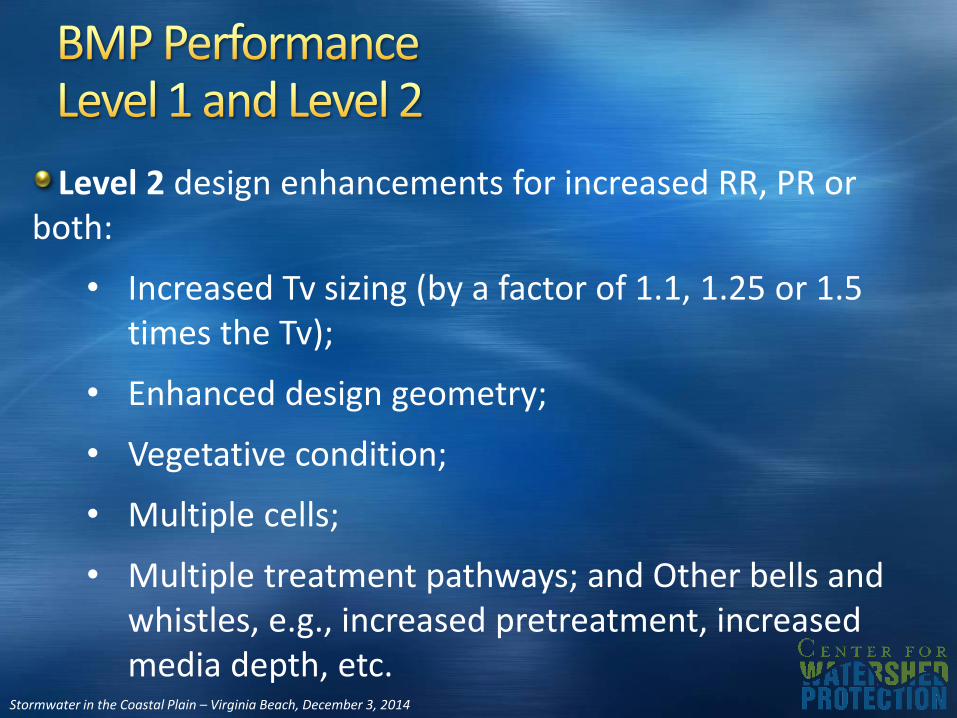
Level 2 design enhancements for increased RR, PR or both:
• Increased Tv sizing (by a factor of 1.1, 1.25 or 1.5 times the Tv);
• Enhanced design geometry;
• Vegetative condition;
• Multiple cells;
• Multiple treatment pathways; and Other bells and whistles, e.g., increased pretreatment, increased media depth, etc.
Stormwater in the Coastal Plain – Virginia Beach, December 3, 2014
Comparative BMP
Level 1
& Level 2
Performance
Stormwater in the Coastal Plain – Virginia Beach, December 3, 2014
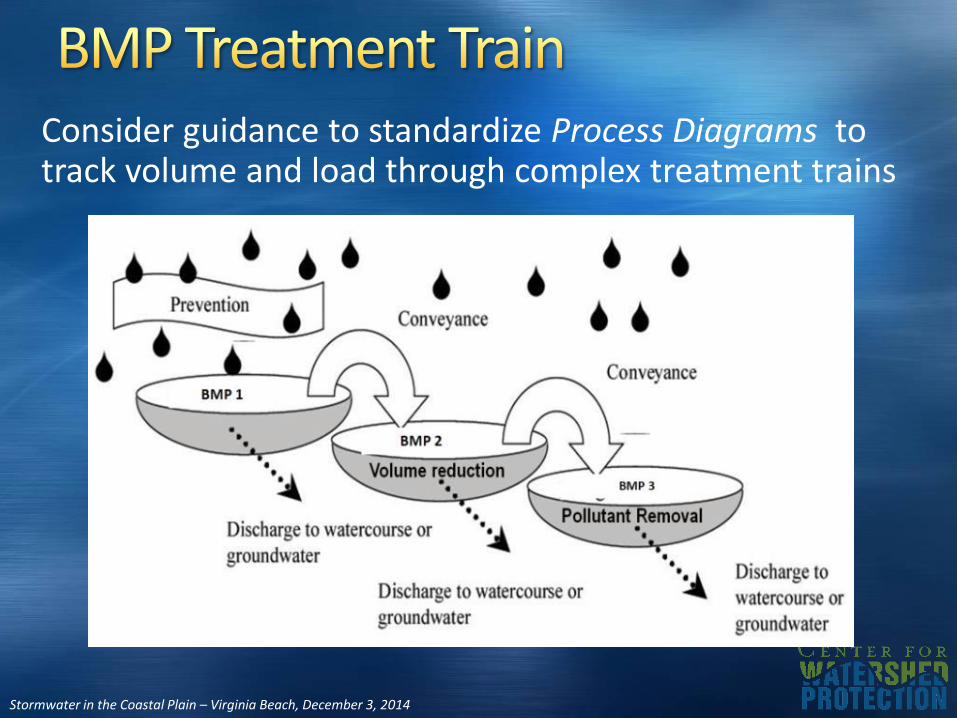
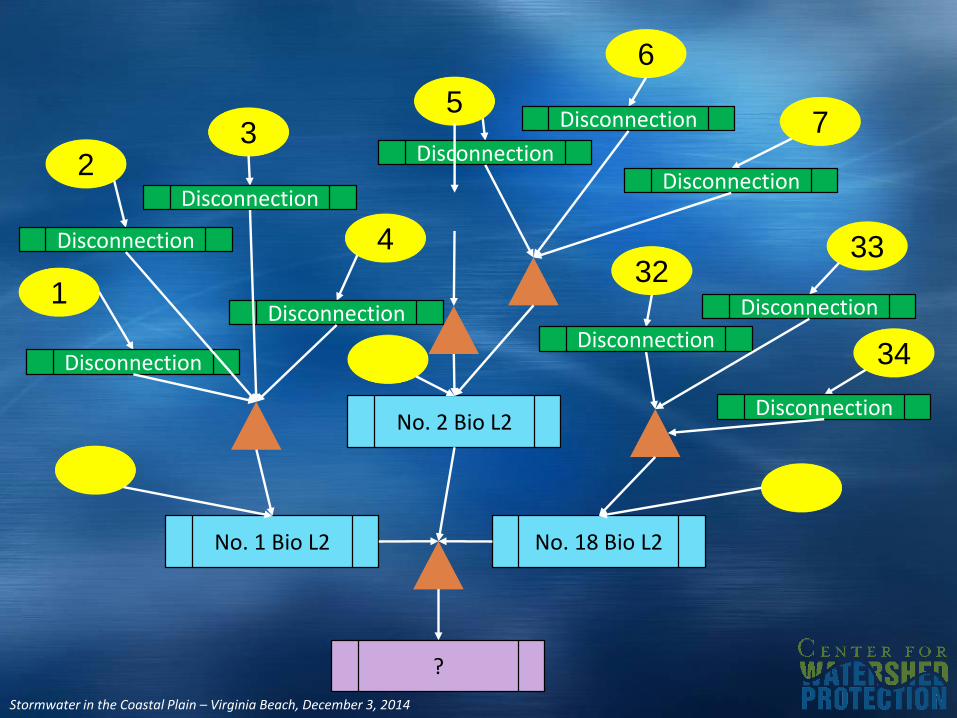
Consider guidance to standardize Process Diagrams to track volume and load through complex treatment trains
Stormwater in the Coastal Plain – Virginia Beach, December 3, 2014
Allow for compliance on high density sites;
Provide flexibility on small/tight sites by allowing multiple smaller BMPs to treat stormwater near the source;• as the drainage area incrementally increases (with each RR
practice);
• the RR practices incrementally reduce the runoff volumeand TvBMP,
• each successive BMP is not sized on the entire upstreamdrainage area;
• Rather, the BMP is sized by the TvBMP from the directlycontributing drainage area + any remaining runoff fromupstream RR practices.
Stormwater in the Coastal Plain – Virginia Beach, December 3, 2014
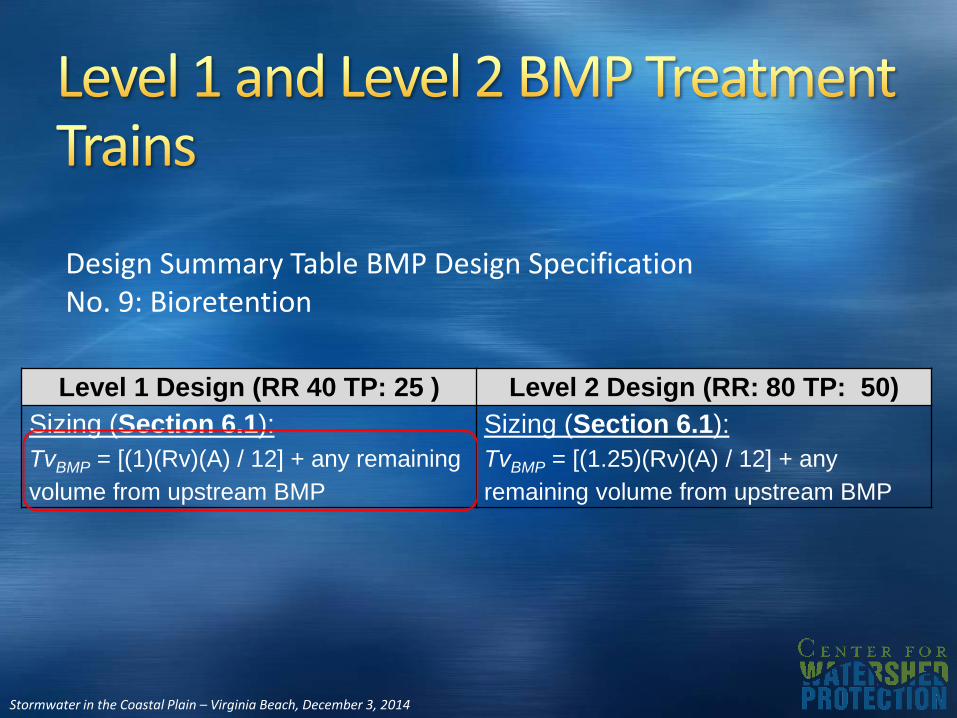
Level 1 Design (RR 40 TP: 25 ) Level 2 Design (RR: 80 TP: 50)
Sizing (Section 6.1):
TvBMP = [(1)(Rv)(A) / 12] + any remaining
volume from upstream BMP
Sizing (Section 6.1):
TvBMP = [(1.25)(Rv)(A) / 12] + any
remaining volume from upstream BMP
Design Summary Table BMP Design Specification No. 9: Bioretention
Stormwater in the Coastal Plain – Virginia Beach, December 3, 2014
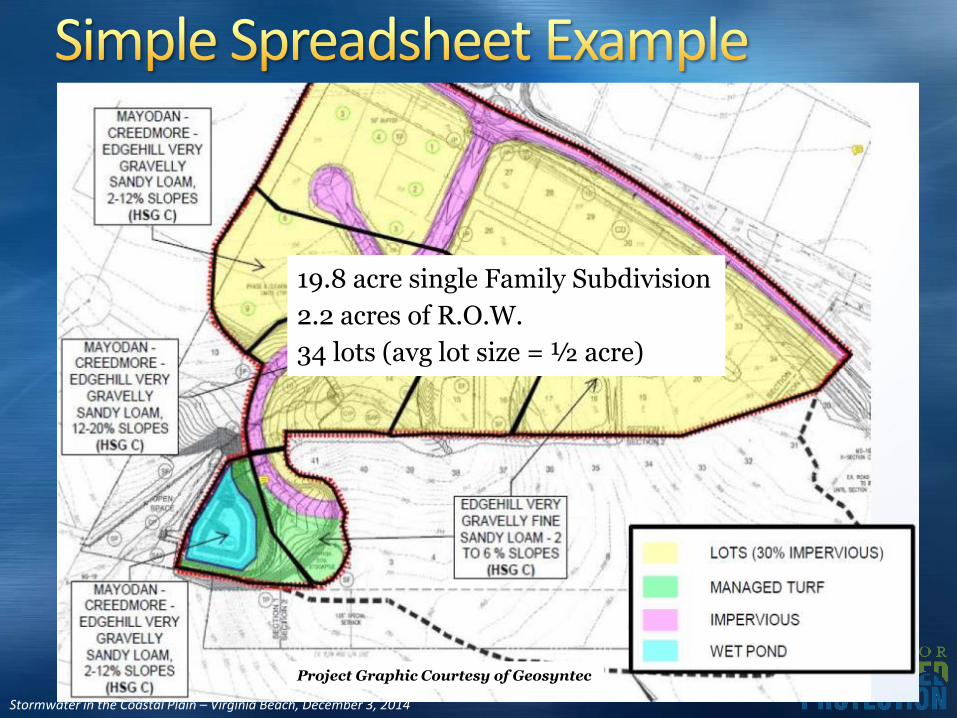
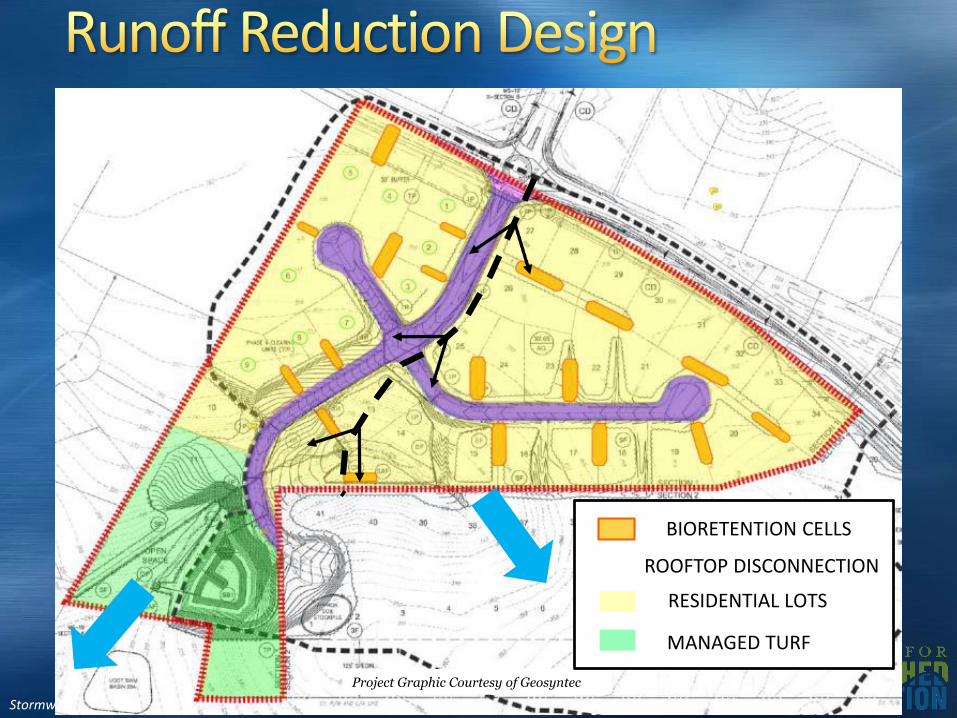
Project Graphic Courtesy of Geosyntec
19.8 acre single Family Subdivision
2.2 acres of R.O.W.
34 lots (avg lot size = ½ acre)
Stormwater in the Coastal Plain – Virginia Beach, December 3, 2014
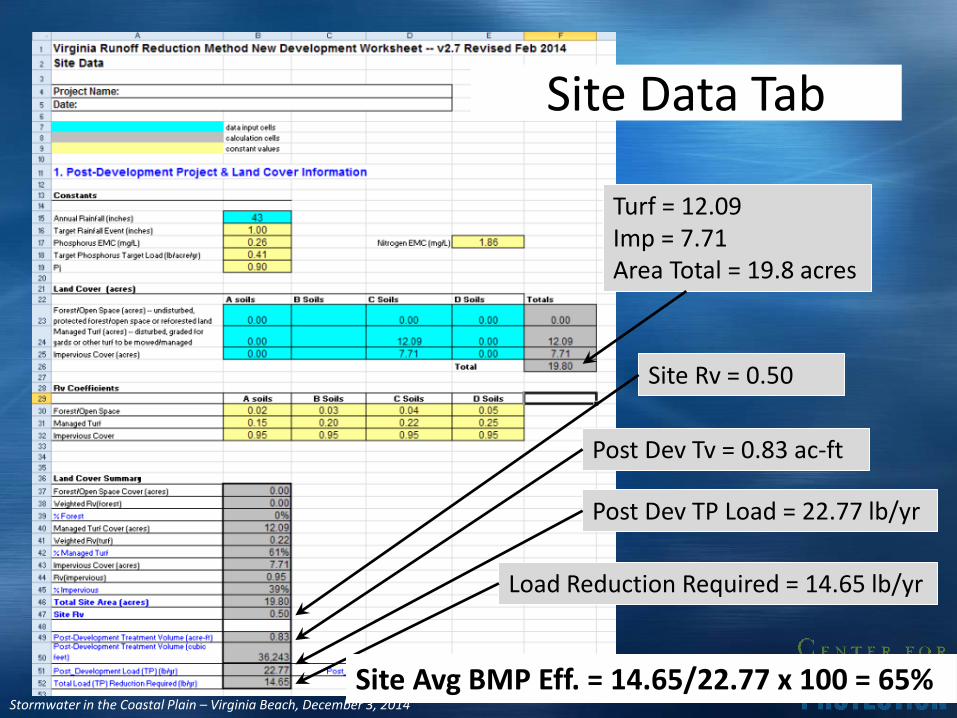
Turf = 12.09Imp = 7.71Area Total = 19.8 acres
Site Rv = 0.50
Post Dev Tv = 0.83 ac-ft
Post Dev TP Load = 22.77 lb/yr
Load Reduction Required = 14.65 lb/yr
Site Data Tab
Site Avg BMP Eff. = 14.65/22.77 x 100 = 65%
Stormwater in the Coastal Plain – Virginia Beach, December 3, 2014
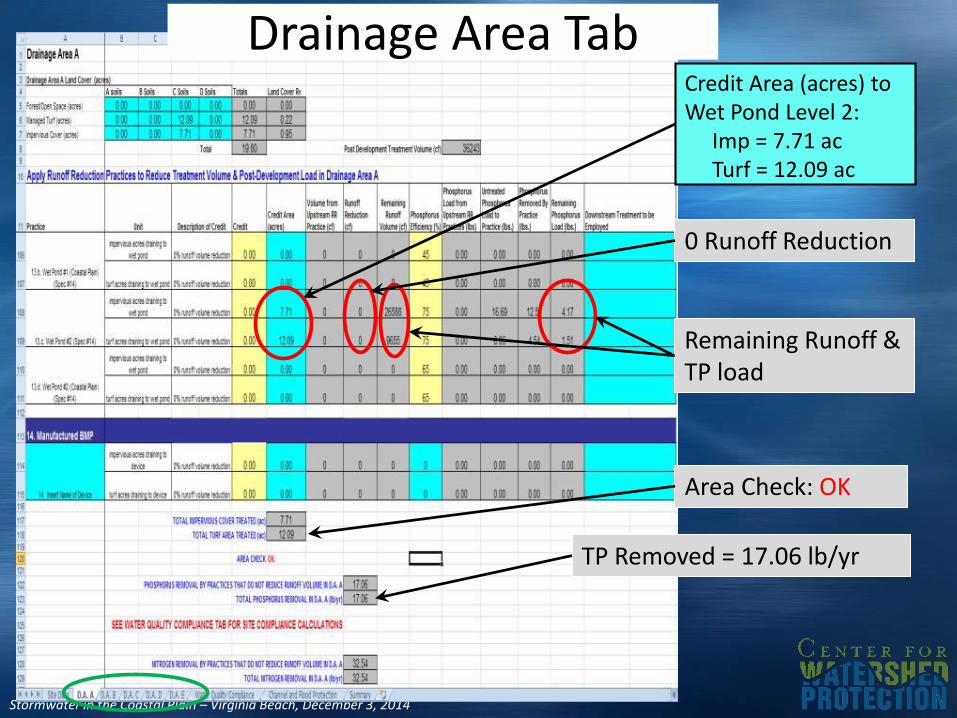
Credit Area (acres) to Wet Pond Level 2:
Imp = 7.71 acTurf = 12.09 ac
TP Removed = 17.06 lb/yr
0 Runoff Reduction
Area Check: OK
Drainage Area Tab
Remaining Runoff & TP load
Stormwater in the Coastal Plain – Virginia Beach, December 3, 2014
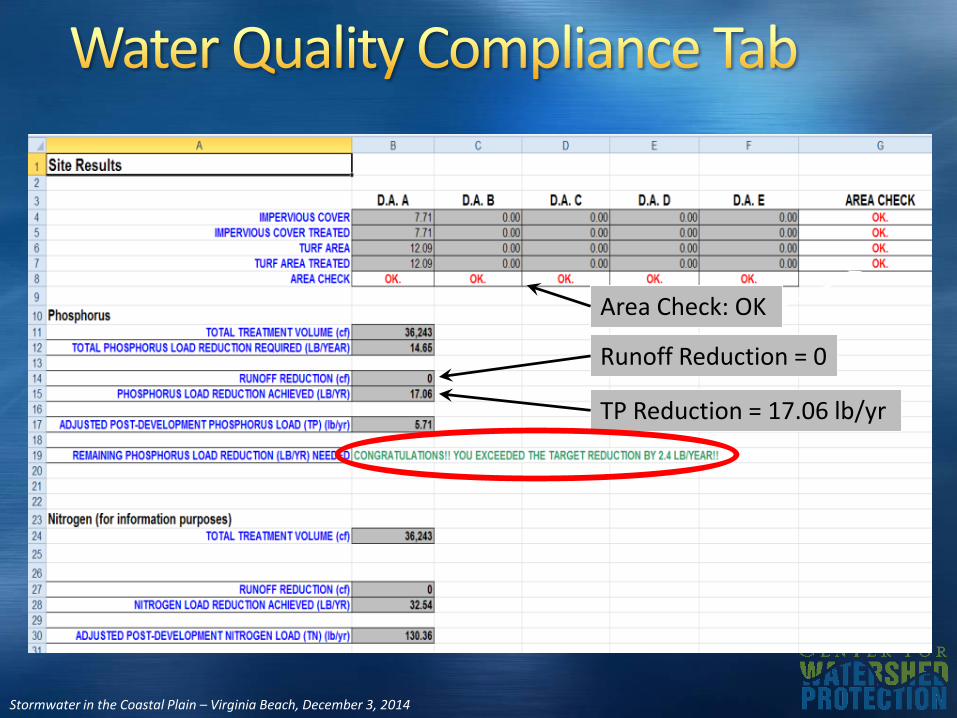
Runoff Reduction = 0
TP Reduction = 17.06 lb/yr
Area Check: OK
Stormwater in the Coastal Plain – Virginia Beach, December 3, 2014
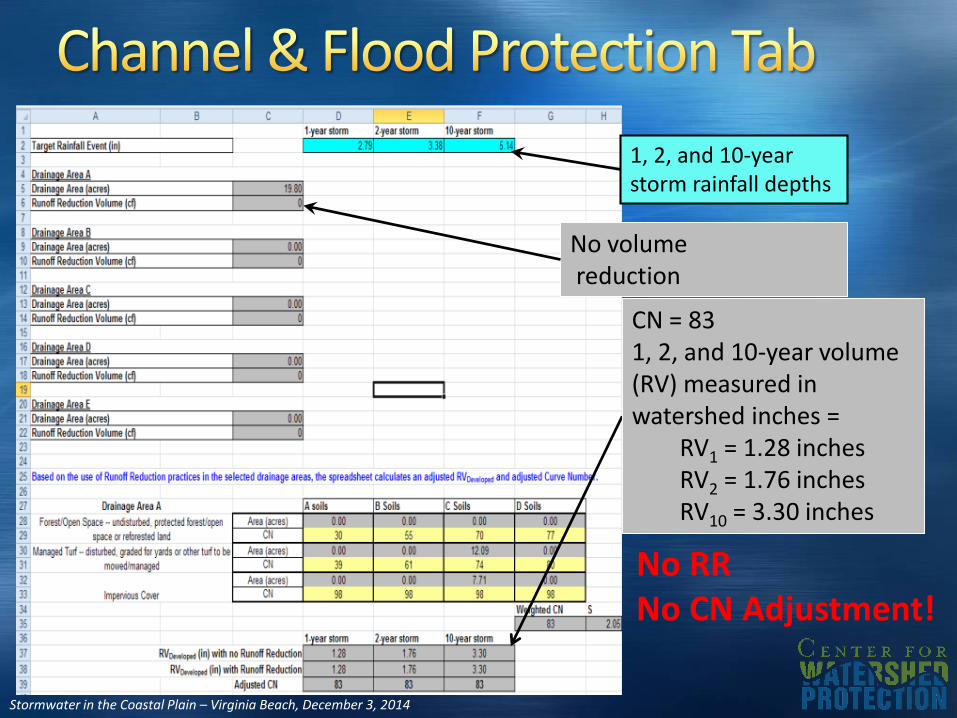
1, 2, and 10-year storm rainfall depths
CN = 831, 2, and 10-year volume (RV) measured in watershed inches =
RV1 = 1.28 inchesRV2 = 1.76 inchesRV10 = 3.30 inches
No RRNo CN Adjustment!
No volumereduction
Stormwater in the Coastal Plain – Virginia Beach, December 3, 2014
Stormwater in the Coastal Plain – Virginia Beach, December 3, 2014
Stormwater in the Coastal Plain – Virginia Beach, December 3, 2014
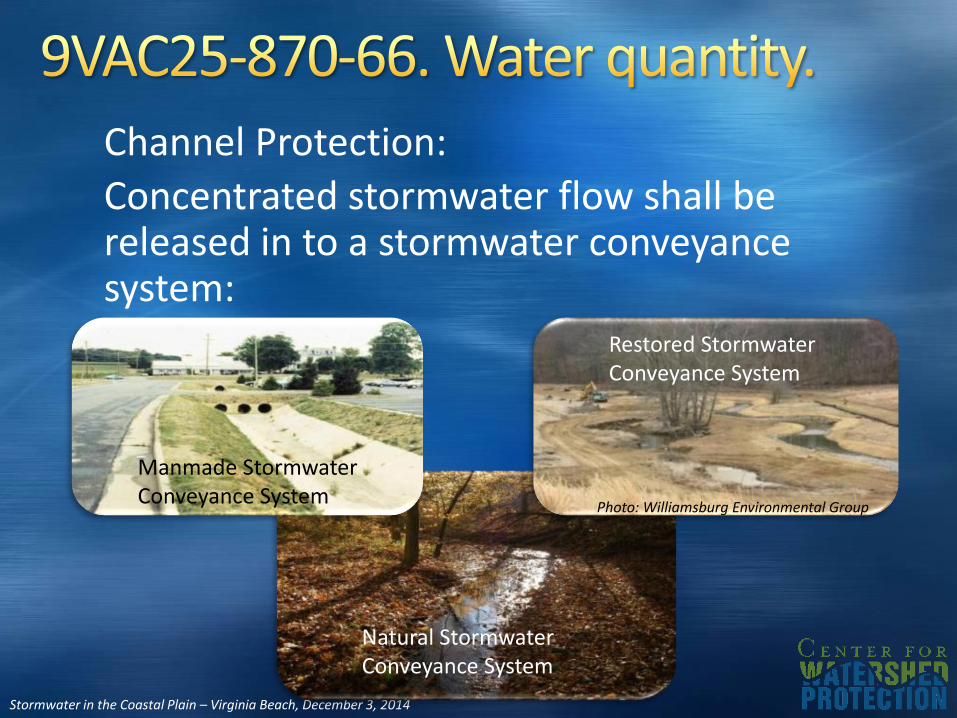
Channel Protection:
Concentrated stormwater flow shall be released in to a stormwater conveyance system:
Photo: Williamsburg Environmental Group
Manmade Stormwater Conveyance System
Restored Stormwater Conveyance System
Natural Stormwater Conveyance System
Stormwater in the Coastal Plain – Virginia Beach, December 3, 2014
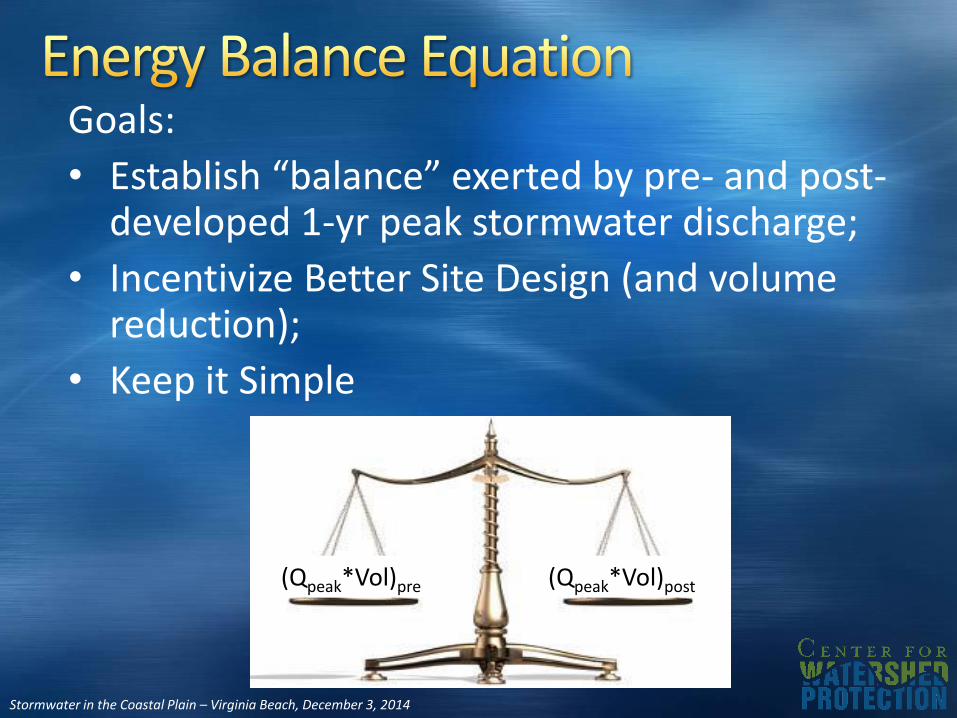
Goals:
• Establish “balance” exerted by pre- and post-developed 1-yr peak stormwater discharge;
• Incentivize Better Site Design (and volume reduction);
• Keep it Simple
(Qpeak*Vol)pre (Qpeak*Vol)post
Stormwater in the Coastal Plain – Virginia Beach, December 3, 2014
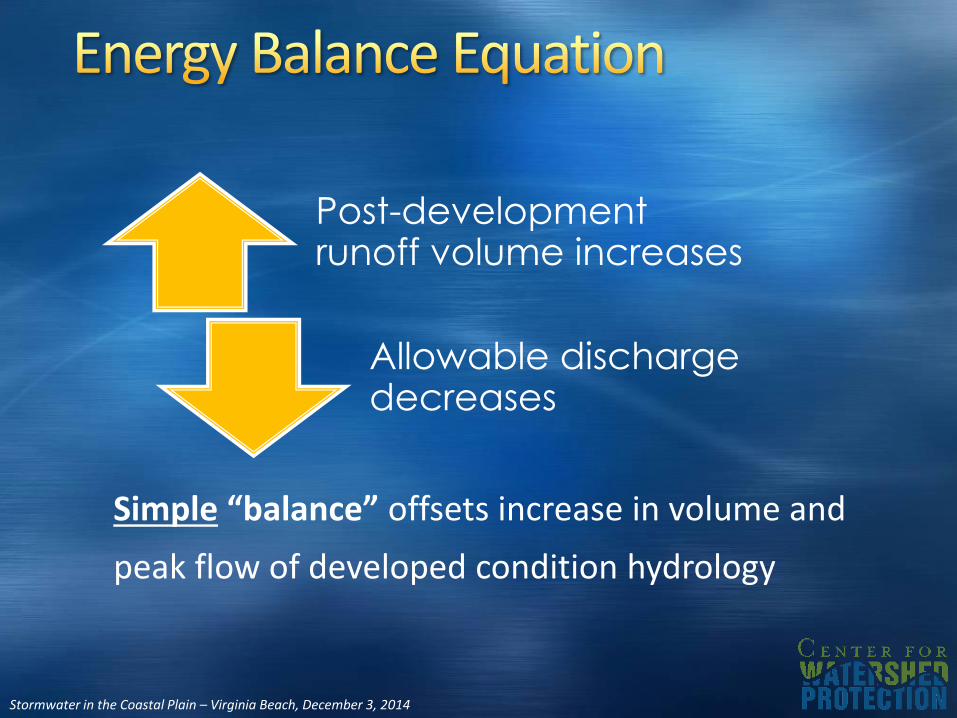
Simple “balance” offsets increase in volume and
peak flow of developed condition hydrology
Post-development runoff volume increases
Allowable discharge decreases

Stormwater in the Coastal Plain – Virginia Beach, December 3, 2014
Energy Balance
Post (Vol1-yr * Peak Q1-yr) ≤ Pre (Vol1-yr * Peak Q1-yr)
re-written:
IF = Improvement Factor:
(0.8 for sites > 1 acre or 0.9 for sites ≤ 1 acre)
𝑞1𝑝𝑜𝑠𝑡 ≤ 𝑞1𝑝𝑟𝑒𝑃𝑟𝑒 𝑉𝑜𝑙1𝑃𝑜𝑠𝑡 𝑉𝑜𝑙1
𝐼𝐹

Stormwater in the Coastal Plain – Virginia Beach, December 3, 2014
Use VRRM Spreadsheet to calculate the volume
reduction with a double credit:
• Reduced Volpost1 for Energy Balance Equation; and
• Reduced Curve Number (CN) for computing the
q1post
𝑞1𝑝𝑜𝑠𝑡 ≤ 𝑞1𝑝𝑟𝑒𝑃𝑟𝑒 𝑉𝑜𝑙1𝑃𝑜𝑠𝑡 𝑉𝑜𝑙1
𝐼𝐹
Must consider the pre- and post- condition drainage areas!
Stormwater in the Coastal Plain – Virginia Beach, December 3, 2014
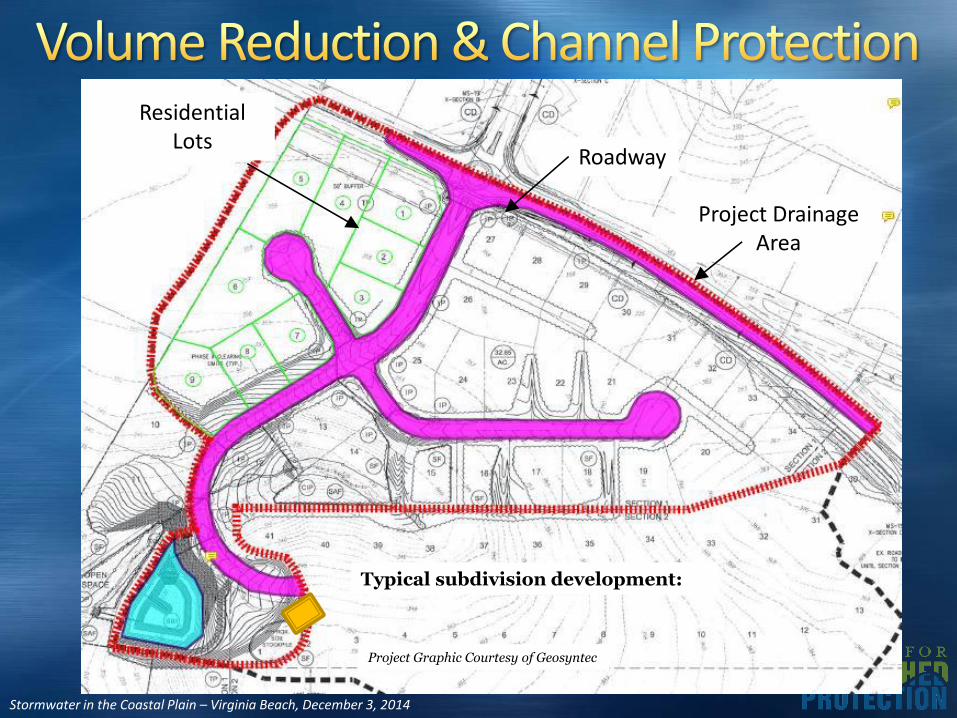
Roadway
Project Drainage Area
Residential Lots
Project Graphic Courtesy of Geosyntec
Typical subdivision development:
Stormwater in the Coastal Plain – Virginia Beach, December 3, 2014
NEW PERVIOUS PAVEMENT
MANAGED TURF
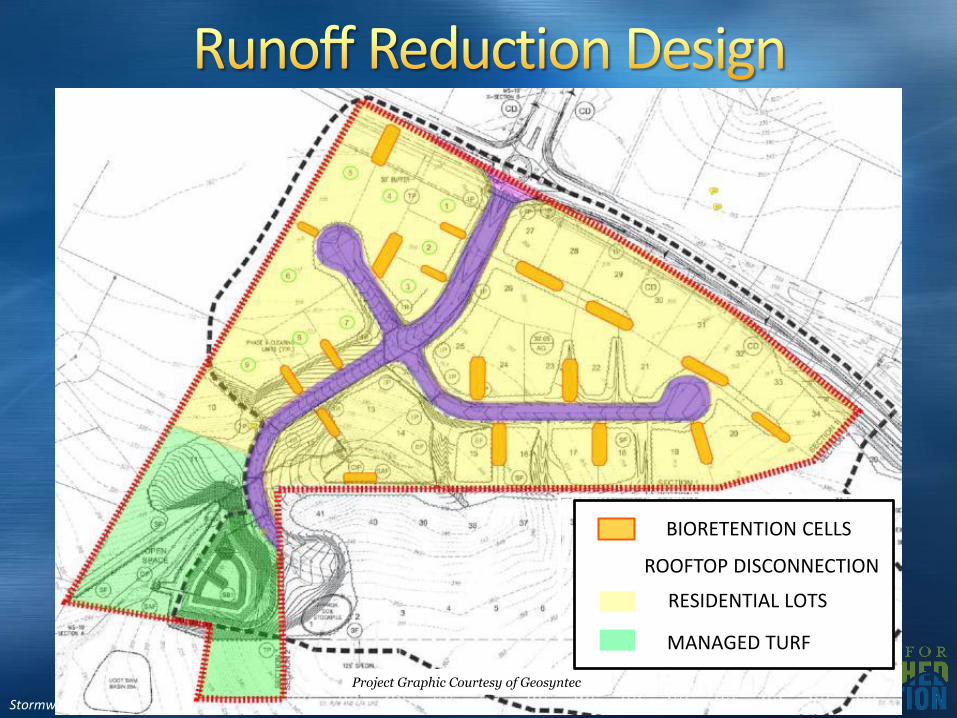
BIORETENTION CELLS
RESIDENTIAL LOTS
Project Graphic Courtesy of Geosyntec
NEW PERVIOUS PAVEMENT
MANAGED TURF
BIORETENTION CELLS
RESIDENTIAL LOTS
ROOFTOP DISCONNECTION
Stormwater in the Coastal Plain – Virginia Beach, December 3, 2014
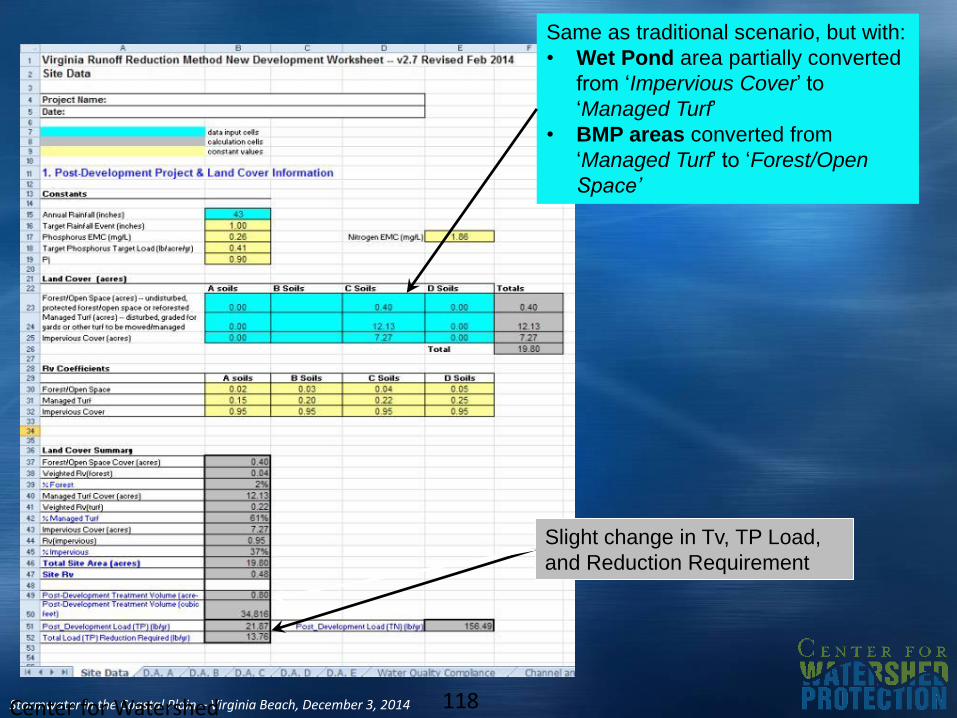
Same as traditional scenario, but with:
• Wet Pond area partially converted
from ‘Impervious Cover’ to
‘Managed Turf’
• BMP areas converted from
‘Managed Turf’ to ‘Forest/Open
Space’
Slight change in Tv, TP Load,
and Reduction Requirement
Center for Watershed Protection
118

Stormwater in the Coastal Plain – Virginia Beach, December 3, 2014
NEW PERVIOUS PAVEMENT
MANAGED TURF
BIORETENTION CELLS
RESIDENTIAL LOTS
Project Graphic Courtesy of Geosyntec
NEW PERVIOUS PAVEMENT
MANAGED TURF
BIORETENTION CELLS
RESIDENTIAL LOTS
ROOFTOP DISCONNECTION
Stormwater in the Coastal Plain – Virginia Beach, December 3, 2014
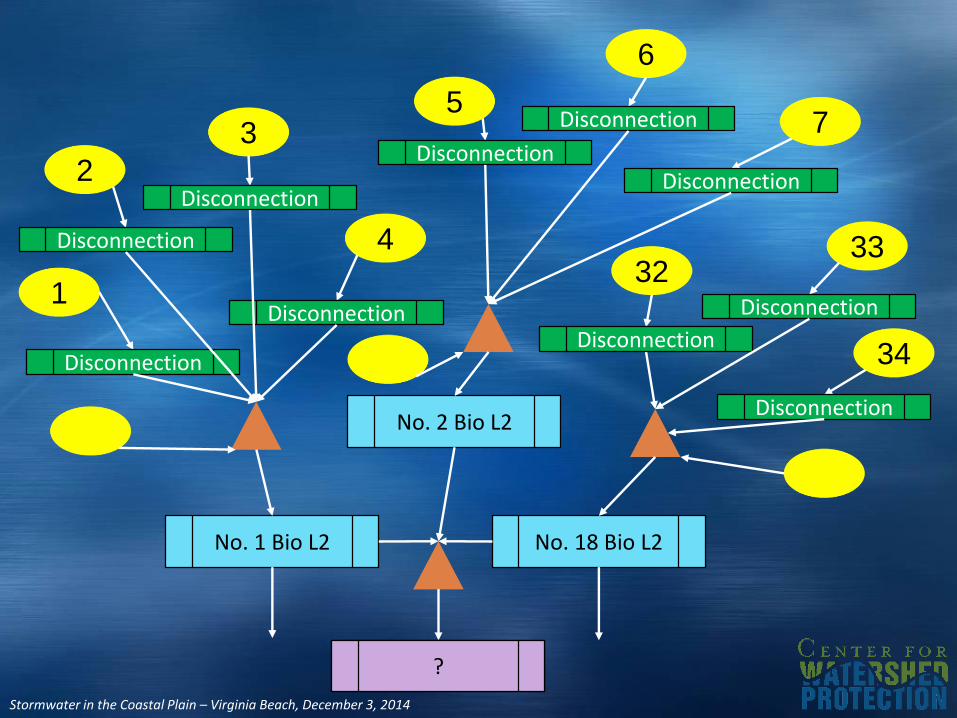
2
4
34
3332
3
1
6
75
Disconnection
Disconnection
Disconnection
Disconnection
Disconnection
Disconnection
Disconnection
Disconnection
Disconnection
Disconnection
No. 1 Bio L2
No. 2 Bio L2
No. 18 Bio L2
?
Stormwater in the Coastal Plain – Virginia Beach, December 3, 2014
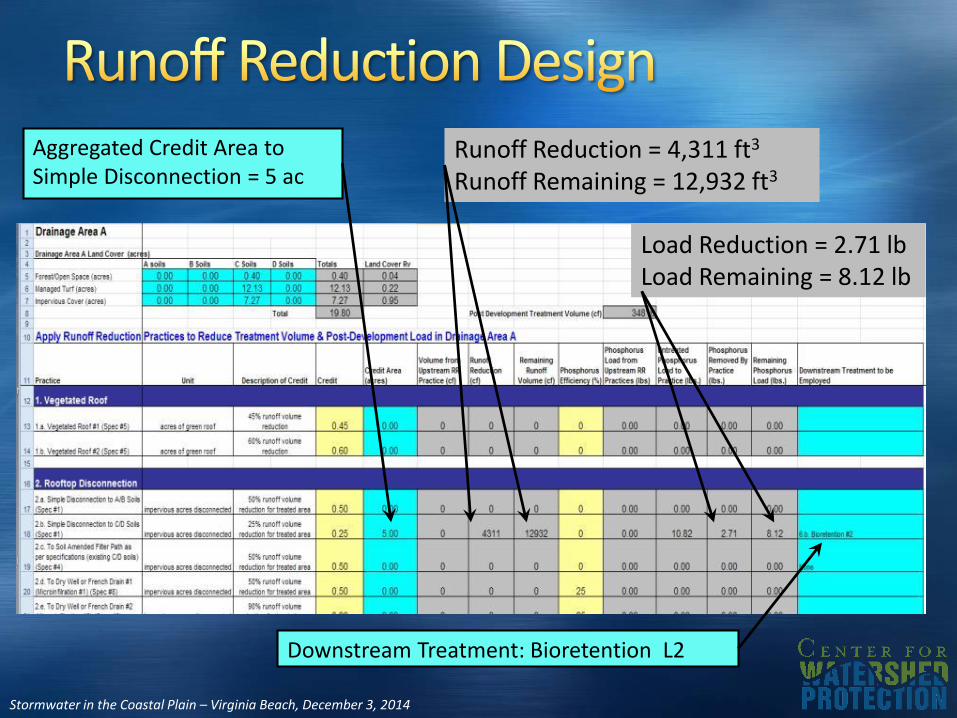
Aggregated Credit Area to Simple Disconnection = 5 ac
Runoff Reduction = 4,311 ft3
Runoff Remaining = 12,932 ft3
Downstream Treatment: Bioretention L2
Load Reduction = 2.71 lbLoad Remaining = 8.12 lb
Stormwater in the Coastal Plain – Virginia Beach, December 3, 2014
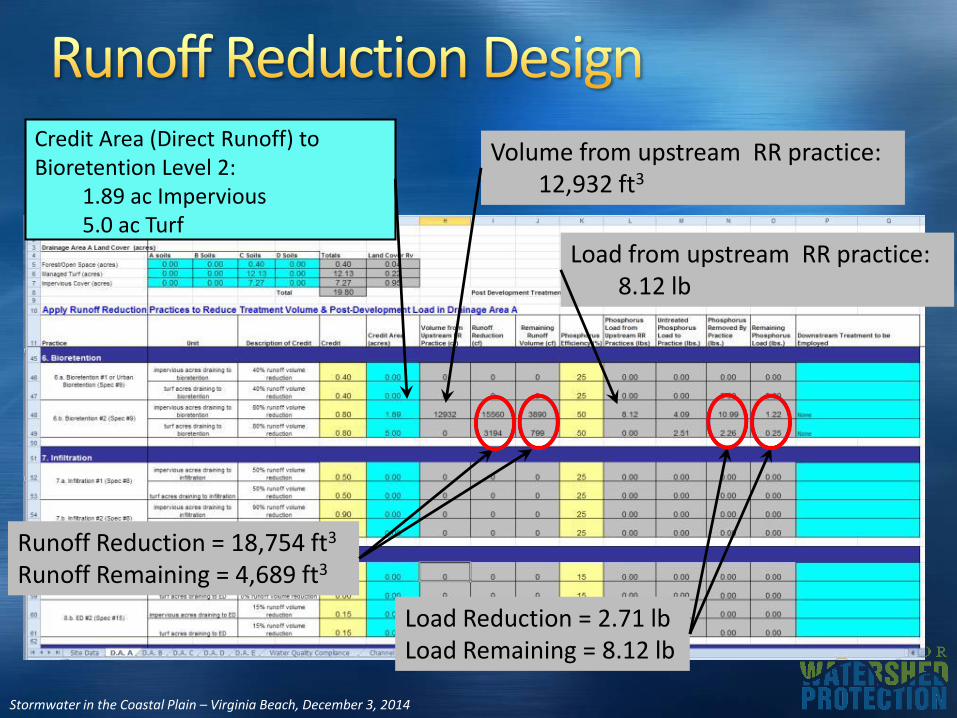
Credit Area (Direct Runoff) to Bioretention Level 2:
1.89 ac Impervious5.0 ac Turf
Volume from upstream RR practice:12,932 ft3
Runoff Reduction = 18,754 ft3
Runoff Remaining = 4,689 ft3
Load Reduction = 2.71 lbLoad Remaining = 8.12 lb
Load from upstream RR practice:8.12 lb
Stormwater in the Coastal Plain – Virginia Beach, December 3, 2014
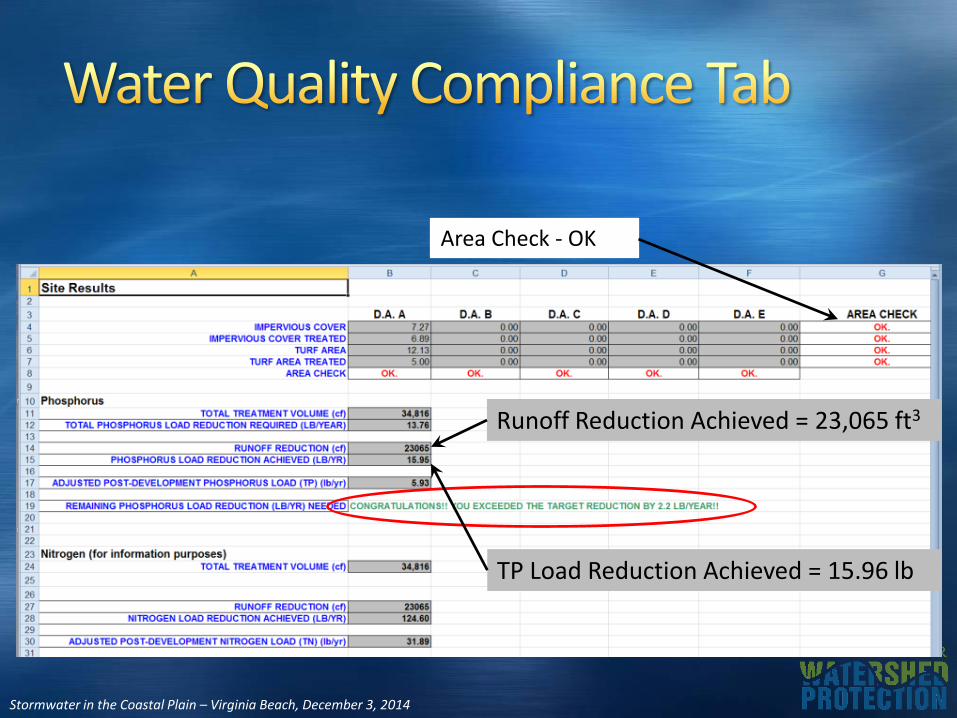
Area Check - OK
Runoff Reduction Achieved = 23,065 ft3
TP Load Reduction Achieved = 15.96 lb
Stormwater in the Coastal Plain – Virginia Beach, December 3, 2014
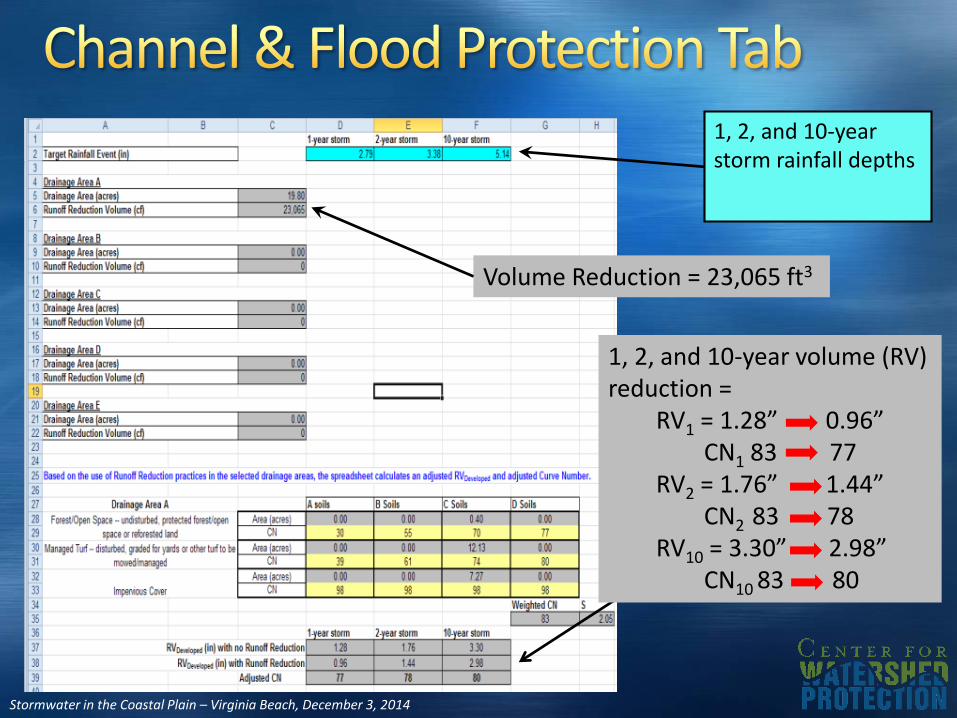
1, 2, and 10-year storm rainfall depths
1, 2, and 10-year volume (RV) reduction =
RV1 = 1.28” 0.96”CN1 83 77
RV2 = 1.76” 1.44”CN2 83 78
RV10 = 3.30” 2.98”CN10 83 80
Volume Reduction = 23,065 ft3
Stormwater in the Coastal Plain – Virginia Beach, December 3, 2014
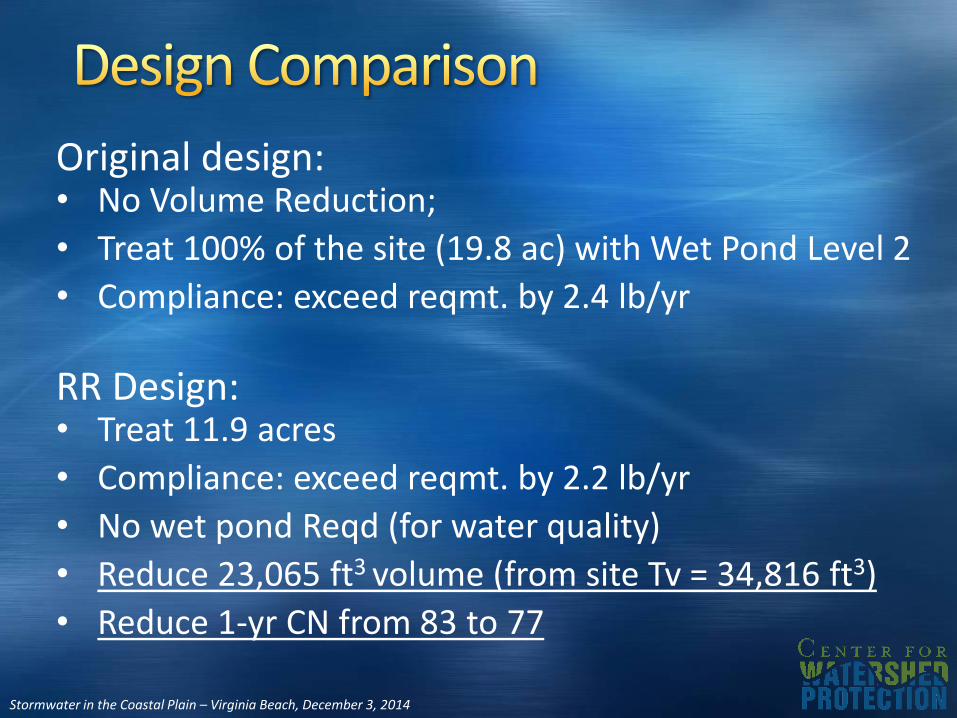
Original design: • No Volume Reduction;
• Treat 100% of the site (19.8 ac) with Wet Pond Level 2
• Compliance: exceed reqmt. by 2.4 lb/yr
RR Design: • Treat 11.9 acres
• Compliance: exceed reqmt. by 2.2 lb/yr
• No wet pond Reqd (for water quality)
• Reduce 23,065 ft3 volume (from site Tv = 34,816 ft3)
• Reduce 1-yr CN from 83 to 77
Stormwater in the Coastal Plain – Virginia Beach, December 3, 2014
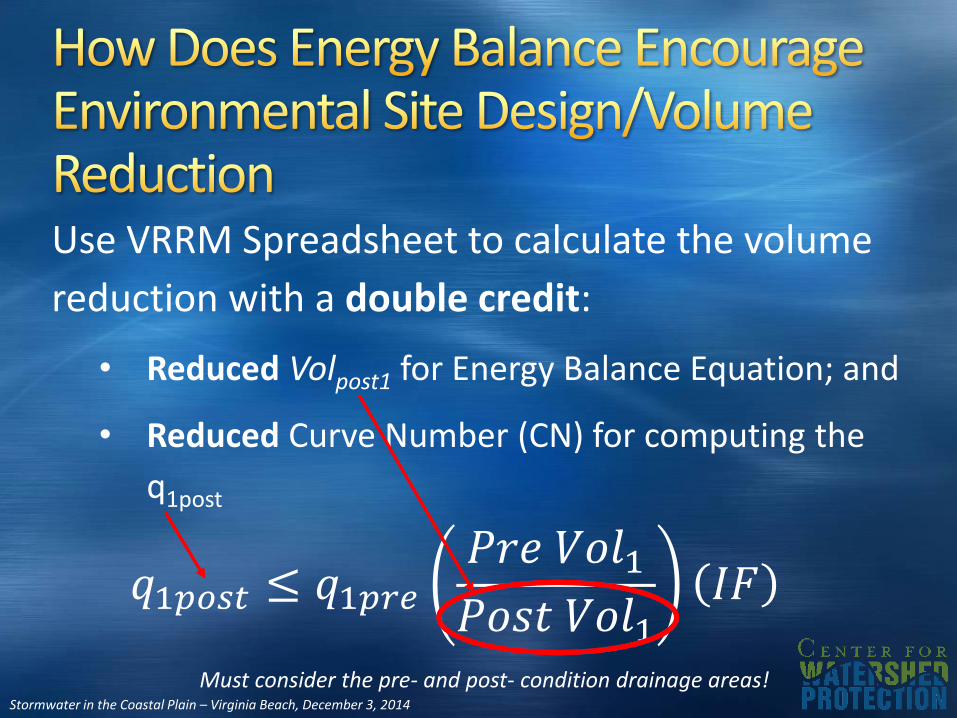
Use VRRM Spreadsheet to calculate the volume
reduction with a double credit:
• Reduced Volpost1 for Energy Balance Equation; and
• Reduced Curve Number (CN) for computing the
q1post
𝑞1𝑝𝑜𝑠𝑡 ≤ 𝑞1𝑝𝑟𝑒𝑃𝑟𝑒 𝑉𝑜𝑙1𝑃𝑜𝑠𝑡 𝑉𝑜𝑙1
𝐼𝐹
Must consider the pre- and post- condition drainage areas!
Stormwater in the Coastal Plain – Virginia Beach, December 3, 2014
Project Graphic Courtesy of Geosyntec
NEW PERVIOUS PAVEMENT
MANAGED TURF
BIORETENTION CELLS
RESIDENTIAL LOTS
ROOFTOP DISCONNECTION
Stormwater in the Coastal Plain – Virginia Beach, December 3, 2014
2
4
34
3332
3
1
6
75
Disconnection
Disconnection
Disconnection
Disconnection
Disconnection
Disconnection
Disconnection
Disconnection
Disconnection
Disconnection
No. 1 Bio L2
No. 2 Bio L2
No. 18 Bio L2
??
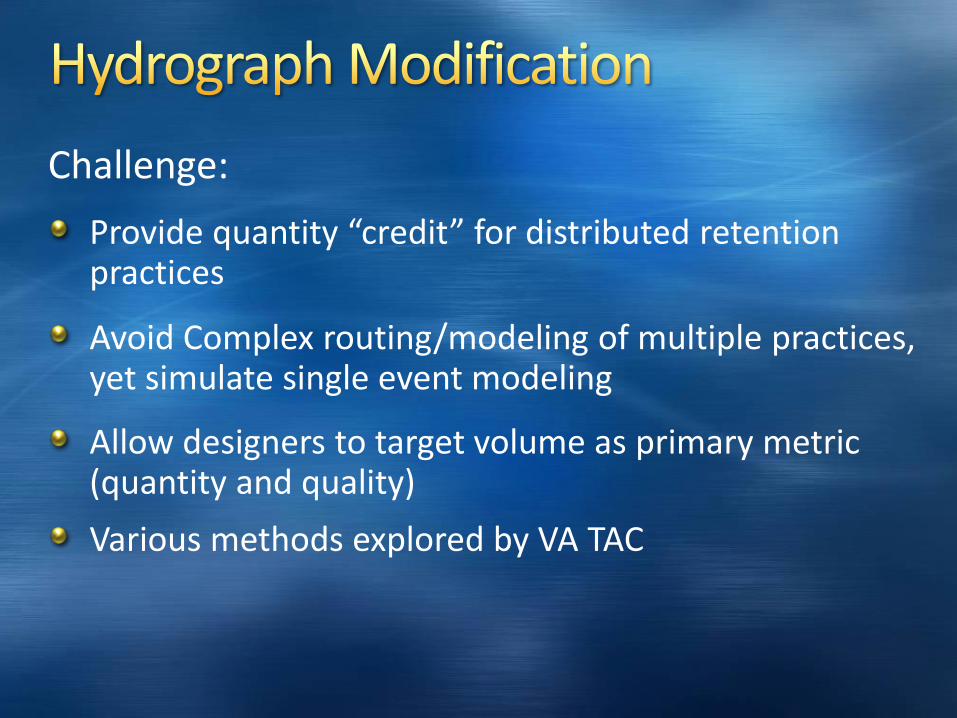
Challenge:
Provide quantity “credit” for distributed retention practices
Avoid Complex routing/modeling of multiple practices, yet simulate single event modeling
Allow designers to target volume as primary metric (quantity and quality)
Various methods explored by VA TAC
Stormwater in the Coastal Plain – Virginia Beach, December 3, 2014
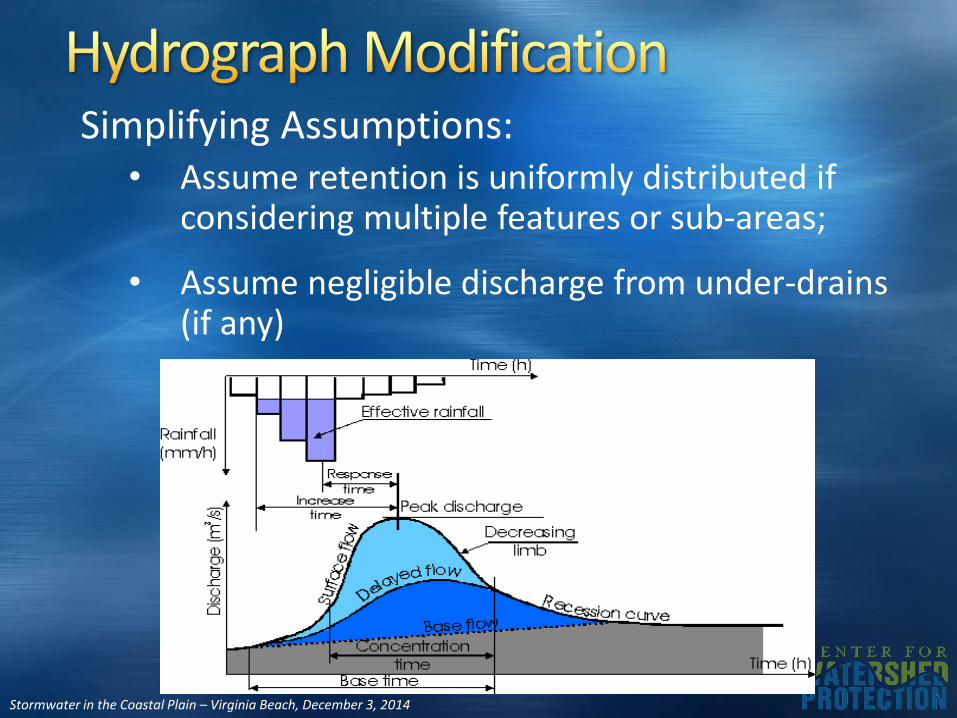
Simplifying Assumptions:• Assume retention is uniformly distributed if
considering multiple features or sub-areas;
• Assume negligible discharge from under-drains (if any)
Stormwater in the Coastal Plain – Virginia Beach, December 3, 2014
5 Methods Considered:
1. Hydrograph Truncation
2. Hydrograph Scalar Multiplication
3. Precipitation Adjustment
4. Runoff Adjustment
5. Curve Number Adjustment
Excerpted from work by Paul R. Koch, Ph.D., P.E.
Stormwater in the Coastal Plain – Virginia Beach, December 3, 2014
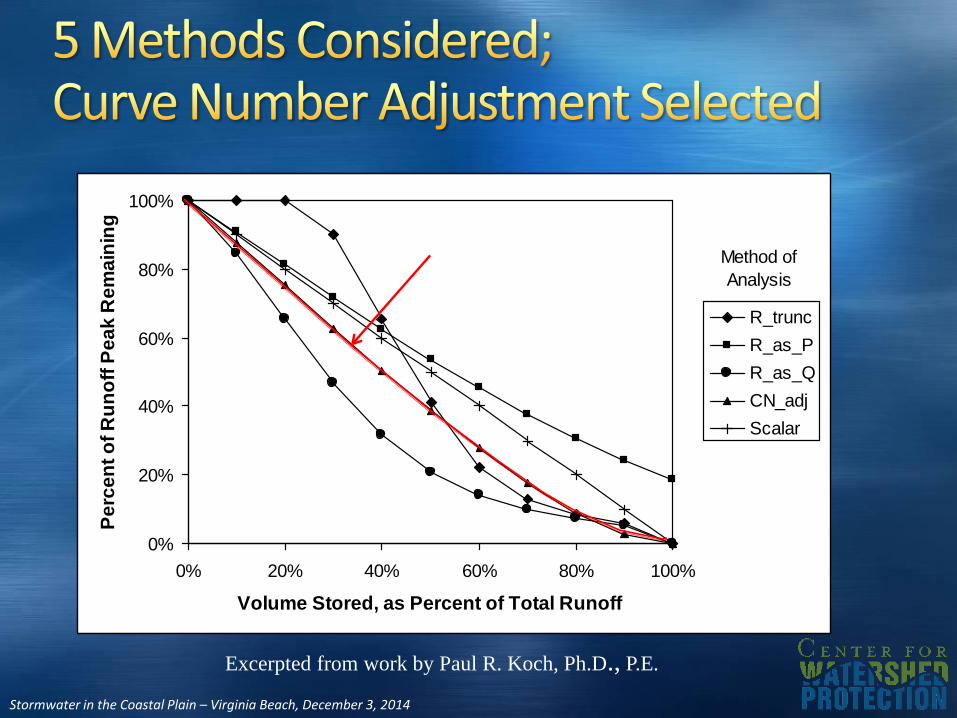
0%
20%
40%
60%
80%
100%
0% 20% 40% 60% 80% 100%
Volume Stored, as Percent of Total Runoff
Pe
rce
nt
of
Ru
no
ff P
ea
k R
em
ain
ing
R_trunc
R_as_P
R_as_Q
CN_adj
Scalar
Method of
Analysis
CN Adjustment
Excerpted from work by Paul R. Koch, Ph.D., P.E.
Stormwater in the Coastal Plain – Virginia Beach, December 3, 2014
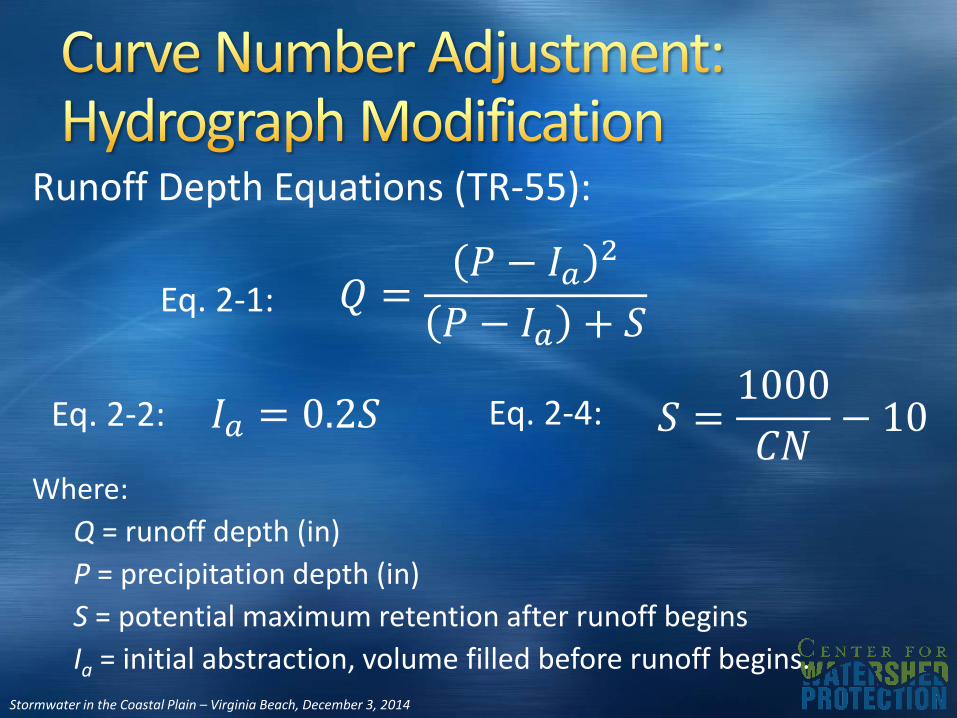
Runoff Depth Equations (TR-55):
Where:
Q = runoff depth (in)
P = precipitation depth (in)
S = potential maximum retention after runoff begins
Ia = initial abstraction, volume filled before runoff begins.
𝑄 =𝑃 − 𝐼𝑎
2
𝑃 − 𝐼𝑎 + 𝑆
𝐼𝑎 = 0.2𝑆 𝑆 =1000
𝐶𝑁− 10
Eq. 2-1:
Eq. 2-2: Eq. 2-4:
Stormwater in the Coastal Plain – Virginia Beach, December 3, 2014
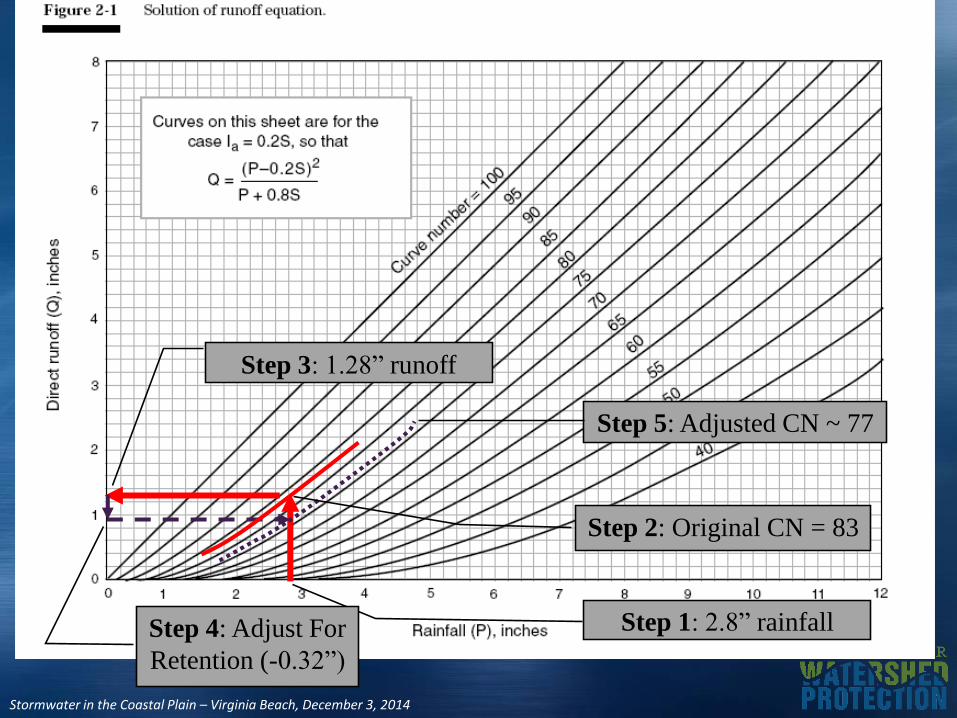
Step 3: 1.28” runoff
Step 1: 2.8” rainfallStep 4: Adjust For
Retention (-0.32”)
Step 5: Adjusted CN ~ 77
Step 2: Original CN = 83

Stormwater in the Coastal Plain – Virginia Beach, December 3, 2014
1, 2, and 10-year storm rainfall depths
1, 2, and 10-year volume (RV) reduction =
RV1 = 1.28” 0.96”CN1 83 77
RV2 = 1.76” 1.44”CN2 83 78
RV10 = 3.30” 2.98”CN10 83 80
Volume Reduction = 23,065 ft3
Stormwater in the Coastal Plain – Virginia Beach, December 3, 2014
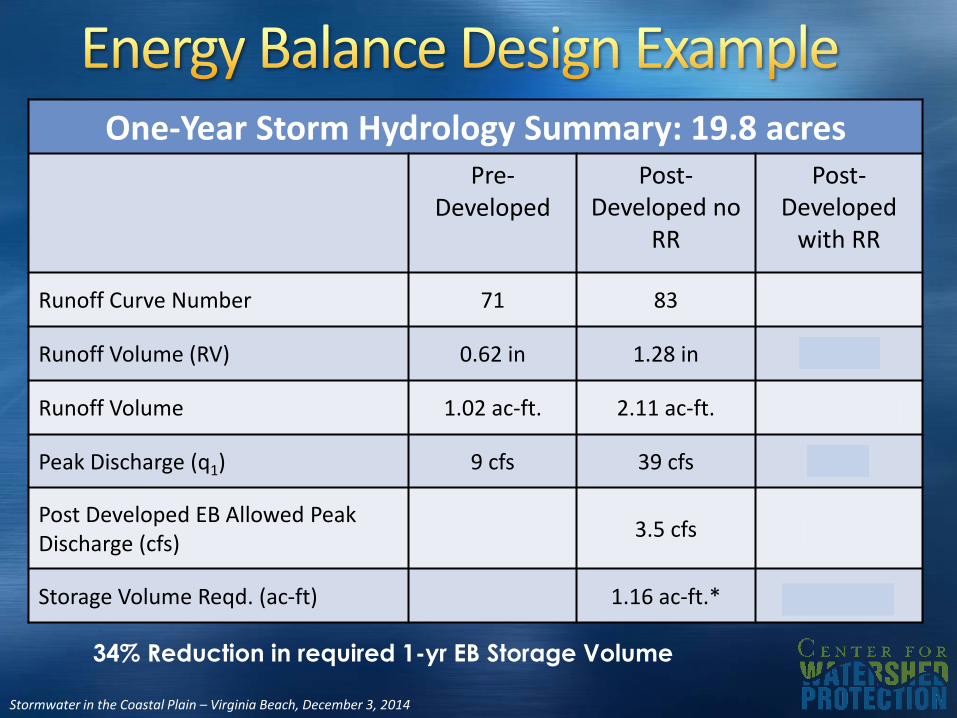
One-Year Storm Hydrology Summary: 19.8 acresPre-
DevelopedPost-
Developed no RR
Post-Developed
with RR
Runoff Curve Number 71 83 77
Runoff Volume (RV) 0.62 in 1.28 in 0.96 in
Runoff Volume 1.02 ac-ft. 2.11 ac-ft. 1.58 ac-ft.
Peak Discharge (q1) 9 cfs 39 cfs 27 cfs
Post Developed EB Allowed Peak Discharge (cfs)
3.5 cfs 4.7 cfs
Storage Volume Reqd. (ac-ft) 1.16 ac-ft.* 0.76 ac-ft.*
34% Reduction in required 1-yr EB Storage Volume

Stormwater in the Coastal Plain – Virginia Beach, December 3, 2014
No RR shown; 34% reduction in volume!
Stormwater in the Coastal Plain – Virginia Beach, December 3, 2014
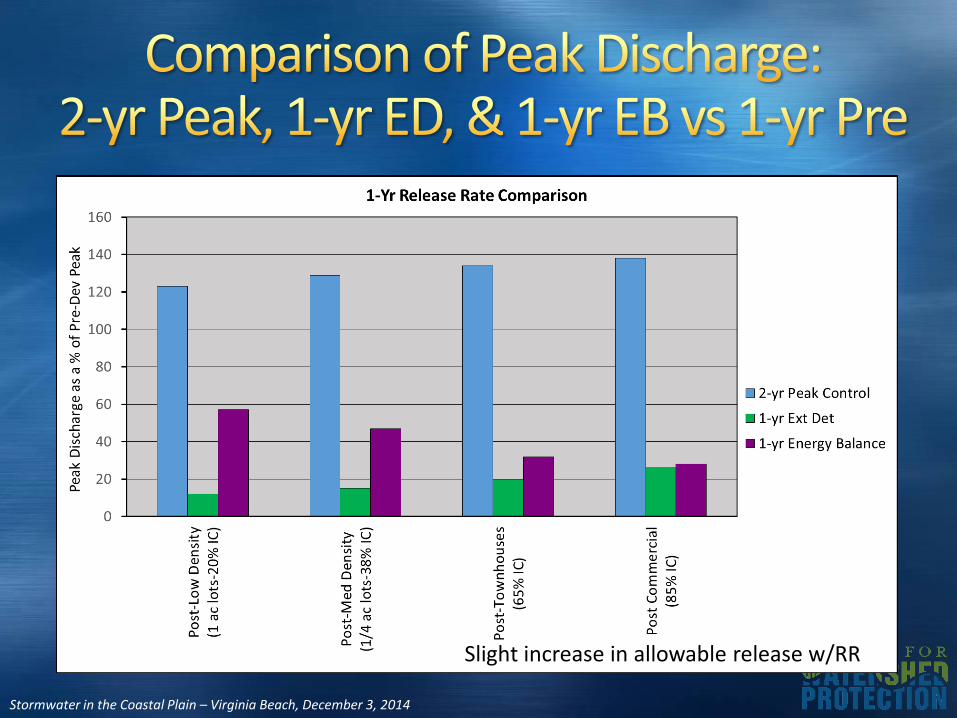
Slight increase in allowable release w/RR
Stormwater in the Coastal Plain – Virginia Beach, December 3, 2014
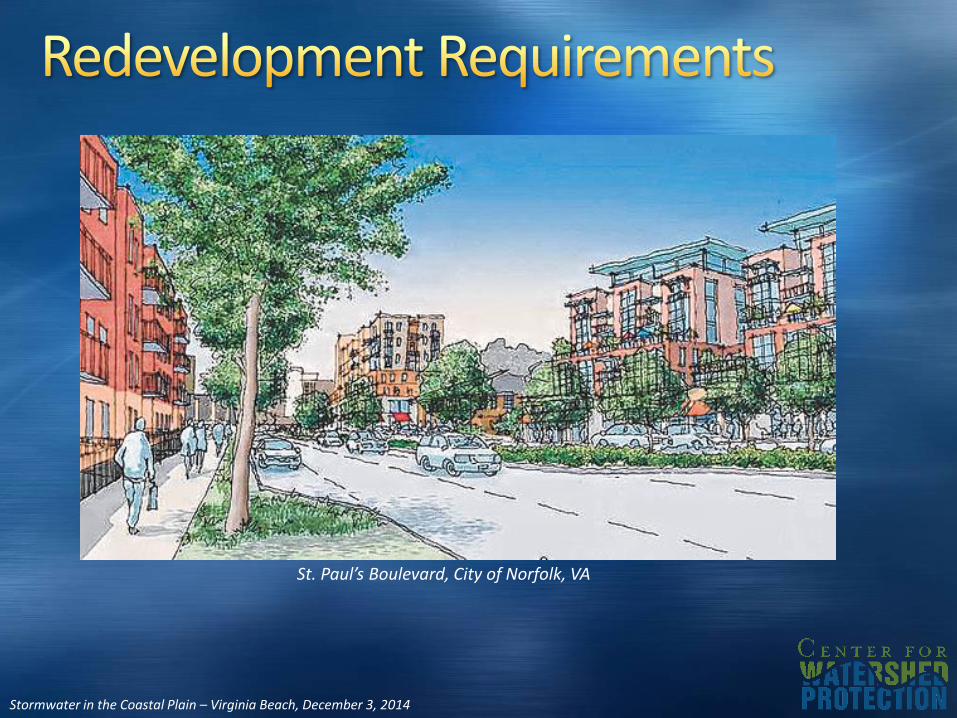
St. Paul’s Boulevard, City of Norfolk, VA
Stormwater in the Coastal Plain – Virginia Beach, December 3, 2014
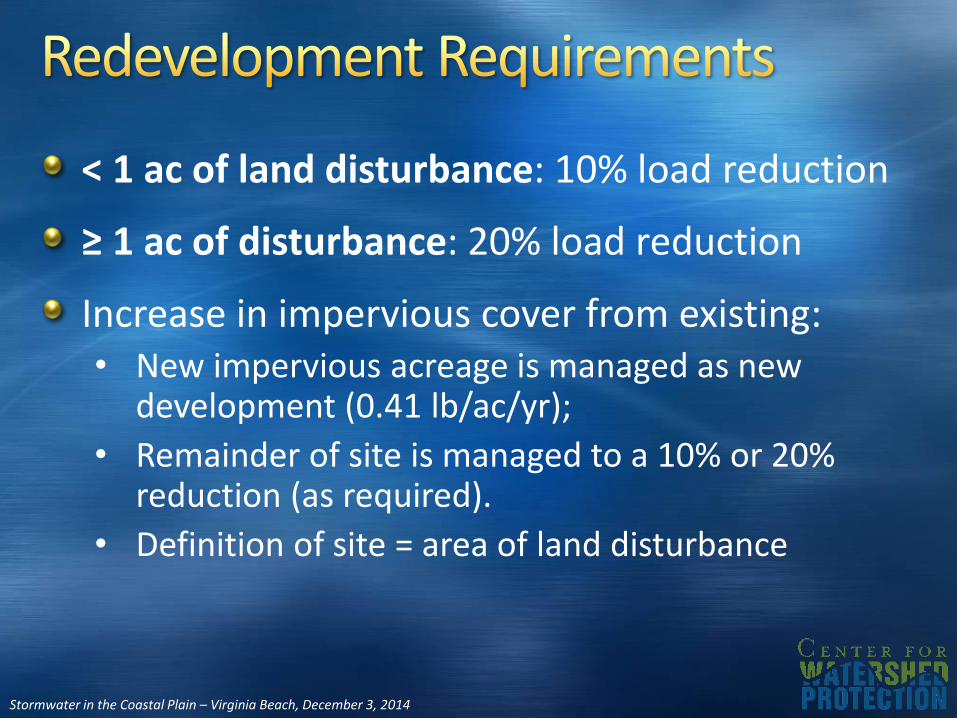
< 1 ac of land disturbance: 10% load reduction
≥ 1 ac of disturbance: 20% load reduction
Increase in impervious cover from existing:• New impervious acreage is managed as new
development (0.41 lb/ac/yr);
• Remainder of site is managed to a 10% or 20% reduction (as required).
• Definition of site = area of land disturbance
Stormwater in the Coastal Plain – Virginia Beach, December 3, 2014
Stormwater in the Coastal Plain – Virginia Beach, December 3, 2014
Stormwater in the Coastal Plain – Virginia Beach, December 3, 2014
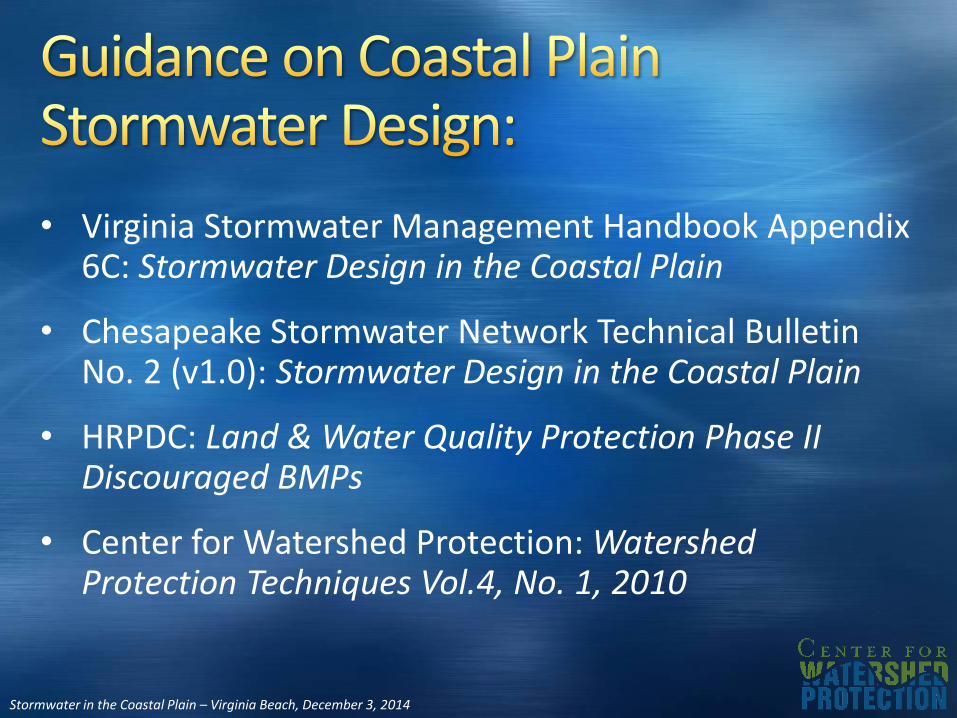
• Virginia Stormwater Management Handbook Appendix 6C: Stormwater Design in the Coastal Plain
• Chesapeake Stormwater Network Technical Bulletin No. 2 (v1.0): Stormwater Design in the Coastal Plain
• HRPDC: Land & Water Quality Protection Phase II Discouraged BMPs
• Center for Watershed Protection: Watershed Protection Techniques Vol.4, No. 1, 2010
Stormwater in the Coastal Plain – Virginia Beach, December 3, 2014
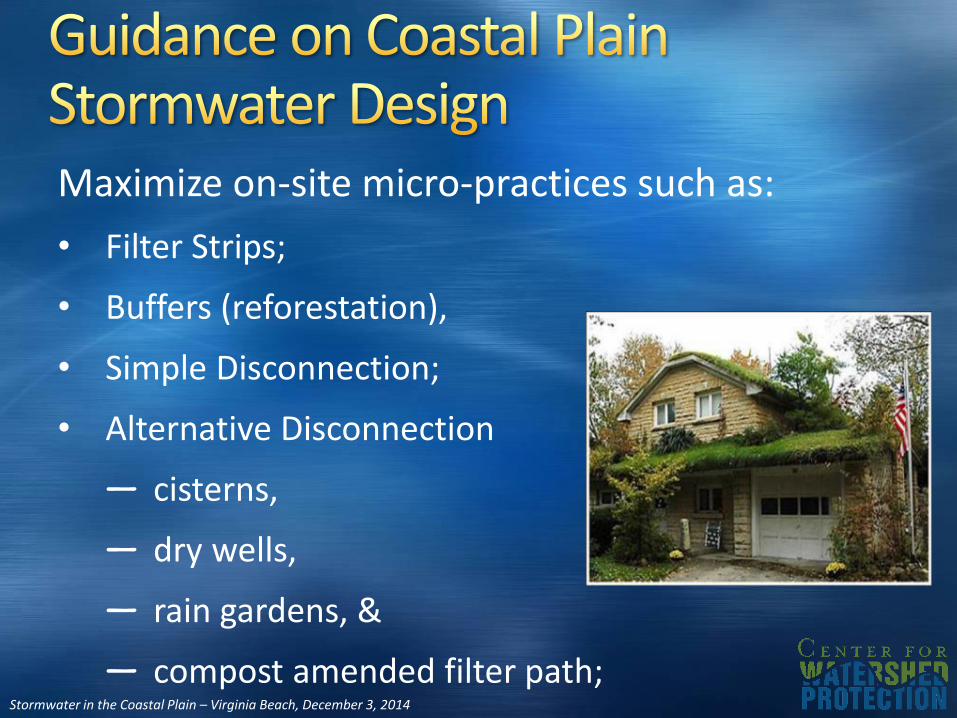
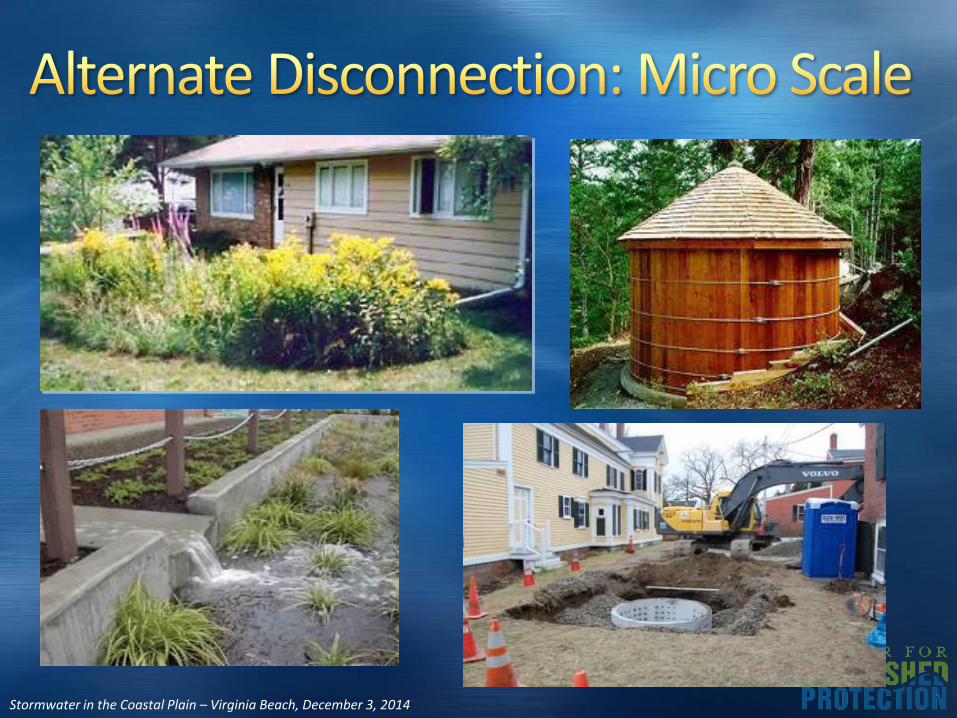
Maximize on-site micro-practices such as:
• Filter Strips;
• Buffers (reforestation),
• Simple Disconnection;
• Alternative Disconnection
— cisterns,
— dry wells,
— rain gardens, &
— compost amended filter path;
Stormwater in the Coastal Plain – Virginia Beach, December 3, 2014
• Promote de-nitrification (create adjacent anaerobic and aerobic zones);
• Avoid infiltration in areas with high water table;
• Utilize native plants;
• Create a rooftop to buffer in-line treatment train; and
• Relax some design criteria to keep practice depths shallow!
Stormwater in the Coastal Plain – Virginia Beach, December 3, 2014
Maximum bacteria removal:
— long residence time and light exposure for coliform die off;
— Reduce turf around open water to discourage geese and waterfowl;
— Use shallow wetlands and benches to create natural micro-predators;
— Minimize resuspension of bottom sediments
Stormwater in the Coastal Plain – Virginia Beach, December 3, 2014
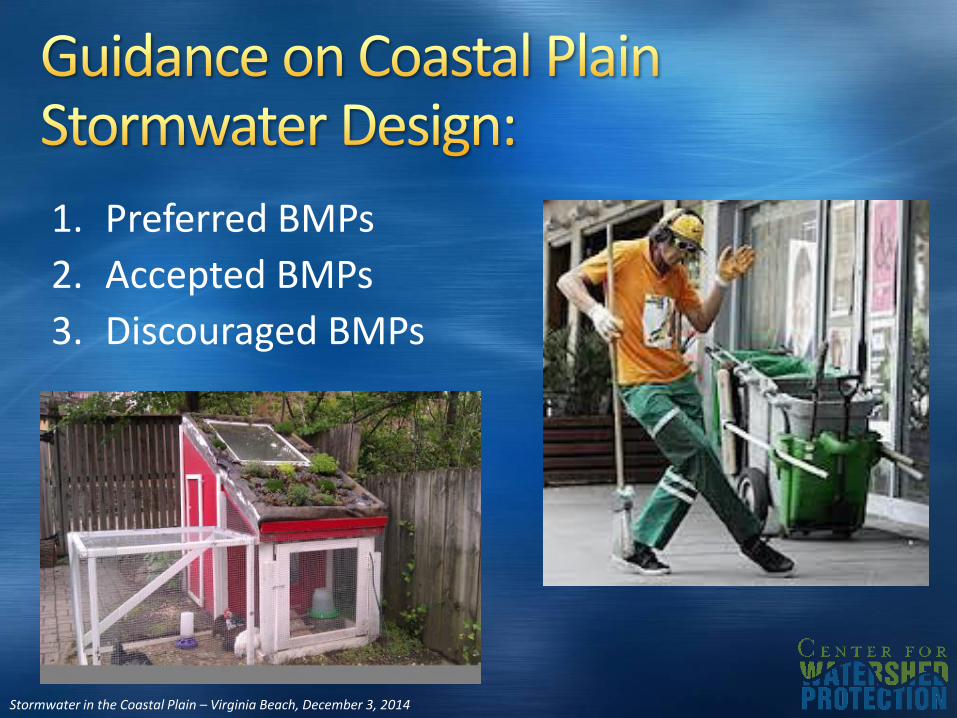
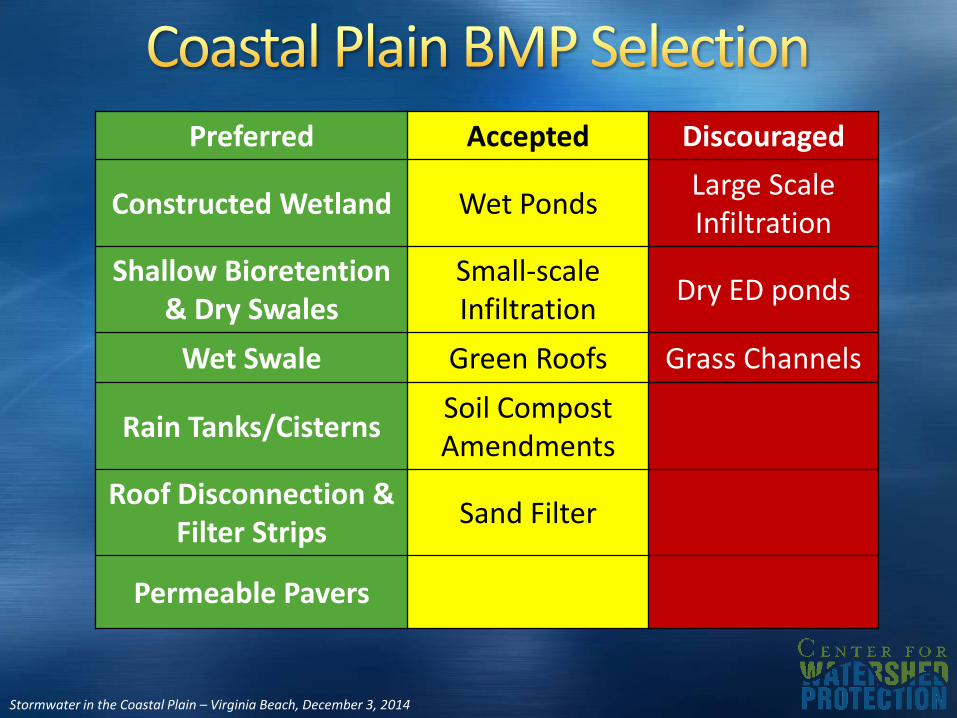
1. Preferred BMPs
2. Accepted BMPs
3. Discouraged BMPs
Stormwater in the Coastal Plain – Virginia Beach, December 3, 2014
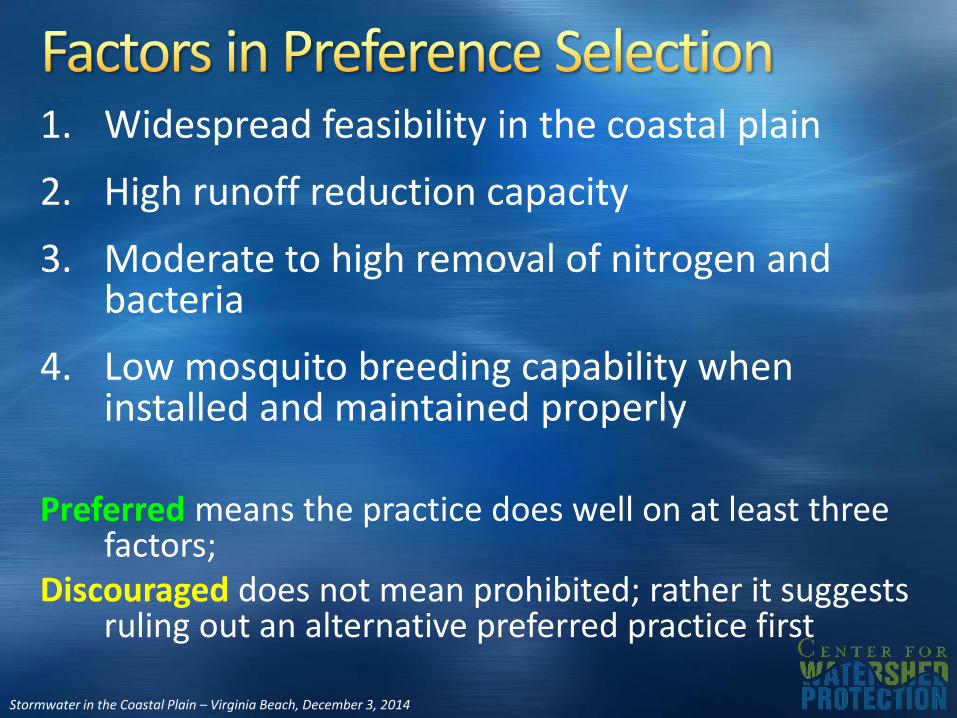
1. Widespread feasibility in the coastal plain
2. High runoff reduction capacity
3. Moderate to high removal of nitrogen and bacteria
4. Low mosquito breeding capability when installed and maintained properly
Preferred means the practice does well on at least three factors;
Discouraged does not mean prohibited; rather it suggests ruling out an alternative preferred practice first
Stormwater in the Coastal Plain – Virginia Beach, December 3, 2014
Preferred Accepted Discouraged
Constructed Wetland Wet PondsLarge Scale Infiltration
Shallow Bioretention & Dry Swales
Small-scale Infiltration
Dry ED ponds
Wet Swale Green Roofs Grass Channels
Rain Tanks/CisternsSoil Compost Amendments
Roof Disconnection & Filter Strips
Sand Filter
Permeable Pavers
Stormwater in the Coastal Plain – Virginia Beach, December 3, 2014
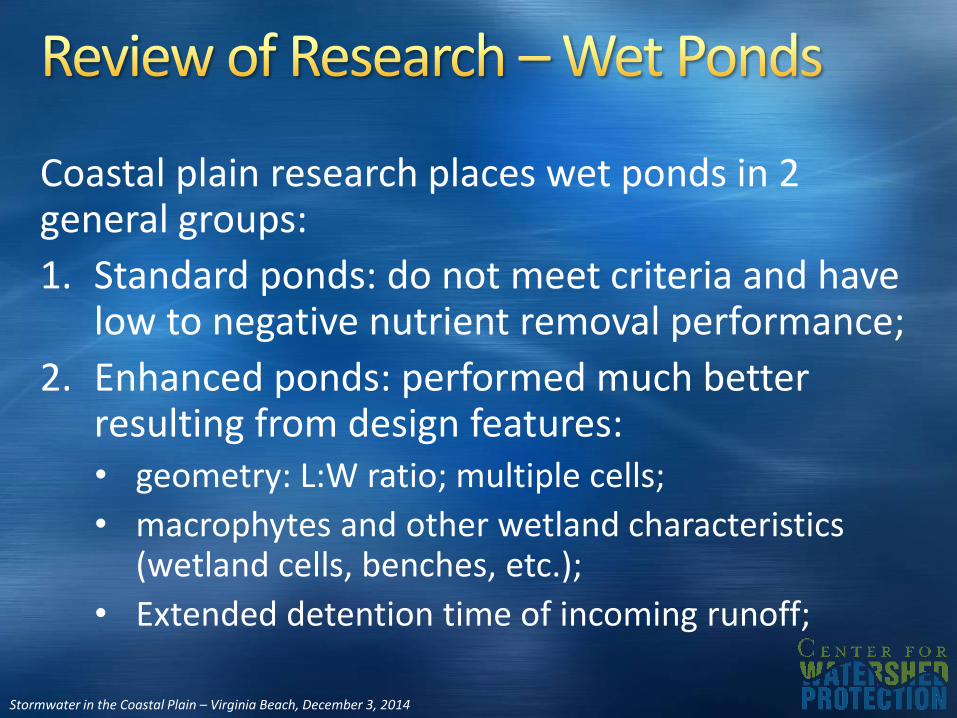
Coastal plain research places wet ponds in 2 general groups:
1. Standard ponds: do not meet criteria and have low to negative nutrient removal performance;
2. Enhanced ponds: performed much better resulting from design features: • geometry: L:W ratio; multiple cells;
• macrophytes and other wetland characteristics (wetland cells, benches, etc.);
• Extended detention time of incoming runoff;
Stormwater in the Coastal Plain – Virginia Beach, December 3, 2014
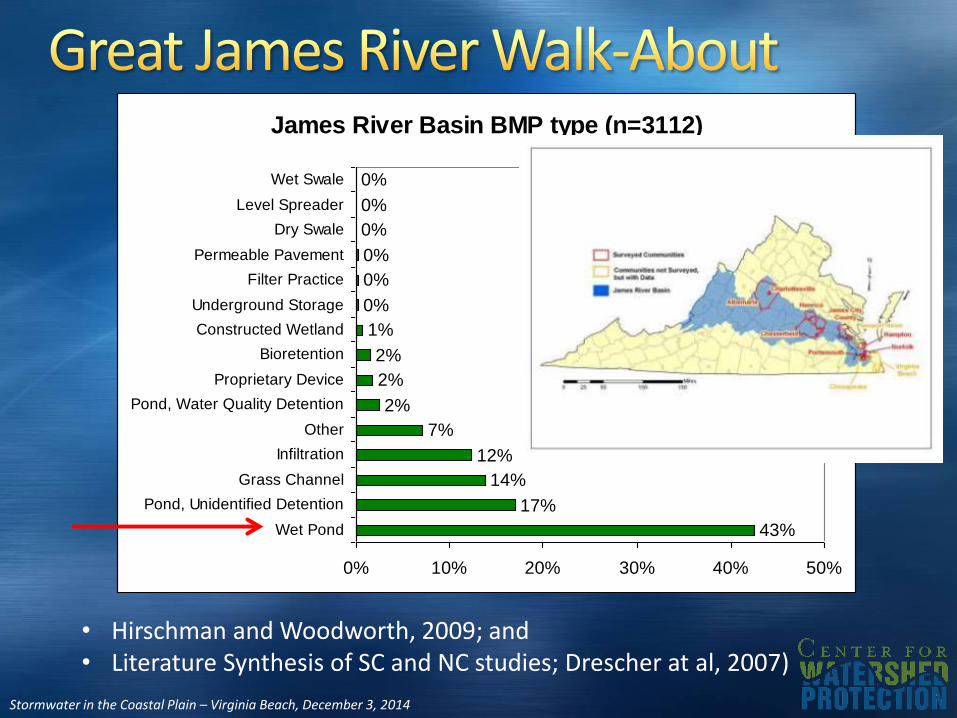
James River Basin BMP type (n=3112)
43%
17%
14%
12%
7%
2%
2%
2%
1%
0%
0%
0%
0%
0%
0%
0% 10% 20% 30% 40% 50%
Wet Pond
Pond, Unidentified Detention
Grass Channel
Infiltration
Other
Pond, Water Quality Detention
Proprietary Device
Bioretention
Constructed Wetland
Underground Storage
Filter Practice
Permeable Pavement
Dry Swale
Level Spreader
Wet Swale
• Hirschman and Woodworth, 2009; and • Literature Synthesis of SC and NC studies; Drescher at al, 2007)
Stormwater in the Coastal Plain – Virginia Beach, December 3, 2014
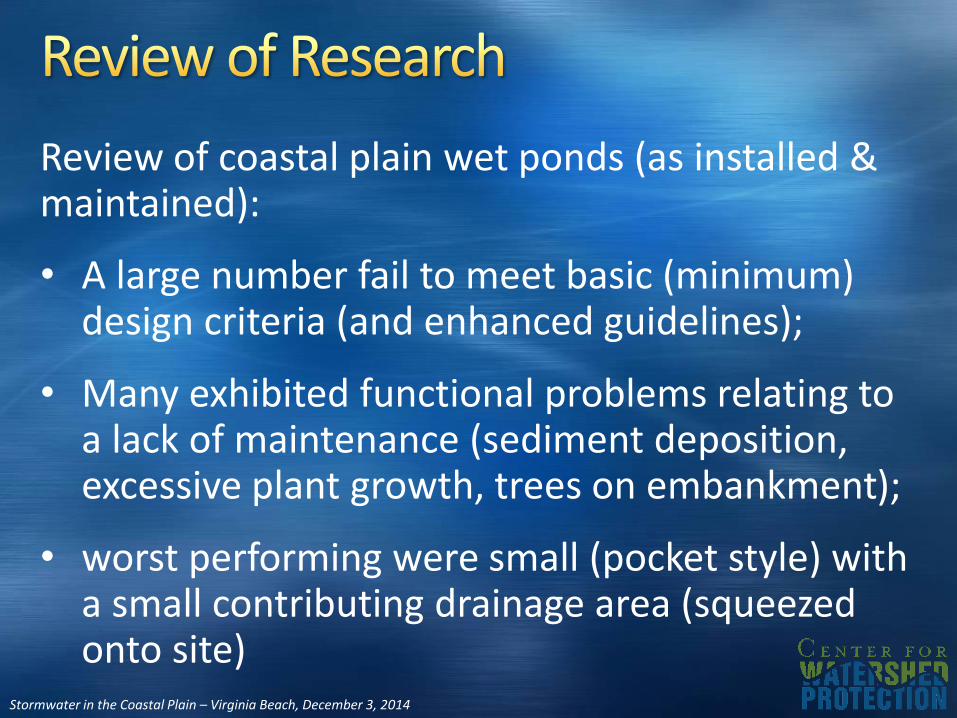
Review of coastal plain wet ponds (as installed & maintained):
• A large number fail to meet basic (minimum) design criteria (and enhanced guidelines);
• Many exhibited functional problems relating to a lack of maintenance (sediment deposition, excessive plant growth, trees on embankment);
• worst performing were small (pocket style) with a small contributing drainage area (squeezed onto site)
Stormwater in the Coastal Plain – Virginia Beach, December 3, 2014
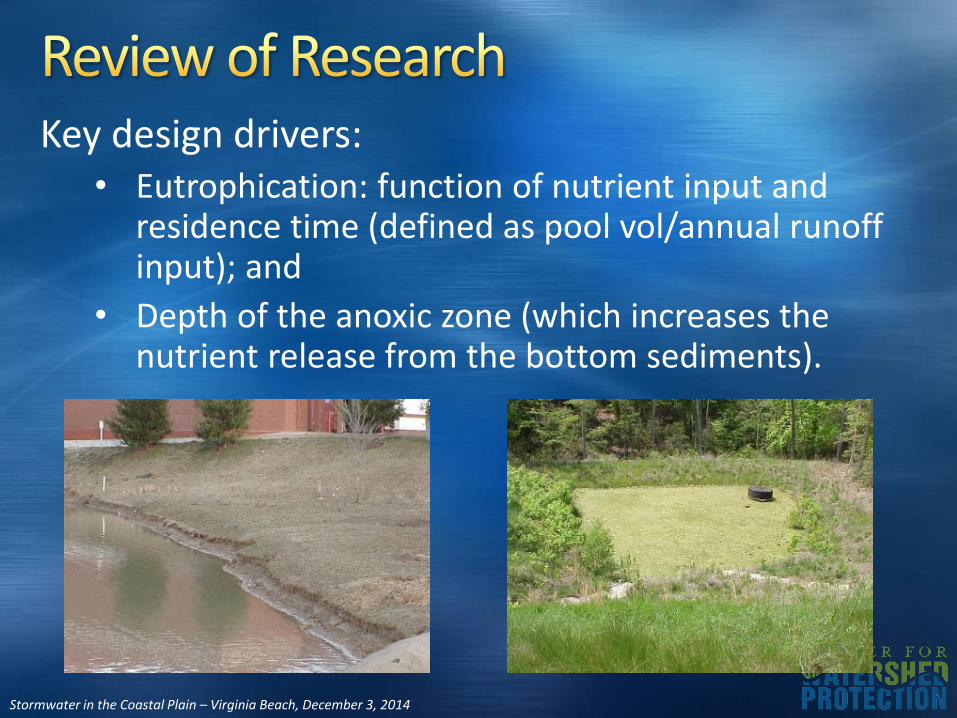
Key design drivers: • Eutrophication: function of nutrient input and
residence time (defined as pool vol/annual runoff input); and
• Depth of the anoxic zone (which increases the nutrient release from the bottom sediments).
Stormwater in the Coastal Plain – Virginia Beach, December 3, 2014
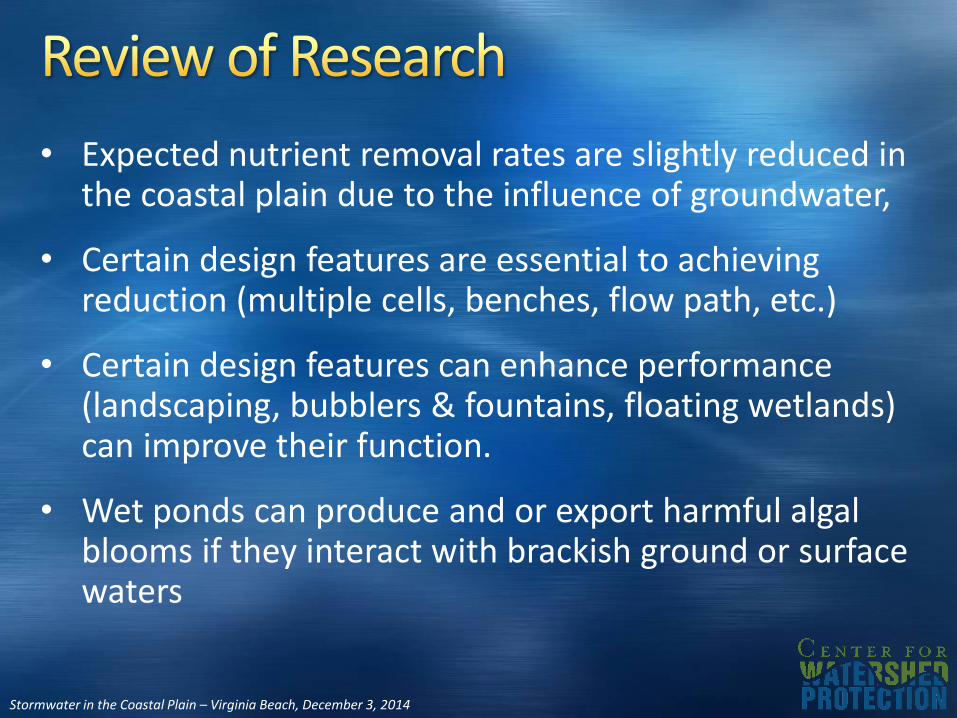
• Expected nutrient removal rates are slightly reduced in the coastal plain due to the influence of groundwater,
• Certain design features are essential to achieving reduction (multiple cells, benches, flow path, etc.)
• Certain design features can enhance performance (landscaping, bubblers & fountains, floating wetlands) can improve their function.
• Wet ponds can produce and or export harmful algal blooms if they interact with brackish ground or surface waters
Stormwater in the Coastal Plain – Virginia Beach, December 3, 2014
Stormwater in the Coastal Plain – Virginia Beach, December 3, 2014
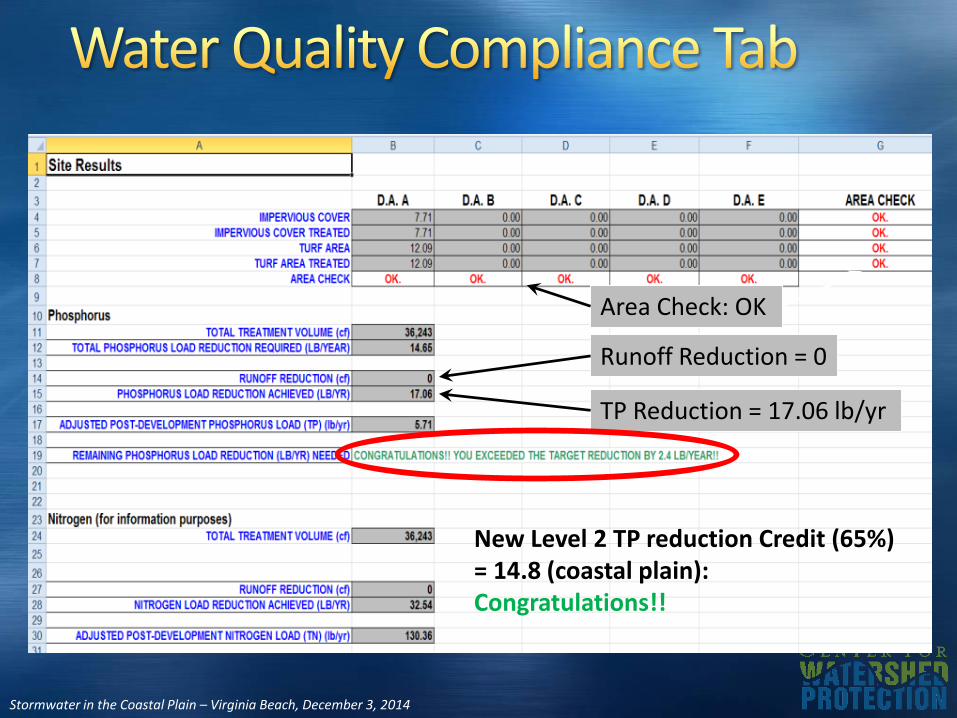
Runoff Reduction = 0
TP Reduction = 17.06 lb/yr
Area Check: OK
New Level 2 TP reduction Credit (65%)= 14.8 (coastal plain):Congratulations!!
Stormwater in the Coastal Plain – Virginia Beach, December 3, 2014
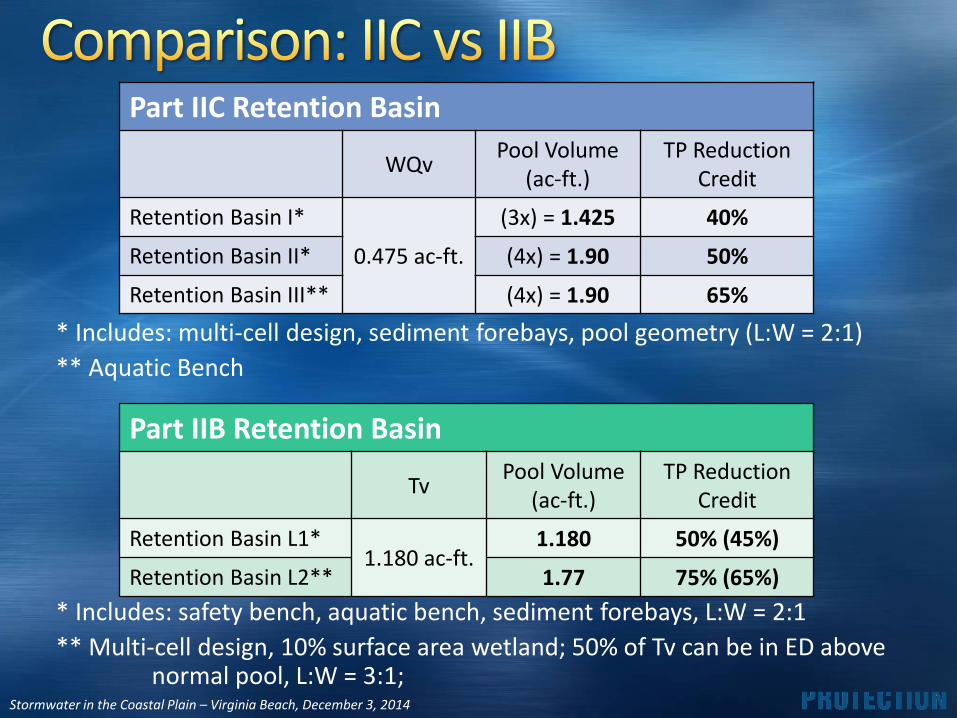
* Includes: multi-cell design, sediment forebays, pool geometry (L:W = 2:1)
** Aquatic Bench
Part IIC Retention Basin
WQvPool Volume
(ac-ft.)TP Reduction
Credit
Retention Basin I*
0.475 ac-ft.
(3x) = 1.425 40%
Retention Basin II* (4x) = 1.90 50%
Retention Basin III** (4x) = 1.90 65%
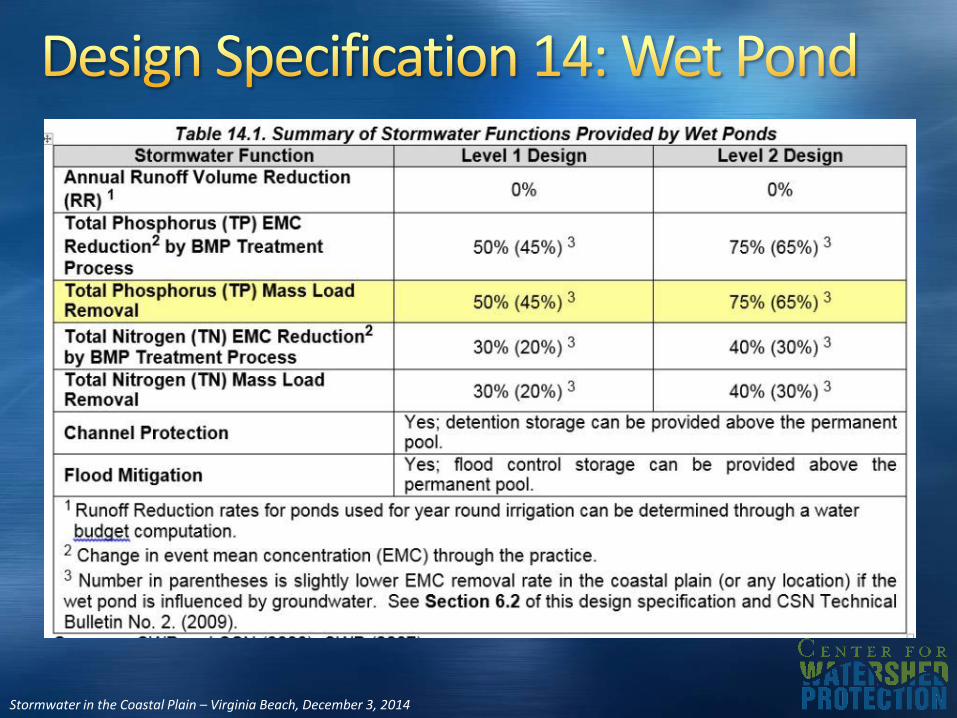
Part IIB Retention Basin
TvPool Volume
(ac-ft.)TP Reduction
Credit
Retention Basin L1*1.180 ac-ft.
1.180 50% (45%)
Retention Basin L2** 1.77 75% (65%)
* Includes: safety bench, aquatic bench, sediment forebays, L:W = 2:1
** Multi-cell design, 10% surface area wetland; 50% of Tv can be in ED above normal pool, L:W = 3:1;
Stormwater in the Coastal Plain – Virginia Beach, December 3, 2014

Stormwater in the Coastal Plain – Virginia Beach, December 3, 2014
Stormwater in the Coastal Plain – Virginia Beach, December 3, 2014
Stormwater in the Coastal Plain – Virginia Beach, December 3, 2014
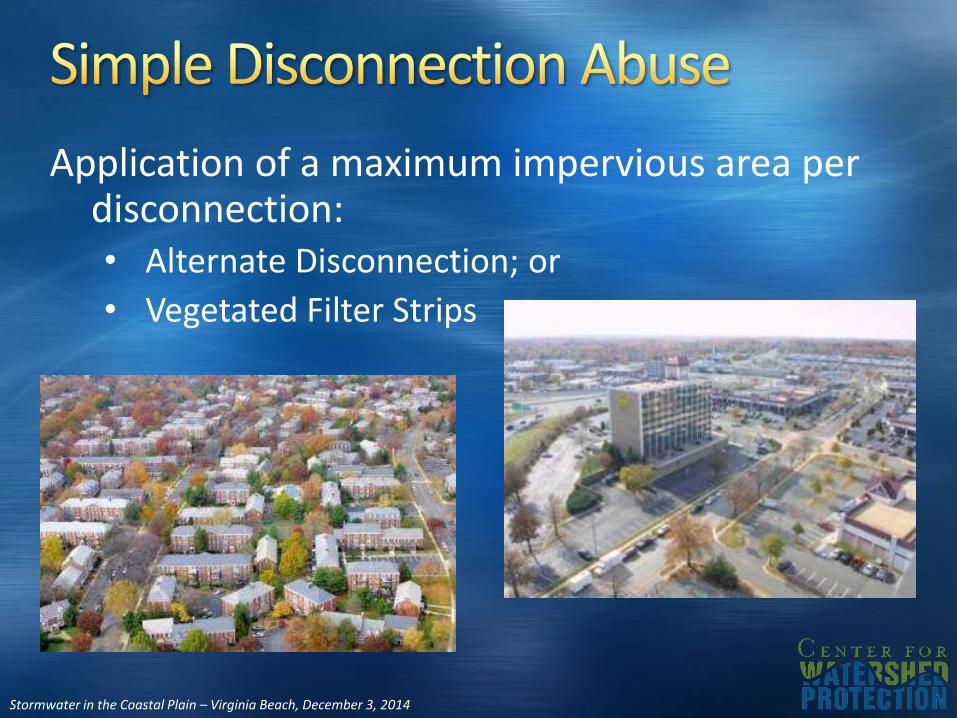
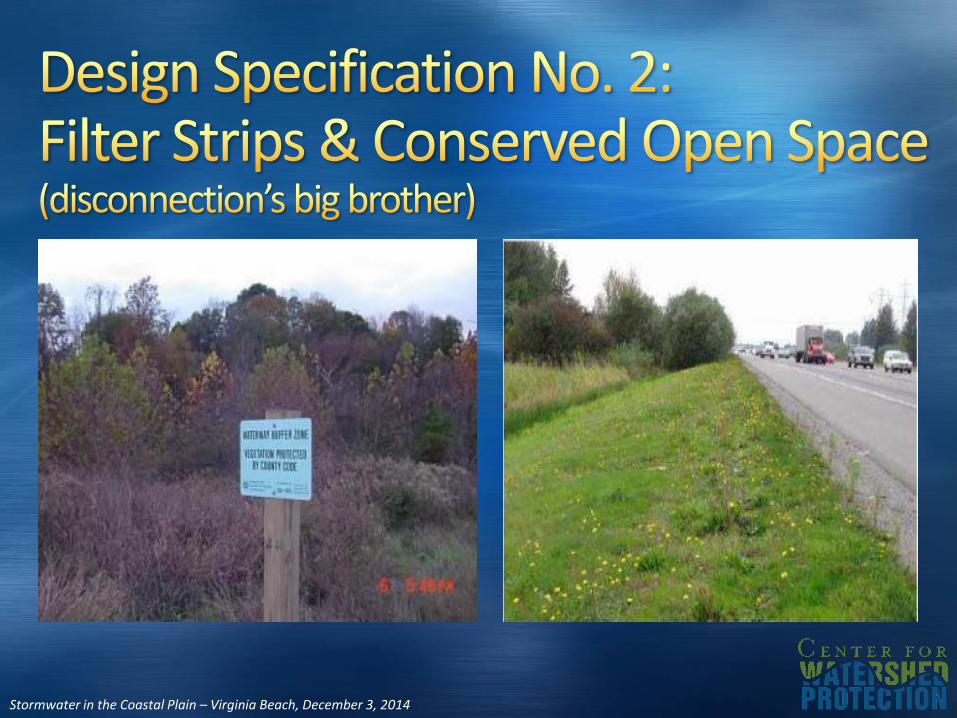
Application of a maximum impervious area per disconnection:• Alternate Disconnection; or
• Vegetated Filter Strips
Stormwater in the Coastal Plain – Virginia Beach, December 3, 2014
Stormwater in the Coastal Plain – Virginia Beach, December 3, 2014
Stormwater in the Coastal Plain – Virginia Beach, December 3, 2014
Stormwater in the Coastal Plain – Virginia Beach, December 3, 2014
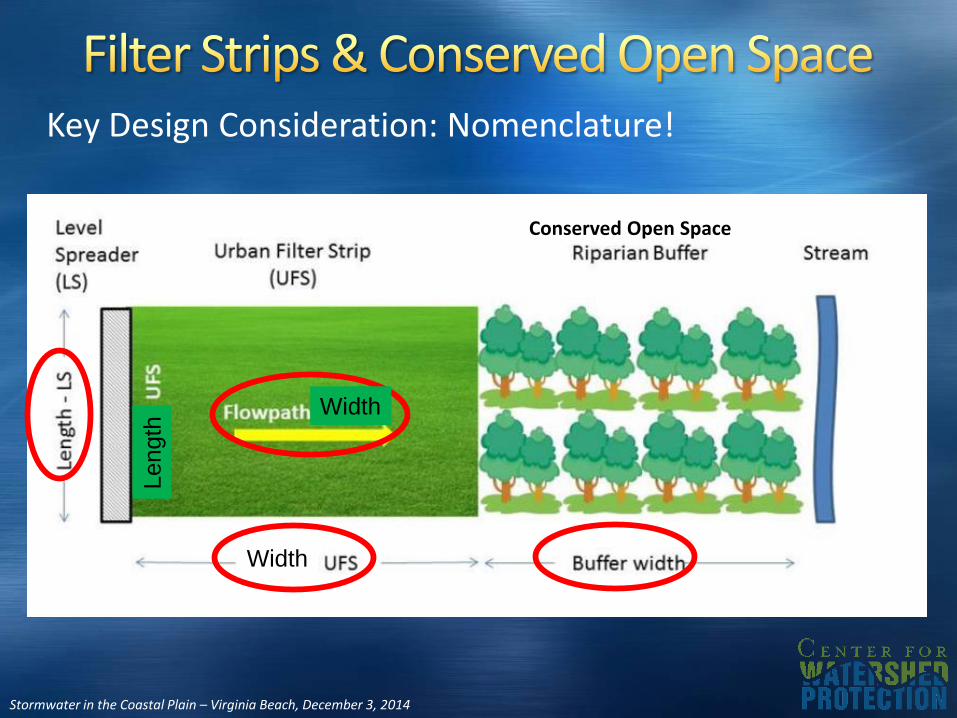
Key Design Consideration: Nomenclature!
Conserved Open Space
Width
Width
Length
Stormwater in the Coastal Plain – Virginia Beach, December 3, 2014
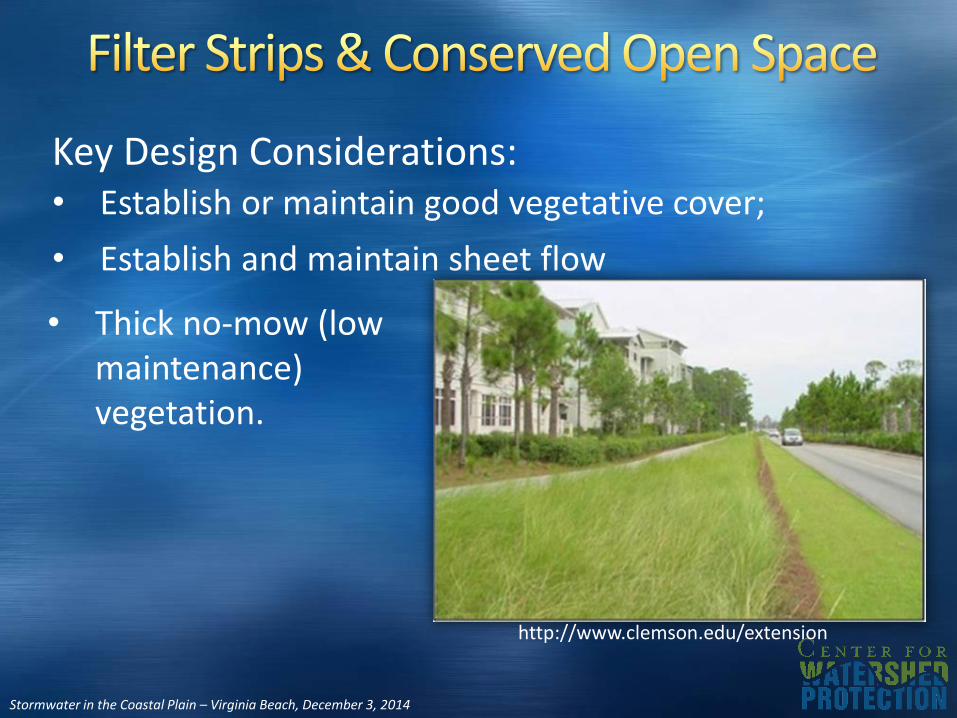
Key Design Considerations:• Establish or maintain good vegetative cover;
• Establish and maintain sheet flow
• Thick no-mow (low maintenance) vegetation.
http://www.clemson.edu/extension
Stormwater in the Coastal Plain – Virginia Beach, December 3, 2014
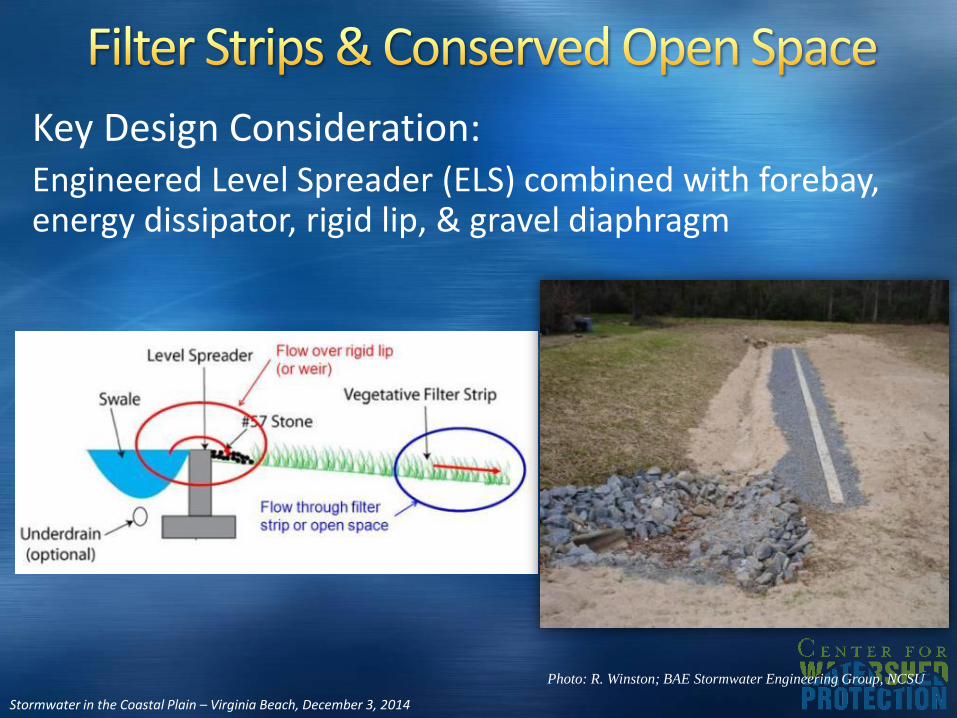
Key Design Consideration: Engineered Level Spreader (ELS) combined with forebay, energy dissipator, rigid lip, & gravel diaphragm
Photo: R. Winston; BAE Stormwater Engineering Group, NCSU
Stormwater in the Coastal Plain – Virginia Beach, December 3, 2014
Stormwater in the Coastal Plain – Virginia Beach, December 3, 2014
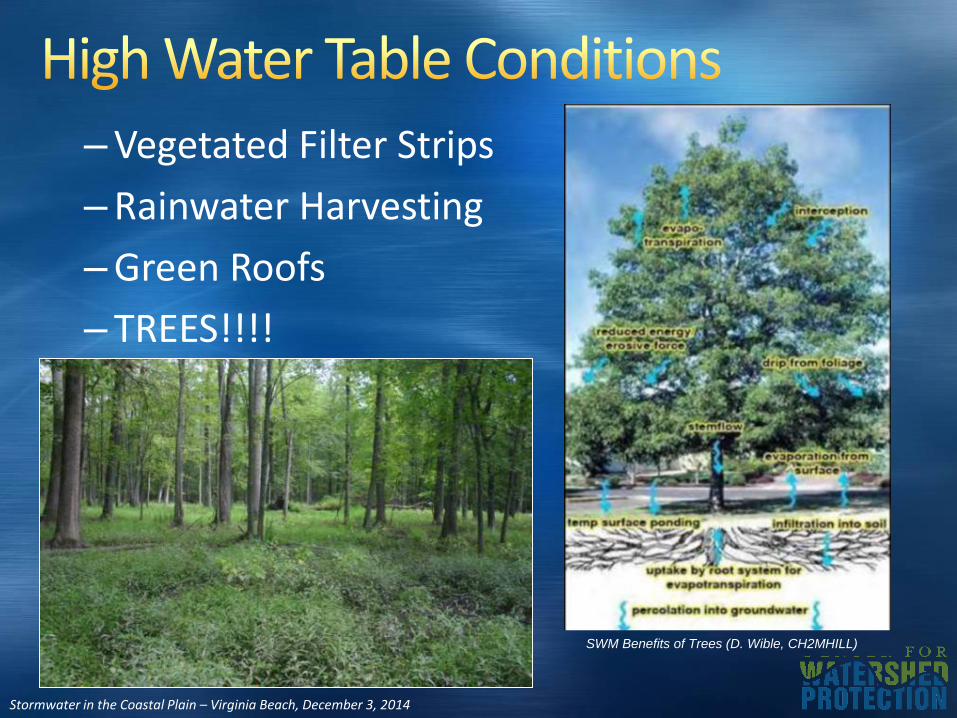
‒ Vegetated Filter Strips
‒ Rainwater Harvesting
‒ Green Roofs
‒ TREES!!!!
SWM Benefits of Trees (D. Wible, CH2MHILL)
Stormwater in the Coastal Plain – Virginia Beach, December 3, 2014
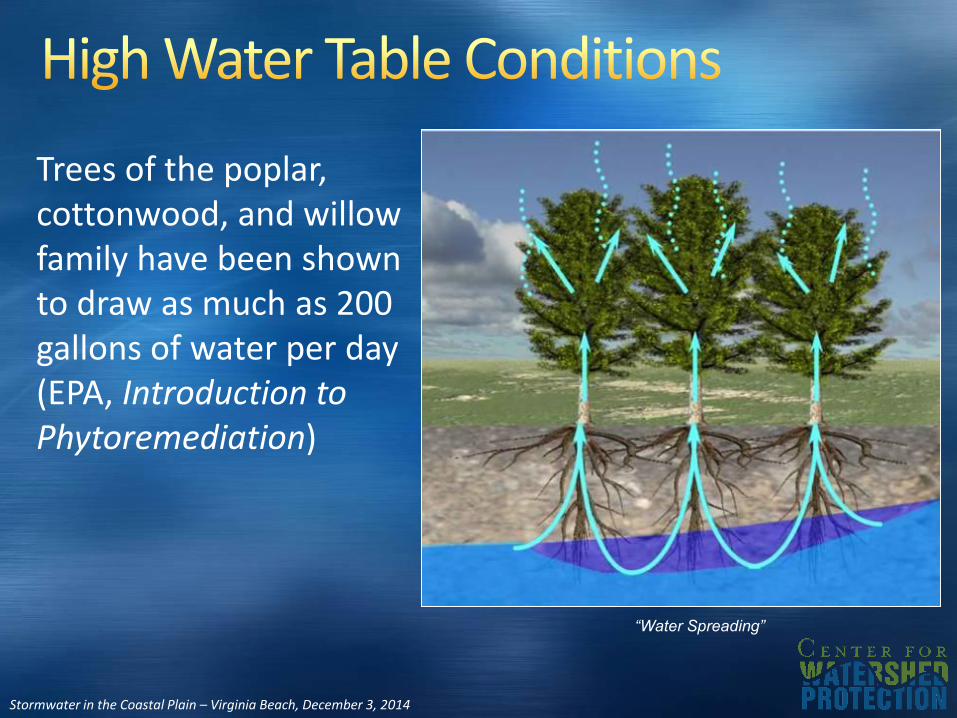
“Water Spreading”
Trees of the poplar, cottonwood, and willow family have been shown to draw as much as 200 gallons of water per day (EPA, Introduction to Phytoremediation)
Stormwater in the Coastal Plain – Virginia Beach, December 3, 2014
Stormwater in the Coastal Plain – Virginia Beach, December 3, 2014
Stormwater in the Coastal Plain – Virginia Beach, December 3, 2014
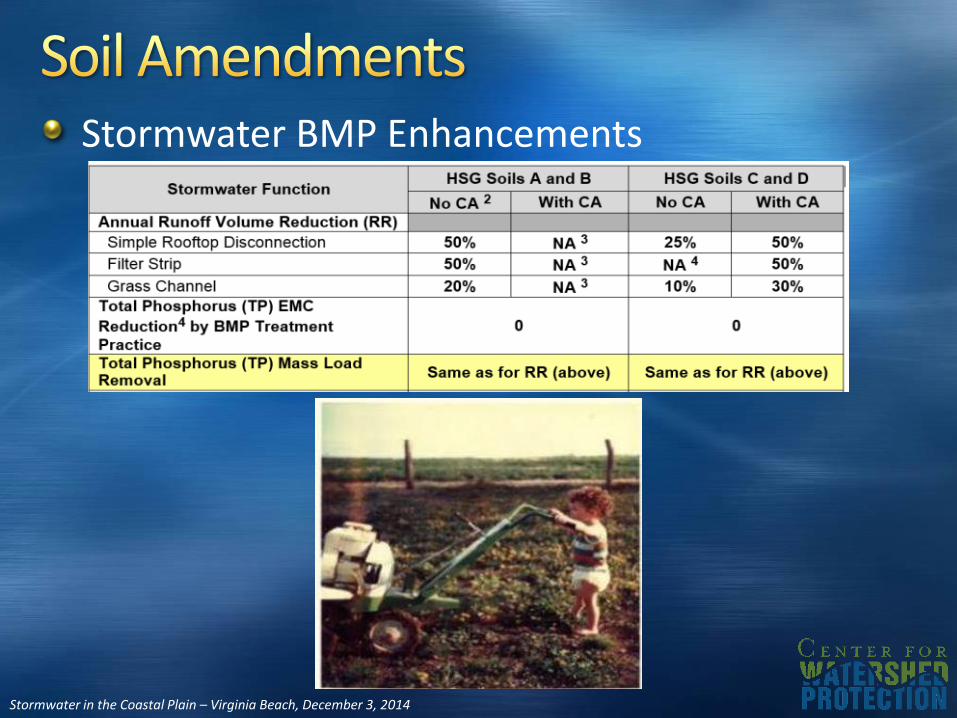
Stormwater BMP Enhancements
Stormwater in the Coastal Plain – Virginia Beach, December 3, 2014
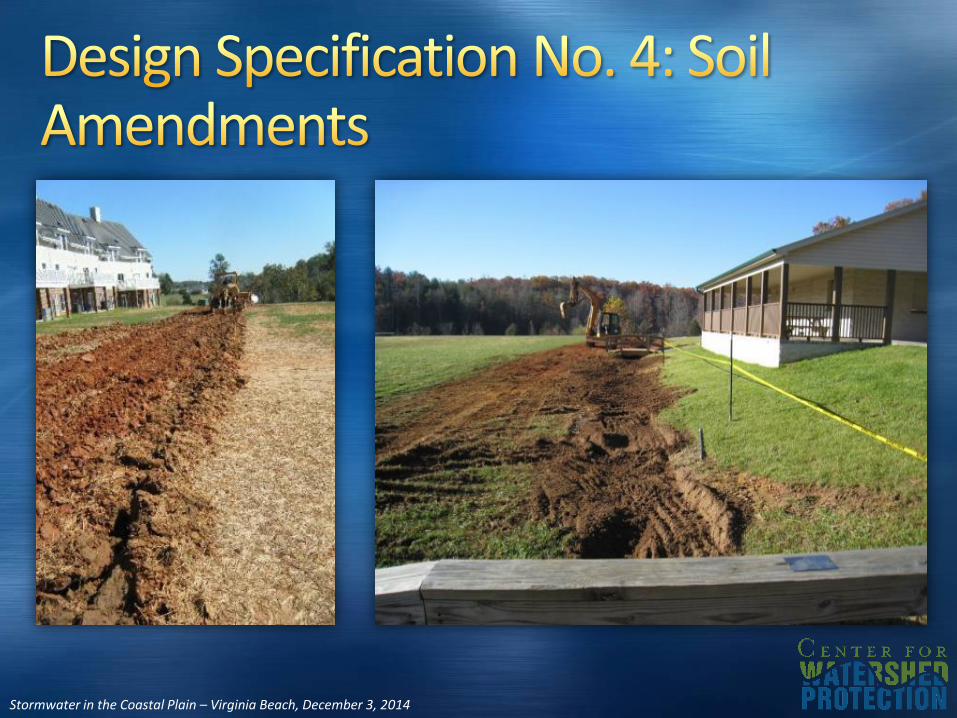
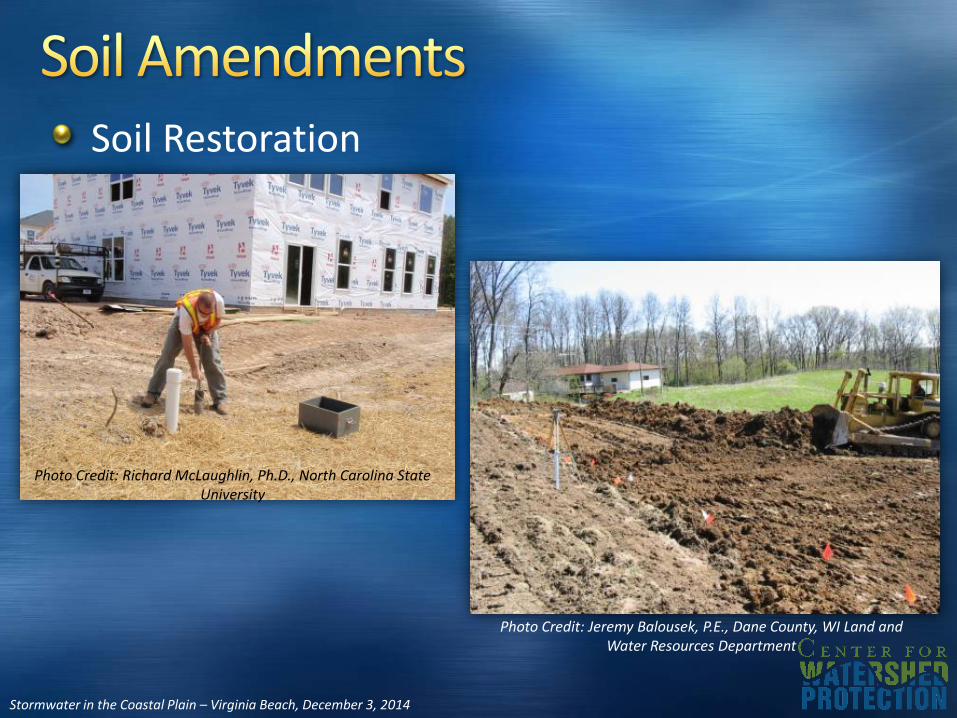
Photo Credit: Jeremy Balousek, P.E., Dane County, WI Land and Water Resources Department
Photo Credit: Richard McLaughlin, Ph.D., North Carolina State University
Soil Restoration
Stormwater in the Coastal Plain – Virginia Beach, December 3, 2014
Stormwater in the Coastal Plain – Virginia Beach, December 3, 2014
Stormwater in the Coastal Plain – Virginia Beach, December 3, 2014
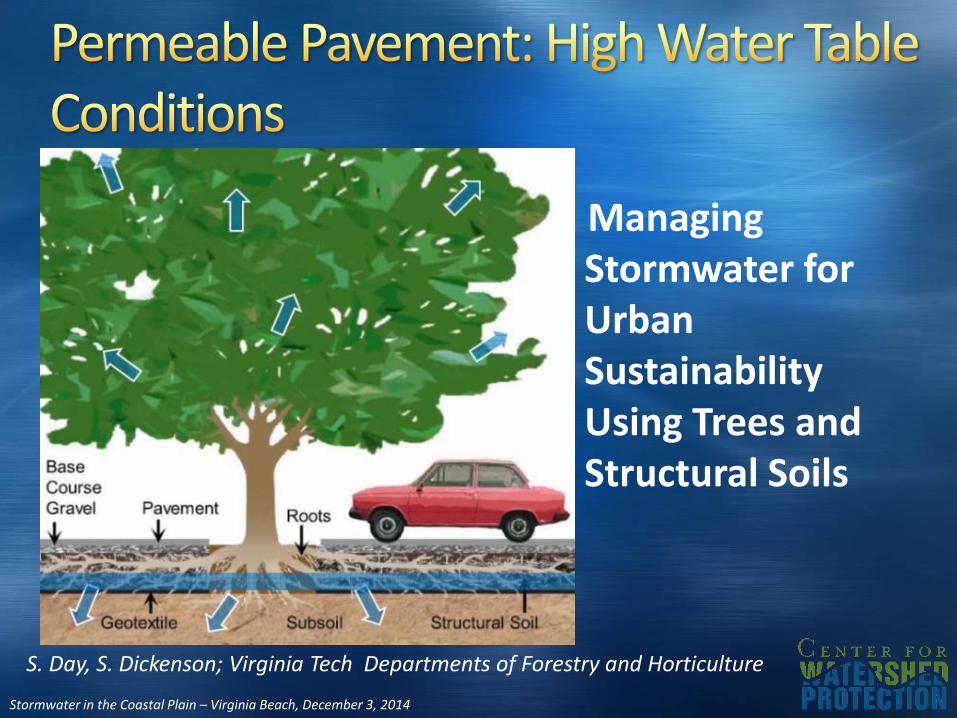
S. Day, S. Dickenson; Virginia Tech Departments of Forestry and Horticulture
Managing Stormwater for Urban Sustainability Using Trees and Structural Soils
Stormwater in the Coastal Plain – Virginia Beach, December 3, 2014
Susan Downing Day&
Sarah B. DickensonVirginia Tech
Departments of Forestry and Horticulture
Stormwater in the Coastal Plain – Virginia Beach, December 3, 2014
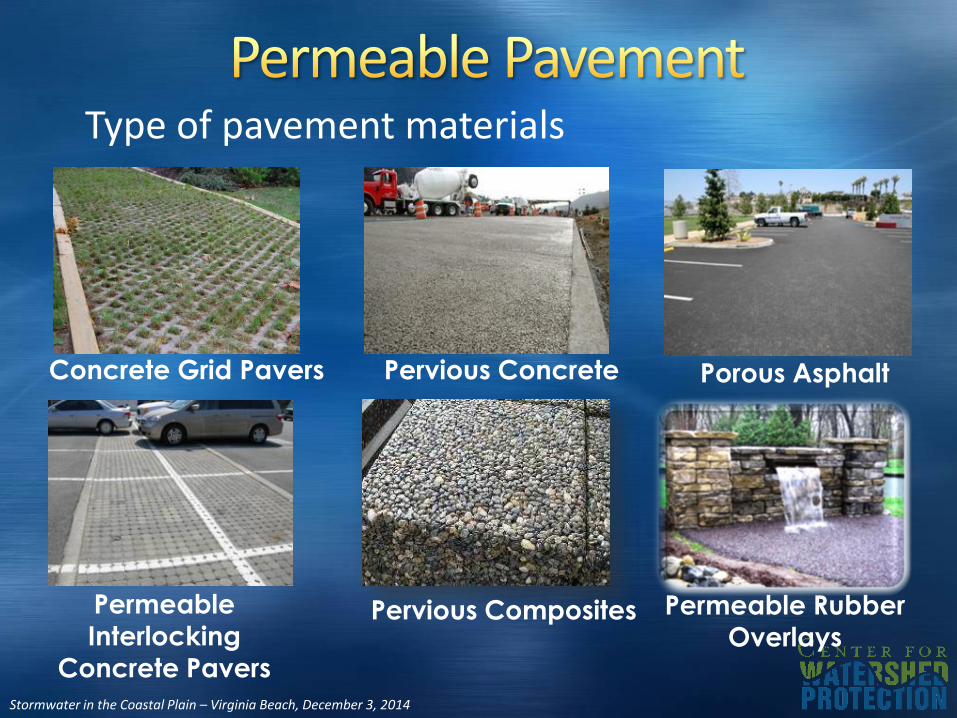
Type of pavement materials
Pervious Concrete Porous Asphalt
Permeable
Interlocking
Concrete Pavers
Concrete Grid Pavers
Pervious Composites Permeable Rubber
Overlays
Stormwater in the Coastal Plain – Virginia Beach, December 3, 2014
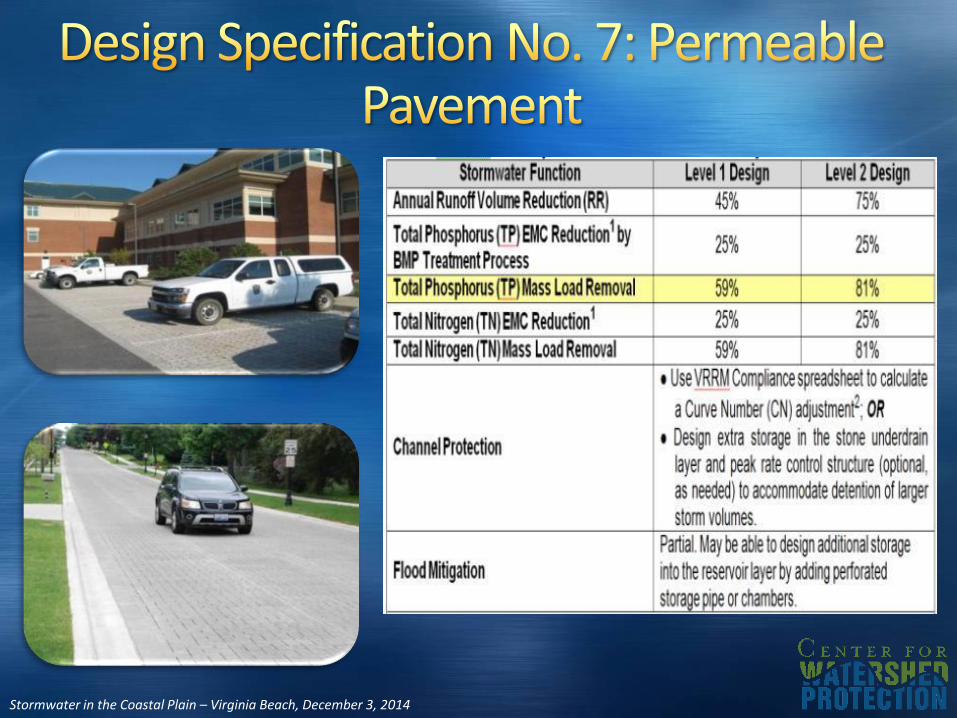
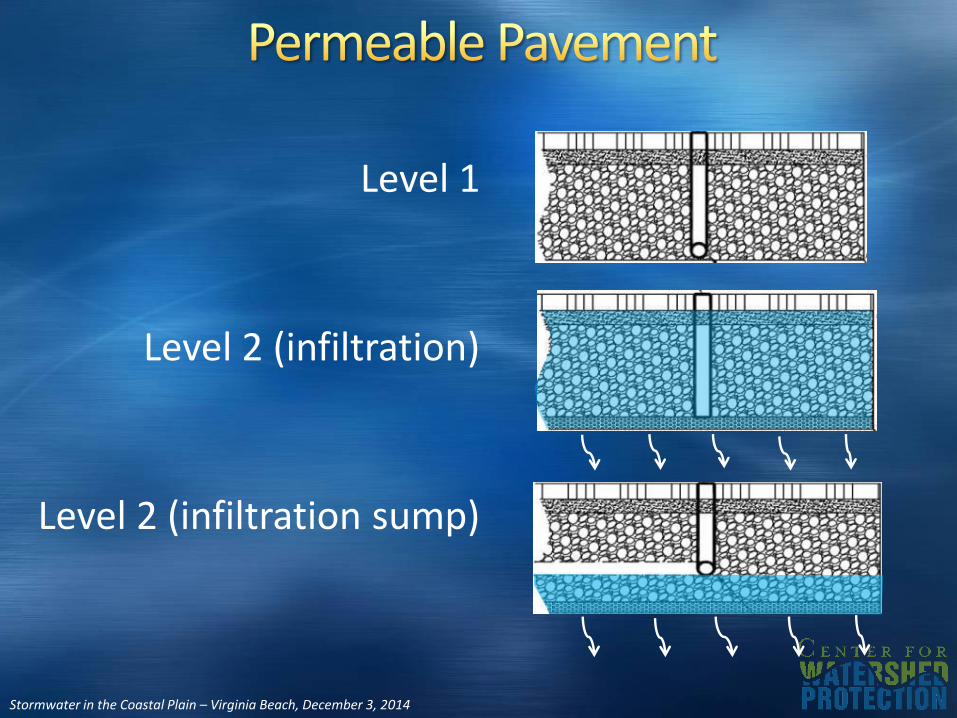
Level 1
Level 2 (infiltration)
Level 2 (infiltration sump)
Stormwater in the Coastal Plain – Virginia Beach, December 3, 2014
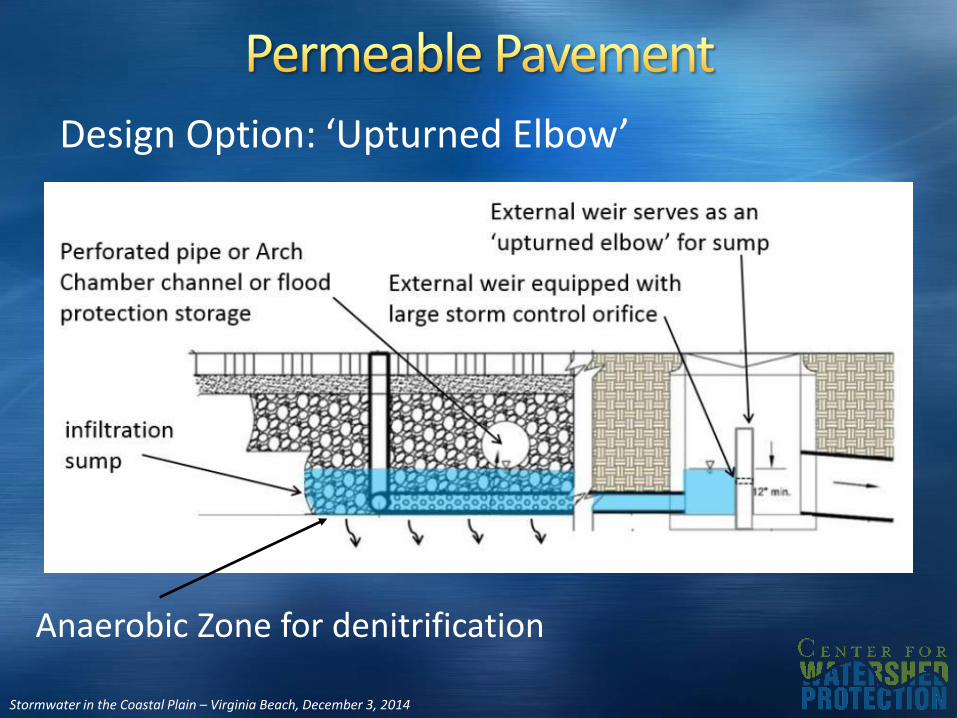
Design Option: ‘Upturned Elbow’
Anaerobic Zone for denitrification
Stormwater in the Coastal Plain – Virginia Beach, December 3, 2014
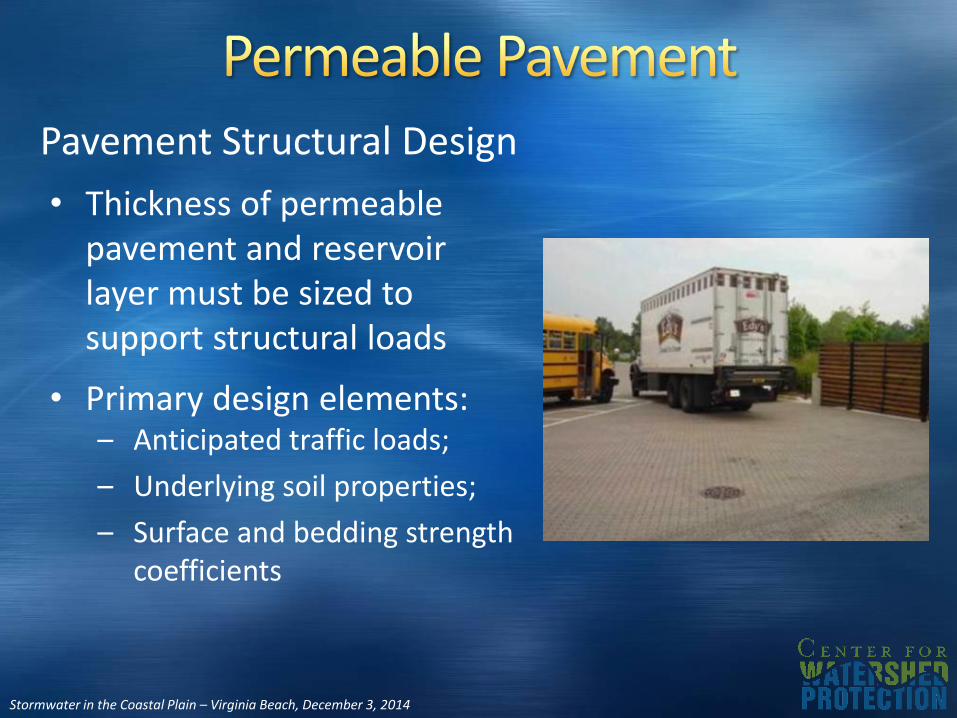
Pavement Structural Design
• Thickness of permeable pavement and reservoir layer must be sized to support structural loads
• Primary design elements: – Anticipated traffic loads;
– Underlying soil properties;
– Surface and bedding strength coefficients
Stormwater in the Coastal Plain – Virginia Beach, December 3, 2014
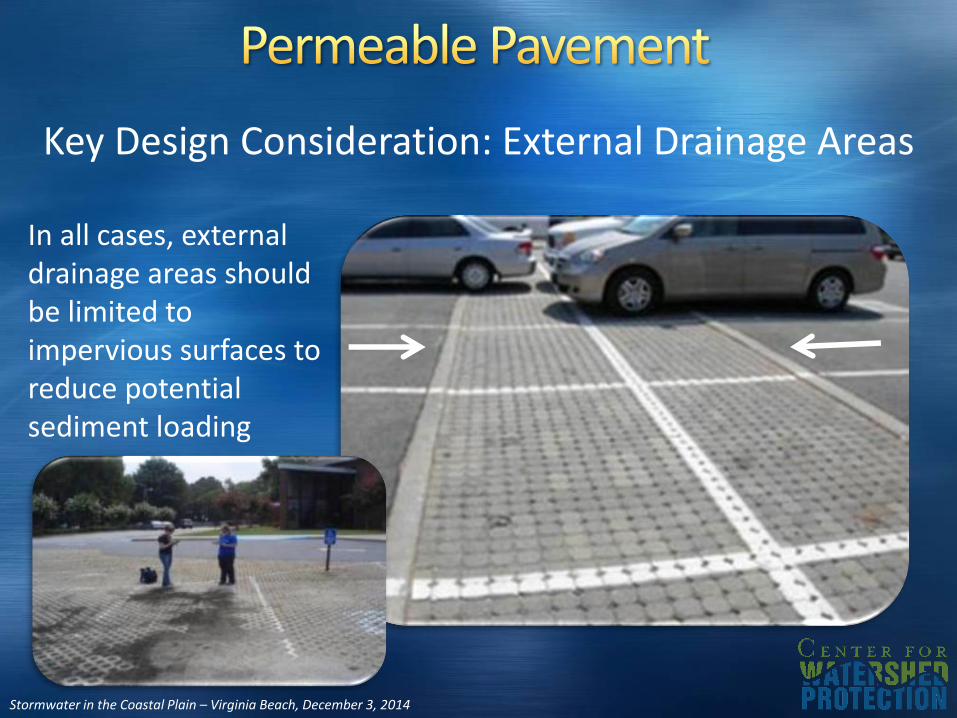
Key Design Consideration: External Drainage Areas
In all cases, external drainage areas should be limited to impervious surfaces to reduce potential sediment loading
Stormwater in the Coastal Plain – Virginia Beach, December 3, 2014
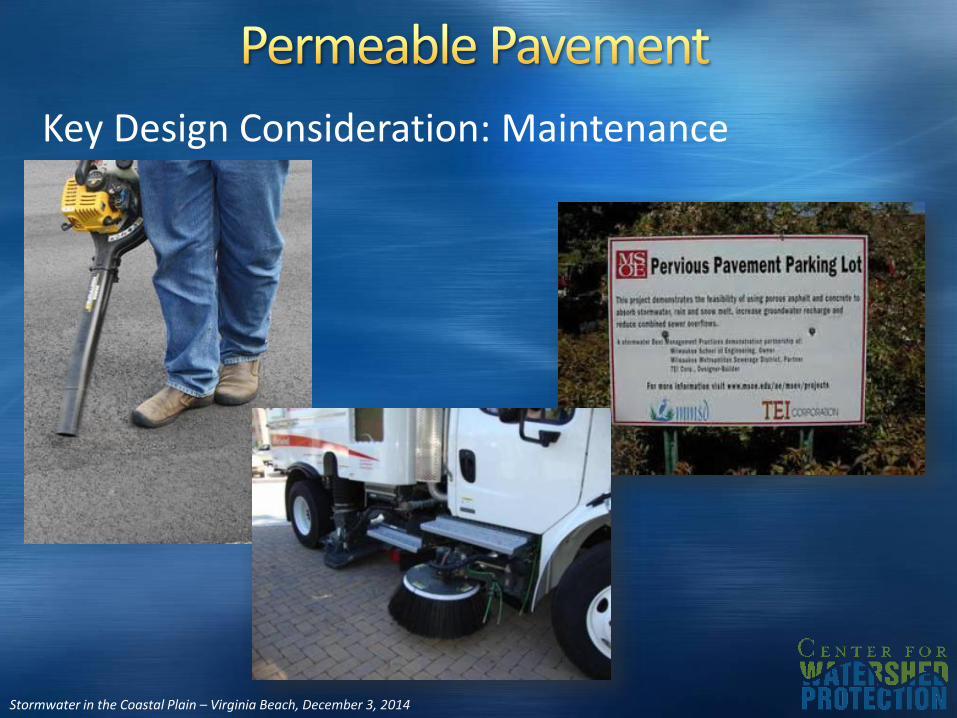
Key Design Consideration: Maintenance
Stormwater in the Coastal Plain – Virginia Beach, December 3, 2014
Stormwater in the Coastal Plain – Virginia Beach, December 3, 2014
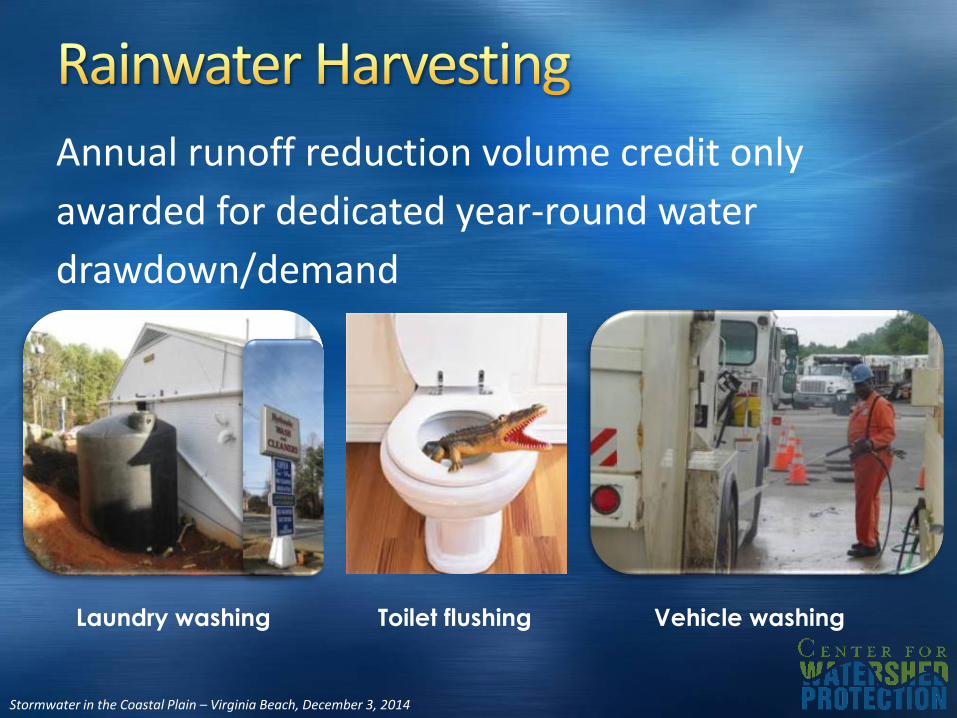
Annual runoff reduction volume credit only
awarded for dedicated year-round water
drawdown/demand
Laundry washing Vehicle washingToilet flushing

Stormwater in the Coastal Plain – Virginia Beach, December 3, 2014
Street Sweepers
Vactor Trucks
Public Works
Stormwater in the Coastal Plain – Virginia Beach, December 3, 2014
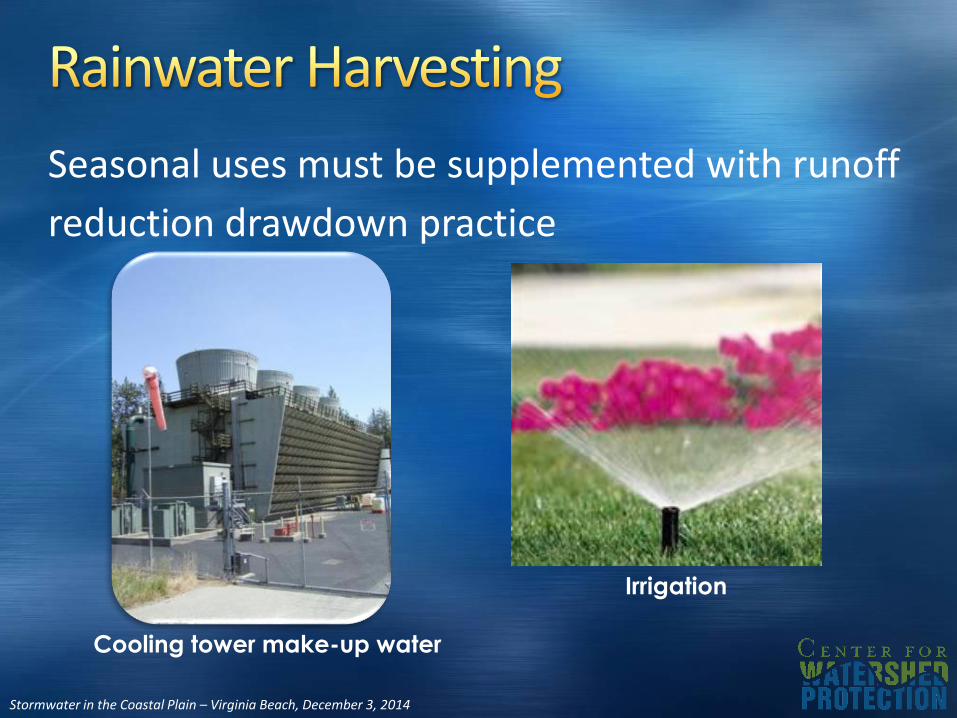
Seasonal uses must be supplemented with runoff
reduction drawdown practice
Irrigation
Cooling tower make-up water
Stormwater in the Coastal Plain – Virginia Beach, December 3, 2014
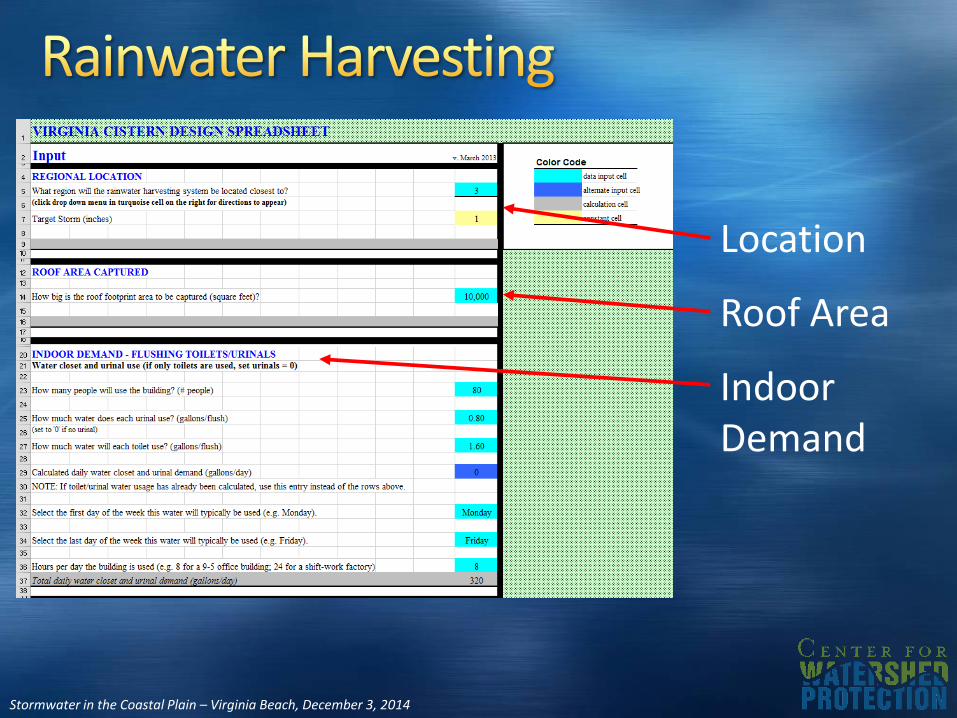
Location
Roof Area
Indoor Demand

Stormwater in the Coastal Plain – Virginia Beach, December 3, 2014
Secondary Drawdown
Cooling Towers Seasonal
IrrigationSeasonal with or w/o smart control
Stormwater in the Coastal Plain – Virginia Beach, December 3, 2014
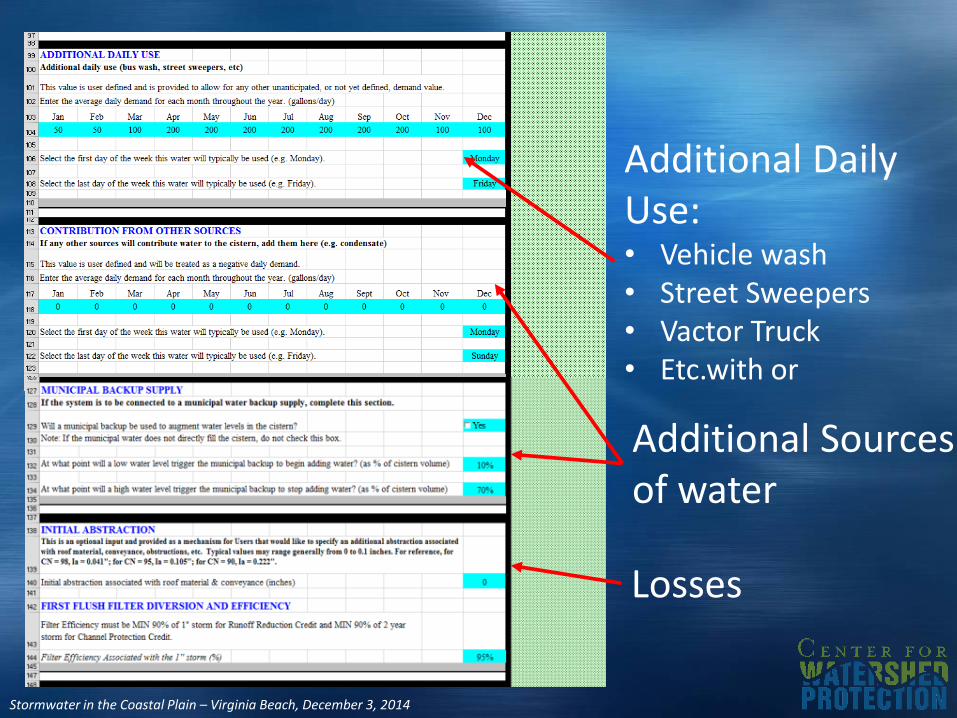
Additional Daily Use:• Vehicle wash• Street Sweepers• Vactor Truck• Etc.with or
Additional Sources of water
Losses
Stormwater in the Coastal Plain – Virginia Beach, December 3, 2014
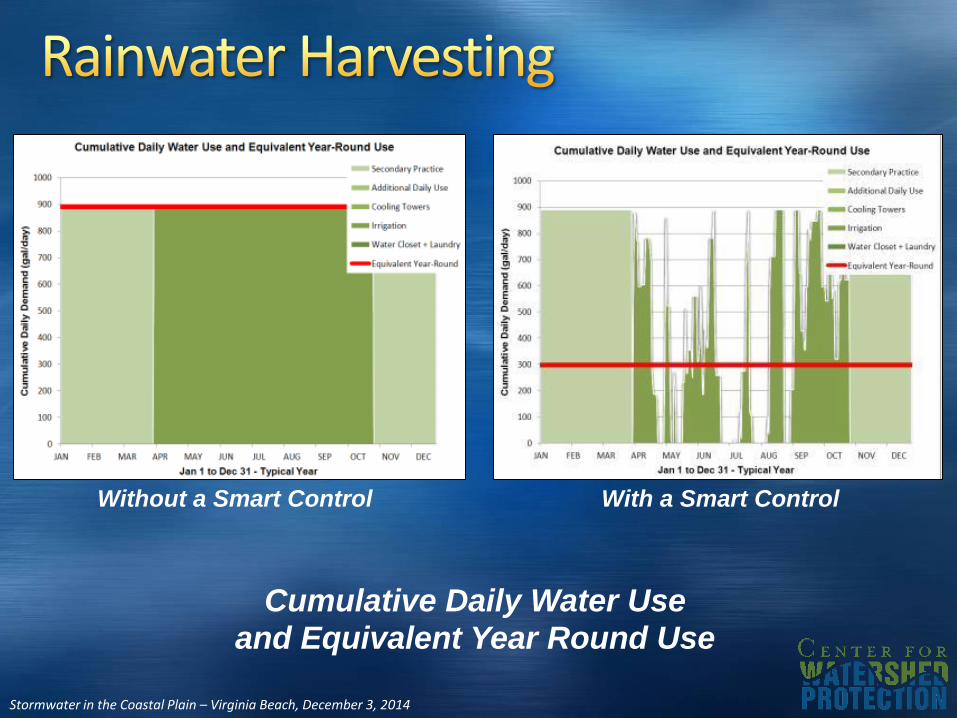
Without a Smart Control With a Smart Control
Cumulative Daily Water Use and Equivalent Year Round Use
Stormwater in the Coastal Plain – Virginia Beach, December 3, 2014
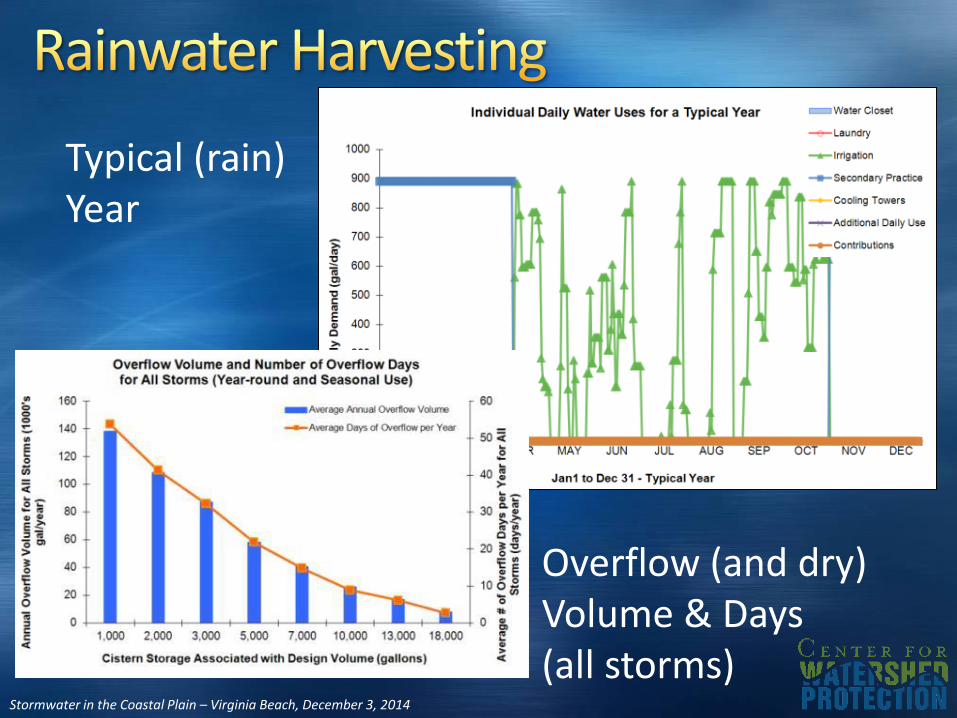
Overflow (and dry) Volume & Days(all storms)
Typical (rain) Year
Stormwater in the Coastal Plain – Virginia Beach, December 3, 2014
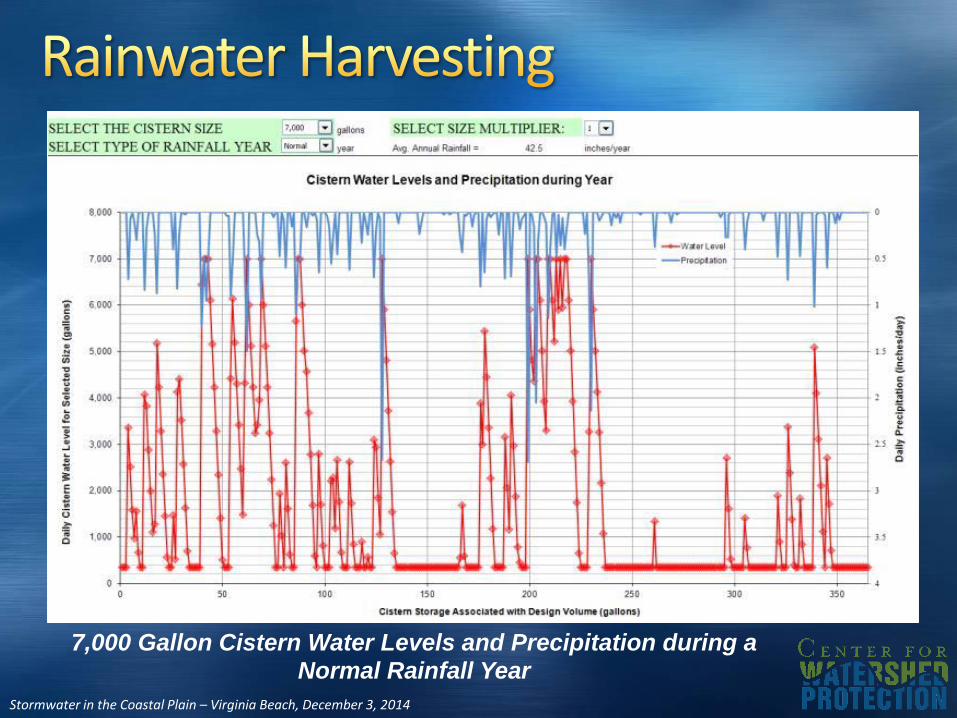
7,000 Gallon Cistern Water Levels and Precipitation during a
Normal Rainfall Year
Stormwater in the Coastal Plain – Virginia Beach, December 3, 2014
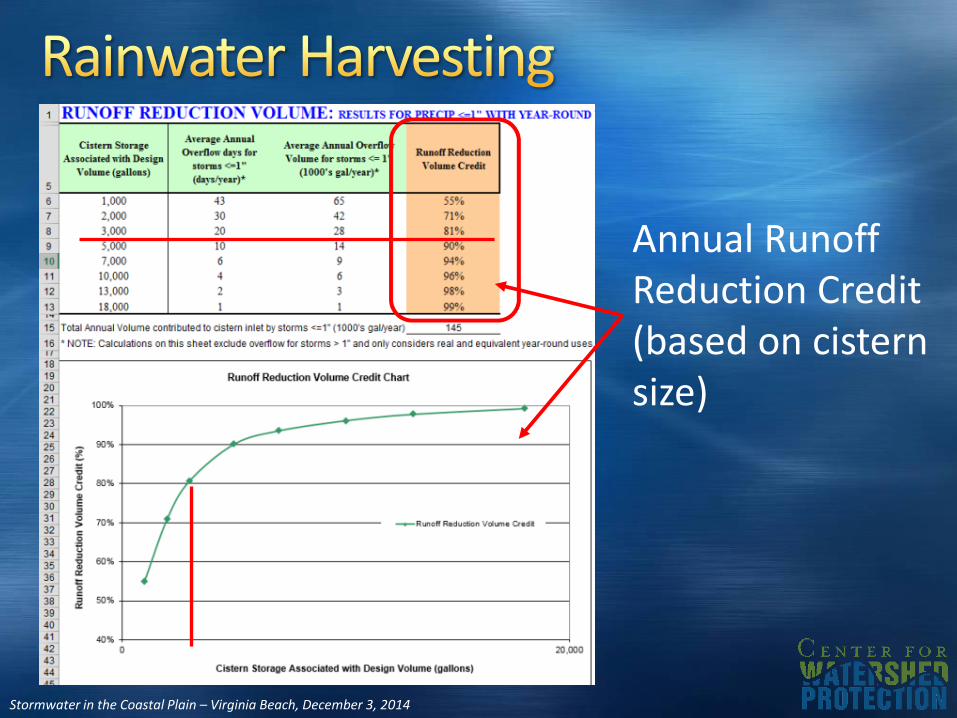
Annual Runoff Reduction Credit (based on cistern size)
Stormwater in the Coastal Plain – Virginia Beach, December 3, 2014
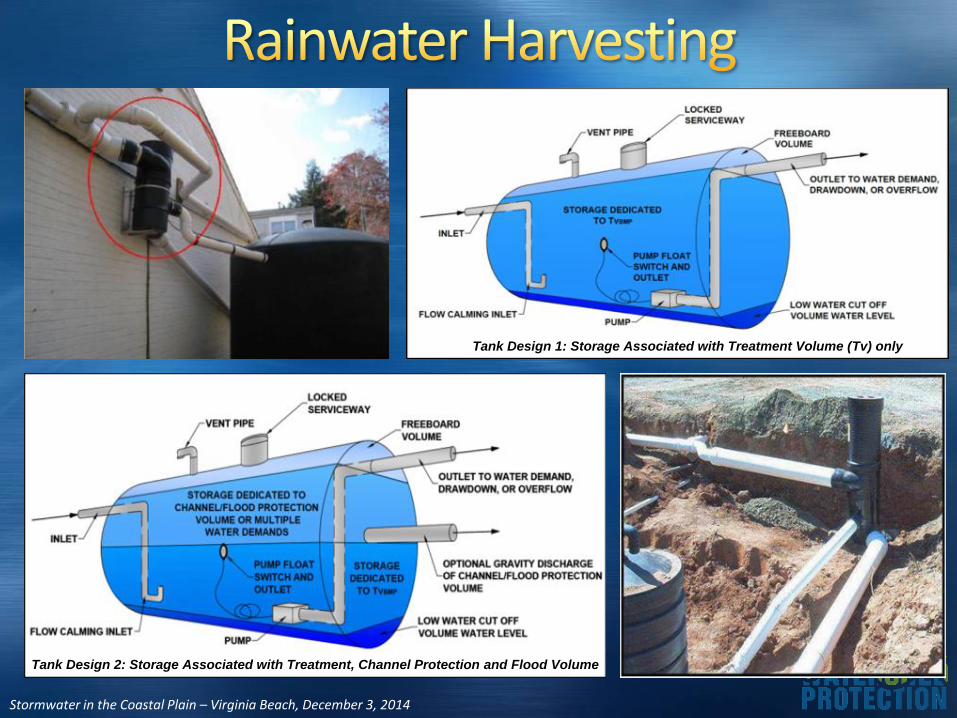
Tank Design 2: Storage Associated with Treatment, Channel Protection and Flood Volume
Tank Design 1: Storage Associated with Treatment Volume (Tv) only
Stormwater in the Coastal Plain – Virginia Beach, December 3, 2014