Embed Size (px)
Citation preview

D. Osmond (NC), C. Bolster (KY), M. Cabrera (GA), S. Feagley (TX), A. Forsberg (GA), C. Mitchell (AL), A. Mittelstet (NE), R. Mylavarapu (FL), L. Oldham (MS), D. Radcliffe(GA), J. Ramirez‐Avila (MS), A. Sharpley (AR), D. Storm (OK),
F. Walker (TN), and H. Zhang (OK)
Annual Soil & Water Conservation Society MeetingLouisville, KY
July 24‐27, 2016

1. Southern – AL, AR, FL, GA, LA, KY, MS, NC, OK, SC, TN, & TX
2. Chesapeake Bay – DE, NY, PA,VA, & WV
3. Heartland – IA, KS, MO, & NE
4. National synthesis project
Refine and Regionalize Southern Phosphorous Assessment Tools Based on
Validation and State Priorities

TX
OK
FL
AL GA
AR
LA
NC
MS
TN
KY
SC
²0 250 500125 Miles
Albers Equal-Area Conic
Southern States and Types of Phosphorus Indices
A
C
CC
Q
M
A
M
M
MM
M

Comparing Ratings of the Southern P Indices: Prior Work

Southern Phosphorus Indices CIG: Objectives
1. Determine pre‐existing watershed or plot‐scale (11) sites where accuracy of P Indices to estimate site P loss potential can be evaluated.
2. Compare fate and transport models against water quality data from benchmark sites.
3. Compare predictions of P‐Indices to water quality data from benchmark sites.
4. Compare predictions of P Indices against fate and transport water quality models (APEX, TBET, APLE) for calibrated and uncalibrated models.
5. Refine P Indices to ensure better consistency in ratings across state boundaries and within physiographic provinces.

Locations of Benchmark Data Sets for Southern P‐Index Analysis

Southern Field Site InformationState # Plots Date range Site‐years Crop STP range (ppm)
1 2 3 4AR 7 2009 – 2011 21 Pasture 81 ‐ 183 Captina (C)GA 6 1995 – 1998 24 Pasture 14 ‐ 142 Cecil (B) Altavista (C) Sedgefield (C) Helena (C)
NC 5 2011‐2013 15Corn with wheat
cover44‐121 Delanco (C)
MS 2 1996‐1999 8Cotton or soybens with wheat cover
37‐79 Dubbs (B) Tensas (D) Alligator (D) Dundee (C)
OK 1 1972‐1976 4 Cotton 20 McLain (C) Reinach (C)OK 1 2006‐2007 1.17 Pasture 50 Clarksville (B)OK 1 1977‐1992 16 Native grass 15 Bethany (C)OK 1 1980‐1985 6 Wheat 35 Norge (B)TX 1 1998‐2001 4 Hay 435 Duffau (B)TX 1 2005‐2008 4 Sorghum/Oats 34 Topsey (C) Brackett (C) Krum (D)TX 1 2005‐2008 4 Native grass 10 Nuff (C)
TX 1 2001‐2008 7Corn with wheat
cover51 Houston Black (D)
Soil Series (hydro group)

Benchmark Water Quality TP Losses vs Model (APEX, APLE, and TBET) Predictions: Arkansas
Benchmark Field Sites
TP DPDP/
TP RatioAPEX TP
APEX DP
APLE TP
APLE DP
TBET TP
TBET DP
NRCS†P Index Ratingkg ha‐1 yr‐1 % kg ha‐1 yr‐1
AR (Sharpley 2016)
Check 0.10 0.07 0.70 1.15 0.93 0.63 0.49 0.58 0.42 Low
Broadlitter 0.71 0.60 0.85 0.39 0.33 2.90 2.51 1.26 0.42 Low
Injectlitter 0.84 0.76 0.90 0.52 0.49 1.40 0.84 1.67 0.51 Low
Injectlitterx2 0.87 0.79 0.91 0.94 0.91 1.37 1.04 0.99 0.45 Low
RotGraz+litter 2.12 1.72 0.81 0.69 0.63 4.71 4.56 1.44 1.24 LowConGraz+litter 1.52 1.41 0.93 0.42 0.39 5.61 5.43 2.70 2.39 Low
Hay+litter 1.50 1.29 0.86 0.07 0.01 5.46 4.74 2.39 0.96 Low
† NRCS ranking equivalencies Low (< 2.2 kg ha‐1), Moderate (2.2 to 5.5 kg ha‐1), and High (> 5.5 kg ha‐1).
• Pasture with different litter management • Mehlich 3 soil test P, High to Very High
• Phosphorus applications, 0‐80 kg ha‐1 yr‐1
.

Benchmark Water Quality TP Losses vs Model (APEX, APLE, and TBET) Predictions: Georgia
† NRCS ranking equivalencies Low (< 2.2 kg ha‐1), Moderate (2.2 to 5.5 kg ha‐1), and High (> 5.5 kg ha‐1).
Benchmark Field Sites TP DP
DP/TP Ratio
APEX TP
APEX DP
APLE TP
APLE DP
TBET TP
TBET DP
NRCS†P Index Ratingkg ha‐1 yr‐1 % kg ha‐1 yr‐1
GA (Pierson et al., 2001)
Field 2,1 5.77 4.09 0.71 0.28 0.20 9.39 9.32 6.78 6.41 High
Field 2,2 5.05 3.20 0.58 0.36 0.32 13.13 13.02 5.38 5.02 Mod
Field 4,1 9.32 7.20 0.77 0.87 0.32 4.51 4.49 4.14 3.92 High
Field 4,2 13.68 11.69 0.86 0.33 0.27 13.65 16.82 8.90 5.88 High
Field 6,1 10.83 7.53 0.70 0.77 0.55 9.98 9.93 8.60 8.11 High
Field 6,2 19.77 13.40 0.68 0.51 0.50 17.13 13.73 8.85 5.97 High
• Pasture with different rates of litter management• Mehlich 3 soil test P, Low to Very High
• Phosphorus applications, 215‐237 kg ha‐1 yr‐1

Benchmark Water Quality TP Losses vs Model (APEX, APLE, and TBET) Predictions: NC
† NRCS ranking equivalencies Low (< 2.2 kg ha‐1), Moderate (2.2 to 5.5 kg ha‐1), and High (> 5.5 kg ha‐1).
• Cropland: Conventional tillage vs no‐till and conventional vs organic management• Mehlich 3 soil test P Medium to Very High
• Phosphorus applications on conventional management, 0 kg ha‐1 yr‐1• Phosphorus applications on organic management, 62‐114 kg ha‐1 yr‐1
Benchmark Field Sites TP DP
DP/TP Ratio
APEX TP
APEX DP
APLE TP
APLE DP
TBET TP
TBET DP
NRCS†P Index Ratingkg ha‐1 yr‐1 % kg ha‐1 yr‐1
NC (Edgell et al., 2015)CT,C 2011 7.88 0.18 0.02 0.84 0.33 2.9 0.30 5.3 0.10 HighCT,C 2012 1.62 0.07 0.04 0.84 0.33 4.0 0.26 10.3 0.15 LowNT,C 2011 0.69 0.15 0.22 0.09 0.03 4.0 0.58 5.8 0.17 LowNT,C 2012 0.27 0.06 0.22 0.09 0.03 5.5 0.35 9.8 0.16 LowCT,O 2011 3.08 0.63 0.20 0.23 0.06 11.9 6.29 9.2 0.26 ModCT,O 2012 1.79 0.26 0.15 0.23 0.06 10.1 2.66 15.6 0.23 LowNT,O 2011 1.05 0.30 0.29 0.05 0.01 9.4 5.57 9.3 0.76 LowNT,O 2012 0.47 0.14 0.30 0.05 0.01 7.8 2.07 11.7 0.28 Low

Arkansas Benchmark Data:Southern State P‐Index Ratings
AR Field Sites
NRCS† AL AR FL GA KY LA MS NC OK SC TN TX
Southern State P Index Ratings Using Measured Sediment for Erosion LossesCheck Low Low Low Low Low Low Low Low Low High Low Low LowBroadlitter Low High Mod Mod Low Low Low Mod Low High Low Low ModInjectlitter Low High Low Mod Low Low Low Mod Low High Low Low ModInjectlitterx2 Low High Mod Mod Low Low Low Mod Low Severe Mod Low ModRotGraz+litter Low High Mod Mod Low Low Low Mod Low High Mod Low ModContGraz+litter Low High Mod Mod High Mod Low Mod Low Severe Mod Low Mod
Hay+litter Low High Mod Mod Low Low Low Mod Low High Mod Low Mod† NRCS ranking equivalencies Low (< 2.2 kg ha‐1), Moderate (2.2 to 5.5 kg ha‐1), and High (> 5.5 kg ha‐1).

Georgia Benchmark Data:Southern State P‐Index Ratings
† NRCS ranking equivalencies Low (< 2.2 kg ha‐1), Moderate (2.2 to 5.5 kg ha‐1), and High (> 5.5 kg ha‐1).‡Oklahoma P Index would not allow this much P
GA Field Sites
NRCS† AL AR FL GA KY LA MS NC OK SC TN TX
Southern State P Index Ratings Using Measured Sediment for Erosion Losses
Field 2,1 HighEx. High Low
V. High
V. High Low Mod High High NA‡
V. High Mod High
Field 2,2 ModEx. High Low
V. High
V. High Low Mod High Mod NA
V. High Mod High
Field 4,1 HighEx. High Low High
V. High Low Mod High Low NA
V. High Mod Mod
Field 4,2 HighEx. High Low
V. High
V. High Low High High Mod NA
V. High High High
Field 6,1 HighEx. High Low Mod
V. High Mod Mod High Mod NA
V. High Mod High
Field 6,2 HighEx. High Low Mod
V. High Mod High High High NA
V. High High High

North Carolina Benchmark Data:Southern State P‐Index Ratings
† NRCS ranking equivalencies Low (< 2.2 kg ha‐1), Moderate (2.2 to 5.5 kg ha‐1), and High (> 5.5 kg ha‐1).
NC Field Sites
NRCS† AL AR FL GA KY LA MS NC OK SC TN TX
Southern State P Index Ratings Using Measured Sediment for Erosion Losses
CT,C 2011 High Low NA Low Low Low Low Low Low Low Low Low Low
CT,C 2012 Low Low NA Low Low Low Low Low Low Mod Low Low Low
NT,C 2011 Low Low NA Low Low Low Low Low Low Mod Low Low Mod
NT,C 2012 Low Low NA Low Low Low Low Low Low Mod Low Low Mod
CT,O 2011 Mod V. High NA Mod V. High Mod Low Mod Low Mod High Mod Mod
CT,O 2012 Low V. High NA Mod High Low Low Mod Low Mod Mod Mod Mod
NT,O 2011 Low V. High NA Mod V. High Low Low High High Mod High High Mod
NT,O 2012 Low V. High NA Mod Mod Low Low Mod Mod Mod High High Mod
† NRCS ranking equivalencies Low (< 2.2 kg ha‐1), Moderate (2.2 to 5.5 kg ha‐1), and High (> 5.5 kg ha‐1).

Southern State P‐Index Ratings: Translation of State Management Outcomes
NRCS P Index RatingState N‐based (Low) P‐based (Moderate) No P (High)
State P‐Index Ratings AL Low Moderate, High Very HighAR Low, Moderate High Very HighFL Low Moderate High, Very HighGA Low, Moderate High Very HighKY Low Moderate HighLA Low, Moderate High Very HighMS Low, Moderate High Very HighNC Low, Moderate High Very HighOK Low, Moderate High Very High, SevereSC Low, Moderate High Very HighTN Low Moderate, High Very HighTX† Low Moderate, High, Very High High, Very High with P
impairment† Rankings vary based on water quality impairment
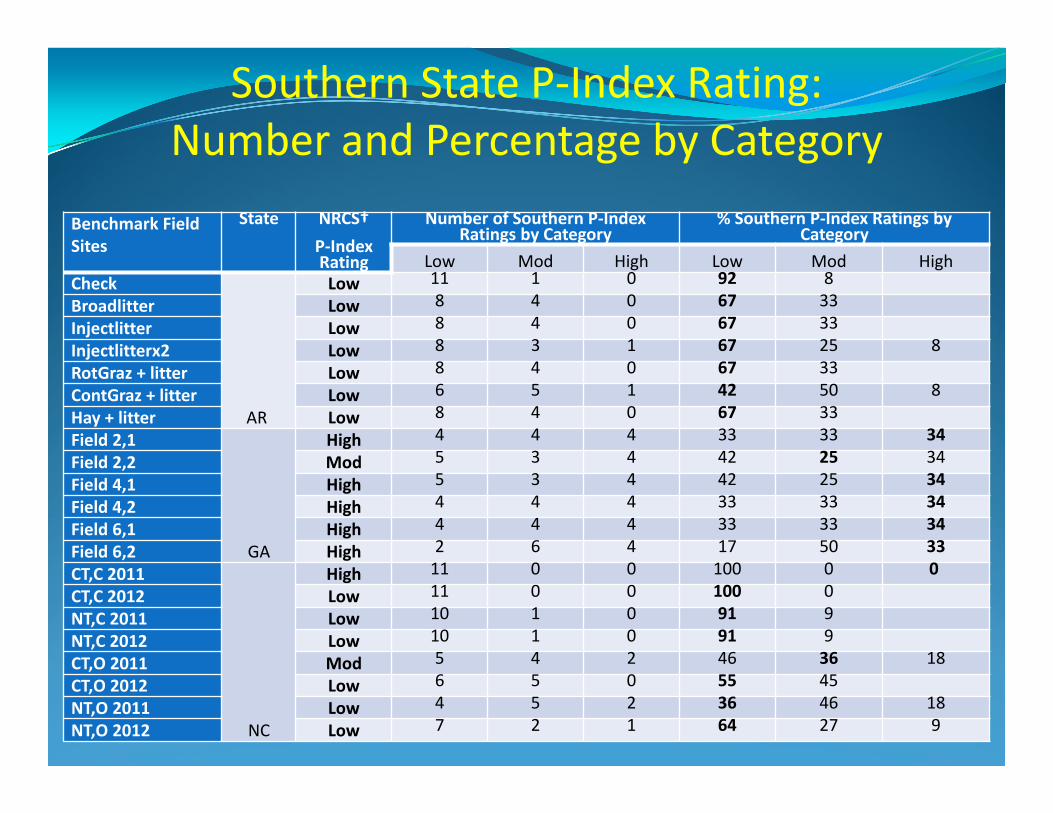
Southern State P‐Index Rating: Number and Percentage by Category
Benchmark Field Sites
State NRCS†P‐Index Rating
Number of Southern P‐Index Ratings by Category
% Southern P‐Index Ratings by Category
Low Mod High Low Mod HighCheck
AR
Low 11 1 0 92 8Broadlitter Low 8 4 0 67 33Injectlitter Low 8 4 0 67 33Injectlitterx2 Low 8 3 1 67 25 8RotGraz + litter Low 8 4 0 67 33ContGraz + litter Low 6 5 1 42 50 8Hay + litter Low 8 4 0 67 33Field 2,1
GA
High 4 4 4 33 33 34Field 2,2 Mod 5 3 4 42 25 34Field 4,1 High 5 3 4 42 25 34Field 4,2 High 4 4 4 33 33 34Field 6,1 High 4 4 4 33 33 34Field 6,2 High 2 6 4 17 50 33CT,C 2011
NC
High 11 0 0 100 0 0CT,C 2012 Low 11 0 0 100 0NT,C 2011 Low 10 1 0 91 9NT,C 2012 Low 10 1 0 91 9CT,O 2011 Mod 5 4 2 46 36 18CT,O 2012 Low 6 5 0 55 45NT,O 2011 Low 4 5 2 36 46 18NT,O 2012 Low 7 2 1 64 27 9

Percent correspondence with NRCS loss rating
34
6152
48
6064
P INDICESTBET APLEAPEXAdded Multi Comp
Phosphorus Loss Tools• Additive Indices: AL (39%),
TX (28%) • Multiplicative Indices: AR
(54%), FL (52%), LA (61%), MS (58%), SC (81%), TN (55%)
• Component Indices GA (71%), KY (61%), NC (61%)
• Qualitative Index: OK (39%)
• Overall Rating: 54%
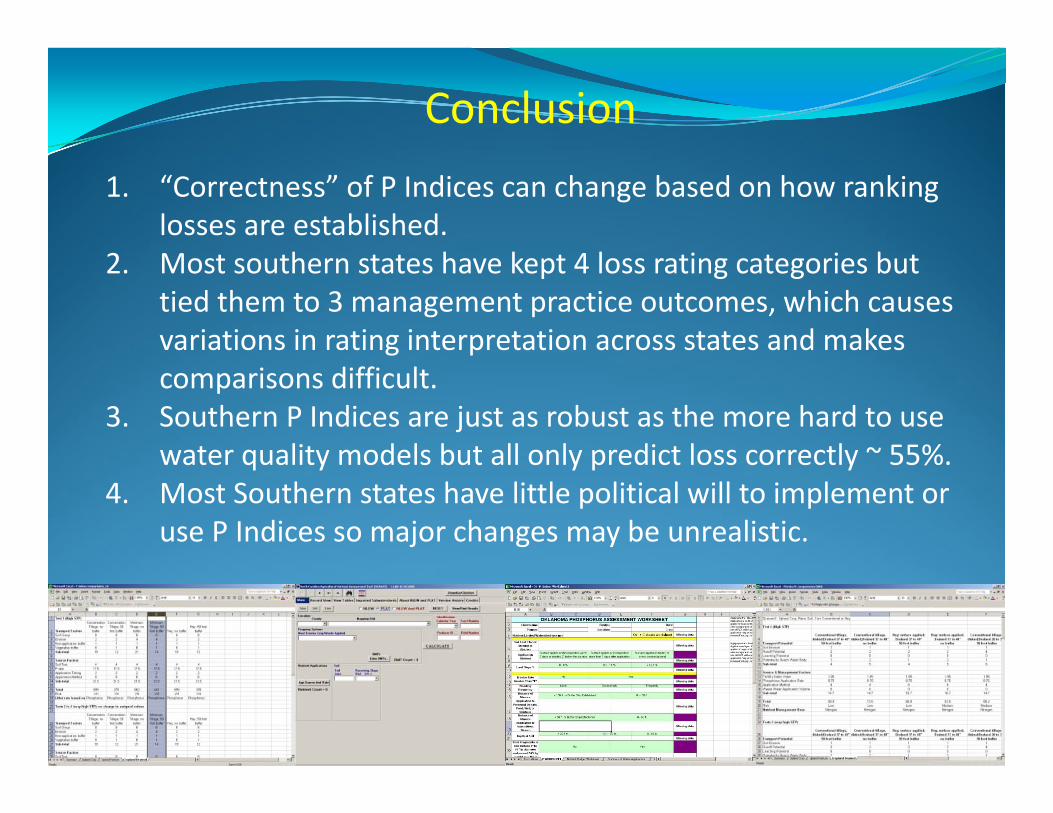
Conclusion1. “Correctness” of P Indices can change based on how ranking
losses are established.2. Most southern states have kept 4 loss rating categories but
tied them to 3 management practice outcomes, which causes variations in rating interpretation across states and makes comparisons difficult.
3. Southern P Indices are just as robust as the more hard to use water quality models but all only predict loss correctly ~ 55%.
4. Most Southern states have little political will to implement or use P Indices so major changes may be unrealistic.

Thanks to our sponsor
69‐3A75‐12‐182
Questions
![GLEN OSMOND MENU.pptx [Read-Only] - Chopstix …chopstixrestaurants.com.au/.../09/GLEN-OSMOND-MENU.pdf · Title: Microsoft PowerPoint - GLEN OSMOND MENU.pptx [Read-Only] Author: Asim](https://img.pdfslide.us/doc/110x75/5ae02f927f8b9a97518ceb1b/glen-osmond-menupptx-read-only-chopstix-microsoft-powerpoint-glen-osmond.jpg)