Embed Size (px)
Citation preview
Smart Projects for Smart Cities: The government way
The Devnadi Case Study
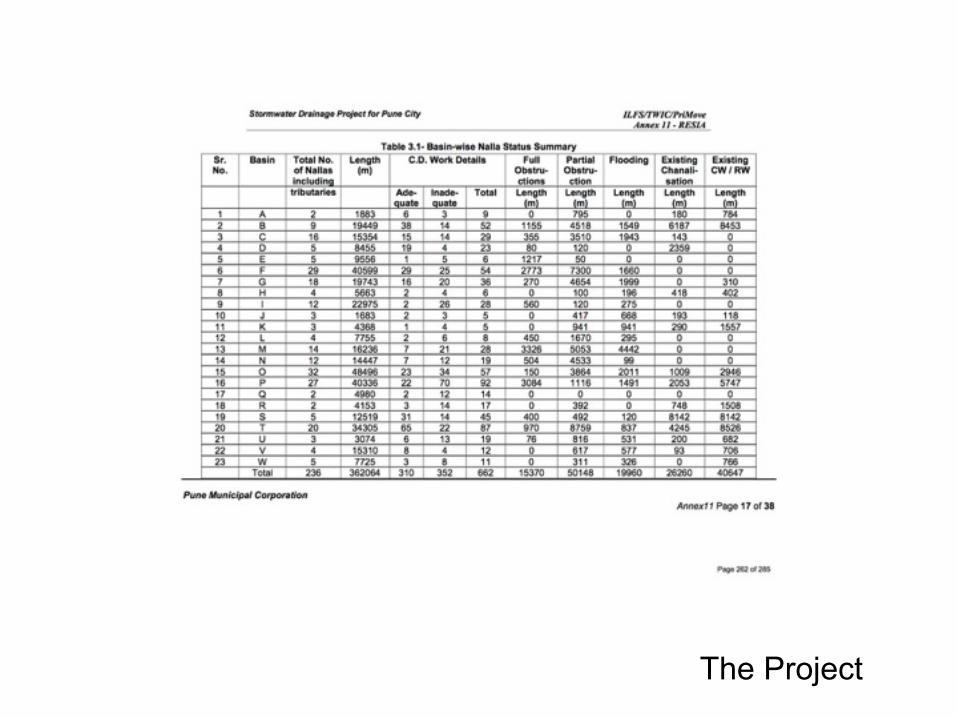
• 23 Basins in Pune with 360 Km nallas on natural fresh water streams said to cause floods
• Freshwater streams labeled as “stormwater drains” to create a drain project
• Reducing the width to upto a tenth of their original, concreting the freshwater streams and replacing their freshwater with sewage said to be the solution to rid these streams of floods in the Storm-water drain project DPR
• Three Phase Project with First Phase costing 388 crores created to rid Pune of floods created by PMC and funded by JNNURM
• When JNNURM reduces funds sanctioned three basins from Phase I dropped saying they were less critical
Government’s project
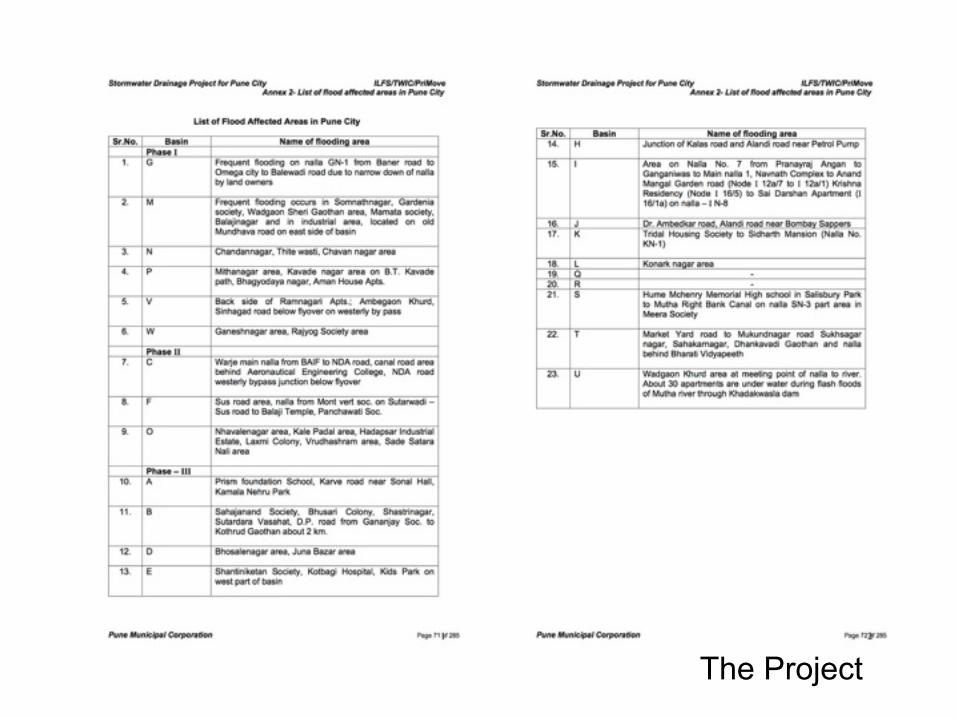
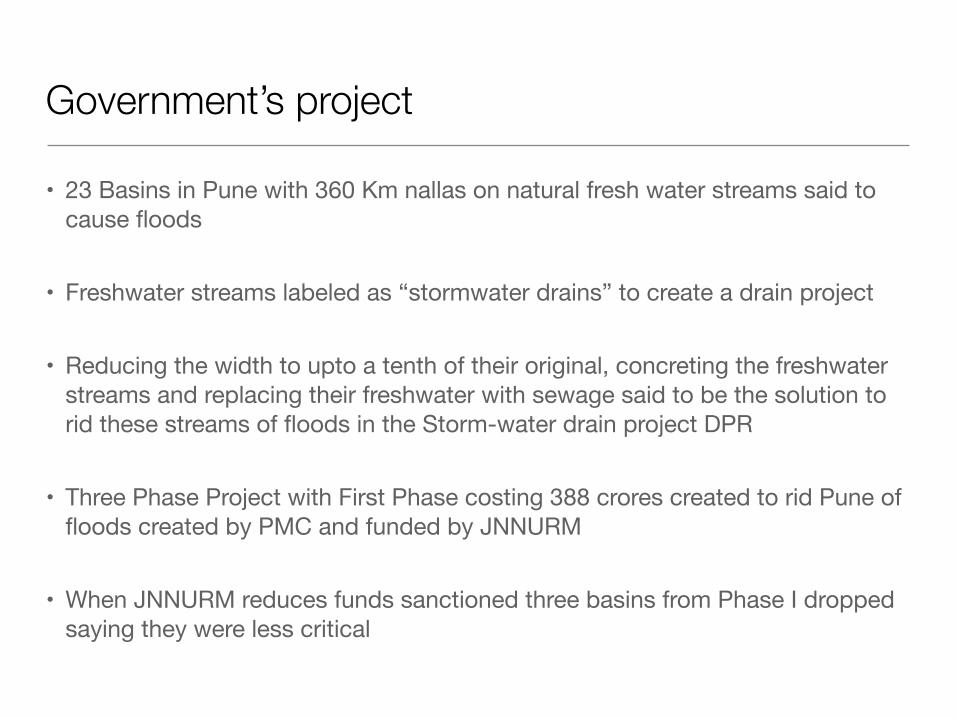
The Project
The Project
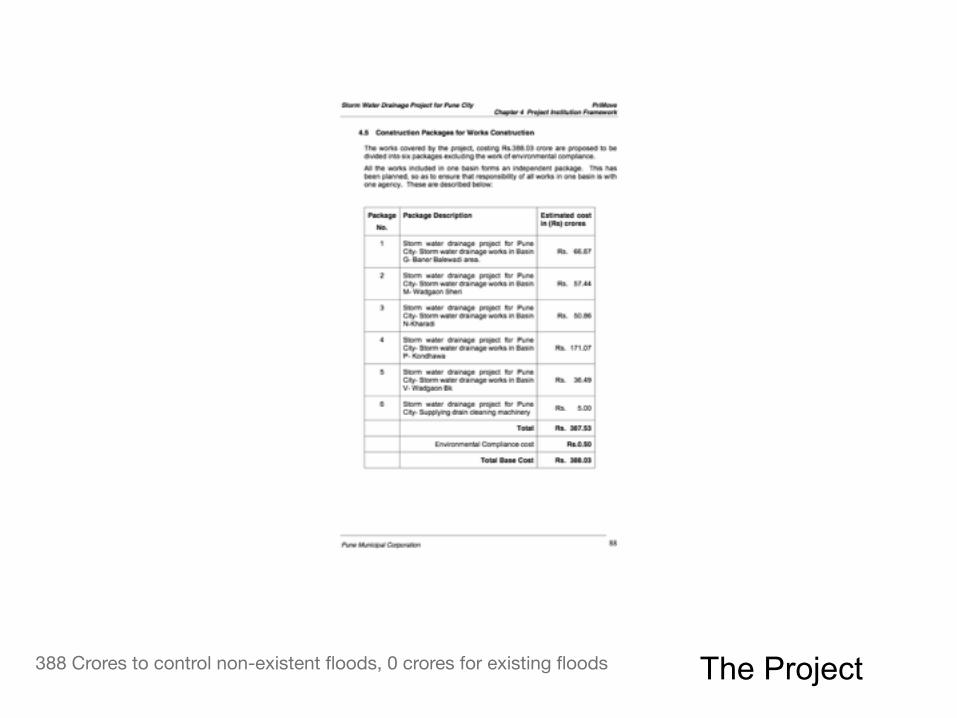
388 Crores to control non-existent floods, 0 crores for existing floods The Project
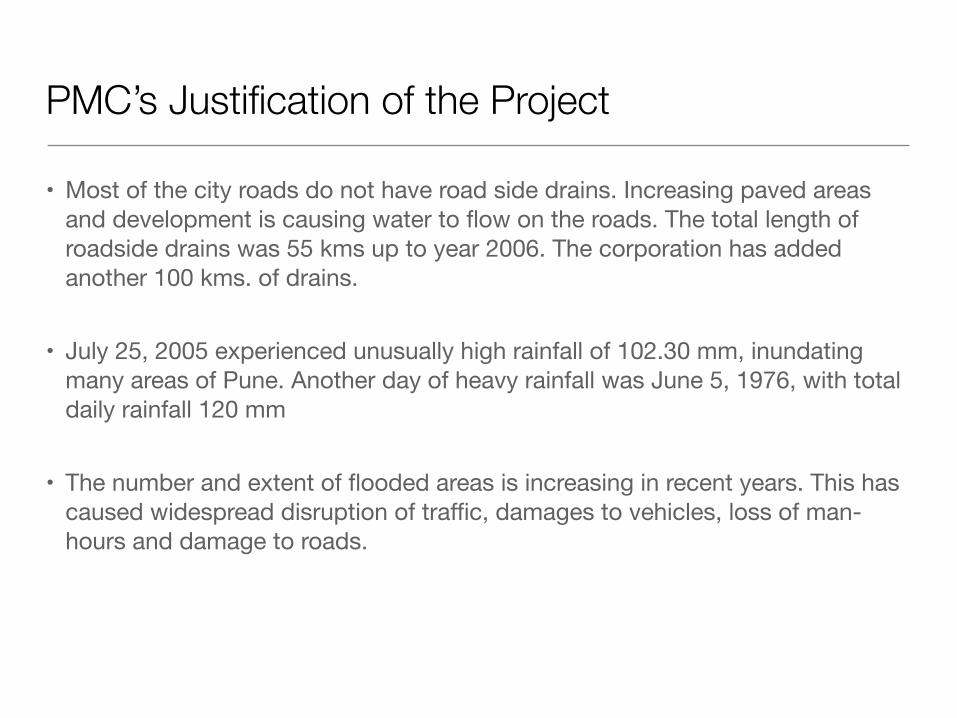
• Most of the city roads do not have road side drains. Increasing paved areas and development is causing water to flow on the roads. The total length of roadside drains was 55 kms up to year 2006. The corporation has added another 100 kms. of drains.
• July 25, 2005 experienced unusually high rainfall of 102.30 mm, inundating many areas of Pune. Another day of heavy rainfall was June 5, 1976, with total daily rainfall 120 mm
• The number and extent of flooded areas is increasing in recent years. This has caused widespread disruption of traffic, damages to vehicles, loss of man- hours and damage to roads.
PMC’s Justification of the Project
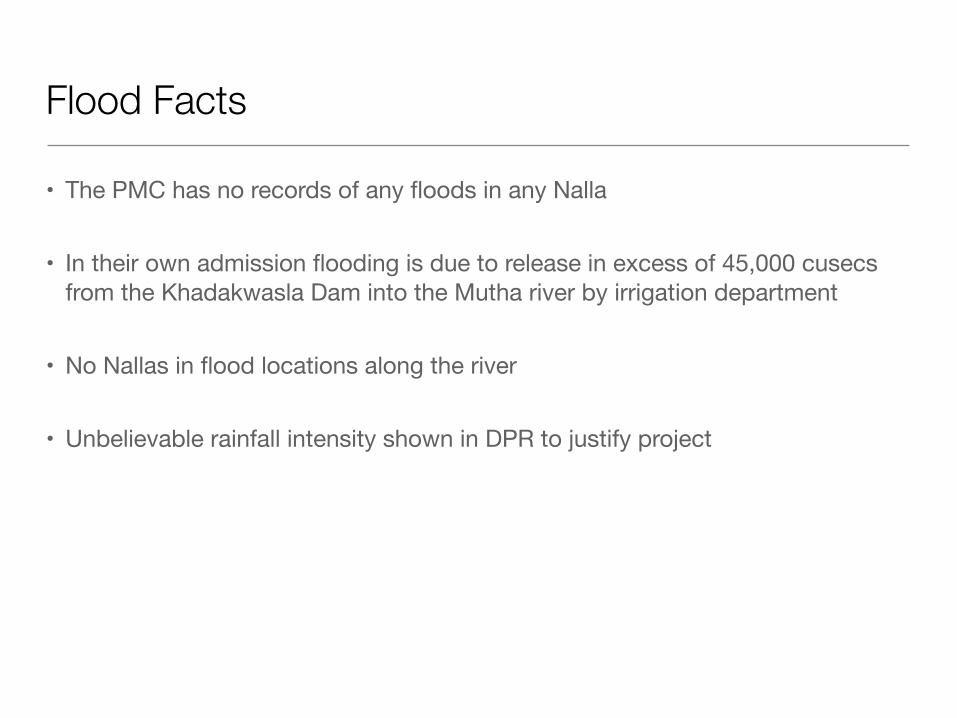
• The PMC has no records of any floods in any Nalla
• In their own admission flooding is due to release in excess of 45,000 cusecs from the Khadakwasla Dam into the Mutha river by irrigation department
• No Nallas in flood locations along the river
• Unbelievable rainfall intensity shown in DPR to justify project
Flood Facts
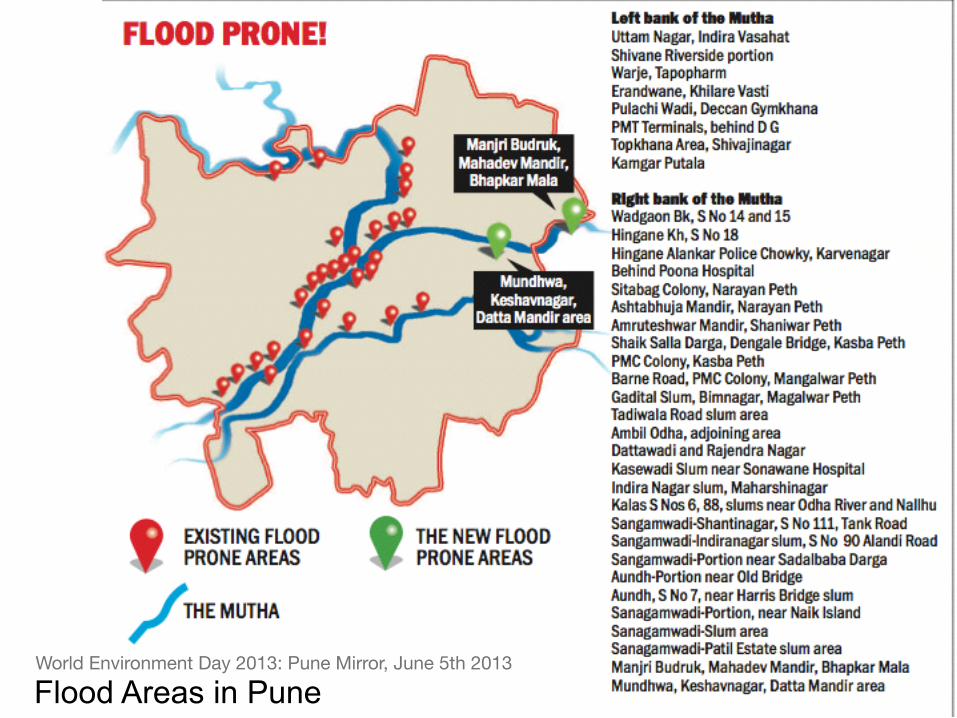
World Environment Day 2013: Pune Mirror, June 5th 2013
Flood Areas in Pune
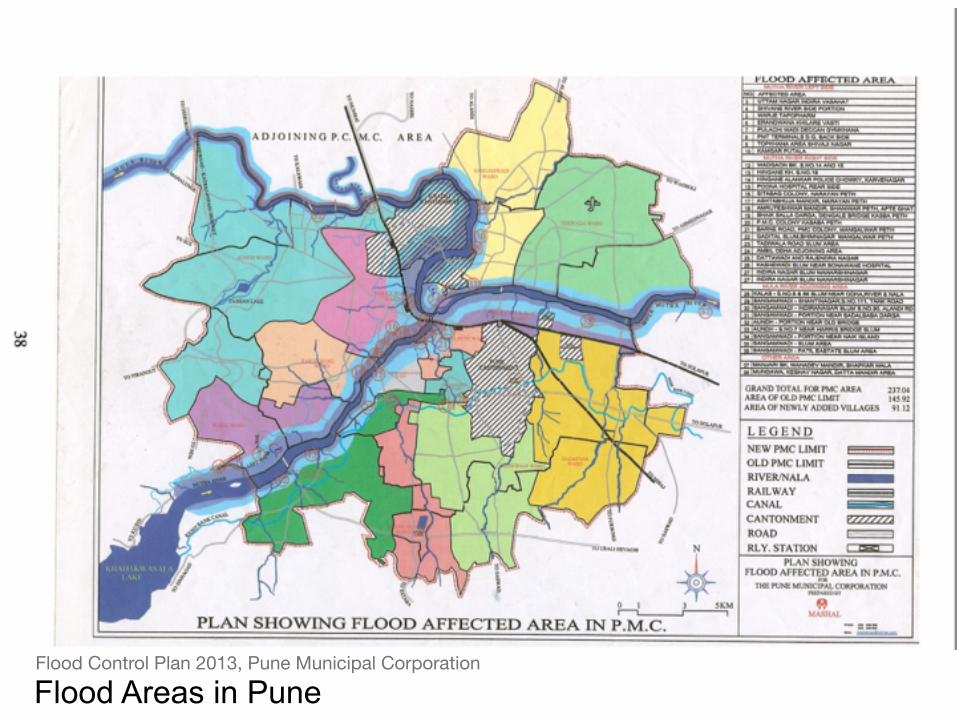
Flood Control Plan 2013, Pune Municipal Corporation
Flood Areas in Pune
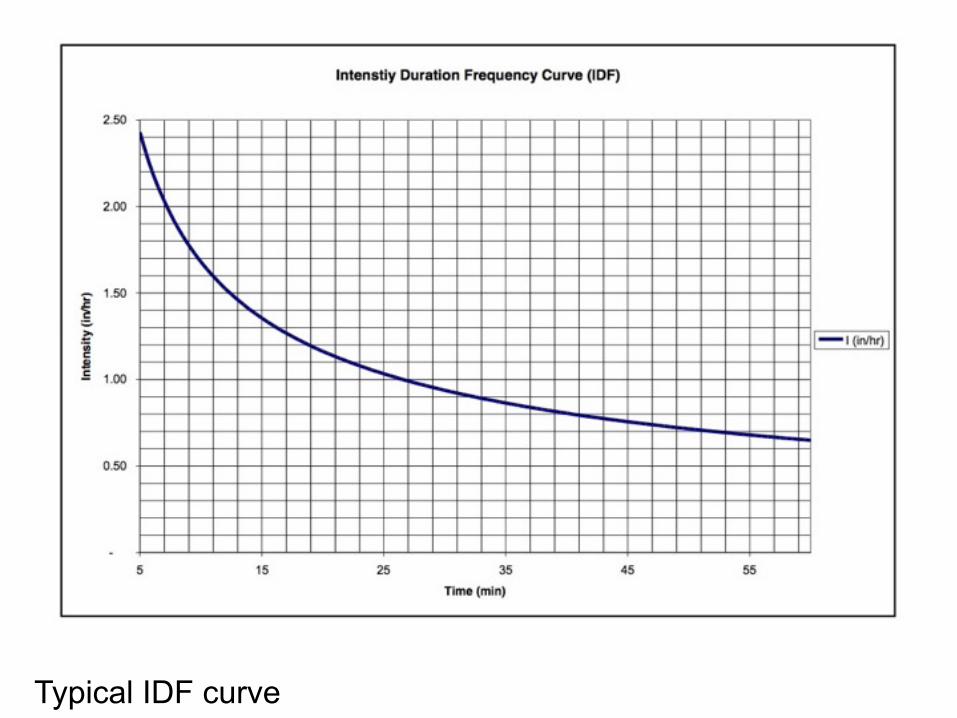
Typical IDF curve
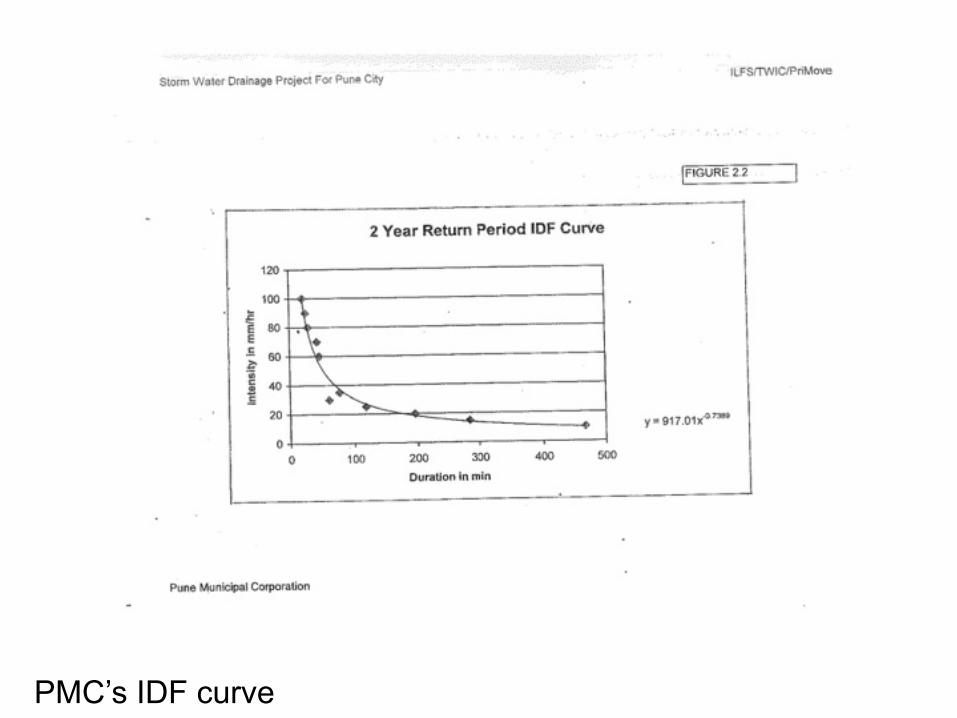
PMC’s IDF curve
• Why it has failed to protect the width of the streams and rivers as per the DP/Survey Maps
• Why it has failed to check the tenement density per Ha as per Town Planning norms
• Why it has failed to make roads with drains
• How do natural streams, which in most cases are far from roads, flood the roads
• How one day of rain, which caused floods in the Mutha due to release of water from Khadakwasla, is used to justify a project with an overall outlay of over 1,000 crores that promises to destroy the city’s natural fresh water streams and its groundwater recharge
• How will constricting and cementing natural streams rid the city of flooding when world over creating unpaved corridors with tree cover are used to control floods
What PMC does not explain: Whose interest is it?
• 66 Crores of tax money wasted on a Devnadi alone in private interest to steal the green belt and water stream
• Project aimed to continuously waste more money in private interest to destroy all natural streams in Pune and in every urban centre under JNNURM
• Approximately 90 crores worth of wetland and green belt stolen from the public in Devnadi alone
• Water table for entire Baner (aprox 10 sq Km) destroyed (aprox annual cost of replacing the services 5X the current annual supply of water by tanker mafia)
What has this Cost the Citizens?
• Pollution of the ground water and spread of water borne disease by laying sewage lines in the stream (Aprox 44 crores per year in purified drinking water costs for Baner alone + medical expenses to treat water borne disease and mosquito borne disease)
• Crime, failure of the Development Plan by promoting slums to grab the land of the river (Cost to mental health, peace and well being for entire Baner; crime rate up in Baner by more than 100% in last 5 years)
• Risk of damage by flooding increased at least 60 fold as the stream is channelized, constricted and flow changed to 1/60 of its avg. width
• Biodiversity and lungs of the Baner area destroyed by removing the trees and vegetation from the green belt and the river
Costs to the Citizens
• The next few slides present transformation of sections of a natural stream to a gutter, real estate and slums by the government
• The pictures represent what is happening to every fresh water stream due to corruption and indifference of the government
The Historical Evidence
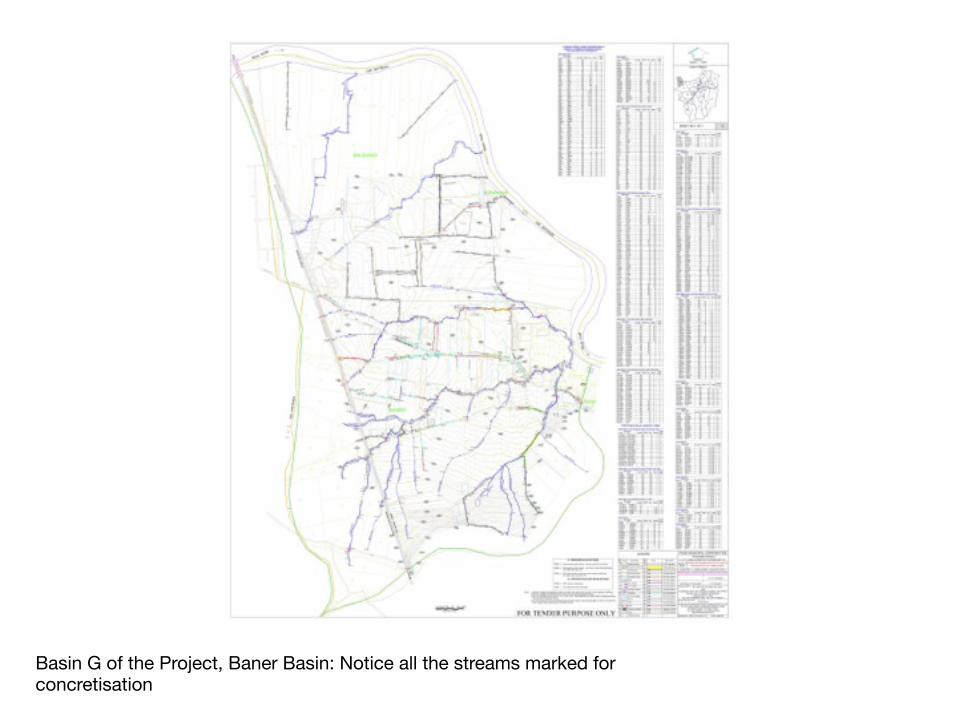
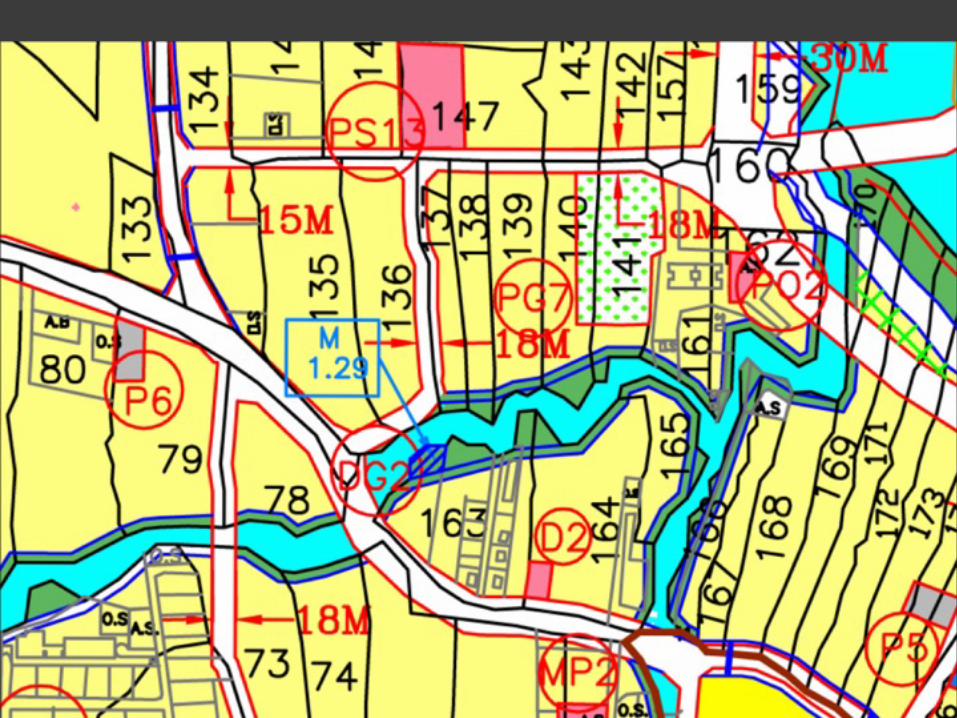
Basin G of the Project, Baner Basin: Notice all the streams marked for concretisation
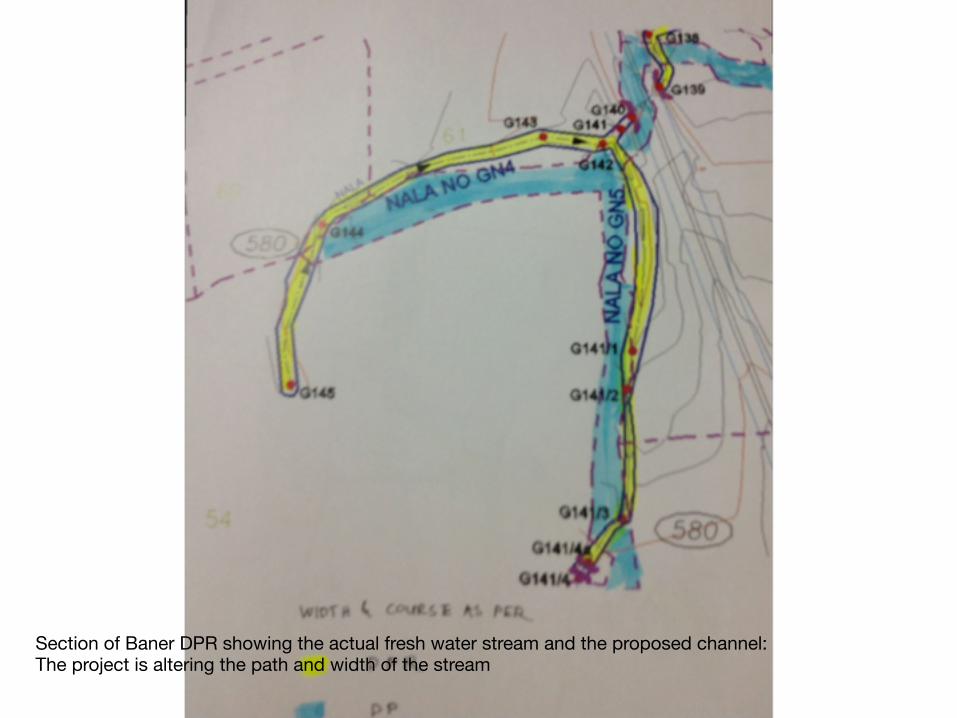
Section of Baner DPR showing the actual fresh water stream and the proposed channel: The project is altering the path and width of the stream
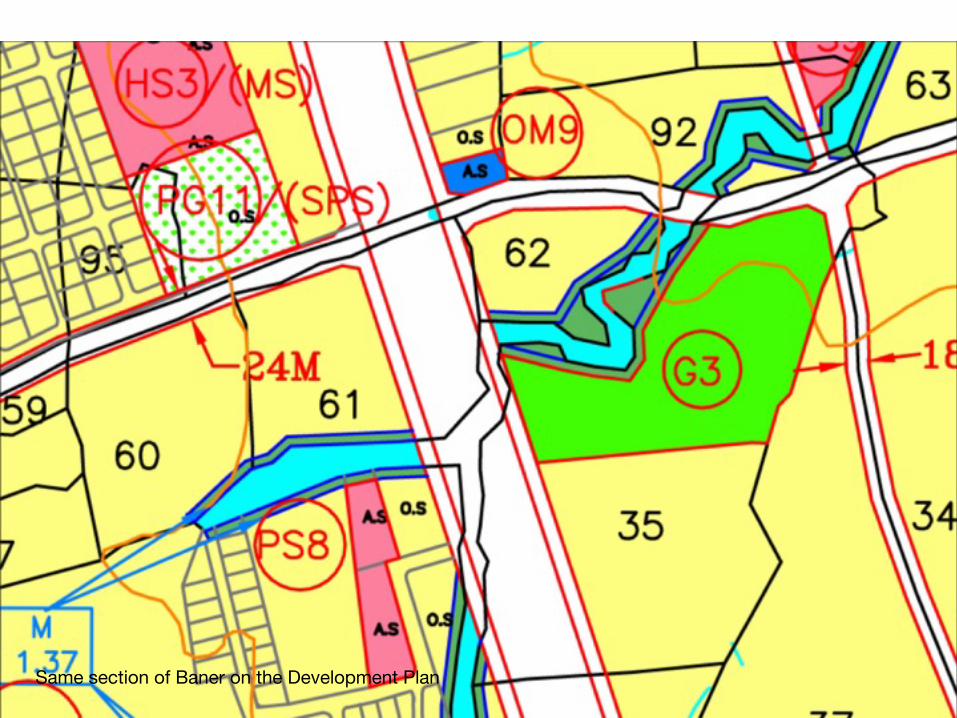
Same section of Baner on the Development Plan
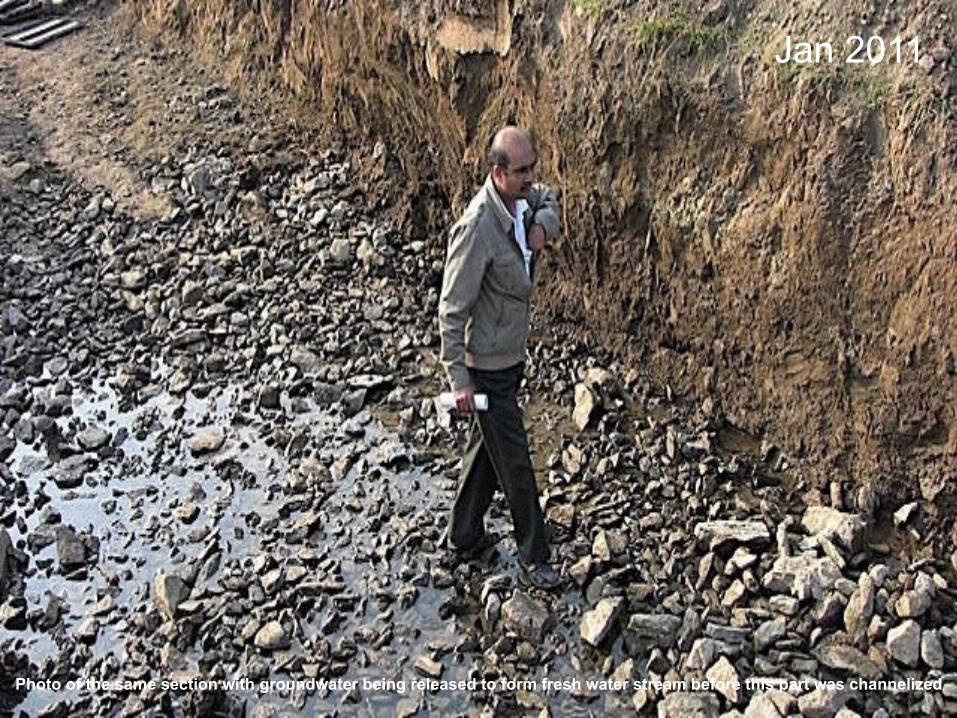
Photo of the same section with groundwater being released to form fresh water stream before this part was channelized
Jan 2011
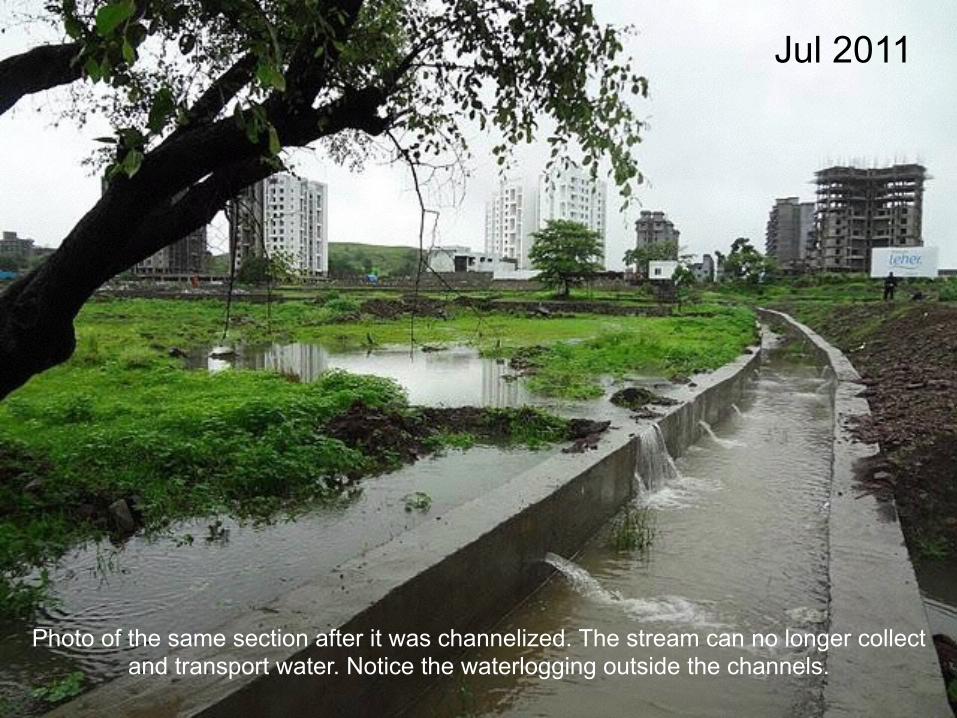
Photo of the same section after it was channelized. The stream can no longer collect and transport water. Notice the waterlogging outside the channels.
Jul 2011
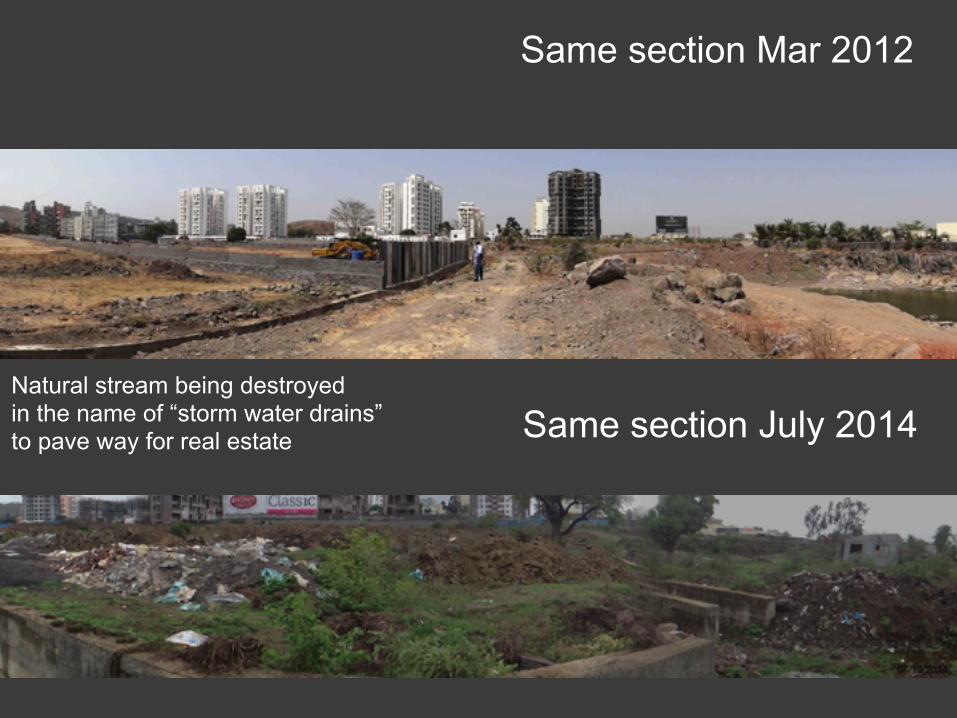
Same section Mar 2012
Same section July 2014Natural stream being destroyed in the name of “storm water drains” to pave way for real estate
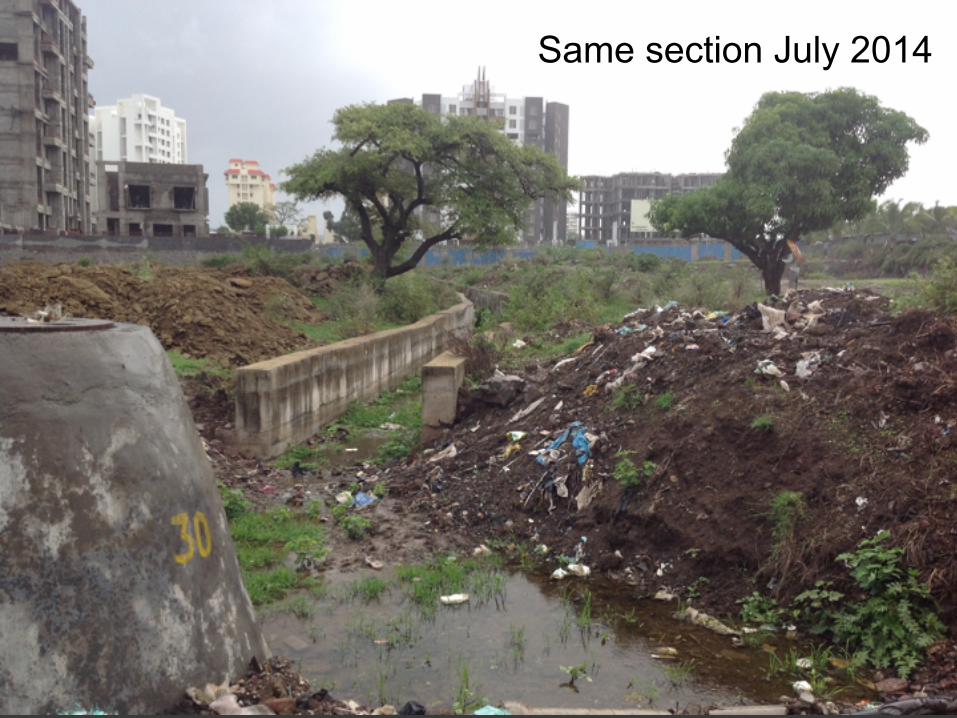
Same section July 2014
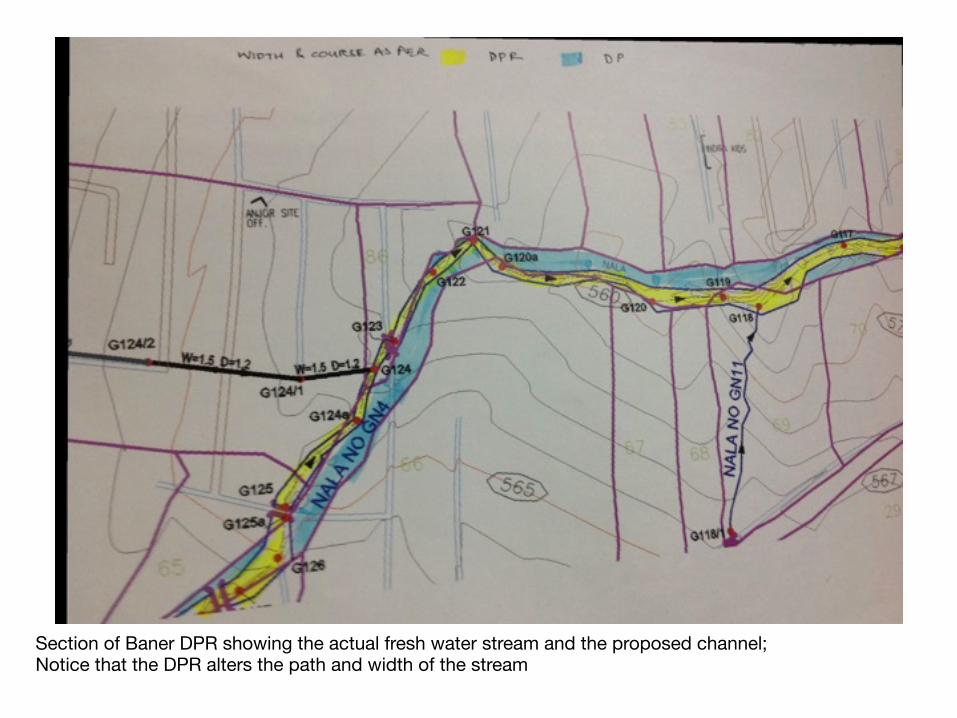
Section of Baner DPR showing the actual fresh water stream and the proposed channel; Notice that the DPR alters the path and width of the stream
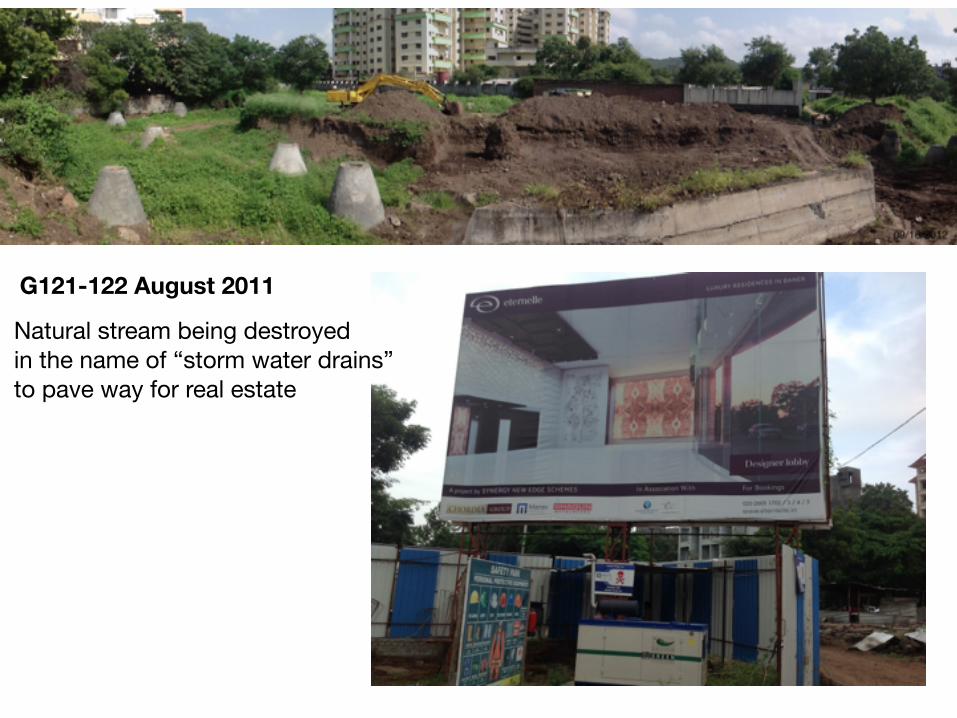
G121-122 August 2011
Natural stream being destroyed in the name of “storm water drains” to pave way for real estate
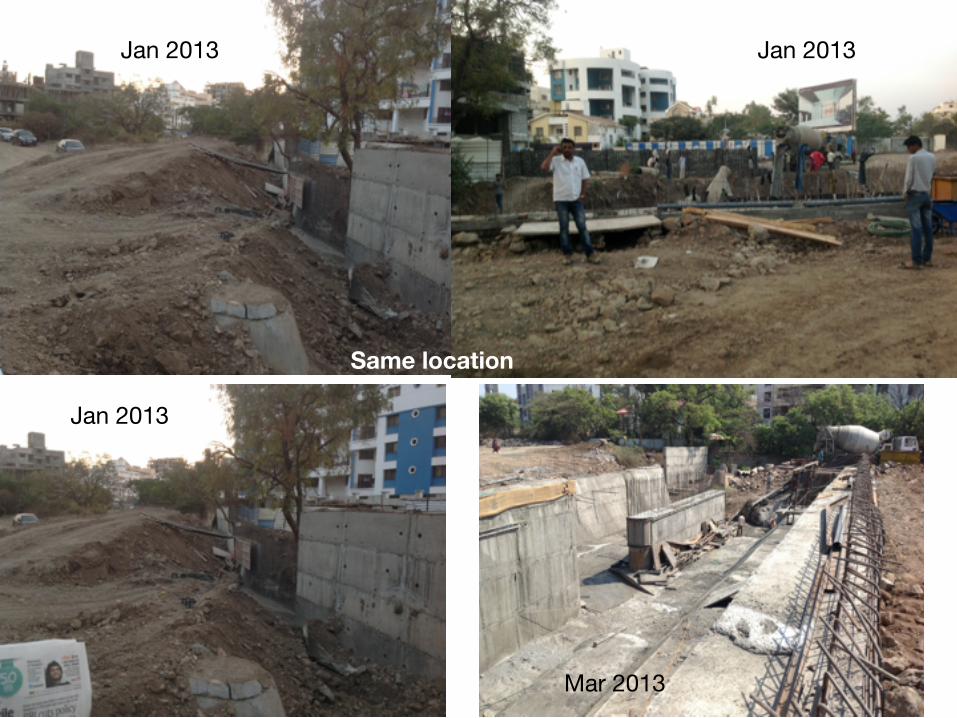
Jan 2013 Jan 2013
Jan 2013
Mar 2013
Same location
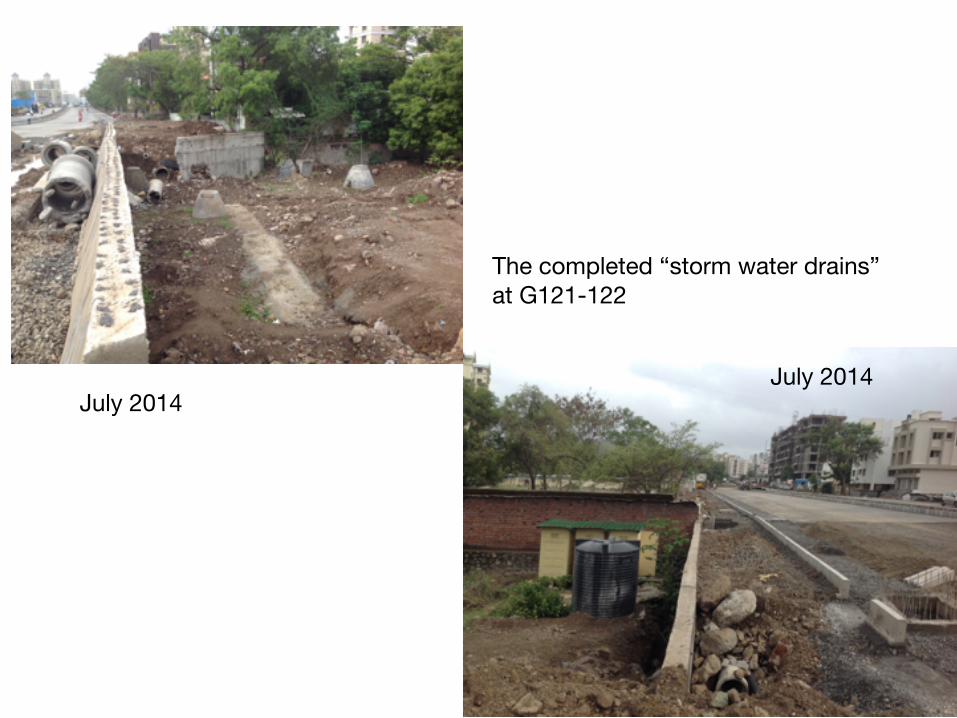
July 2014July 2014
The completed “storm water drains”at G121-122
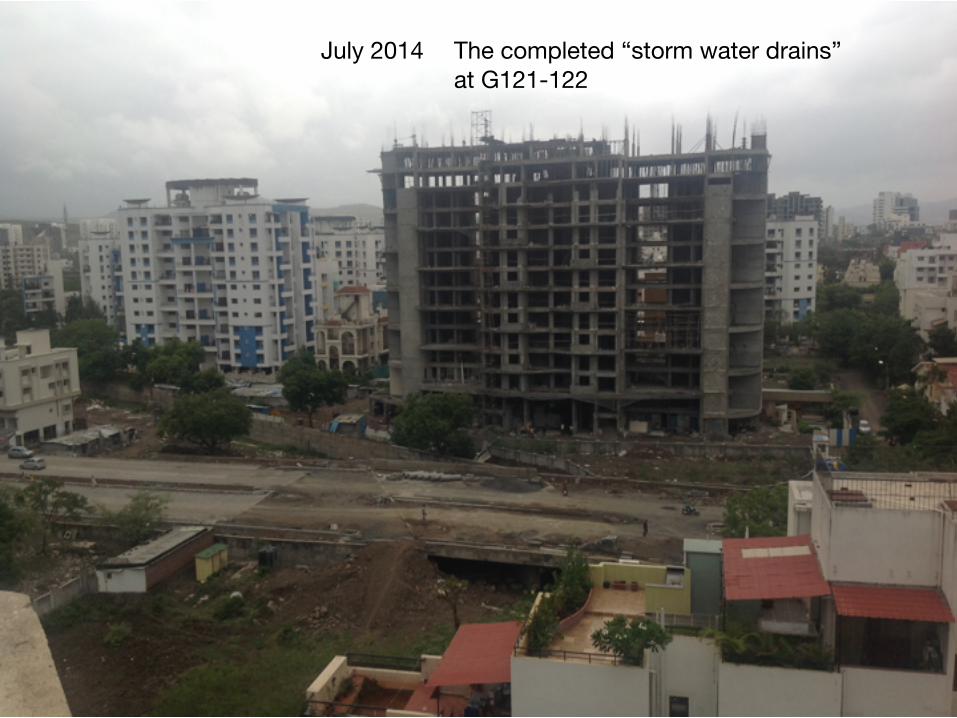
July 2014 The completed “storm water drains”at G121-122
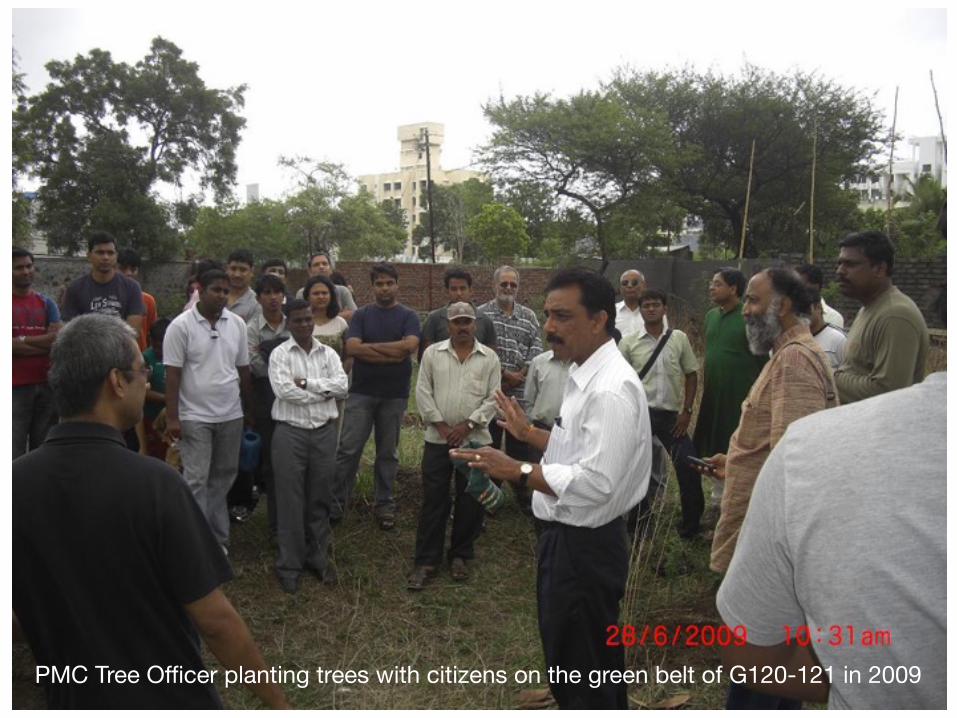
PMC Tree Officer planting trees with citizens on the green belt of G120-121 in 2009
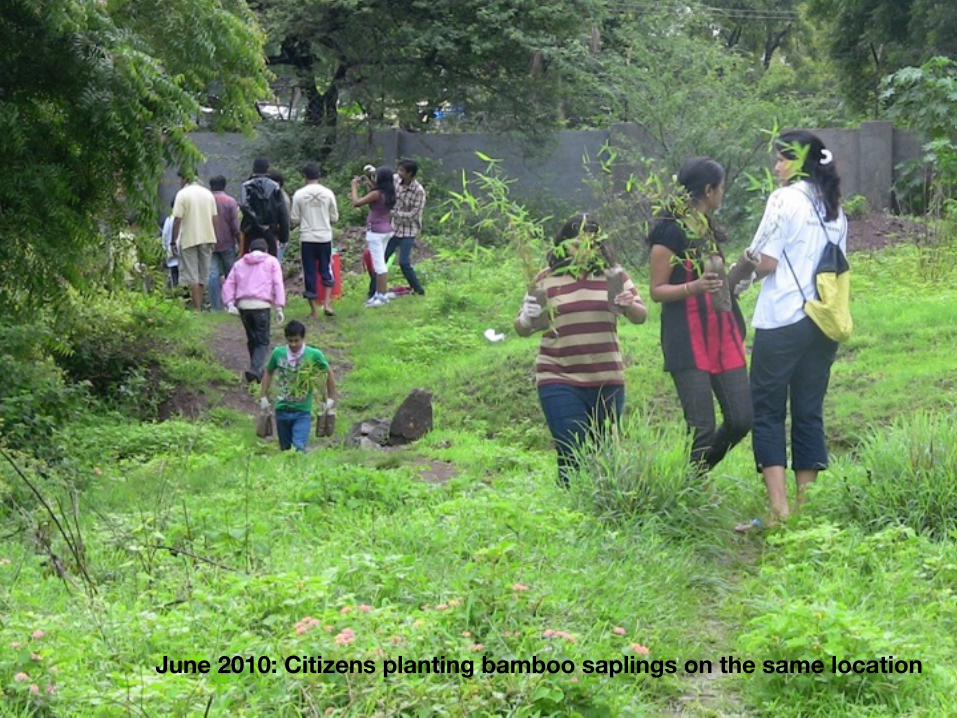
June 2010: Citizens planting bamboo saplings on the same location
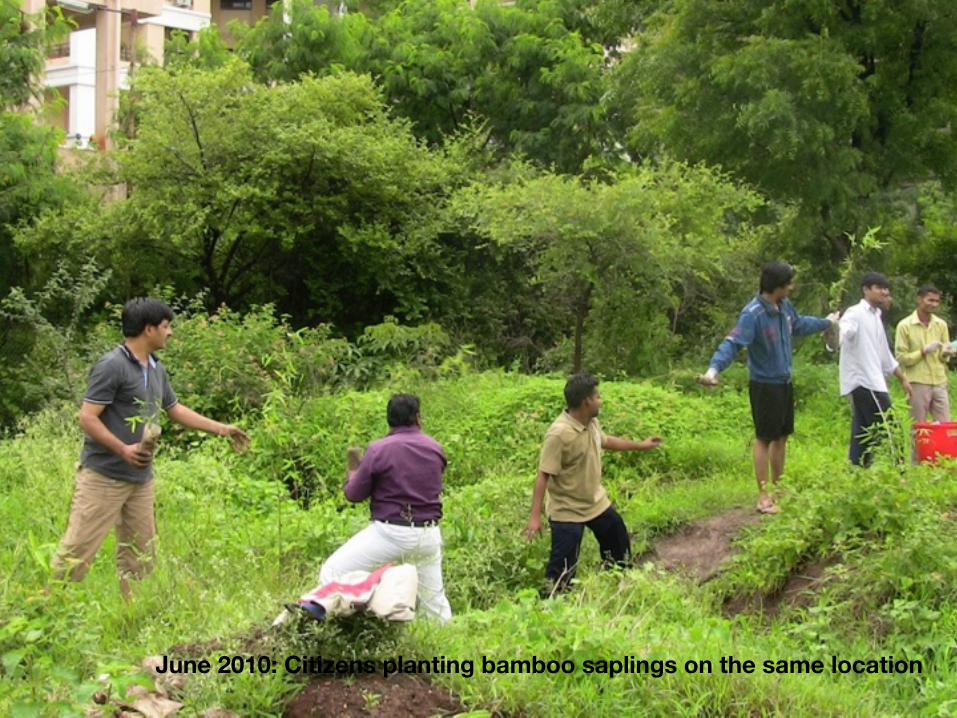
June 2010: Citizens planting bamboo saplings on the same location
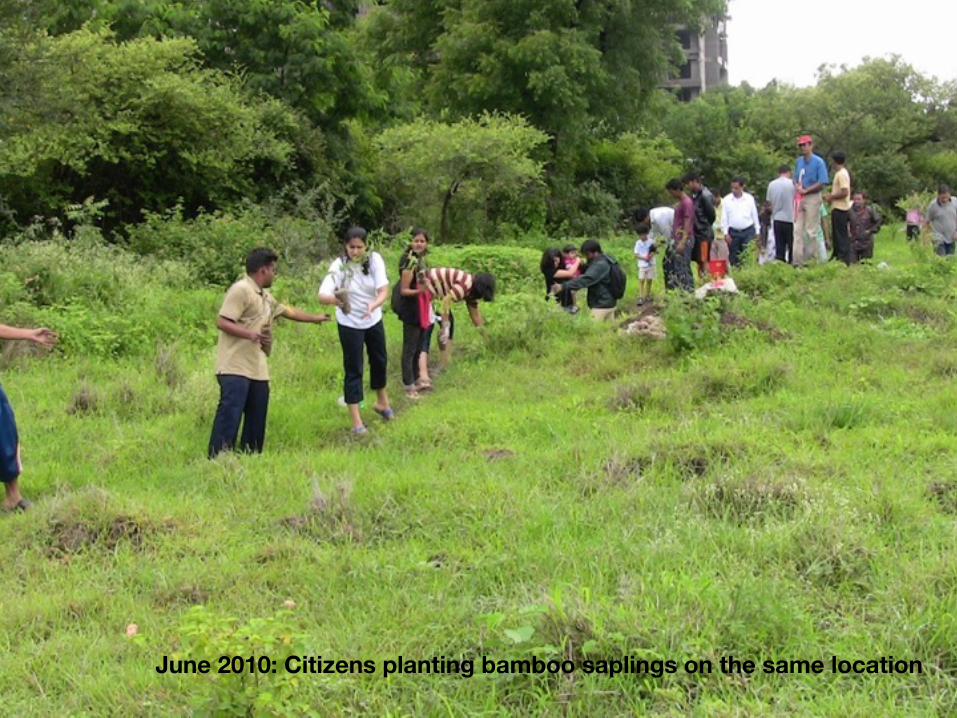
June 2010: Citizens planting bamboo saplings on the same location

June 2010 Children enjoying the fresh water stream at the same location
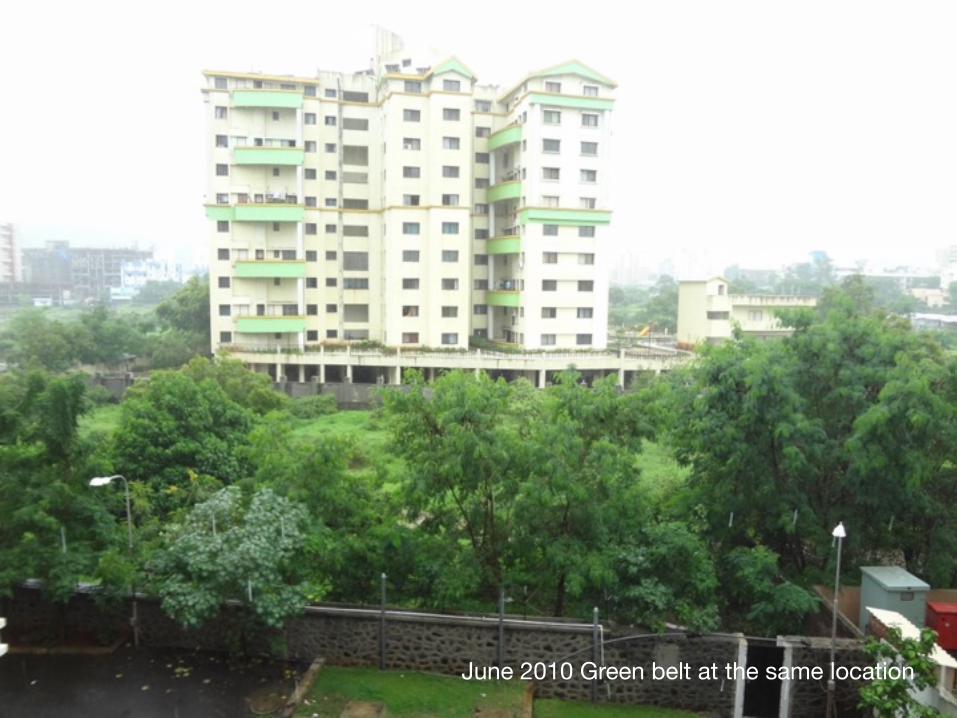
June 2010 Green belt at the same location
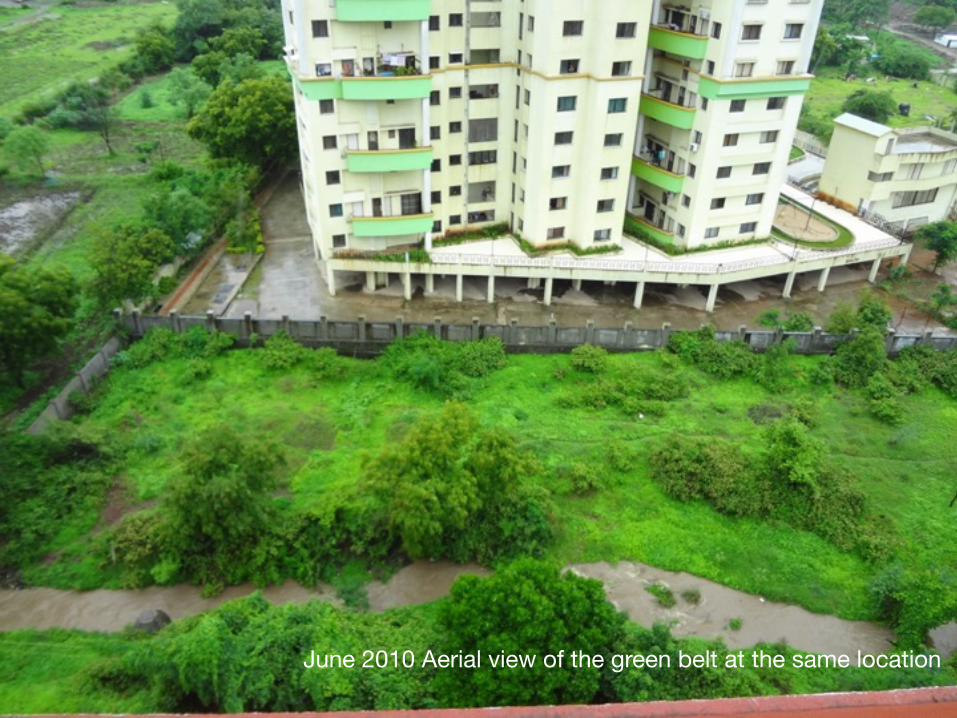
June 2010 Aerial view of the green belt at the same location
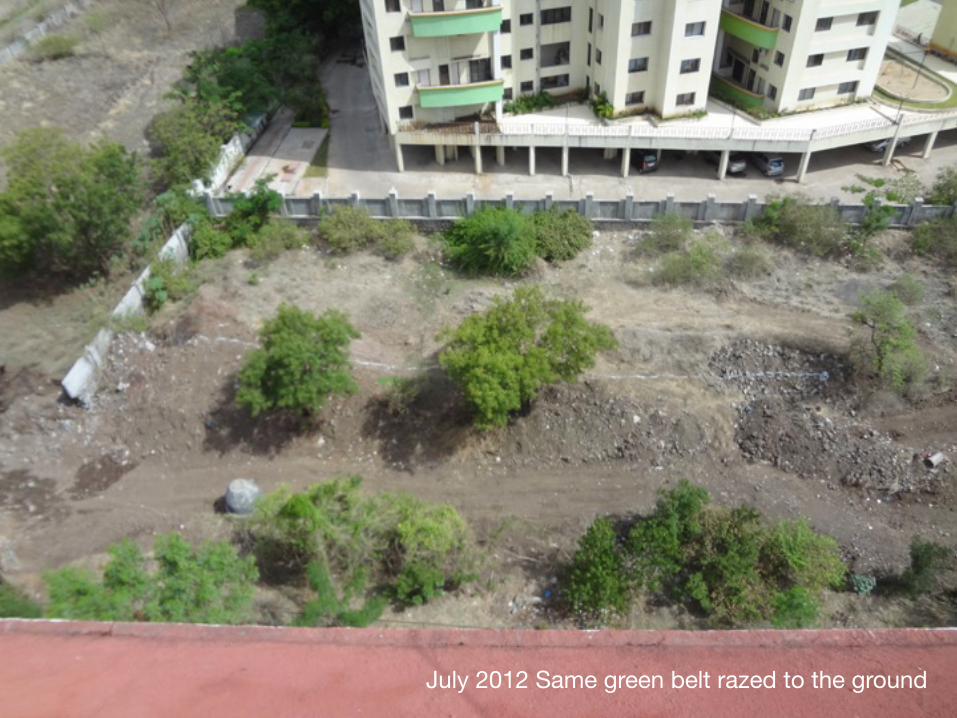
July 2012 Same green belt razed to the ground
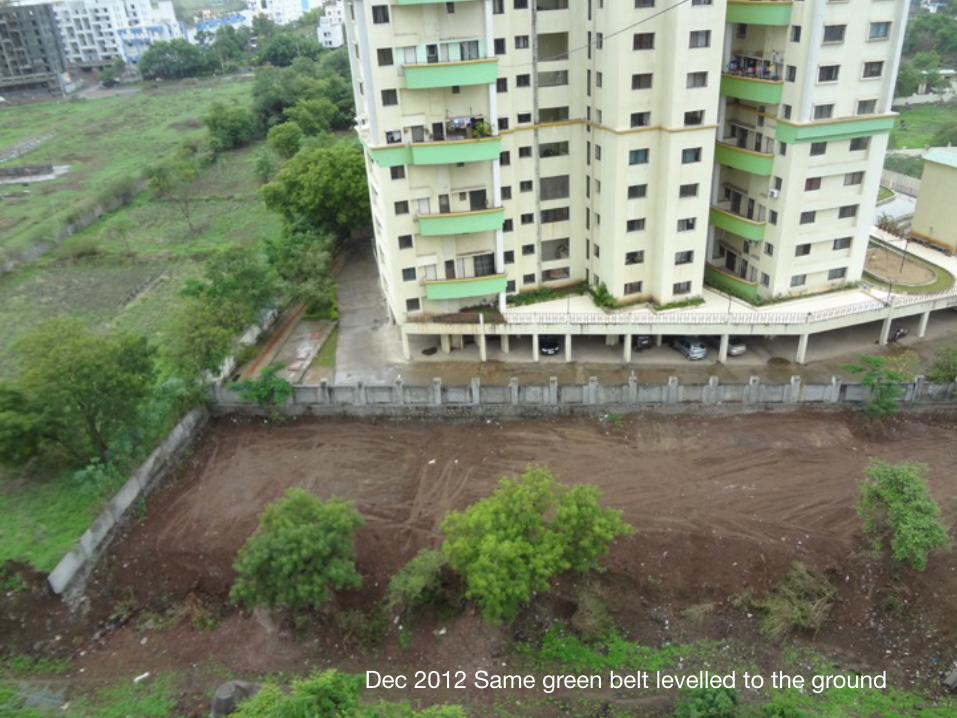
Dec 2012 Same green belt levelled to the ground
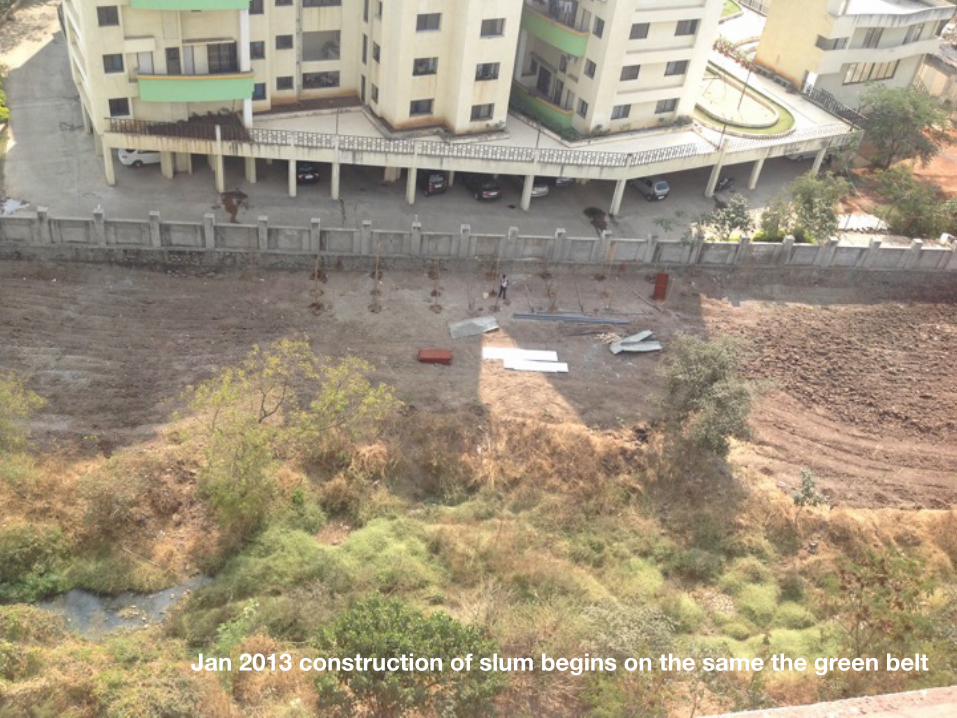
Jan 2013 construction of slum begins on the same the green belt
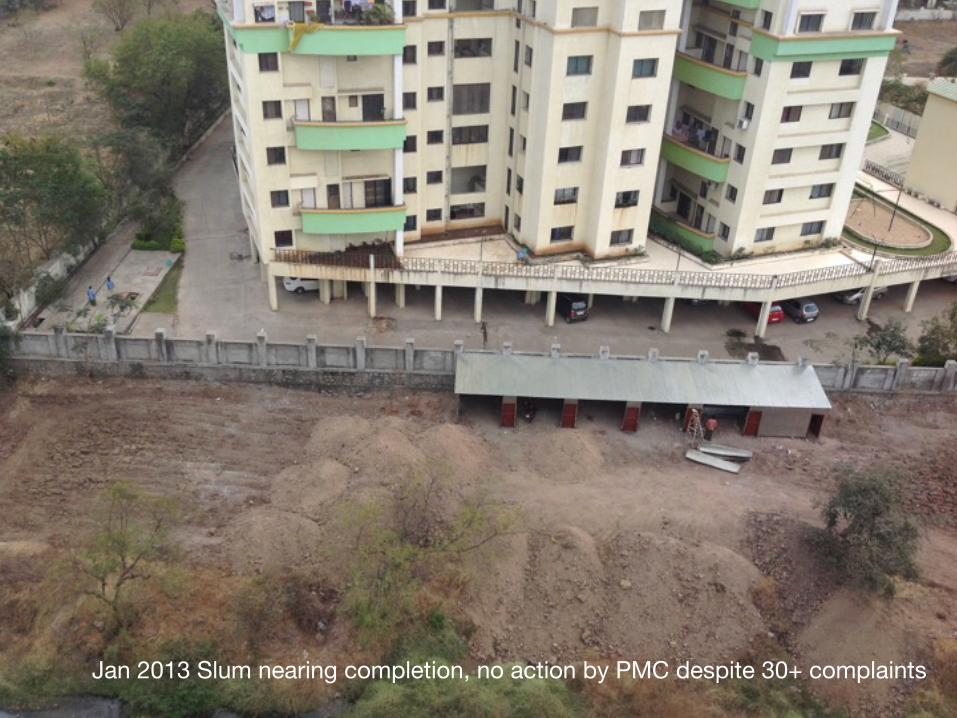
Jan 2013 Slum nearing completion, no action by PMC despite 30+ complaints
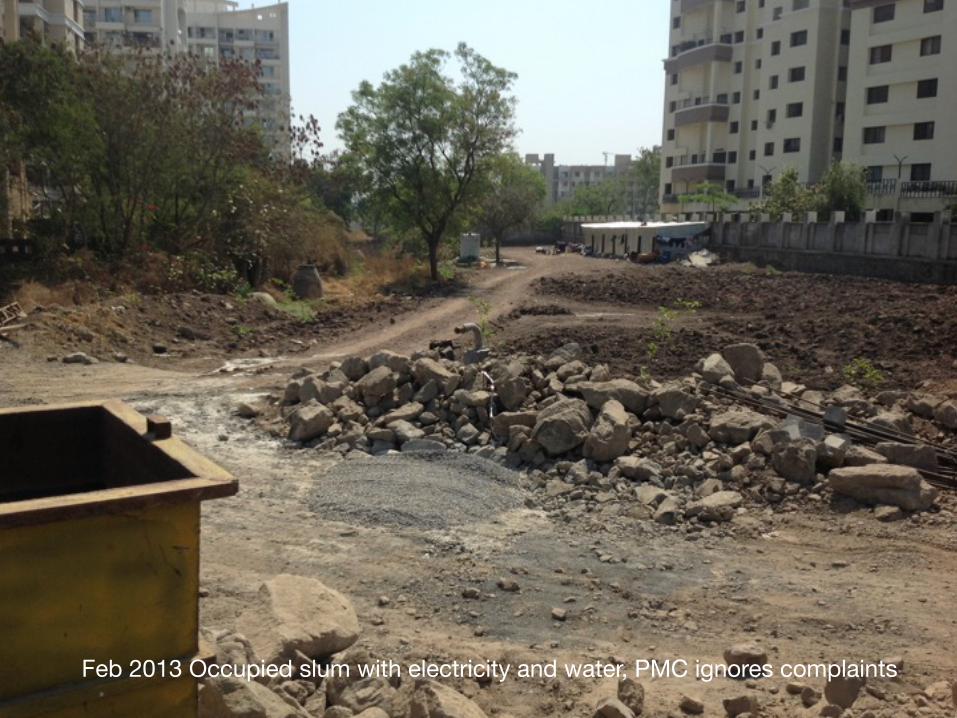
Feb 2013 Occupied slum with electricity and water, PMC ignores complaints
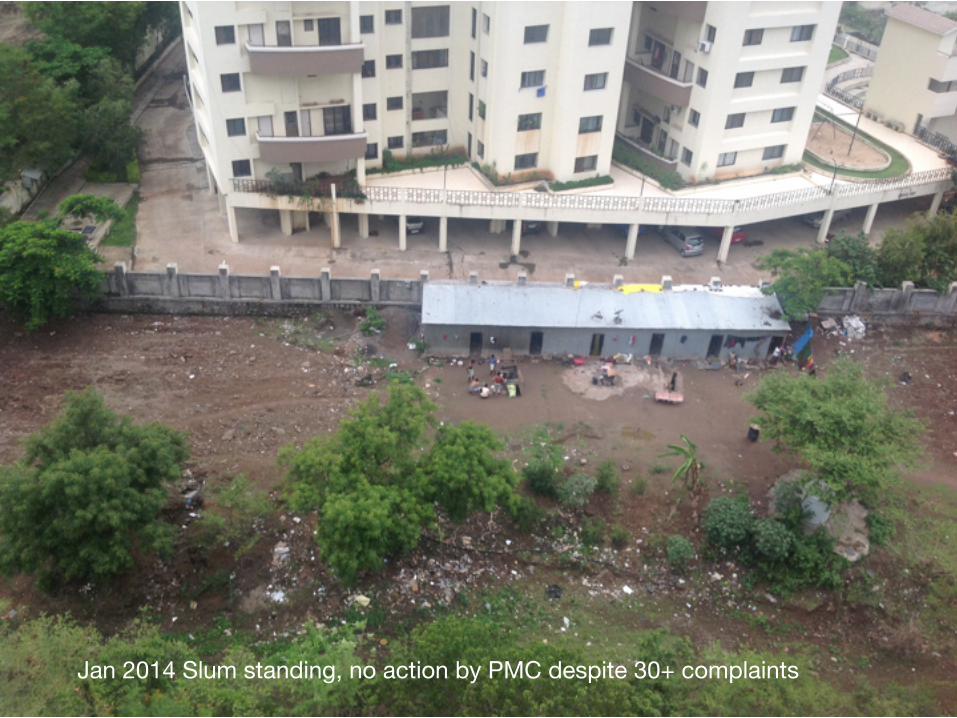
Jan 2014 Slum standing, no action by PMC despite 30+ complaints
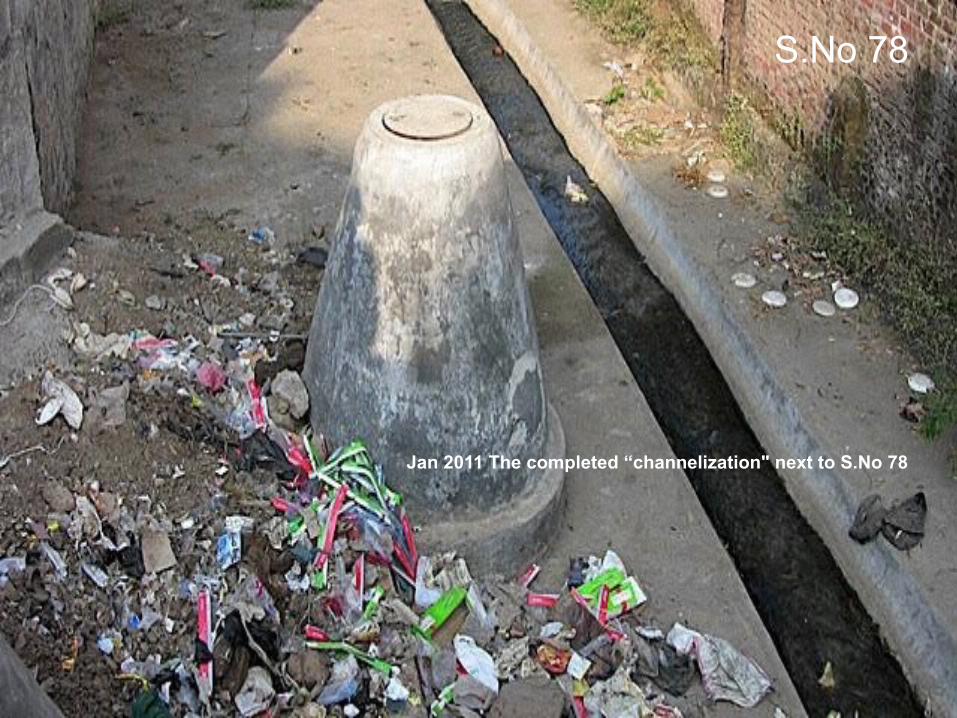
Jan 2011 The completed “channelization" next to S.No 78
S.No 78
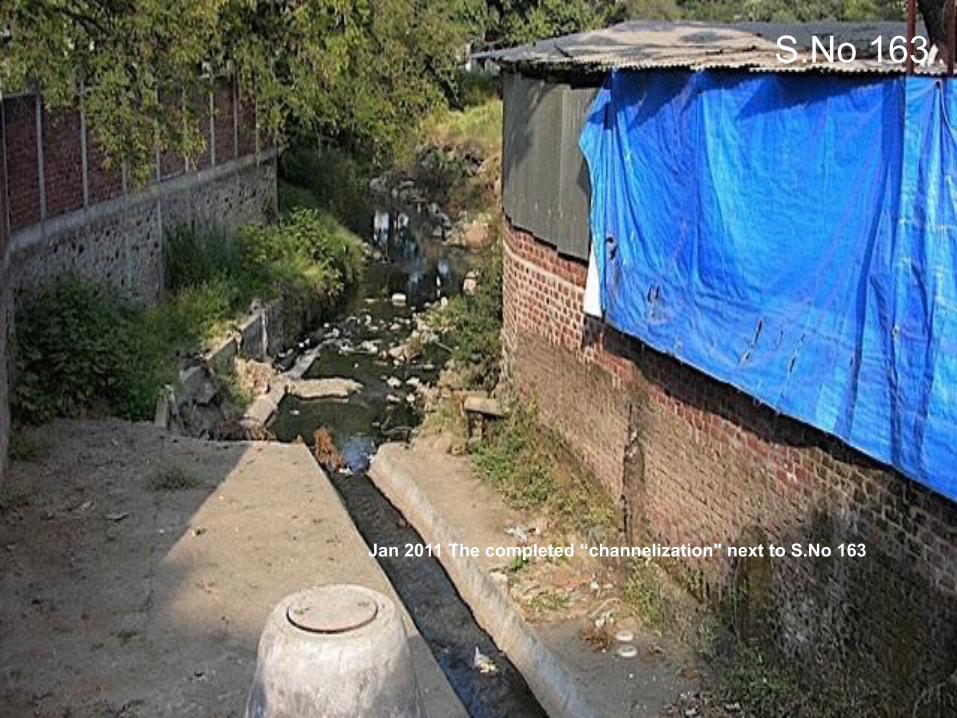
S.No 163
Jan 2011 The completed “channelization" next to S.No 163
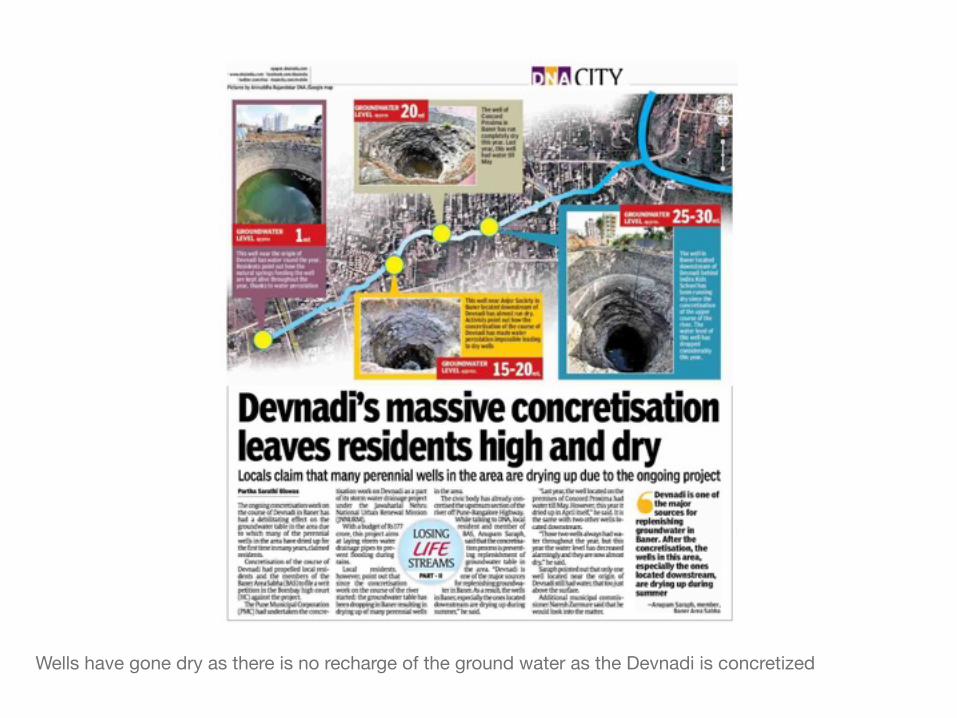
Wells have gone dry as there is no recharge of the ground water as the Devnadi is concretized
• Planning purposeless projects based on fraudulent data and premises
• Excluding the citizens and their participation
• Destroying the environment that they should protect
• Perjury by misrepresenting facts before court
• Aiding and encouraging illegalities while harassing the legal projects
• Demonstrating habitual contempt of law, justice and court orders
• Forgetting that they are the servants of the citizens and accountable to them
Bad Governance