Embed Size (px)
Citation preview

11/16/2017 www.newclimate.org 1
COP23 Bonn, 10-11-2017, EU Pavilion, 16:45-
18:15
Beyond Philanthropy
PROSPECTS—A transparent energy and
emissions tracking tool for developing countries
Sebastian Sterl
NewClimate Institute

Purpose
PROSPECTS (Policy-Related Overall
and Sectoral Projections of Emission
Curves and Time Series) is a tool for
emissions calculation and tracking
Idea of having a simplified version of CTI tools (“spin-off”) applicable to
countries for which CTI approach is too complicated
Purpose is twofold:
– Bottom-up estimations of historical sectoral emissions
– Calculation of future pathways of sectoral emissions
Rationale
– Fast rollout to any country thanks to low data needs
– Flexible policy scenarios to see effect of indicator change
11/16/2017 www.newclimate.org 2

Overview
• Overall functional design
• Demonstrations
• Way forward
11/16/2017 www.newclimate.org 3

Overall functional design
11/16/2017 www.newclimate.org 4
Historical data
Electricity / heat Buildings Cement Etc...
(supply side)
Indicator projections
(demand side)
Country overview
Data validation
(historical)
(future)
(raw data)
User input
Automatic
calculations
Legend
Energy demand time series
• Total electricity demand by sector
• Total direct energy demand by sector
• Total final energy demand by sector
• Total primary demand by fuel
Emissions time series
• By sector
• By sector with power allocated to end-use sectors
• By type (energy-related CO2, other CO2, non-CO2)

Sectoral split
11/16/2017 www. newclimate.org 5
Supply side
1) Electricity supply
2) Heat supply
Demand side
1) Buildings (residential / commercial)
2) Cement industry
3) Steel industry
4) Other industry (light / heavy)
5) Transport (passenger / freight)
6) Agriculture (energy)
Non-energy related
1) Oil & gas (fugitive, flaring)
2) Waste
3) Agriculture (non-CO2)
4) (LULUCF)

The power of PROSPECTS
Optimal balance between accuracy and simplicity
• Distilled list of metrics that together account for ~100% of a country’s emissions
• Separation of data into activity and intensity metrics Activity: country-specific, e.g. steel production, traffic demand, fuel mixes
Intensity: context-specific, e.g. energy intensity of steel, vehicle fuel economy
• Tailored link with existing databases to minimise specific data requirements
• High degree of user flexibility for emission projections through indicator levers;
intuitive list of indicators for future projections; easy to grasp for people who
are not model experts
Bottom line:
To get a good estimate of any country’s emissions, the country-specific data and resource needs can be
straightforwardly limited by appropriate choices of metrics.
11/16/2017 www.newclimate.org 6
Overview
• Overall functional design
• Demonstrations
• Way forward
11/16/2017 www.newclimate.org 7

Demonstrations
• European Union (Validation exercise)
• South Africa (Litmus test)
• Cement sector in EU, China & Nigeria (Successful
application)
• Analysis of pledges (Potential application)
11/16/2017 www.newclimate.org 8
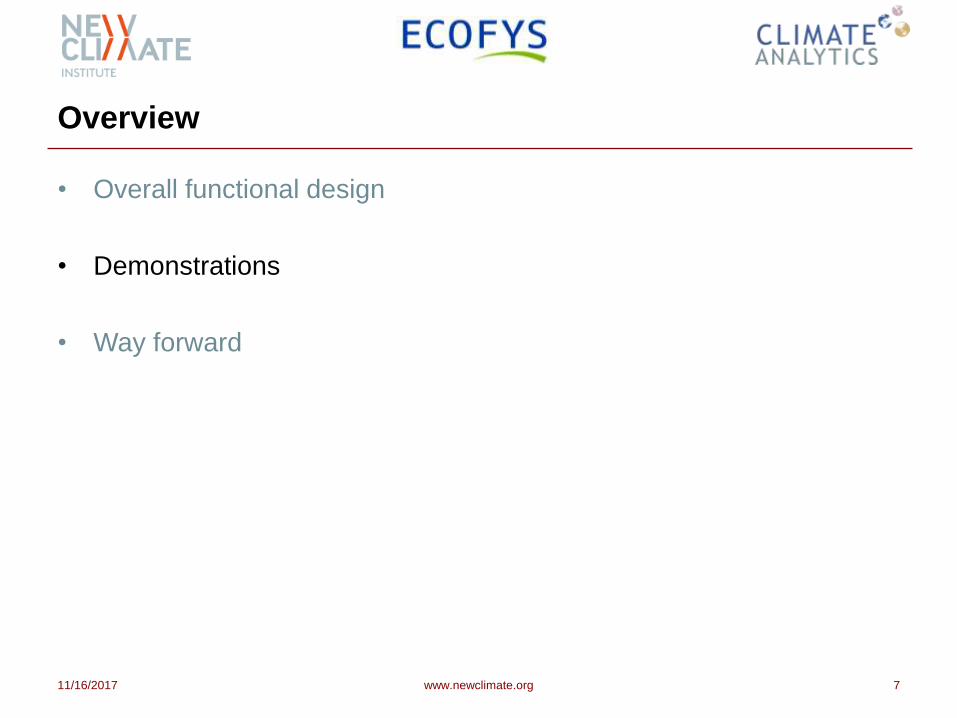
(1) European Union
11/16/2017 www.newclimate.org 9
Emissions excl. LULUCF
Emissions by sector
Emissions with power broken down to sectors
0
1,000
2,000
3,000
4,000
5,000
6,000
1990 1995 2000 2005 2010 2015
Em
issi
on
s (M
tCO
2e/y
r)
Overall emissions (excl. LULUCF)
CTI
UNFCCC
EDGAR
empty4
empty5
PROSPECTS
0
1,000
2,000
3,000
4,000
5,000
6,000
1990 1995 2000 2005 2010 2015
Em
issi
on
s (M
tCO
2e/y
r)
Overall emissions (excl. LULUCF)
CTI
UNFCCC
EDGAR
empty4
empty5
PROSPECTS
0
1,000
2,000
3,000
4,000
5,000
6,000
1990 1995 2000 2005 2010 2015
Em
issio
ns (
MtC
O2e
/yr)
Overall emissions (excl. LULUCF)
CTI
UNFCCC
EDGAR
empty4
empty5
PROSPECTS
0
1,000
2,000
3,000
4,000
5,000
6,000
Em
issio
ns (
MtC
O2e
/yr)
Emissions by sect or
Elect rici ty Heat Transport Buildings
Steel Cement Other indust ry Oil & gas
Waste Agricult ure
0
1,000
2,000
3,000
4,000
5,000
6,000
Em
issio
ns (
MtC
O2e
/yr)
Emissions by sect or
Elect rici ty Heat Transport Buildings
Steel Cement Other indust ry Oil & gas
Waste Agricult ure

11/16/2017 www.newclimate.org 10
“Status quo” scenario “Deep decarbonisation” scenario
60% RE in power by 2030
50% EVs on the road (LDVs) by 2030
90% electrification rate in heating and cooking
in buildings by 2030
Deep renovation rates of 2% by 2030
All other activity / intensity constant
All activity / intensity constant
0
1,000
2,000
3,000
4,000
5,000
6,000
19
90
19
92
19
94
19
96
19
98
20
00
20
02
20
04
20
06
20
08
20
10
20
12
20
14
20
16
20
18
20
20
20
22
20
24
20
26
20
28
20
30
Em
issio
ns (
MtC
O2e
/yr)
Emissions by sect or
Elect rici ty Heat Transport Buildings
Steel Cement Other indust ry Oil & gas
Waste Agricult ure
(1) European Union – example scenario: emissions

(1) European Union – example scenario: TPED
11/16/2017 www.newclimate.org 11
“Status quo” scenario “Deep decarbonisation” scenario
60% RE in power by 2030
50% EVs on the road (LDVs) by 2030
90% electrification rate in heating and cooking
in buildings by 2030
Deep renovation rates of 2% by 2030
All other activity / intensity constant
All activity / intensity constant
0
10,000
20,000
30,000
40,000
50,000
60,000
70,000
80,000
19
90
19
92
19
94
19
96
19
98
20
00
20
02
20
04
20
06
20
08
20
10
20
12
20
14
20
16
20
18
20
20
20
22
20
24
20
26
20
28
20
30
To
tal
pri
mary
en
erg
y d
em
an
d (P
J)
Total demand for fuels
Coal Natural gas Oil
Waste Biofuels Nuclear
Other non-fossil
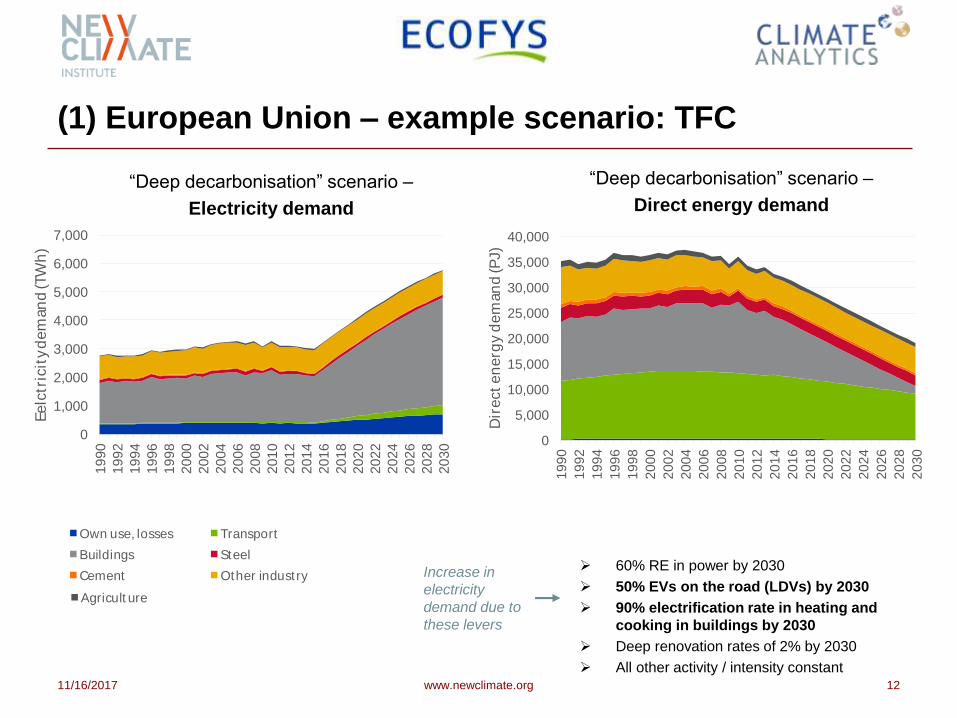
(1) European Union – example scenario: TFC
11/16/2017 www.newclimate.org 12
“Deep decarbonisation” scenario –
Electricity demand
0
5,000
10,000
15,000
20,000
25,000
30,000
35,000
40,000
19
90
19
92
19
94
19
96
19
98
20
00
20
02
20
04
20
06
20
08
20
10
20
12
20
14
20
16
20
18
20
20
20
22
20
24
20
26
20
28
20
30
Dir
ect
en
erg
y d
em
an
d (P
J)
Direct energy demand
Own use, losses Transport
Buildings Steel
Cement Other indust ry
Oil & gas Waste
Agricult ure
0
1,000
2,000
3,000
4,000
5,000
6,000
7,000
1990
1992
1994
1996
1998
2000
2002
2004
2006
2008
2010
2012
2014
2016
2018
2020
2022
2024
2026
2028
2030
Eelc
tric
ity
dem
an
d (T
Wh
)
Elect ricity demand
Own use, losses Transport
Buildings Steel
Cement Other industry
Oil & gas Waste
Agricult ure
“Deep decarbonisation” scenario –
Direct energy demand
0
5,000
10,000
15,000
20,000
25,000
30,000
35,000
40,000
Dir
ect en
erg
y d
em
an
d (P
J)
Direct energy demand
Own use, losses Transport
Buildings Steel
Cement Other indust ry
Oil & gas Waste
Agricult ure
0
5,000
10,000
15,000
20,000
25,000
30,000
35,000
40,000
Dir
ect en
erg
y d
em
an
d (P
J)
Direct energy demand
Own use, losses Transport
Buildings Steel
Cement Other indust ry
Oil & gas Waste
Agricult ure
Increase in
electricity
demand due to
these levers
60% RE in power by 2030
50% EVs on the road (LDVs) by 2030
90% electrification rate in heating and
cooking in buildings by 2030
Deep renovation rates of 2% by 2030
All other activity / intensity constant

(2) South Africa
11/16/2017 www.newclimate.org 13
Emissions excl. LULUCF
Emissions by sector
Emissions with power broken down to sectors
0
100
200
300
400
500
600
700
1990 1995 2000 2005 2010 2015
Em
issi
on
s (M
tCO
2e/y
r)
Overall emissions (excl. LULUCF)
UNFCCC
ZAFNIR 2013
EDGAR
empty4
empty5
PROSPECTS
0
100
200
300
400
500
600
700
1990 1995 2000 2005 2010 2015
Em
issi
on
s (M
tCO
2e/y
r)
Overall emissions (excl. LULUCF)
UNFCCC
ZAFNIR 2013
EDGAR
empty4
empty5
PROSPECTS
0
100
200
300
400
500
600
Em
issio
ns (
MtC
O2e
/yr)
Emissions by sect or
Elect rici ty Heat Transport Buildings
Steel Cement Other indust ry Oil & gas
Waste Agricult ure
0
100
200
300
400
500
600
700
1990 1995 2000 2005 2010 2015
Em
issi
on
s (M
tCO
2e/y
r)
Overall emissions (excl. LULUCF)
UNFCCC
ZAFNIR 2013
EDGAR
empty4
empty5
PROSPECTS
0
100
200
300
400
500
600
Em
issi
on
s (M
tCO
2e/y
r)
Emissions by sector
Elect ricit y Heat Transport
Buildings Steel Cement
Other industry Oil & gas Waste
Agricult ure
0
100
200
300
400
500
600
Em
issi
on
s (M
tCO
2e/y
r)
Emissions by sector
Elect ricit y Heat Transport
Buildings Steel Cement
Other industry Oil & gas Waste
Agricult ure

(3) Cement sector – case study
14
Sterl, Wong, et al. (2017), Manufacturing a low-carbon
society: How can we reduce emissions from cement and
steel?, Climate Action Tracker (CAT),
http://climateactiontracker.org/assets/publications/Decarb
Series/Memo_Decarb_Industry_Final.pdf

(4) Achieving the EU NDC: parameter space
11/16/2017 www.newclimate.org 15
Target:
Reduction of 40% by 2030
compared to 1990 levels
Idea:
Reaching the EU NDC through
- Electrifying transport
- Electrifying buildings
- Increasing RE share
Assumptions:
- RE replaces fossil fuels, nuclear
- EV penetration applies to all
motorised road transport (cars,
buses, trucks)
- All demand-side energy
intensities (buildings, industry,
transport, agriculture) show
autonomous improvement of
1%/year
- All other activity/intensity
indicators constant (Values in graph are for 2030; linear development from 2015 assumed)

Overview
• Overall functional design
• Demonstrations
• Way forward
11/16/2017 www.newclimate.org 16

Future work
Build a shell tool / interface around PROSPECTS for support of
ICAT (Initiative for Climate Action Transparency)
Further validation of methodology through testing on USA case
Design of credible future scenarios based on current policies
Further tests (full inventories + projections) for the following
countries planned:
– Argentina (G20) – Mongolia
– Indonesia (G20) – Georgia (under consideration)
– Turkey (G20) – Kenya (under consideration)
11/16/2017 www.climateactiontracker.org 17

Collaborators and co-authors
NewClimate Institute
Jing Zhang, Markus Hagemann, Hanna Fekete, prof. dr. Niklas Höhne
Ecofys
dr. Yvonne Deng, Karlien Wouters, Tom Berg, prof. dr. Kornelis Blok
Climate Analytics
Fabio Sferra, Jasmin Cantzler, dr. (h.c.) Bill Hare, dr. Michiel Schaeffer
PROSPECTS © 2017 Climate Action Tracker (NewClimate Institute,
Ecofys, Climate Analytics). All rights reserved.
This work was funded by the ClimateWorks Foundation.
11/16/2017 www.newclimate.org 18