Embed Size (px)
Citation preview
Seediscussions,stats,andauthorprofilesforthispublicationat:https://www.researchgate.net/publication/269931219
RegiionallNettworrkiinMarriineSciienceandTechnollogyfforrttheCarriibbean::Know–WhyNettwork
TECHNICALREPORT·JUNE2010
DOI:10.13140/2.1.3384.7363
READS
7
1AUTHOR:
WilliamSenior
UniversidadEstataldelaPenínsuladeSant…
78PUBLICATIONS155CITATIONS
SEEPROFILE
Availablefrom:WilliamSenior
Retrievedon:10January2016
UUnniitteedd NNaattiioonnss EEnnvviirroonnmmeennttaall PPrrooggrraammmmee,, UUNNEEPP
CCaarriibbbbeeaann EEnnvviirroonnmmeennttaall PPrrooggrraammmmee,, CCEEPP
CCeenntteerr ffoorr EEnnvviirroonnmmeennttaall mmaannaaggeemmeenntt ooff BBaayy aanndd CCooaassttaall AArreeaass,, CCiimmaabb
RREEGGIIOONNAALL PPRROOJJEECCTT:: ""RReeggiioonnaall NNeettwwoorrkk iinn MMaarriinnee SScciieennccee aanndd TTeecchhnnoollooggyy ffoorr tthhee CCaarriibbbbeeaann:: KKnnooww ––WWhhyy NNeettwwoorrkk ""..
PROGRAMME FOR MONITORING THE QUALITY OF MARINE
ECOSYSTEMS IN HIGH-RISK AREAS IN THE WIDER CARIBBEAN REGION
FINAL REPORT
JJuunnee,, 22001100
CCoollllaabboorraattoorrss::
Chris Corbin
Nadia-Deen Ferguson Marko Tosic
Coordination Uni of Caribean Envrinmental Program,
Jamaica.
Antonio Villasol Núñez Jesús Beltrán González Marlén Pérez Hernández Ibis Torres Ramón Rodríguez Félix Solar Reinaldo Alvárez Reinaldo Regadera Lissi López Lienna Bell Fernando Ruiz Mismel Ruiz Yamiris Gómez Liseth García Center for Environmental Management of Bays and Coastal
Areas
Victor Manuel Martínez Ninoska Chow Centro para la Investigación de Recursos Acuáticos de
Nicaragua (CIRA/UNAN)
William Senior Fabiola López-Monroy Arístide Márquez Antonio Benítez Ivis Marina Fermín Universidad de Oriente, Venezuela
Jesús Antonio Garay Tinoco Juan Pablo Parra Lizbeth Janet Vivas-Aguas Betty Cadavid Ibañez Luisa Fernanda Espinosa Silvia Narváez Flórez Julián Mauricio Betancourt Instituto de Investigaciones Marinas y Costeras José Benítez
Vives De Andréis, Colombia.
Commodore Anthony Franklin
Darryl Banjoo Aphtaab Mohammed Institute of Marine Affairs, Trinidad y Tobago
Delphina Vernor Christopher Cox Avril Isaac
Caribbean Environmental Health Institute, Santa Lucía
Kapleton Hall Stacey Moses Pamela Mkenzic Dion Nelly Sean Green National Environmental and Planning Agency, Jamaica

TABLE OF CONTENT
INTRODUCTION. .............................................................................................................................................. - 1 -
BACKGROUND ................................................................................................................................................... - 1 -
GEOGRAPHICAL AND SOCIO-ECONOMIC DESCRIPTION OF THE WIDER CARIBBEAN REGION
(WCR). ................................................................................................................................................................. - 3 -
METHODOLOGICAL GUIDELINES FOR SAMPLING ............................................................................. - 5 -
WATER QUALITY MONITORING ................................................................................................................ - 8 -
LAGUNA DE BLUEFIELDS (NICARAGUA) ............................................................................................................ - 8 - POINT LISAS PORT, GULF OF PARIA (TRINIDAD AND TOBAGO) ....................................................................... - 17 - BAHÍA DE LA HABANA, CUBA (CUBA) ............................................................................................................ - 23 - CIÉNAGA GRANDE SANTA MARTA (COLOMBIA) ............................................................................................. - 30 - GOLFO DE CARIACO (VENEZUELA) ................................................................................................................. - 41 - KINGSTON HARBOUR (JAMAICA) .................................................................................................................... - 47 - EVALUATION ABOUT THE QUALITY OF COASTAL WATER IN THE SMALL ISLANDS OF THE CARIBBEAN. ............ - 56 -
FINAL CONSIDERATIONS ........................................................................................................................... - 58 -
RECOMENDACIONES ................................................................................................................................... - 59 -
BIBLIOGRAPHY. ............................................................................................................................................ - 60 -
TABLES INDEX
TABLE 1. WATER QUALITY INDICATORS APPROVED AT THE REGIONAL WORKSHOP ON QUALITY INDICATORS OF
SEAWATER AND METHODOLOGIES FOR POLLUTING DISCHARGES IN THE WIDER CARIBBEAN REGION .......... - 5 - TABLE 2. NITROGENATED COMPOUNDS (MG.L-1) DETERMINED IN LAGUNA DE BLUEFIELDS (NICARAGUA). ...... - 12 - TABLE 3. TN:TP RATIO VALUES IN LAGUNA DE BLUEFIELDS .............................................................................. - 14 - TABLE 4. RESULTS OBTAINED FROM THE ANALYSIS OF VARIANCE AND THE DUNCAN MULTIPLE RANGE TEST FOR ONE
WAY FOR THE NORTHERN ZONE AND THE SOUTHERN ZONE OF THE GULF OF CARIACO (P<0.05). ............... - 46 - TABLE 5. CORRELATIONS MATRIX BETWEEN THE HYDRO-CHEMICAL INDICATORS (SIGNIFICANT CORRELATIONS ARE IN
RED) ............................................................................................................................................................ - 51 -
FIGURES INDEX
FIGURE 1. STATES AND TERRITORIES MAKING UP THE WIDER CARIBBEAN REGION. ............................................. - 4 - FIGURE 2. HIGH RISK AREAS MONITORED DURING THE “KNOW WHY NETWORK” PROJECT. ................................. - 7 - FIGURE 3. NETWORK OF STATIONS FOR THE MONITORING OF THE QUALITY OF WATER AND SEDIMENTS IN LAGUNA DE
BLUEFIELDS (NICARAGUA). ........................................................................................................................ - 10 - FIGURE 4. DISTRIBUTION OF TOTAL SUSPENDED SOLIDS SST (MG L-1) IN LAGUNA DE BLUEFIELDS (MAY 2008).- 11 - FIGURE 5. DISTRIBUTION OF TOTAL PHOSPHORUS (MG L-1) IN LAGUNA DE BLUEFIELDS (MAY 2008). ............ - 13 - FIGURE 6. RELATIVE CONTRIBUTION OF THE LARGE TAXONOMIC GROUPS OF PHYTOPLANKTON TO THE RICHNESS OF
THE SPECIES AND AMOUNT OF TAXA IDENTIFIED BY STATIONS IN THE LAGUNA DE BLUEFIELDS MONITORING.- 15
- FIGURE 7. SEDIMENT FRAGMENTS IN LAGUNA DE BLUEFIELDS............................................................................ - 16 - FIGURE 8. DISTRIBUTION OF ORGANIC MATERIAL (%) ......................................................................................... - 16 - FIGURE 9. NETWORK OF STATIONS TO MONITOR WATER AND SEDIMENT QUALITY IN POINT LISAS, GULF OF PARIA
(TRINIDAD &TOBAGO). .............................................................................................................................. - 18 - FIGURE 10. DISSOLVED OXYGEN LEVELS AT POINT LISAS, GULF OF PARIA. ........................................................ - 19 - FIGURE 11. PHOSPHATE LEVELS IN THE GULF OF PARIA, TRINIDAD AND TOBAGO. ............................................. - 20 - FIGURE 12. AMMONIA NITROGEN LEVELS IN THE GULF OF PARIA (TRINIDAD AND TOBAGO). ............................ - 21 - FIGURE 13. CHLOROPHYLL-A LEVELS IN THE GULF OF PARIA (TRINIDAD AND TOBAGO). ................................... - 22 - FIGURE 14. DISSOLVED AND DISPERSED HYDROCARBON LEVELS (DDHP) IN THE GULF OF PARIA (TRINIDAD AND
TOBAGO). ................................................................................................................................................... - 22 - FIGURE 15. NETWORK OF STATIONS TO MONITOR THE WATER QUALITY IN HAVANA BAY (CUBA): 1 - ENTRANCE
CANAL, 2- MARIMELENA INLET, 3 – GUASABACOA INLET, 4- ATARÉS INLET Y 5-CENTER OF THE BAY. ..... - 24 - FIGURE 16. HISTORICAL TREND OF THE PRINCIPAL QUALITY INDICATORS OF THE WATERS IN HAVANA BAY ...... - 26 - FIGURE 17. COMPARISON OF BOD5 LEVELS BY YEARS IN THE BAY’S SURFACE WATERS ...................................... - 27 - FIGURE 18. TENDENCY OF HYDROCARBONS IN WATER IN HAVANA BAY. ............................................................ - 28 - FIGURE 19. FECAL COLIFORM CONCENTRATIONS IN THE HAVANA BAY WATERS DURING THE LAST THREE YEARS- 28 - FIGURE 20. DISTRIBUTION OF TOTAL HYDROCARBONS BY YEARS IN RECENT SEDIMENTS IN HAVANA BAY ......... - 29 - FIGURE 21. SAMPLING STATIONS IN THE CIÉNAGA GRANDE DE SANTA MARTA LAGOON SYSTEM. THE COLORS
REPRESENT ESTABLISHED ZONES. ............................................................................................................... - 32 - FIGURE 22. SPACE AND TIME VARIATION OF AVERAGE SALINITY OF SURFACE WATER BETWEEN FEBRUARY AND MAY
OF 2008 (MONTHS REPRESENTED BY NUMBERS 2 AND 5), IN THE SIX ZONES OF THE CGSM SAMPLING. THE
BLACK BARS REPRESENT TYPICAL ERROR. .................................................................................................. - 33 - FIGURE 23. SPACE AND TIME VARIATION OF AVERAGE DISSOLVED OXYGEN (MG L-1) OF SURFACE WATER, BETWEEN
FEBRUARY AND MAY OF 2008 (MONTHS REPRESENTED BY NUMBERS 2 AND 5), IN THE SIX ZONES OF CGSM
SAMPLING. .................................................................................................................................................. - 34 - FIGURE 24. SPACE AND TIME VARIATION OF TOTAL SUSPENDED SOLIDS (MG/L) AVERAGE OF SURFACE WATER IN
FEBRUARY (2) AND APRIL (4) OF 2008 IN THE SIX ZONES OF CGSM SAMPLING. ........................................ - 35 - FIGURE 25. SPACE AND TIME VARIATION OF CHLOROPHYLL-A CONCENTRATION (µG/L) IN SURFACE WATER BETWEEN
FEBRUARY AND MAY 2008 IN THE SIX CGSM SAMPLING ZONES. .............................................................. - 36 - FIGURE 26. SPACE AND TIME VARIATION OF NITRATES NO3 (µMOL L-1) IN THE SURFACE WATERS OF THE SIX CGSM
SAMPLING ZONES IN FEBRUARY (2) AND APRIL (4) 2008. ........................................................................... - 36 - FIGURE 27. AVERAGE SPACE AND TIME VARIATION OF AMMONIUM NH4 (µMOL L-1) IN THE SURFACE WATER OF THE SIX
CGSM SAMPLING ZONES IN FEBRUARY (2) AND APRIL (4) 2008. ............................................................... - 37 - FIGURE 28. AVERAGE SPACE AND TIME VARIATION OF ORTHOPHOSPHATES PO3-
4 (µMOL L-1) IN SURFACE WATER OF
THE SIX CGSM SAMPLING ZONES IN FEBRUARY (2) AND APRIL(4) 2008. ................................................... - 38 - FIGURE 29. SPACE AND TIME VARIATIONS OF TOTAL COLIFORM (NMP/100 ML) MEASURED IN SURFACE WATER AND
ADJACENT TO STILT-HOUSING AND CGSM COASTAL SETTLEMENTS IN FEBRUARY (2) AND APRIL(2 ) 2008.- 38 - FIGURE 30. SPACE AND TIME VARIATIONS OF THERMO-TOLERANT COLIFORM (NMP/100 ML) MEASURED IN SURFACE
WATER AND ADJACENT TO STILT-HOUSING AND CGSM COASTAL SETTLEMENTS IN FEBRUARY (2) AND APRIL (4)
2008. .......................................................................................................................................................... - 39 - FIGURE 31. NETWORK OF STATIONS FOR THE EVALUATION OF WATER QUALITY IN THE GULF OF CARIACO. ....... - 42 -

FIGURE 32. TEMPERATURE, SUSPENDED SOLID AND DISOLVED OXYGEN IN CARIACO GULF, SUCRE STATE, VENEZUELA, DURING MARCH OF 2008. ........................................................................................................................... - 43 -
FIGURE 33. CONCENTRATIONS OF TOTAL NITROGEN IN THE GULF OF CARIACO, SUCRE STATE, VENEZUELA, DURING
MARCH OF 2008. ........................................................................................................................................ - 44 - FIGURE 34. CONCENTRATIONS OF AMMONIUM (A) AND PHOSPHATE (B) IN THE CARIACA GULF, SUCRE STATE,
VENEZUELA, DURING MARCH OF 2008. ...................................................................................................... - 45 - FIGURE 35. CONCENTRATIONS OF SILICATE IN THE GULF OF CARIACO, SUCRE STATE, VENEZUELA, DURING MARCH OF
2008. .......................................................................................................................................................... - 45 - FIGURE 36. STATIONS NETWORK TO MONITORING WATER AND SEDIMENT QUALITY IN KINGSTON HARBOUR
(JAMAICA). ................................................................................................................................................. - 49 - FIGURE 37. LEVELS OF AMMONIA NITROGEN IN KINGSTON BAY, JAMAICA. ........................................................ - 50 - FIGURE 38. VALUES FOR HPDD CONCENTRATION IN THE STATIONS STUDIED. .................................................... - 51 - FIGURE 39. ANALYSIS CLUSTER WITH SURFACE AVERAGE VALUES PER STATION OF ALL THE HYDRO-CHEMICAL
INDICATORS IN KINGSTON HARBOUR. ........................................................................................................ - 53 - FIGURE 40. CLASSIFICATION OF BAY SEDIMENTS ACCORDING TO CONCENTRATIONS OF ORGANIC CARBON OC (%) Y
ORGANIC NITROGEN ON (%) ..................................................................................................................... - 54 - FIGURE 41. VALUES OF CLOSTRIDIUM PERFRINGENS CONCENTRATION AT THE DIFFERENT STATIONS SAMPLED IN
KINGSTON BAY .......................................................................................................................................... - 55 -

ACRONIMS AND ABBREVIATIONS
AMEP: Assessments and Management of Environmental Pollution
CEHI: Caribbean Environmental Health Institute, St Lucia.
CEP: Caribbean Environmental Program
CGSM: Ciénaga Grande de Santa Marta, Colombia
CIMAB: Center for Enviromental Management of Bays and Coastal Areas (Centro de Ingeniería y Manejo Ambiental de Bahías y Costas), Cuba.
CIRA/UNAN: Centro para la Investigación en Recursos Acuáticos de la Universidad Nacional Autónoma de Nicaragua.
EPA: Environmental Agency Protection, USA
GEF: Global Environmental Facility
IMA: Institute of Marine Affaire, Trinidad & Tobago
INVEMAR: Instituto de Investigaciones Marinas y Costeras José Benito Vives de Andréis, Colombia.
LBS: Land Based Sources.
NEPA: National Environmental and Planning Agency, Jamaica
SIDA: Swedish International Development Agency
SIDS: Small Island Development State
UDO: Universidad de Oriente, Venezuela.
UNDP: United Nation Development Programme
UNEP: United Nation Environment Programme
UNEP-CAR/RCU: United Nation Environment Program - Caribbean Regional Coordination Unit
UNOPS: United Nations Office for Project Services
WCR: Wider Caribbean Region
- 1 -
INTRODUCTION.
The Marine Sciences and Technologies Regional Project for the Wider Caribbean Region, known as ”Know Why Network”, came into being as part of the financial support provided by the Swedish Development Agency (SIDA) and is administered and directed by the AMEP sub-programme (Evaluation and Management of Marine Pollution) of the Caribbean Environmental Programme (CEP).
The general aim of this project is the exchange of capacities between countries with the objectives of implementing the Pollution from Land-based Sources Protocol (LBS) and improving knowledge about the environmental quality of the marine ecosystems and their resources in the Wider Caribbean Region (WRC).
The specific objectives of the Know Why Network Project are:
1. To develop and strengthen the capacity of participating institutions with the aim of establishing a regional network in order to implement the LBS Protocol.
2. To provide in situ data and information to establish an environmental baseline in high risk pollution areas of the Wider Caribbean Region.
3. To exchange technologies among the countries, for example Geographic Information Systems (GIS), including the use of Remote Sensors to map the pollution levels from the discharges of Land-based Sources of Marine Pollution.
4. To develop methodological guidelines to classify waters as Class I and II according to the LBS Protocol.
In order to fulfil the second objective, the Monitoring Programme in High Risk Areas in the
Wider Caribbean Region was designed.
The selected areas were: Bahía de Bluefields (Nicaragua), Port of Point Lisas (Trinidad and Tobago), Bahía de La Habana (Cuba), Cienaga Grande Santa Marta (Colombia), Golfo de Cariaco (Venezuela) and Kingston Harbour (Jamaica).
This report shows the monitoring results of the waters studied under the Regional Marine Sciences and Technologies Network for the Wider Caribbean “Know Why Network”.
Background
The ninth meeting of the Supervisory Committee for the Caribbean Environmental Programme (CEP) approved the Work Plan for 1992-1993 in June of 1991. One of the activities of the Regional Programme for Integrated Planning and Institutional Development (IPID) of CEP was the Regional Project for Environmental Planning and Management of Heavily Polluted Bays and Coastal Areas in the Wider Caribbean, which invited participation, through the CEP Regional Coordination Unit (CEP-RCU), of Barbados, Colombia, Costa Rica, Cuba, Guadalupe, Jamaica, Martinique, Nicaragua, Trinidad & Tobago, the Dominican Republic and Venezuela. The objectives of this project were:
- 2 -
• To assist the countries in the region with implementation and strengthening of environmental actions along with actions dealing with institutional development.
• To promote horizontal technical cooperation between institutions responsible for the environmental management of bays and coastal areas in the Wider Caribbean.
• To implement studies in the case of severely polluted bays and coastal areas in order to assess the needs for assistance in the development of priority strategies to reduce and control pollution.
• To increase technical and scientific capacities of participating institutions with special emphasis on the development of human resources.
• To provide governments with the methodologies and recommendations needed to control and reduce pollution problems in bays and coastal areas.
The RCU/CEP-UNEP and the Centre for the Engineering and Environmental Management of Bays and Coasts (Cimab) of Cuba signed a Letter of Agreement for the realization of the aforementioned project. In that Letter of Agreement, Cimab took on the responsibility for the implementation of the Regional Project, and the activities for the September 1992 to June 1993 phase were defined.
One of the activities of the period was the evaluation and selection of the Case Studies, and of these, the following were selected: Bahía de Cartagena in Colombia; Puerto Limón in Costa
Rica; Bahía de La Habana in Cuba; Kingston Harbour in Jamaica; Bahía de Bluefields in
Nicaragua; Point Lisas zone in Trinidad and Tobago; the Santo Domingo coastline in the
Dominican Republic and Bahía de Pozuelos in Venezuela.
As a result of the work carried out in these countries and with the support of the information obtained by the project in four countries (Colombia, Costa Rica, Cuba and Jamaica), a new project with GEF (Global Environmental Facility) funds was approved in 1995, carried out by the United Nations Office for Project Services (UNOPS) and the United Nations Development Programme (UNDP) under the name of “Planning and Management of Heavily Polluted Bays and Coastal Areas,” which lasted until May of 1998.
From 1995, the other countries, Nicaragua, the Dominican Republic, Trinidad & Tobago and
Venezuela, continued working with funding from the Swedish government through the Swedish Development Agency (SIDA). Preliminary Assessment Studies were carried out to diagnose the pollution status in these areas, and guidelines were drafted for creating the Environmental Management Plan for each case study.
The main results obtained by the participating countries in both regional projects enabled the identification of the principal source of pollution to the Caribbean Sea: pollution from land-
based sources.
Carrying out the regional project contributed valuable information and broad experiences in the following areas: land-based pollution sources, environmental management of coastal areas,

- 3 -
marine pollution, existing and necessary institutional capacities, horizontal cooperation and community participation.
The results obtained by both projects facilitated the determination of principal problems in the coastal areas of the Wider Caribbean. These were:
• Negative effects on the quality of water and sediments, including beach areas
• Negative effects on natural communities
• Inadequate handling of liquid and solid waste
• Lack of the necessary oceanographic information
• Lack of legal instruments and/or the necessary mechanisms so that these instruments might be functional
• Lack of qualified personnel to tackle the work related to the topic
• Poor environmental education
Environmental problems detected in high risk coastal areas in the Wider Caribbean region in the 1990’s persist and have even increased in some instances. For that reason, the environmental monitoring component was included in the “Know Why Network” project with the aim of updating and improving knowledge about environmental quality of the marine ecosystems and their resources in the Wider Caribbean Region.
GEOGRAPHICAL AND SOCIO-ECONOMIC DESCRIPTION OF THE WIDER
CARIBBEAN REGION (WCR).
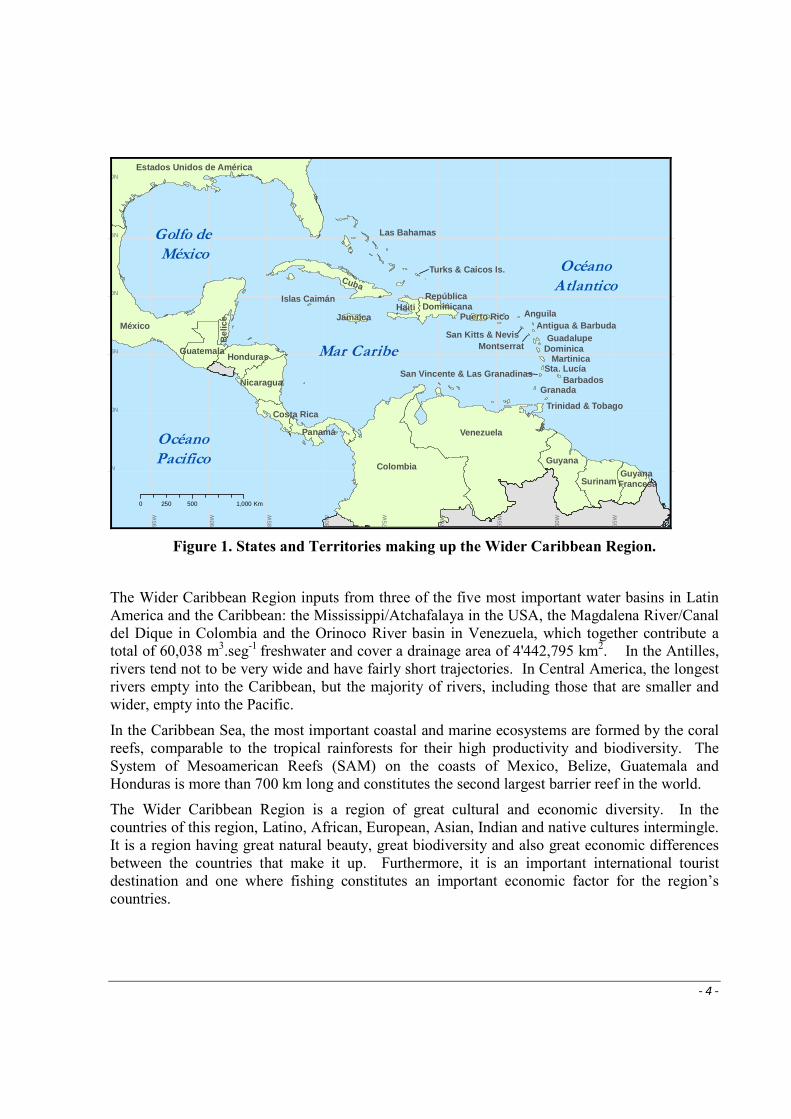
The “Convention for the Protection and Development of the Marine Environment of the Wider Caribbean Region” defines the WCR as the marine environment including the Gulf of Mexico, the Caribbean Sea and the adjacent areas of the South Atlantic Ocean from 30o latitude north and within 200 nautical miles from the Atlantic coasts of the nations signing the Convention (figure 1). The WCR is composed of 28 states and 12 territories that are dependent on 4 states.
The Wider Caribbean Region is made up of coastal countries in North America, Central America, South America and the Antilles.
- 4 -
Colombia
Venezuela
México
Estados Unidos de América
Guyana
Honduras
Cuba
Surinam
Nicaragua
Guatemala
Panamá
Haiti
Guyana Francesa
Costa Rica
Bel
ice
República Dominicana
Jamaica Puerto Rico
Las Bahamas
Trinidad & Tobago
Guadalupe
MartinicaSta. Lucía
BarbadosGranada
Islas Caimán
Antigua & BarbudaAnguila
Turks & Caicos Is.
Dominica
San Kitts & Nevis
San Vincente & Las Granadinas
Montserrat
5N
30N
10N
15N
20N
25N
65W
95W
55W
50W
70W
75W
80W
85W
90W
60W
0 500 1,000250 Km
Golfo de
México
Mar Caribe
Océano
Pacifico
Océano
Atlantico
Figure 1. States and Territories making up the Wider Caribbean Region.
The Wider Caribbean Region inputs from three of the five most important water basins in Latin America and the Caribbean: the Mississippi/Atchafalaya in the USA, the Magdalena River/Canal del Dique in Colombia and the Orinoco River basin in Venezuela, which together contribute a total of 60,038 m3.seg-1 freshwater and cover a drainage area of 4'442,795 km2. In the Antilles, rivers tend not to be very wide and have fairly short trajectories. In Central America, the longest rivers empty into the Caribbean, but the majority of rivers, including those that are smaller and wider, empty into the Pacific.
In the Caribbean Sea, the most important coastal and marine ecosystems are formed by the coral reefs, comparable to the tropical rainforests for their high productivity and biodiversity. The System of Mesoamerican Reefs (SAM) on the coasts of Mexico, Belize, Guatemala and Honduras is more than 700 km long and constitutes the second largest barrier reef in the world.
The Wider Caribbean Region is a region of great cultural and economic diversity. In the countries of this region, Latino, African, European, Asian, Indian and native cultures intermingle. It is a region having great natural beauty, great biodiversity and also great economic differences between the countries that make it up. Furthermore, it is an important international tourist destination and one where fishing constitutes an important economic factor for the region’s countries.
- 5 -
Besides fishing and tourism, the coastal areas of the WCR have other frequently coexisting socioeconomic uses which, due to their overexploitation, have an impact on the natural environment: the most important ones are:
• Urban settlements
• Industrial development
• Maritime-port activity
• Forest industry activity (cutting down coastal forests and mangroves)
• Extraction of sand for the construction industry
Special attention must be given to the treatment of coastal areas due to the importance and necessity for sustainable and sustained development in the areas of tourism and fishing, fundamental elements for the majority of the region’s countries.
METHODOLOGICAL GUIDELINES FOR SAMPLING
The methodology followed in the Monitoring Programme took as its point of reference the conclusions and recommendations discussed and approved in the “Regional Workshop on Quality Indicators of Seawater and Methodologies for Polluting Discharges in the Wider Caribbean
Region” developed in Havana, Cuba between April 4 and 8, 2006.
The experts who came together at that workshop underlined the importance of environmental monitoring as the basis for evaluating the state of the marine-coastal environment of the Wider Caribbean Region and in the processes of identification of the discharging of pollutants, with the aim of supporting integrated management of coastal areas.
At the same time, experts suggested that in a Regional Monitoring Programme (RMP), while bearing in mind the characteristics of each country, the indicators selected and approved in the aforementioned workshop should be applied (table 1).
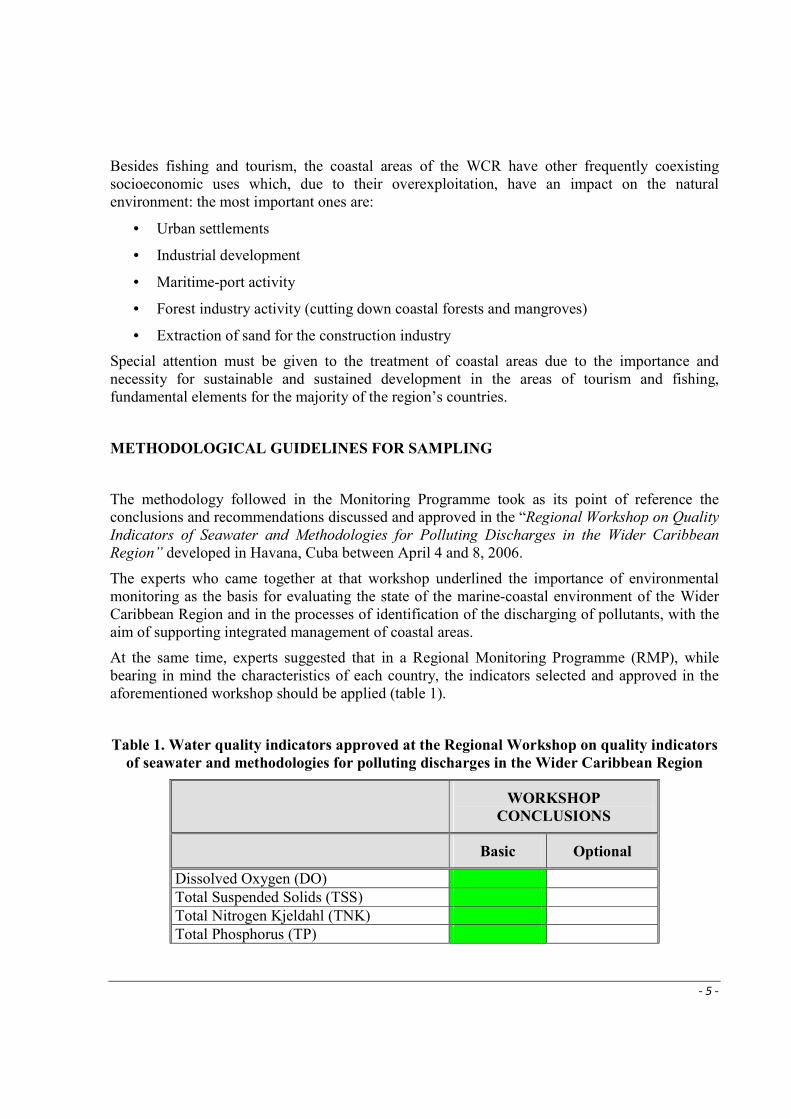
Table 1. Water quality indicators approved at the Regional Workshop on quality indicators
of seawater and methodologies for polluting discharges in the Wider Caribbean Region
WORKSHOP
CONCLUSIONS
Basic Optional
Dissolved Oxygen (DO) Total Suspended Solids (TSS) Total Nitrogen Kjeldahl (TNK) Total Phosphorus (TP)
- 6 -
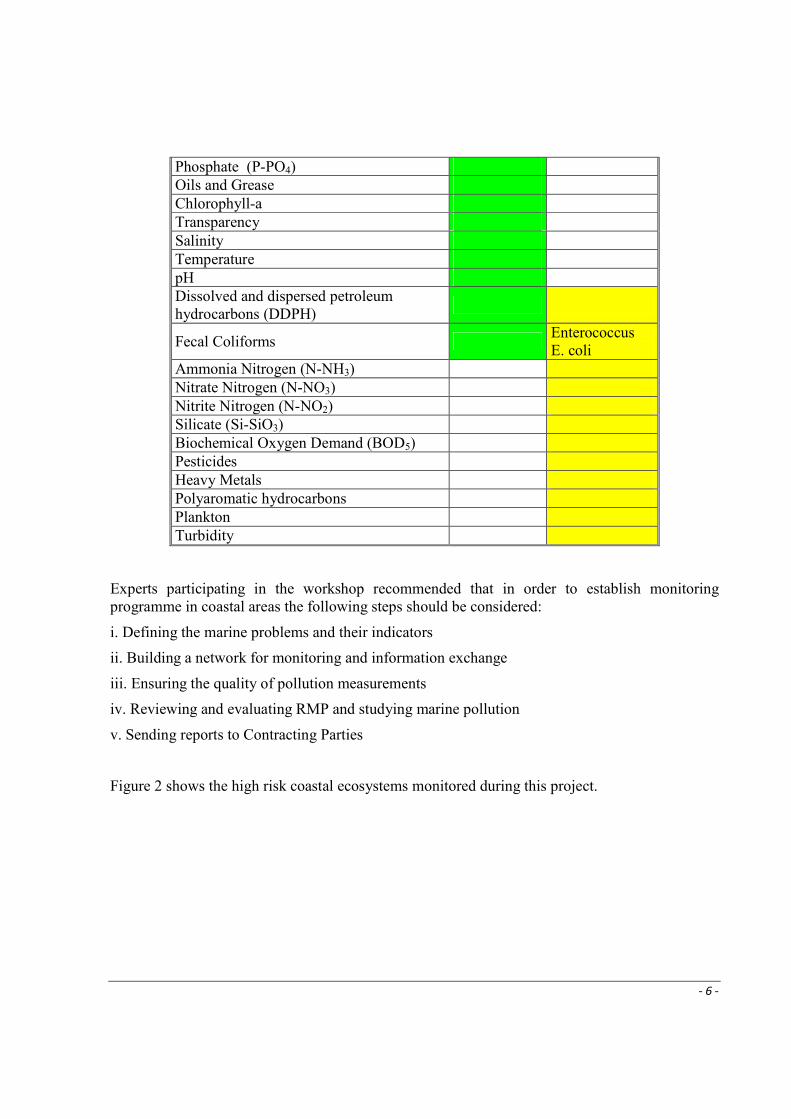
Phosphate (P-PO4) Oils and Grease Chlorophyll-a Transparency Salinity Temperature pH Dissolved and dispersed petroleum hydrocarbons (DDPH)
Fecal Coliforms Enterococcus E. coli
Ammonia Nitrogen (N-NH3) Nitrate Nitrogen (N-NO3) Nitrite Nitrogen (N-NO2) Silicate (Si-SiO3) Biochemical Oxygen Demand (BOD5) Pesticides Heavy Metals Polyaromatic hydrocarbons Plankton Turbidity
Experts participating in the workshop recommended that in order to establish monitoring programme in coastal areas the following steps should be considered:
i. Defining the marine problems and their indicators
ii. Building a network for monitoring and information exchange
iii. Ensuring the quality of pollution measurements
iv. Reviewing and evaluating RMP and studying marine pollution
v. Sending reports to Contracting Parties
Figure 2 shows the high risk coastal ecosystems monitored during this project.
- 7 -
5N
30N
10N
15N
20N
25N
65W
95W
55W
50W
70W
75W
80W
85W
90W
6 0W
0 500 1,000250 Km
Red Regional en ciencias y tecnologías marinas para el Caribe” conocido como
“Know-why Network
Nicaragua
ColombiaVenezuela
Cuba
Tobago
Jamaica
Lugares de monitoreo
Bahía de Bluefields
Bahía de la Habana
Kingston Harbour
Point LisasGolfo de Cariaco
Cienaga Grande de Santa Marta
Visión global de calidad de
agua recreacionales
en el Caribe Oriental
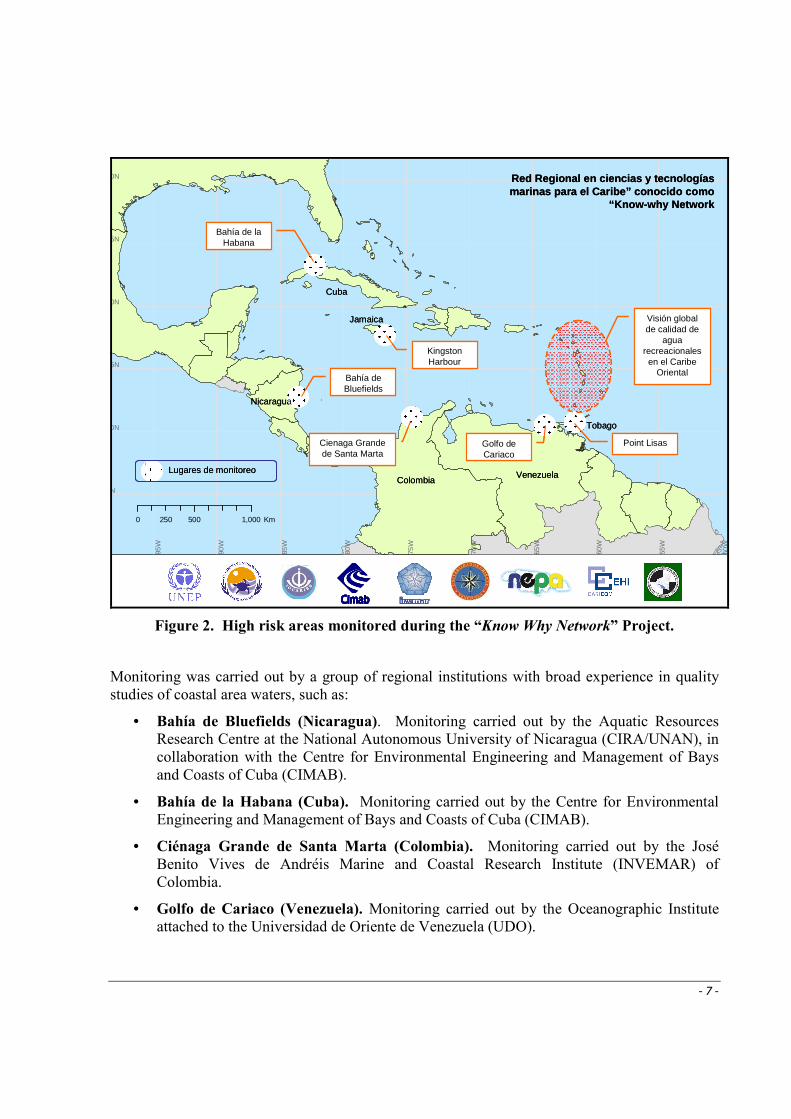
Figure 2. High risk areas monitored during the “Know Why Network” Project.
Monitoring was carried out by a group of regional institutions with broad experience in quality studies of coastal area waters, such as:
• Bahía de Bluefields (Nicaragua). Monitoring carried out by the Aquatic Resources Research Centre at the National Autonomous University of Nicaragua (CIRA/UNAN), in collaboration with the Centre for Environmental Engineering and Management of Bays and Coasts of Cuba (CIMAB).
• Bahía de la Habana (Cuba). Monitoring carried out by the Centre for Environmental Engineering and Management of Bays and Coasts of Cuba (CIMAB).
• Ciénaga Grande de Santa Marta (Colombia). Monitoring carried out by the José Benito Vives de Andréis Marine and Coastal Research Institute (INVEMAR) of Colombia.
• Golfo de Cariaco (Venezuela). Monitoring carried out by the Oceanographic Institute attached to the Universidad de Oriente de Venezuela (UDO).

- 8 -
• Point Lisas, Gulf of Paria (Trinidad and Tobago). Monitoring carried out by the Institute of Marine Affairs (IMA) of Trinidad and Tobago.
• Kingston Bay (Jamaica). Monitoring carried out by the Environmental and Planning Agency (NEPA) of Jamaica in collaboration with the Centre for Environmental Engineering and Management of Bays of Cuba (CIMAB).
As part of this project, the Caribbean Environmental Health Institute (CEHI) carried out a compilation of information about the state of the quality of coastal waters in Small Island States.
All sampling was done during 2008, except for Kingston Harbour which was done at the beginning of 2009.
WATER QUALITY MONITORING
A summary is presented of the monitoring results in the high risk zones selected in the Wider Caribbean Region, taken from the reports presented by the institutions that carried out the monitoring.
Laguna de Bluefields (Nicaragua)
Laguna de Bluefields is located on Nicaragua’s Atlantic coast at 11º 55' latitude north and 83º 45' longitude west, in the South Atlantic Autonomous Region (RAAS); it has an area of 176 Km2
and has an elongated shape with a north-south axis. It is approximately 30 Km long, and its width varies between 3 and 8 Km. Venado Island limits the waters joining the open sea and the waters communicate by two mouths: the northern mouth is of greater socio-economic importance and is located in front of the town of Bluff. The other mouth is in the southern part of the lagoon, known as Honson, and is practically enclosed by the sand bar. The lagoon has an average depth of 1 m with the deepest parts found in the northern lobe, those coinciding with the route of a canal uniting Rio Escondido and the Bluff area. On the north and north-east shores there is a system of lowlands and lakes (Laguna Grande and Laguna Ahumada) that merge in the outside area; its waters are shallow and there are depths of 10 m or more at a distance of 3 Km from the coastline.
Quite a few short rivers drain towards the lagoon along with two important rivers that are very important for their influence on the lagoon’s circulation pattern. Rio Escondido, which provides a considerable amount of freshwater and suspended sediments (11,641 million m3 of annual sediments) for the lagoon, flows out in the northern part. The other important river is the Kukra with its estuary in the southern part of the lagoon.
The city of Bluefields, which is the municipal and department capital of the South Atlantic Autonomous Region (RAAS), is perched on the side of the lagoon bearing its name. It has a population of 36,000, divided into 30,000 in the urban areas and 6,000 in the rural areas, and it represents 56% of the total population of the region. Productive activity of the city and the entire
- 9 -
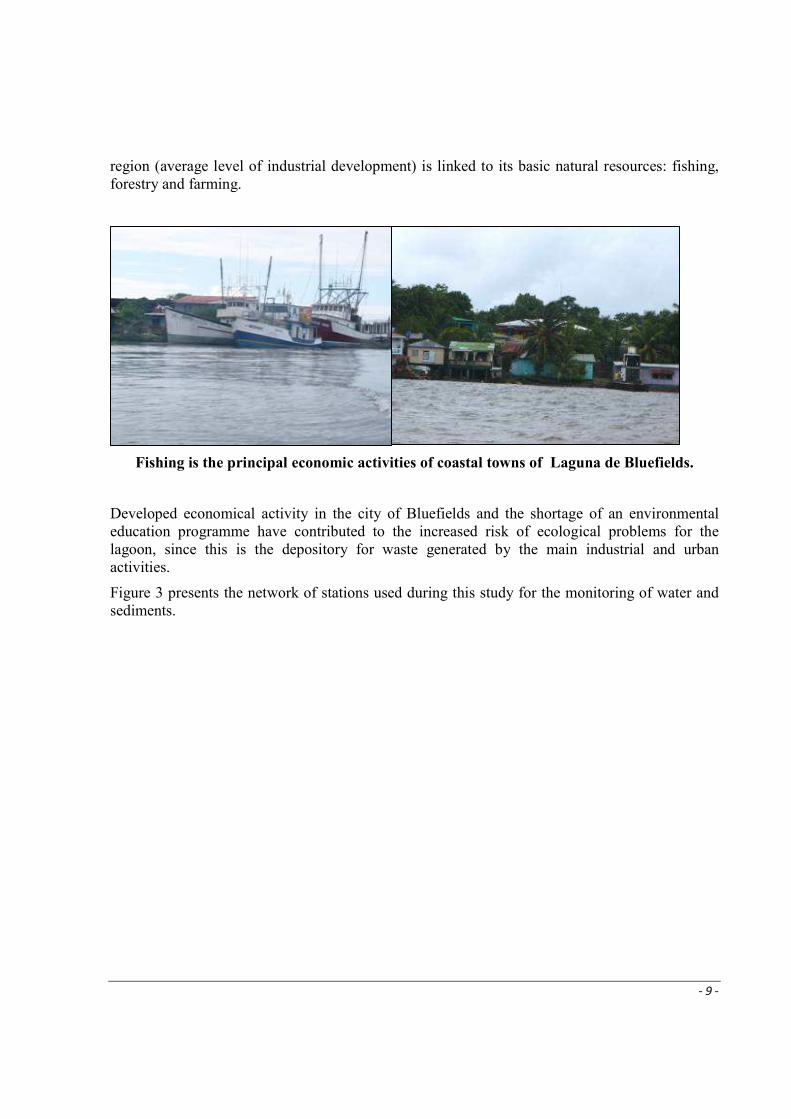
region (average level of industrial development) is linked to its basic natural resources: fishing, forestry and farming.
Fishing is the principal economic activities of coastal towns of Laguna de Bluefields.
Developed economical activity in the city of Bluefields and the shortage of an environmental education programme have contributed to the increased risk of ecological problems for the lagoon, since this is the depository for waste generated by the main industrial and urban activities.
Figure 3 presents the network of stations used during this study for the monitoring of water and sediments.

- 10 -
9
8
7
6
54
3
2
1
¯
0 8 164
Kilometers
Figure 3. Network of stations for the monitoring of the quality of water and sediments in
Laguna de Bluefields (Nicaragua).
Sampling in the Laguna de Bluefields took place in May of 2008.
Summary of the monitoring results
Concentrations of dissolved oxygen (DO) recorded during this study were optimal for aquatic biotic life with values of between 6.20 mg L-1 and 7.06 mg L-1.
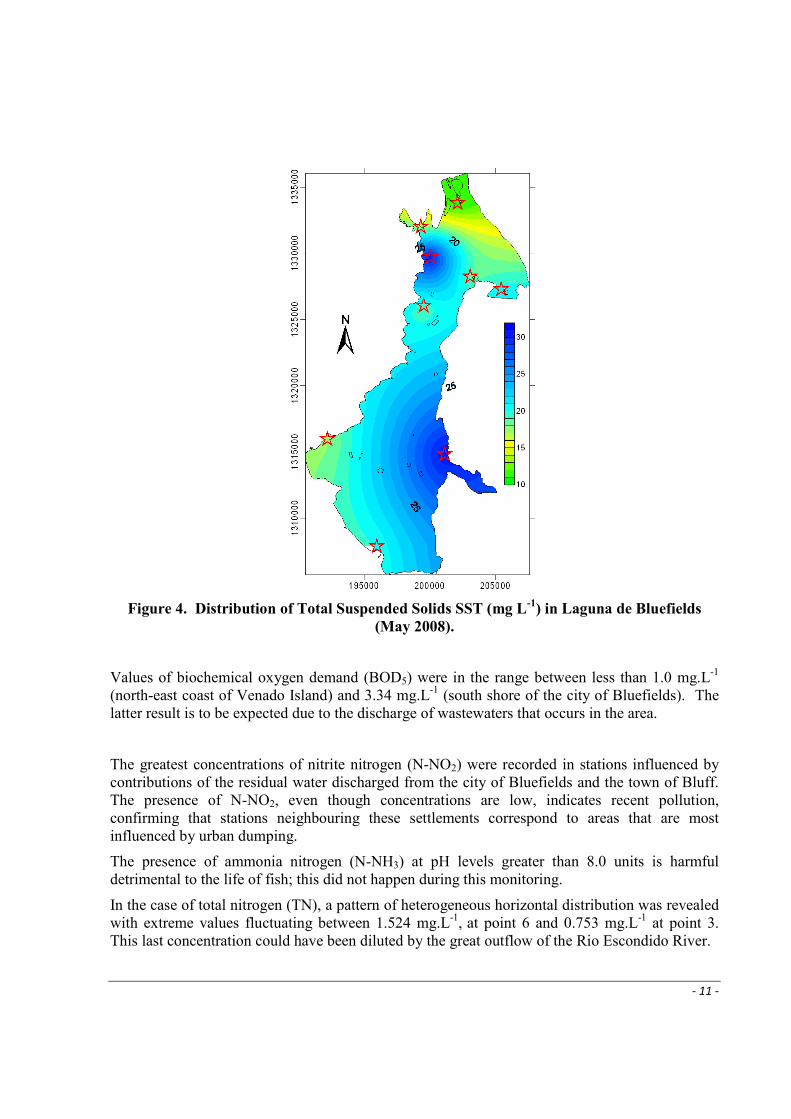
The highest values of total suspended solids were obtained to the south of the city of Bluefields (30.76 mg.L-1) and to the south-west of Venado Island (30.81 mg L-1) (figure 4). The area close to the city of Bluefields has high anthropogenic and dredging influences, and it is also very shallow, approximately 1 m deep. In the second case (south-west of Venado Island), there is great evidence of wave action that might be responsible for the detected values.
- 11 -
Figure 4. Distribution of Total Suspended Solids SST (mg L-1
) in Laguna de Bluefields
(May 2008).
Values of biochemical oxygen demand (BOD5) were in the range between less than 1.0 mg.L-1 (north-east coast of Venado Island) and 3.34 mg.L-1 (south shore of the city of Bluefields). The latter result is to be expected due to the discharge of wastewaters that occurs in the area.
The greatest concentrations of nitrite nitrogen (N-NO2) were recorded in stations influenced by contributions of the residual water discharged from the city of Bluefields and the town of Bluff. The presence of N-NO2, even though concentrations are low, indicates recent pollution, confirming that stations neighbouring these settlements correspond to areas that are most influenced by urban dumping.
The presence of ammonia nitrogen (N-NH3) at pH levels greater than 8.0 units is harmful detrimental to the life of fish; this did not happen during this monitoring.
In the case of total nitrogen (TN), a pattern of heterogeneous horizontal distribution was revealed with extreme values fluctuating between 1.524 mg.L-1, at point 6 and 0.753 mg.L-1 at point 3. This last concentration could have been diluted by the great outflow of the Rio Escondido River.
- 12 -
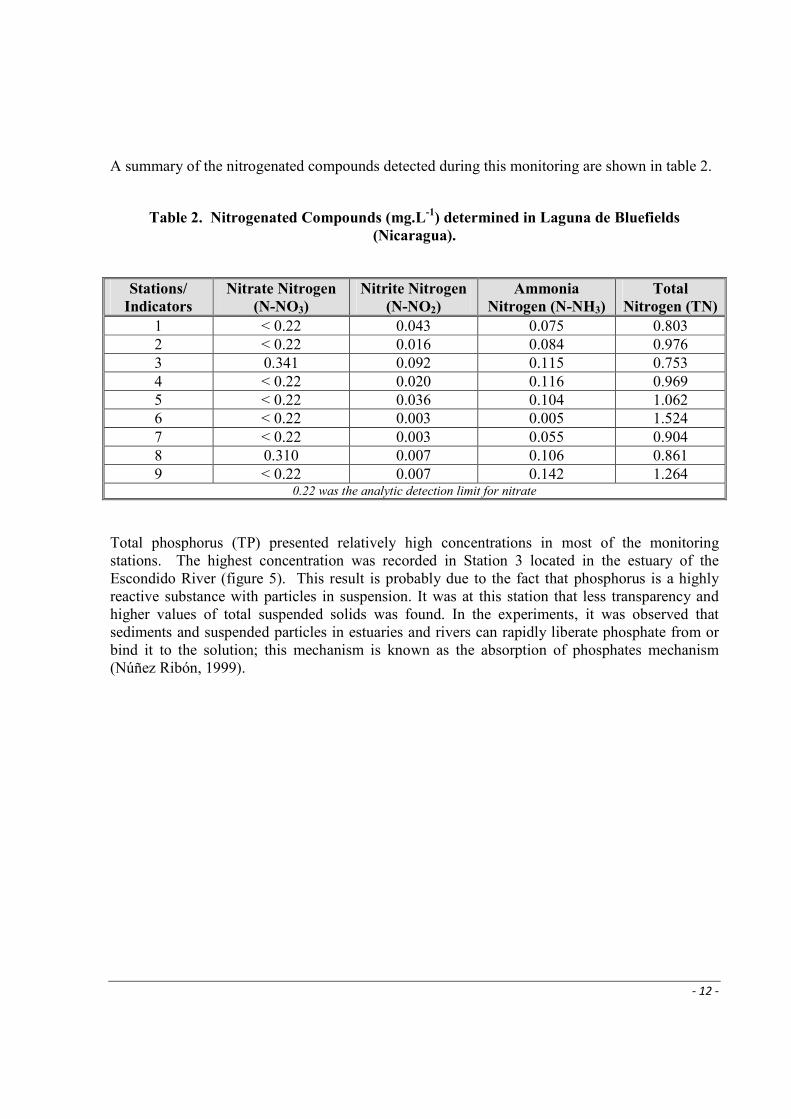
A summary of the nitrogenated compounds detected during this monitoring are shown in table 2.
Table 2. Nitrogenated Compounds (mg.L-1
) determined in Laguna de Bluefields
(Nicaragua).
Stations/
Indicators
Nitrate Nitrogen
(N-NO3)
Nitrite Nitrogen
(N-NO2)
Ammonia
Nitrogen (N-NH3)
Total
Nitrogen (TN)
1 < 0.22 0.043 0.075 0.803 2 < 0.22 0.016 0.084 0.976 3 0.341 0.092 0.115 0.753 4 < 0.22 0.020 0.116 0.969 5 < 0.22 0.036 0.104 1.062 6 < 0.22 0.003 0.005 1.524 7 < 0.22 0.003 0.055 0.904 8 0.310 0.007 0.106 0.861 9 < 0.22 0.007 0.142 1.264
0.22 was the analytic detection limit for nitrate
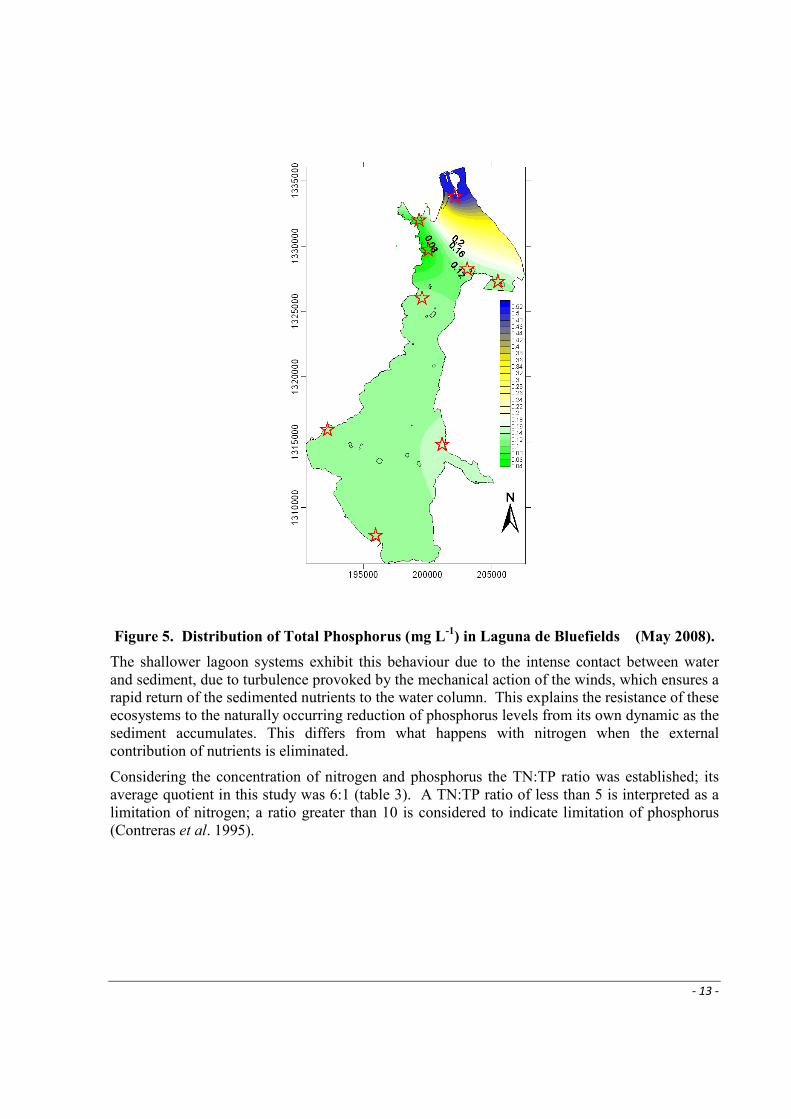
Total phosphorus (TP) presented relatively high concentrations in most of the monitoring stations. The highest concentration was recorded in Station 3 located in the estuary of the Escondido River (figure 5). This result is probably due to the fact that phosphorus is a highly reactive substance with particles in suspension. It was at this station that less transparency and higher values of total suspended solids was found. In the experiments, it was observed that sediments and suspended particles in estuaries and rivers can rapidly liberate phosphate from or bind it to the solution; this mechanism is known as the absorption of phosphates mechanism (Núñez Ribón, 1999).
- 13 -
Figure 5. Distribution of Total Phosphorus (mg L-1
) in Laguna de Bluefields (May 2008).
The shallower lagoon systems exhibit this behaviour due to the intense contact between water and sediment, due to turbulence provoked by the mechanical action of the winds, which ensures a rapid return of the sedimented nutrients to the water column. This explains the resistance of these ecosystems to the naturally occurring reduction of phosphorus levels from its own dynamic as the sediment accumulates. This differs from what happens with nitrogen when the external contribution of nutrients is eliminated.
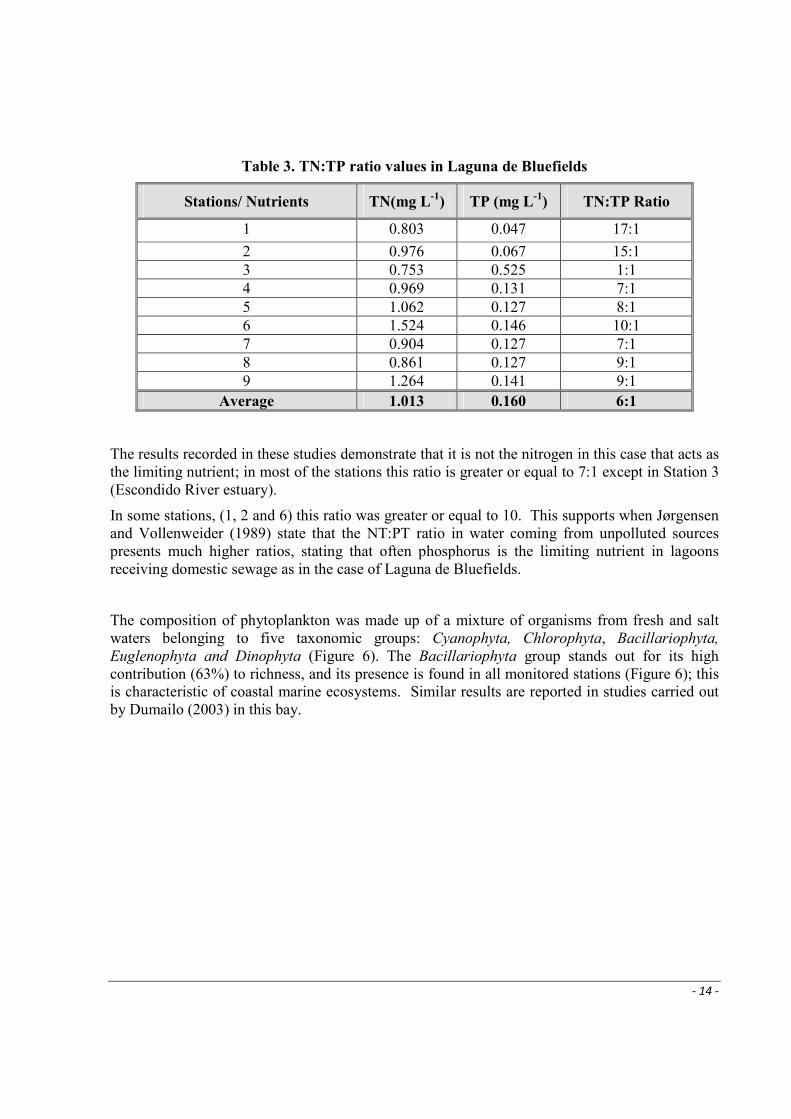
Considering the concentration of nitrogen and phosphorus the TN:TP ratio was established; its average quotient in this study was 6:1 (table 3). A TN:TP ratio of less than 5 is interpreted as a limitation of nitrogen; a ratio greater than 10 is considered to indicate limitation of phosphorus (Contreras et al. 1995).
- 14 -
Table 3. TN:TP ratio values in Laguna de Bluefields
Stations/ Nutrients TN(mg L-1
) TP (mg L-1
) TN:TP Ratio
1 0.803 0.047 17:1
2 0.976 0.067 15:1 3 0.753 0.525 1:1 4 0.969 0.131 7:1 5 1.062 0.127 8:1 6 1.524 0.146 10:1 7 0.904 0.127 7:1 8 0.861 0.127 9:1 9 1.264 0.141 9:1
Average 1.013 0.160 6:1
The results recorded in these studies demonstrate that it is not the nitrogen in this case that acts as the limiting nutrient; in most of the stations this ratio is greater or equal to 7:1 except in Station 3 (Escondido River estuary).
In some stations, (1, 2 and 6) this ratio was greater or equal to 10. This supports when Jørgensen and Vollenweider (1989) state that the NT:PT ratio in water coming from unpolluted sources presents much higher ratios, stating that often phosphorus is the limiting nutrient in lagoons receiving domestic sewage as in the case of Laguna de Bluefields.
The composition of phytoplankton was made up of a mixture of organisms from fresh and salt waters belonging to five taxonomic groups: Cyanophyta, Chlorophyta, Bacillariophyta, Euglenophyta and Dinophyta (Figure 6). The Bacillariophyta group stands out for its high contribution (63%) to richness, and its presence is found in all monitored stations (Figure 6); this is characteristic of coastal marine ecosystems. Similar results are reported in studies carried out by Dumailo (2003) in this bay.

- 15 -
Dinophyta11%
Euglenophyta5%
Bacillariophyta63%
Cyanophyta16%
Chlorophyta5%
0
2
4
6
8
10
12
14
1 2 3 4 5 6 7 8 9
Puntos de Muestreo
No. T
axa Iden
tificad
os
Figure 6. Relative contribution of the large taxonomic groups of phytoplankton to the
richness of the species and amount of taxa identified by stations in the Laguna de Bluefields
monitoring.
Horizontal distribution of phytoplankton was heterogeneous. Low values of abundance and biomass were registered in the northern part and an increase registered towards the southern lobe. This appears to be linked to the short time the water has remained there and the effect of the currents that come down in a southerly direction.
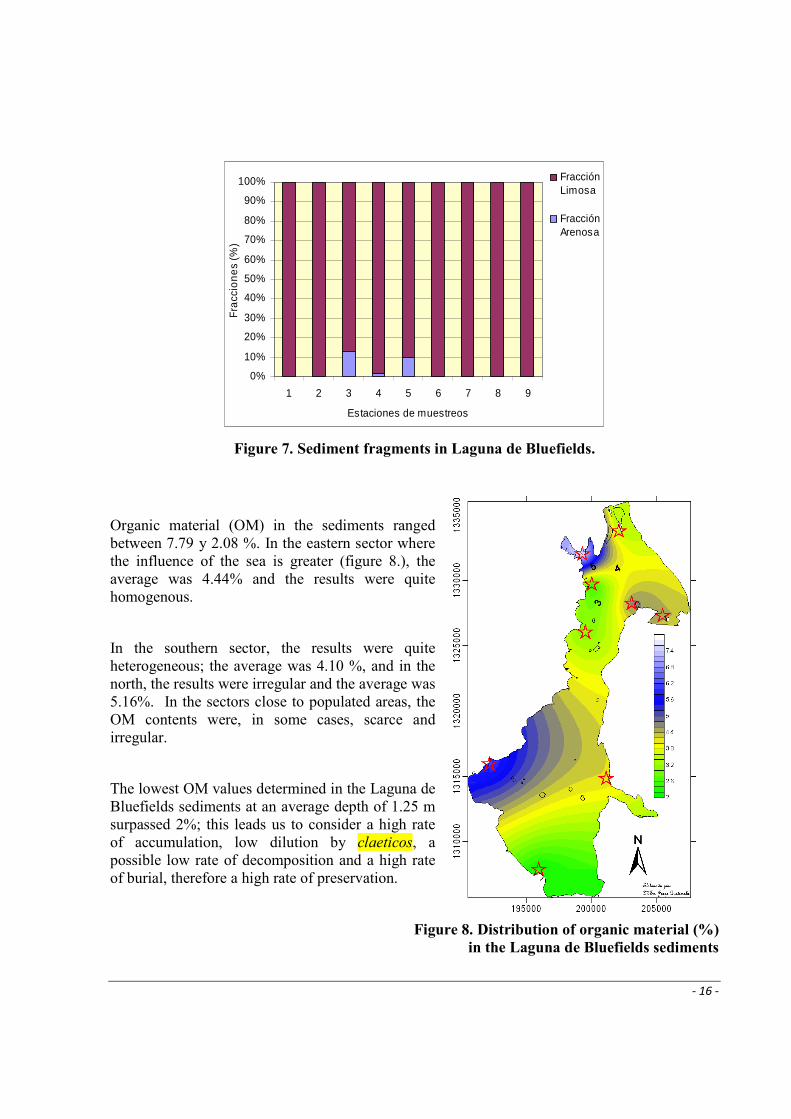
In all the stations, the texture of the sediment was of the lime type (figure7). Predominance of the lime characteristics in the sediments from Laguna de Bluefields is possibly due to the high transport rate of materials by the river currents and the diffused erosion coming from the different sub-basins of the lagoon and the coastal areas, brought about to a great degree by deforestation and changes in the use of the soil. Deforestation and changes in soil usage (farmlands or urban zones created) are factors reinforcing erosion processes, and therefore, the accumulation rates increase (Machain y Ruíz, 2007).
- 16 -
0%
10%
20%
30%
40%
50%
60%
70%
80%
90%
100%
1 2 3 4 5 6 7 8 9
Estaciones de muestreos
Fra
ccio
ne
s (%
)
FracciónLimosa
FracciónArenosa
Figure 7. Sediment fragments in Laguna de Bluefields.
Organic material (OM) in the sediments ranged between 7.79 y 2.08 %. In the eastern sector where the influence of the sea is greater (figure 8.), the average was 4.44% and the results were quite homogenous.
In the southern sector, the results were quite heterogeneous; the average was 4.10 %, and in the north, the results were irregular and the average was 5.16%. In the sectors close to populated areas, the OM contents were, in some cases, scarce and irregular.
The lowest OM values determined in the Laguna de Bluefields sediments at an average depth of 1.25 m surpassed 2%; this leads us to consider a high rate of accumulation, low dilution by claeticos, a possible low rate of decomposition and a high rate of burial, therefore a high rate of preservation.
Figure 8. Distribution of organic material (%)
in the Laguna de Bluefields sediments
- 17 -
Values of total hydrocarbons in Laguna de Bluefields sediments fluctuated between 12.21 mg kg-
1 of sediment up to 51.22 mg kg-1, with an average of 32.82 mg kg-1. These concentrations are higher than those in areas considered to be non-polluted such as areas in Patagonia, Argentina with values fluctuating between 0.5 to 3.0 mg kg-1 and lower than those detected in sediments for which port activities were a important contributor (an interval between 496 - 6.972 mg kg-1) (Guerra-García et al., 2003). Results recorded in this study were higher than those in 1995 when results between 6 and 49 mg kg-1 were reported and with a general average of 28.55 mg kg-1 for all points monitored.
Health conditions at Laguna de Bluefields were measured by verifying the microbiological indicator Clostridium perfrigens in the sediments; this is a micro-organism whose spores are present in the soil, sediments and areas subject to animal and human fecal pollution. This biological indicator was only detected in Station 1 on the south side of the city of Bluefields in a concentration of 1.3 x10² NMP.g-1.
In the rest of the monitoring stations the values were less than 2 NMP.g-1. Compared to results in the CIMAB study in this same lagoon in 1995 (between 102 y 104 NMP.g-1 of sediment), a great decrease in this microbiological indicator is observed in this 2008 monitoring.
The decrease of values in the 2008 monitoring could be attributed to many factors, among them:
• Installation of treatment lagoons
• Sedimentation
• Solar radiation
• Elevated pH
• Low CO2 levels
• High concentrations of dissolved O2
• Bactericidal action of toxins produced by algae
• Presence of predators
• Time of hydraulic retention.
Point Lisas Port, Gulf of Paria (Trinidad and Tobago)
The islands in the archipelago of the Republic of Trinidad and Tobago are located off the north-eastern Venezuelan coast, with the coordinates of 11° 21´39´´ N - 60° 31´37´´ W (Harble Island in Tobago), 10° 02´28´´ N - 61° 54´30´´ W (Cacos Point, Trinidad), 11° 17´39´´ N - 60° 29´40´´ W (Little Tobago, Tobago), and 10° 03´27´´ N - 62° 01´33´´ W (Black Rock, Trinidad).
Trinidad and Tobago is a world leader in the export of methanol, ammonia and liquefied natural gas to the US. In 2007, more than 60 % of the liquefied natural gas that the US imported came
- 18 -
from Trinidad and Tobago. Trinidad also plays an important part in the international steel market as well as in the export of crude oil and refined petroleum products.
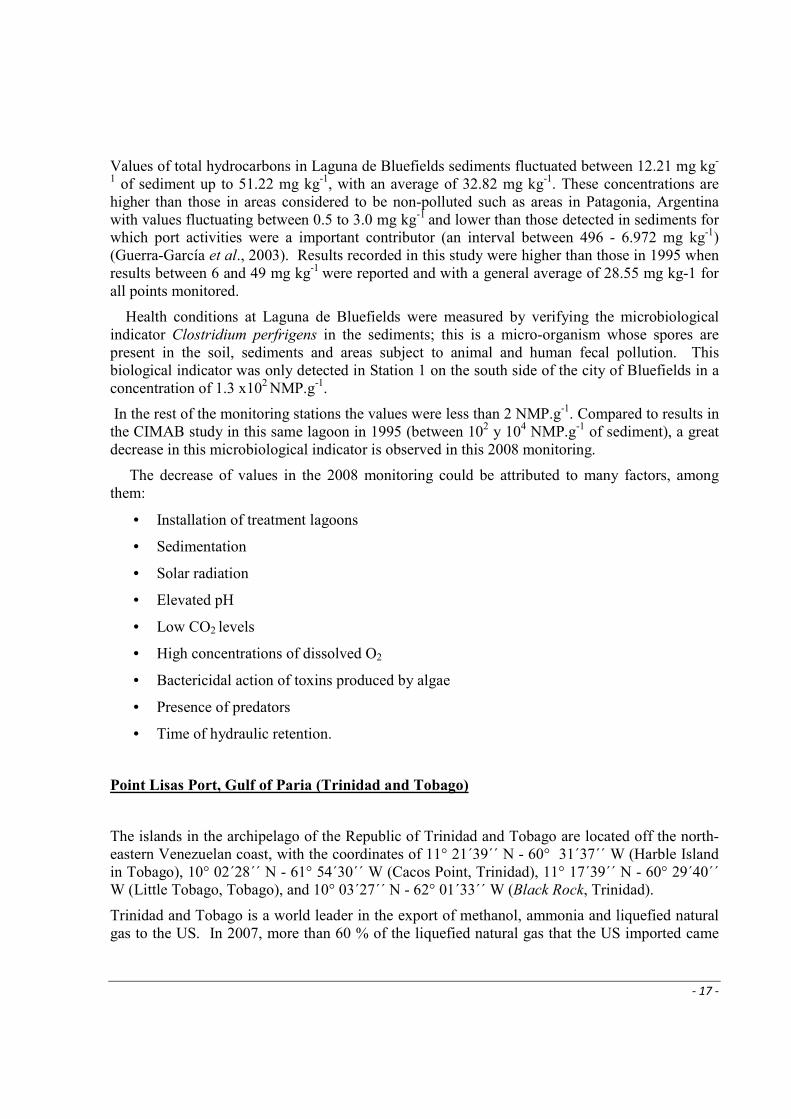
The study area (Point Lisas Port, Gulf of Paria) is located on Trinidad’s eastern coast close to the industrial area (heavy industry) that includes steel smelting, a methanol factory, an ammonia factory, a urea plant, two electrical generating plants and a large inverse osmosis desalination plant.
Figure 9 shows the network of stations used during this study for the monitoring of water.
Figure 9. Network of stations to monitor water and sediment quality in Point Lisas, Gulf of
Paria (Trinidad &Tobago).
Monitoring at Point Lisas was done through two samplings: one carried out in the rainy season of 2007 and the other in the dry season of 2008.
Summary of monitoring results
The quality of a body of water and, by extension, its ability to sustain aquatic life depends, in part, on its pH. The pH level detected at all the stations during this study (7.7-8.2) was within the USEPA (1995) limit in order to protect marine aquatic life. Higher values were obtained in the

- 19 -
rainy season as compared to the dry season. pH values are naturally affected by salinity and alkalinity. The pH demonstrated the significant and positive correlation with dissolved oxygen, salinity and nitrites.
Dissolved oxygen (DO) is one of the most critical quality parameters required for aquatic life. Long periods of time with low DO values can cause the death of fish. DO levels found were generally within the USEPA limit (greater than 5.0 mg L-1 for protection of aquatic life according to USEPA, 1995) with the exception of two sampling stations in the dry season.
Dissolved oxygen levels depend on environmental factors such as the temperature of the body of water, levels of pollution and the rate of natural aeration. The lowest oxygen levels, as compared to exterior stations, were found in coastal areas at least 2 km from the coastline.
Dissolved oxygen in the rainy season was statistically higher than that in the dry season (figure 10), and this might be explained by the greater dilution and dispersion of pollutants in the rainy season as a result of the rainfall.
Figure 10. Average of Dissolved oxygen levels at Point Lisas, Gulf of Paria, by sampling
points (A) and by seasons (B).
Salinity values found at Point Lisas, Gulf of Paria were representative of coastal ecosystems. Salinity fluctuated from 19.5 to 26.8% in the rainy season and from 33.0 to 34.9% in the dry season; this difference in values of salinity was statistically significant. This is the result of there being more runoff due to rain and also an increase in the outflow of the Orinoco River, thus the salinity is lower.
Total suspended solid levels (TSS) were in the range of 7 - 38 mg L-1. From a spatial perspective, the highest suspended solid levels were generally found at the stations located
- 20 -
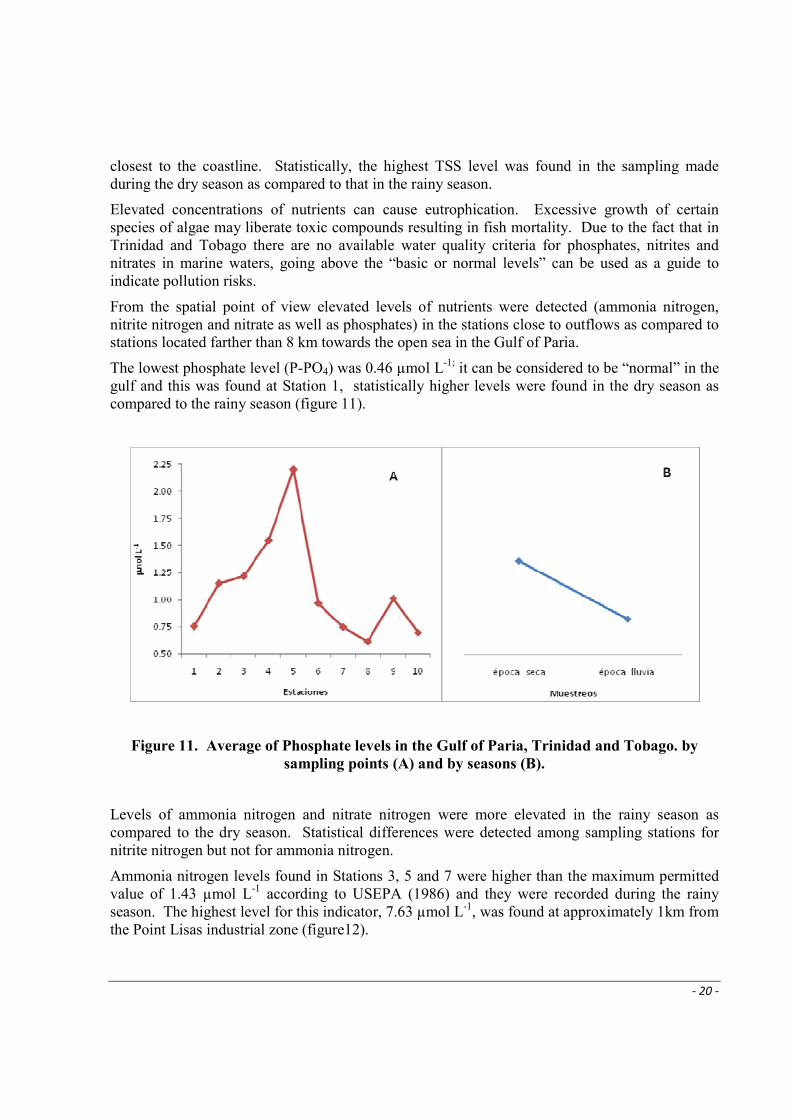
closest to the coastline. Statistically, the highest TSS level was found in the sampling made during the dry season as compared to that in the rainy season.
Elevated concentrations of nutrients can cause eutrophication. Excessive growth of certain species of algae may liberate toxic compounds resulting in fish mortality. Due to the fact that in Trinidad and Tobago there are no available water quality criteria for phosphates, nitrites and nitrates in marine waters, going above the “basic or normal levels” can be used as a guide to indicate pollution risks.
From the spatial point of view elevated levels of nutrients were detected (ammonia nitrogen, nitrite nitrogen and nitrate as well as phosphates) in the stations close to outflows as compared to stations located farther than 8 km towards the open sea in the Gulf of Paria.
The lowest phosphate level (P-PO4) was 0.46 µmol L-1; it can be considered to be “normal” in the gulf and this was found at Station 1, statistically higher levels were found in the dry season as compared to the rainy season (figure 11).
Figure 11. Average of Phosphate levels in the Gulf of Paria, Trinidad and Tobago. by
sampling points (A) and by seasons (B).
Levels of ammonia nitrogen and nitrate nitrogen were more elevated in the rainy season as compared to the dry season. Statistical differences were detected among sampling stations for nitrite nitrogen but not for ammonia nitrogen.
Ammonia nitrogen levels found in Stations 3, 5 and 7 were higher than the maximum permitted value of 1.43 µmol L-1 according to USEPA (1986) and they were recorded during the rainy season. The highest level for this indicator, 7.63 µmol L-1, was found at approximately 1km from the Point Lisas industrial zone (figure12).

- 21 -
Figure 12. Average of Ammonia nitrogen levels in the Gulf of Paria (Trinidad and Tobago)
by sampling points (A) and by seasons (B).
Ammonia nitrogen values above 71.4 µmol L-1 are lethal for most fish species but under natural conditions these levels are rarely attained (USEPA, 1986). Nevertheless values in this range can be commonly found in seawater polluted by industrial sewage, as was recorded in the past at Point Lisas in the industrial zone in 1981, where values between 1.6 y 71.1µmol L-1 (IMA, 1982) were attained.
The lowest levels of ammonia nitrogen detected in this study were of 0.01 µmol L-1 at Stations 1 (east coast of Trinidad), 8, 9 and 10 (all located in the outskirts of the Gulf of Paria) that could be considered to be normal values. These stations are located outside of the pollution sources.
According to spatial distribution, the tendency was such that greater values of nutrients (ammonium, nitrite, nitrates and phosphate) were found close to land-based pollution sources (Stations 3, 4, 5, 6 and 7).
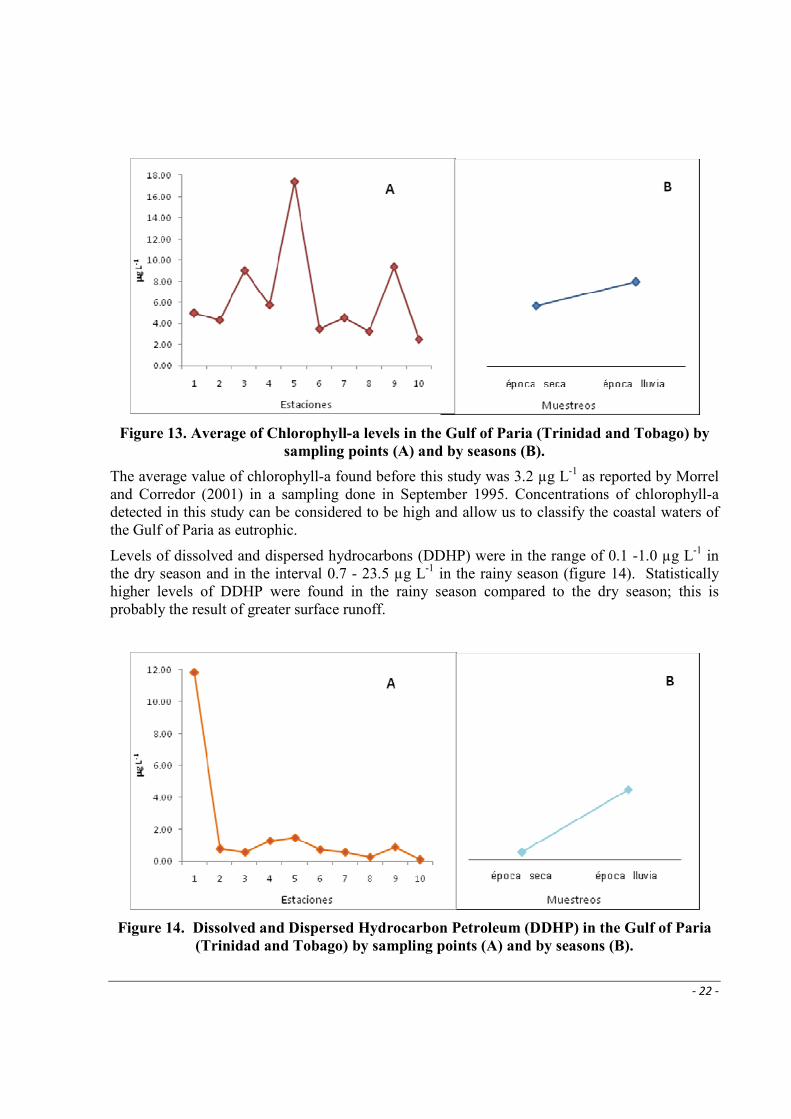
Chlorophyll-a, which is a common measurement of the biomass of total phytoplankton, was between 2.4 y 31.8 µg L-1 during this study, with average values of 5.8 y 8.0 µg L-1 in the dry and rainy season respectively (figure 13).
- 22 -
Figure 13. Average of Chlorophyll-a levels in the Gulf of Paria (Trinidad and Tobago) by
sampling points (A) and by seasons (B).
The average value of chlorophyll-a found before this study was 3.2 µg L-1 as reported by Morrel and Corredor (2001) in a sampling done in September 1995. Concentrations of chlorophyll-a detected in this study can be considered to be high and allow us to classify the coastal waters of the Gulf of Paria as eutrophic.
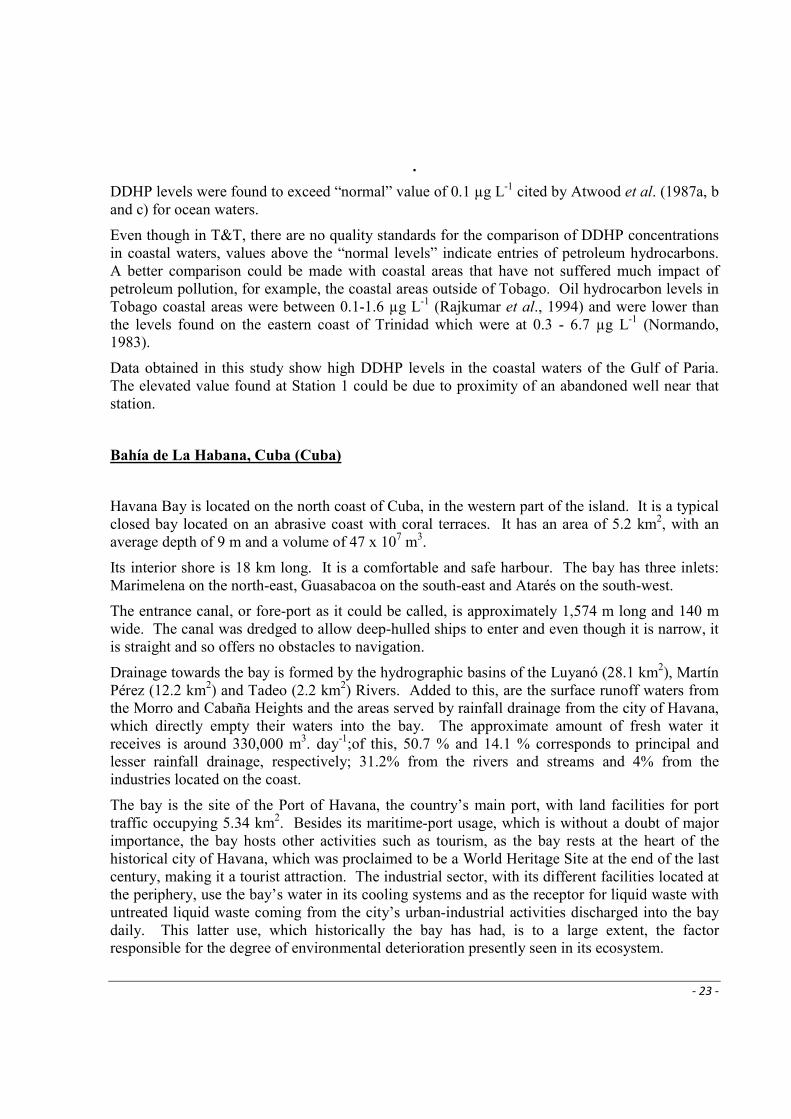
Levels of dissolved and dispersed hydrocarbons (DDHP) were in the range of 0.1 -1.0 µg L-1 in the dry season and in the interval 0.7 - 23.5 µg L-1 in the rainy season (figure 14). Statistically higher levels of DDHP were found in the rainy season compared to the dry season; this is probably the result of greater surface runoff.
Figure 14. Dissolved and Dispersed Hydrocarbon Petroleum (DDHP) in the Gulf of Paria
(Trinidad and Tobago) by sampling points (A) and by seasons (B).
- 23 -
.
DDHP levels were found to exceed “normal” value of 0.1 µg L-1 cited by Atwood et al. (1987a, b and c) for ocean waters.
Even though in T&T, there are no quality standards for the comparison of DDHP concentrations in coastal waters, values above the “normal levels” indicate entries of petroleum hydrocarbons. A better comparison could be made with coastal areas that have not suffered much impact of petroleum pollution, for example, the coastal areas outside of Tobago. Oil hydrocarbon levels in Tobago coastal areas were between 0.1-1.6 µg L-1 (Rajkumar et al., 1994) and were lower than the levels found on the eastern coast of Trinidad which were at 0.3 - 6.7 µg L-1 (Normando, 1983).
Data obtained in this study show high DDHP levels in the coastal waters of the Gulf of Paria. The elevated value found at Station 1 could be due to proximity of an abandoned well near that station.
Bahía de La Habana, Cuba (Cuba)
Havana Bay is located on the north coast of Cuba, in the western part of the island. It is a typical closed bay located on an abrasive coast with coral terraces. It has an area of 5.2 km2, with an average depth of 9 m and a volume of 47 x 107 m3.
Its interior shore is 18 km long. It is a comfortable and safe harbour. The bay has three inlets: Marimelena on the north-east, Guasabacoa on the south-east and Atarés on the south-west.
The entrance canal, or fore-port as it could be called, is approximately 1,574 m long and 140 m wide. The canal was dredged to allow deep-hulled ships to enter and even though it is narrow, it is straight and so offers no obstacles to navigation.
Drainage towards the bay is formed by the hydrographic basins of the Luyanó (28.1 km2), Martín Pérez (12.2 km2) and Tadeo (2.2 km2) Rivers. Added to this, are the surface runoff waters from the Morro and Cabaña Heights and the areas served by rainfall drainage from the city of Havana, which directly empty their waters into the bay. The approximate amount of fresh water it receives is around 330,000 m3. day-1;of this, 50.7 % and 14.1 % corresponds to principal and lesser rainfall drainage, respectively; 31.2% from the rivers and streams and 4% from the industries located on the coast.
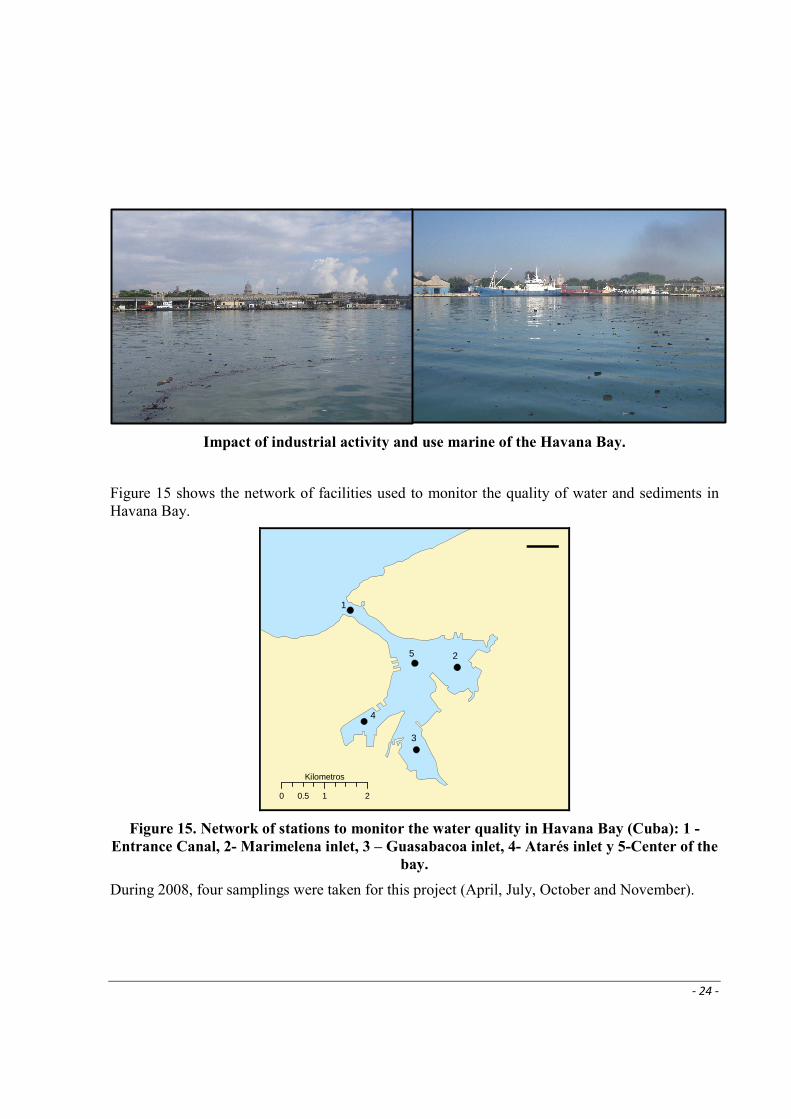
The bay is the site of the Port of Havana, the country’s main port, with land facilities for port traffic occupying 5.34 km2. Besides its maritime-port usage, which is without a doubt of major importance, the bay hosts other activities such as tourism, as the bay rests at the heart of the historical city of Havana, which was proclaimed to be a World Heritage Site at the end of the last century, making it a tourist attraction. The industrial sector, with its different facilities located at the periphery, use the bay’s water in its cooling systems and as the receptor for liquid waste with untreated liquid waste coming from the city’s urban-industrial activities discharged into the bay daily. This latter use, which historically the bay has had, is to a large extent, the factor responsible for the degree of environmental deterioration presently seen in its ecosystem.
- 24 -
Impact of industrial activity and use marine of the Havana Bay.
Figure 15 shows the network of facilities used to monitor the quality of water and sediments in Havana Bay.
1
25
4
3
0 1 20.5
Kilometros
¯
Figure 15. Network of stations to monitor the water quality in Havana Bay (Cuba): 1 -
Entrance Canal, 2- Marimelena inlet, 3 – Guasabacoa inlet, 4- Atarés inlet y 5-Center of the
bay.
During 2008, four samplings were taken for this project (April, July, October and November).
- 25 -
Summary of Monitoring Results
The lowest values of dissolved oxygen (significantly lower from the statistical point of view) in the three measuring levels (surface, middle and depths) were obtained once again in Atares Inlet, heavily influenced by the pollution of waste waters. The average values in the three levels were lower than 5 mg L-1, a value recommended as the minimal limit for good quality coastal waters (Friligos, 1989).
The value of this quality indicator in the rest of the bay at this stage was elevated to such a point that the general average of the surface and middle levels in the bay were above the criteria referred to earlier.
As for salinity, the salinity stratification of the bay’s water table is maintained thus corroborating again, the influence of the contribution of fresh water.
The Biochemical Oxygen Demand values (BOD5) as representing the presence of organic matter in the water were similar in the whole bay and slightly less in the bay’s entrance channel, as expected, due to the lesser impact of polluting sources in this area and the processes of dilution and mixing that are generated.. The unit and average values per station indicates that the high presence of organic material in the waters of the bay, especially in Atares Inlet, is being maintained.
The permanent tendency in recent years of the absence of hydrogen sulphide in the water table of the bay has been maintained.
Distribution of sampling stations for nitrogenated compounds in the surface waters once again showed more elevated concentrations in Atares Inlet, a situation that is much more marked in the case of nitrogen ammonia (N-NH3). The result that has been obtained in recent years, ratifies the criteria that contributions to the bay of nitrogenated compounds prevail in a reduced form (N-NH4) and are related to the untreated waste liquids going into the bay through land-based sources of pollution.
For the phosphorus compounds, stratification of the water table was obtained since the surface values obtained for both parameters (total phosphorus and dissolved orthophosphate) were significantly higher than the middle and bottom levels. Atares Inlet presented the greater value at the surface level 7.57 µmol L-1. This value is in the interval of concentrations presented by the cove in the last two years: 6 - 8 µmol L-1.
Total suspended solids (TSS) presented average annual concentrations all the levels and for all the sampling months that were lower than 100 mg L-1, a criteria of good quality for coastal waters.
Once again Atares Inlet is notably different form the others. It continues to be the most affected water, and in a very marked manner, from a physical-chemical quality point of view. Atares continues to present the lowest concentrations of dissolved oxygen and the highest values of nutrient and organic matter during the entire year.

- 26 -
Figure 16 shows the historical conduct of the principal hydro-chemical indicators that best define the quality of waters in Havana Bay.
Havana City
Atarés
Guasabacoa
Centro
Canal
Marimelena
Havana City
Atarés
Guasabacoa
Centro
Canal
Marimelena Havana City
Atarés
Guasabacoa
Centro
Canal
Marimelena
3 - 4
6 - 7
7 - 8
Dissolved Oxygen(mg/L)
Total suspended solid (mg/L)
1 - 2
2 - 3
3 - 4
4 - 5
Ammoniacal Nitrogen (N-NH3)(µmol/L)
0 10.5 Km
0 10.5 Km
0 10.5 Km
65
70
75
80
85
0
2
4
6
8
10
12
00 01 02 03 04 05 06 07 08
Years
mg
L-1
0
5
10
15
20
25
00 01 02 03 04 05 06 07 08
Years
µµ µµm
ol L
-1
0 10.5 Km
Havana City
Atarés
Guasabacoa
Centro
Canal
Marimelena
0.1 e3
3 e3
5 e3
7 e3
180 e3
Fecal Coliforms (NMP/100 mL)
Historical Trend Historical Trend
Historical Trend(Atarés only)
0 10.5 Km
020
406080
100120140160180
00 01 02 03 04 05 06 07 08
Years
mg
L-1
Historical Trend
0.0E+00
5.0E+05
1.0E+06
1.5E+06
2.0E+06
00 01 02 03 04 05 06 07 08
Years
NM
P/1
00m
L
Figure 16. Historical trend of the principal quality indicators of the waters in Havana Bay
The tendency for an increase in dissolved oxygen is a sign that there are no reverses for the greater oxygenation of the bay’s water – an indicator of the state of good health of the aquatic system.
The ammonia nitrogen also presented a positive evolution during 2008: average values in the three depth levels decreased. It is to be noted that, the average concentrations of this indicator were still higher than 3.57 µmol L-1, which is the lower established limit when considering water having doubtful quality, according to the Cuban Standard NC 25: 1999 for the evaluation of water resources for fishing purposes (ONNa, 1999).
The decrease sustained in a greater or lesser proportion in the last few years is the best proof of the positive impact of the decrease in the contributions of waste water flowing into the bay.
Concentrations of phosphorus compounds obtained during 2008 were slightly higher at the surface in comparison to 2007. Since 2006, there has been a slight but gradual and regular increase in the average concentrations of this indicator. This conduct must be followed with care
- 27 -
since, if it continues, it would suggest that the polluting discharges bringing phosphorus (especially all waste from domestic sources and those related to industries producing detergents and other cleaning products in general) have not decreased.
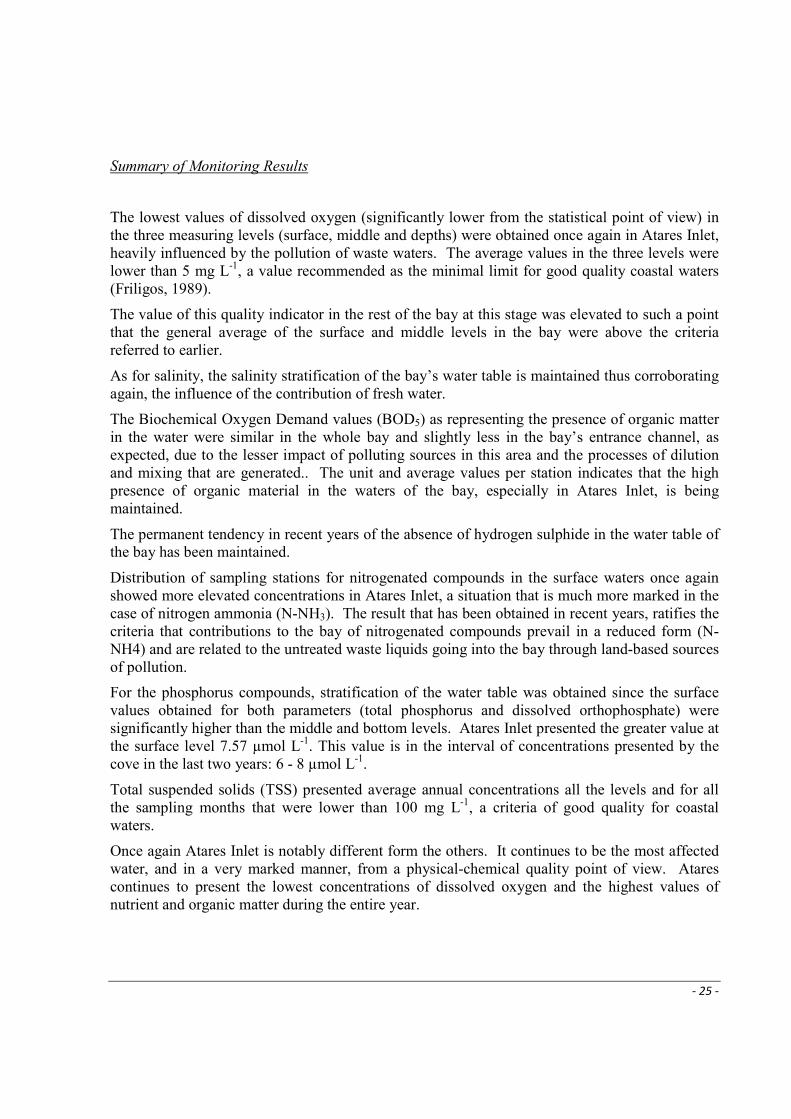
Figure 17 shows the conduct of BOD5 in surface waters in the last six years, as an expression of organic matter.
0.00
1.00
2.00
3.00
4.00
5.00
6.00
7.00
8.00
9.00
10.00
2003 2004 2005 2006 2007 2008
Años
mg L
-1
Canal
Atares
Guasabacoa
Marimelena
Centro
Figure 17. Comparison of BOD5 levels by years in the bay’s surface waters
Atares and Guasabacoa Inlet have presented the greatest reduction in BOD5 in past years. These coves have historically been the ones receiving the greatest impact from land-based sources of pollution, and therefore, are the ones that have attained the most evident “improvements” in their environmental quality with the measures of reduction and/or elimination of polluting sources that have been carried out in recent years in the bay.
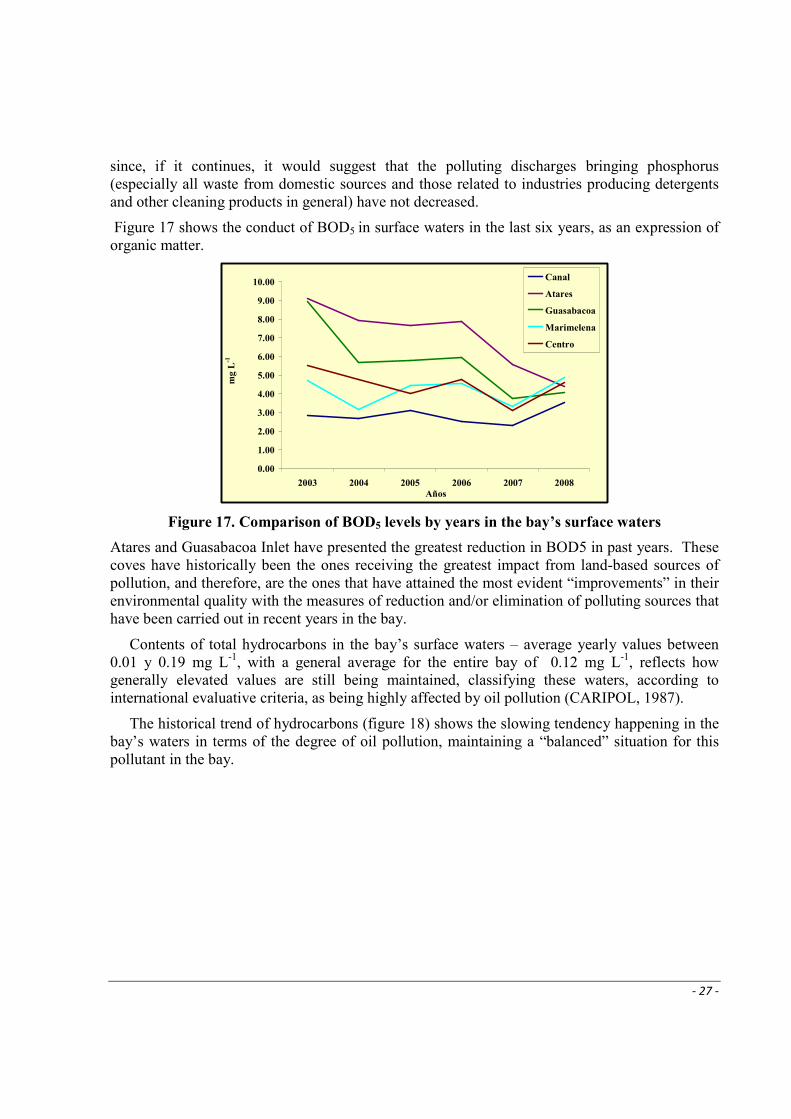
Contents of total hydrocarbons in the bay’s surface waters – average yearly values between 0.01 y 0.19 mg L-1, with a general average for the entire bay of 0.12 mg L-1, reflects how generally elevated values are still being maintained, classifying these waters, according to international evaluative criteria, as being highly affected by oil pollution (CARIPOL, 1987).
The historical trend of hydrocarbons (figure 18) shows the slowing tendency happening in the bay’s waters in terms of the degree of oil pollution, maintaining a “balanced” situation for this pollutant in the bay.
- 28 -
0,0
0,5
1,0
1,5
2,0
2,5
3,0
1984 1986 1988 1990 1992 1994 1996 1998 2000 2002 2004 2006 2008 2010
mg
L-1
Media lineal Media movil
Figure 18. Tendency of hydrocarbons in water in Havana Bay.
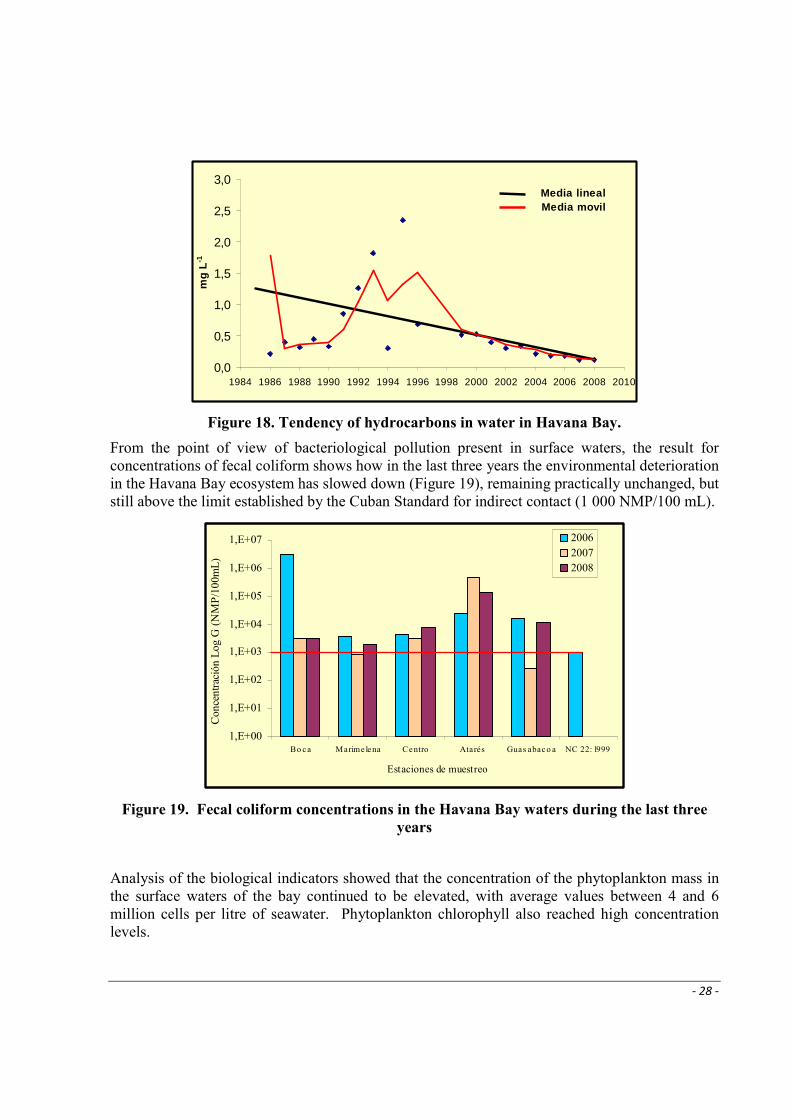
From the point of view of bacteriological pollution present in surface waters, the result for concentrations of fecal coliform shows how in the last three years the environmental deterioration in the Havana Bay ecosystem has slowed down (Figure 19), remaining practically unchanged, but still above the limit established by the Cuban Standard for indirect contact (1 000 NMP/100 mL).
1,E+00
1,E+01
1,E+02
1,E+03
1,E+04
1,E+05
1,E+06
1,E+07
Bo ca Marime lena Centro Atarés Guas abaco a NC 22: 1999
Estaciones de muestreo
Con
cent
raci
ón L
og G
(N
MP
/100
mL
)
200620072008
Figure 19. Fecal coliform concentrations in the Havana Bay waters during the last three
years
Analysis of the biological indicators showed that the concentration of the phytoplankton mass in the surface waters of the bay continued to be elevated, with average values between 4 and 6 million cells per litre of seawater. Phytoplankton chlorophyll also reached high concentration levels.
- 29 -
Phytoplankton was almost exclusively made up of brown algae (diatomeas) and no concentrations of any interest were detected of potentially toxic organisms. According to both indicators, (phytoplankton and chlorophyll-a), the waters of the bay continue to be classified as eutrophic.
Concentrations of organic carbon (OC), organic nitrogen (ON) and organic matter (OM) in the surface sediments of the bay allow us to classify and show once again, that the sediments at all sampling stations in the bay are considered to be polluted by organic matter. Nevertheless, we must point out that OM values detected during 2008 were lower both at the Atares Inlet and at the central station on the bay as compared to those obtained in 2002.
At Atares, the decrease was quite significant. Atares Inlet showed similar results with organic carbon (OC) and organic nitrogen (ON). This result could be indicative of the positive effect on sediments of the clean-up measures in the bay, especially at the polluting sources flowing into the cove which has historically been more polluted any way you look at it.
High values of oil hydrocarbons were observed along with metallic elements in surface sediment, typical pollution indicators; these have been detected traditionally in this master:
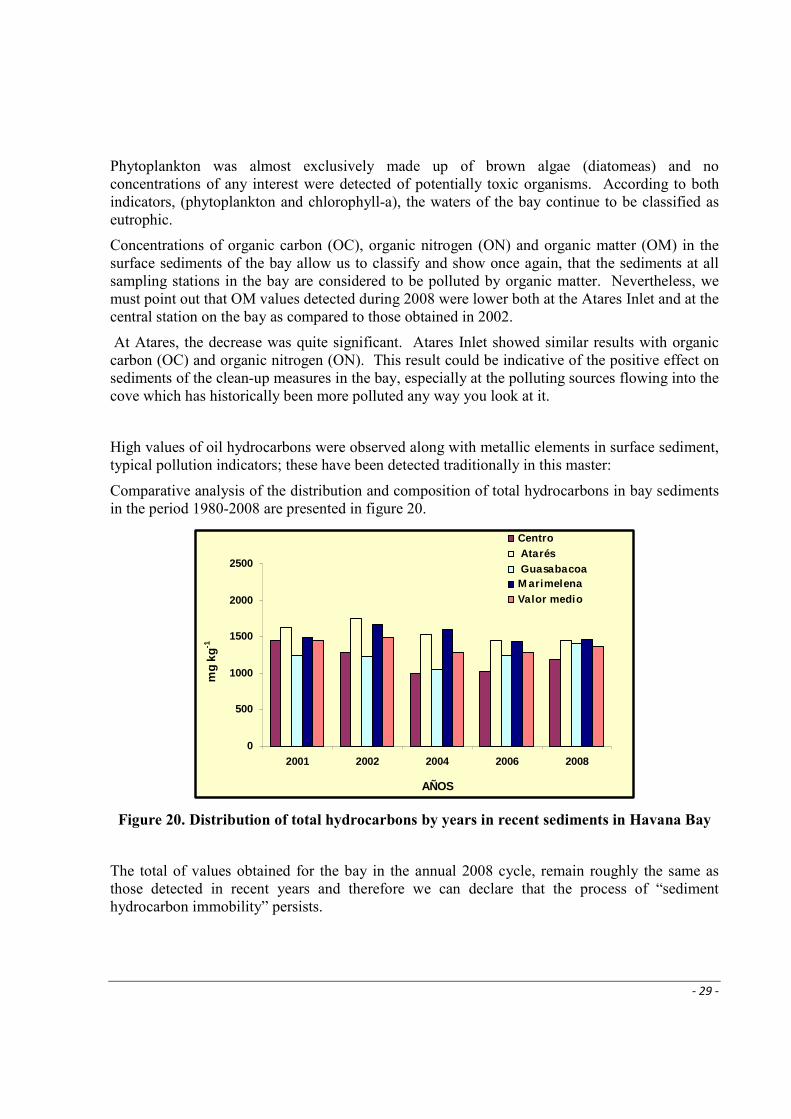
Comparative analysis of the distribution and composition of total hydrocarbons in bay sediments in the period 1980-2008 are presented in figure 20.
0
500
1000
1500
2000
2500
2001 2002 2004 2006 2008
AÑOS
mg
kg-1
Centro Atarés GuasabacoaM arimelenaValor medio
Figure 20. Distribution of total hydrocarbons by years in recent sediments in Havana Bay
The total of values obtained for the bay in the annual 2008 cycle, remain roughly the same as those detected in recent years and therefore we can declare that the process of “sediment hydrocarbon immobility” persists.
- 30 -
Regarding heavy metals, it is demonstrated, yet again, that the distribution of these heavy metals in surface sediments in the bay continues. This is determined by the proximity of the sampling stations to the sites where urban-industrial discharge occurs.
Thus we can see the highest values of Co, Cr, Fe, Mn, Ni and V concentrations in Marimelena Inlet, as well as the highest values of Cu, Zn, and Pb at the central station and at Atares Inlet; this confirms the mixed urban-industrial pollution which has characterized this ecosystem.
A comparison of the concentration intervals obtained by this study in comparison to preceding studies, shows that values continue to be presented as being typical of chronic heavy metal pollution. We can distinguish that these values remain similar to those of recent years, suggesting that the slow-down of the influence of these compounds in the bay’s sediments continues and that it becomes necessary to keep on making efforts to implement measures that will reduce the chemical pollution level in the bay.
Ciénaga Grande Santa Marta (Colombia)
The Ciénaga Grande Santa Marta (CGSM) is located in northern Colombia between 10°43’ y 11°00’ N y los 74°16’ y 74 °38’ W. This system is made up of the lagoon surface of 450 km2; various smaller lagoons connected by canals, the so-called Ciénaga Pajarales (120 km2); and a sand barrier, Salamanca Island which separates the lagoon complex from the Caribbean Sea. The bodies of water cover an approximate area of 1290 km2 between the estuary system of coastal lagoons, rivers and swamps that make up a total mass of 720 km2 of water having an average depth of approximately 1.5 m (Gónima et al. 1998; Lozano y Sierra-Correa, 2005).
The Ciénaga Grande de Santa Marta (CGSM) is both Colombia’s largest coastal lagoon, forming part of the UNESCO Biosphere Reserve in 2000, and one of the most important national parks due to its role in the social and economic development of Colombia. CGSM is also part of the lagoon system of the Magdalena River, Colombia’s longest river (1540 km) that empties directly into the Caribbean (Restrepo and Kjerfve, 2000; Rivera-Monroy, et al. 2004).
The ecological, hydrological and geo-morphological characteristics of CGSM make this coastal ecosystem one of the most productive ones in the neotropical latitudes (Botero and Salzwedel, 1998; Rivera-Monroy et al. 2006), fulfilling important environmental functions and generating global benefits such as a carbon drain, a refuge and a habitat for flora, fauna and migratory species; the region benefits because it exports a column of vapour-transpiration connecting it to the Sierra Nevada of Santa Marta; and there are local benefits due to the extraction of foods and raw materials, undervalued by handling conditions.
Its great biological productivity comes from the contributions of nutrients via the Sierra Nevada rivers, the Magdalena River, the Caribbean Sea and the mangroves which makes up a large part of its area and also provides food, habitat and protection for the young and the adults of many species (Cancio et al., 2006).

- 31 -
The historic past of CGSM reveals important environmental changes that form the origin of the lagoon system, but since the beginning of the twentieth century it has undergone anthropogenic changes causing the environmental deterioration of the region. Some of these are:
• Interrupted water exchange between the lagoon complex and the sea due to the construction of the Cienaga-Barranquilla road (1956-1960) that did not foresee that the natural water flow should be preserved.
• Decreased inflow of freshwater coming from the Magdalena River to the complex, created by the construction of the Medialuna-Pivijay-Salamina and Palermo-Sitio Nuevo highways that interrupted the flow of freshwater to the complex.
• Pollution of the water resource by untreated domestic waste water.
• Deterioration of the hydrographic catchment areas of the rivers flowing into the Ciénaga.
• Inadequate handling of waste coming from agro-industrial activities developed in the banana-growing area and the over-exploitation of water resources in the banana-growing area leading to the rivers bringing lesser amounts of freshwater and greater amounts of sediments.
• Permanent pressure by the inhabitants of the eco region mainly through over-exploitation of the mangroves and the fishing resources.
All of these factors together impacted negatively on the system’s environment, such as the increase of salinity and bodies of water generating an approximate loss of 253.2 km2 of mangroves (estimated up to 2005), as well as the decreased number of fish, molluscs and crustaceans being caught, including losses in biodiversity.
Human establishments inside the water (palafitos) and around the coast of CGSM
The population of CGSM is what puts the most pressure on the ecosystem (Botero and Salzwedel, 1999). Its social and economic conditions have historically been characterized by the
- 32 -
insufficiency of basic needs and services such as drinking water, aqueducts, sewage systems, health and education. Fishing, agriculture and the raising of cattle are the primary activities of the sub-region’s economic structure, with fishing being the main source of income for the area, having the advantage of its geographic location facing the sea, and its multiple connections to the Magdalena River and the rivers flowing down from the Sierra Nevada (Correa, 1999). Nevertheless, varieties of fish have been affected by the salinity of the water and the hydrological disturbances in the lagoon system (Blanco et al., 2007).
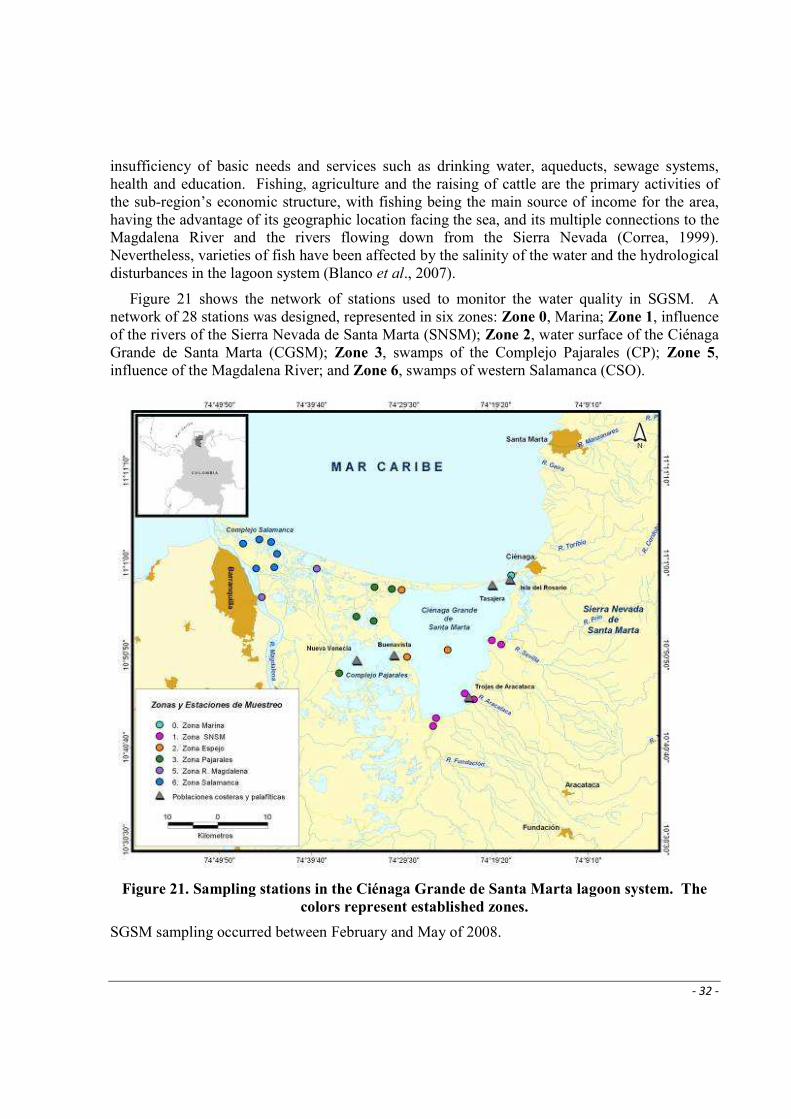
Figure 21 shows the network of stations used to monitor the water quality in SGSM. A network of 28 stations was designed, represented in six zones: Zone 0, Marina; Zone 1, influence of the rivers of the Sierra Nevada de Santa Marta (SNSM); Zone 2, water surface of the Ciénaga Grande de Santa Marta (CGSM); Zone 3, swamps of the Complejo Pajarales (CP); Zone 5, influence of the Magdalena River; and Zone 6, swamps of western Salamanca (CSO).
Figure 21. Sampling stations in the Ciénaga Grande de Santa Marta lagoon system. The
colors represent established zones.
SGSM sampling occurred between February and May of 2008.
- 33 -
Summary of the monitoring results
Salinity is perhaps the physical-chemical variable that historically best describes the hydrological disturbances in the lagoon system and the coastal area (Blanco et al., 2006), since its increase or decrease depends on the amount of fresh water entering and leaving the system.
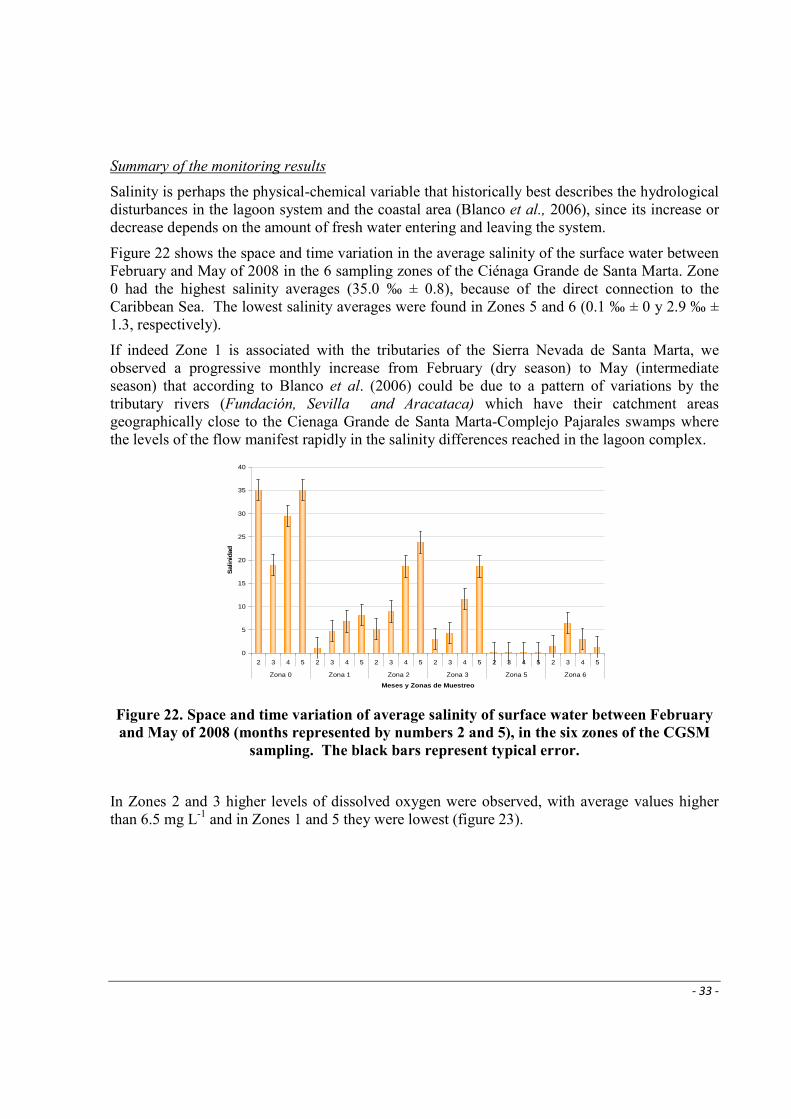
Figure 22 shows the space and time variation in the average salinity of the surface water between February and May of 2008 in the 6 sampling zones of the Ciénaga Grande de Santa Marta. Zone 0 had the highest salinity averages (35.0 ‰ ± 0.8), because of the direct connection to the Caribbean Sea. The lowest salinity averages were found in Zones 5 and 6 (0.1 ‰ ± 0 y 2.9 ‰ ± 1.3, respectively).
If indeed Zone 1 is associated with the tributaries of the Sierra Nevada de Santa Marta, we observed a progressive monthly increase from February (dry season) to May (intermediate season) that according to Blanco et al. (2006) could be due to a pattern of variations by the tributary rivers (Fundación, Sevilla and Aracataca) which have their catchment areas geographically close to the Cienaga Grande de Santa Marta-Complejo Pajarales swamps where the levels of the flow manifest rapidly in the salinity differences reached in the lagoon complex.
0
5
10
15
20
25
30
35
40
2 3 4 5 2 3 4 5 2 3 4 5 2 3 4 5 2 3 4 5 2 3 4 5
Zona 0 Zona 1 Zona 2 Zona 3 Zona 5 Zona 6
Meses y Zonas de Muestreo
Sal
inid
ad
Figure 22. Space and time variation of average salinity of surface water between February
and May of 2008 (months represented by numbers 2 and 5), in the six zones of the CGSM
sampling. The black bars represent typical error.
In Zones 2 and 3 higher levels of dissolved oxygen were observed, with average values higher than 6.5 mg L-1 and in Zones 1 and 5 they were lowest (figure 23).
- 34 -
0,0
1,0
2,0
3,0
4,0
5,0
6,0
7,0
8,0
9,0
10,0
2 3 4 5 2 3 4 5 2 3 4 5 2 3 4 5 2 3 4 5 2 3 4 5
Zona 0 Zona 1 Zona 2 Zona 3 Zona 5 Zona 6
Meses y Zonas de Muestreo
Oxí
geno
Dis
uelto
(m
g/L)
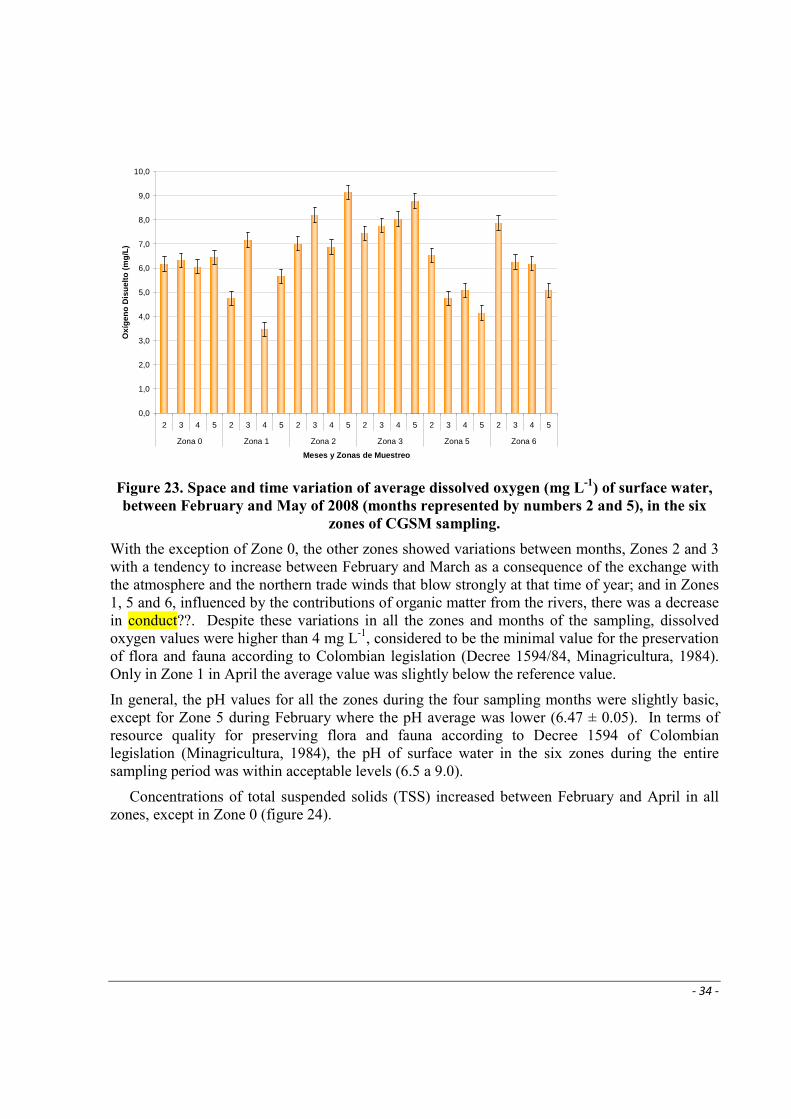
Figure 23. Space and time variation of average dissolved oxygen (mg L-1
) of surface water,
between February and May of 2008 (months represented by numbers 2 and 5), in the six
zones of CGSM sampling.
With the exception of Zone 0, the other zones showed variations between months, Zones 2 and 3 with a tendency to increase between February and March as a consequence of the exchange with the atmosphere and the northern trade winds that blow strongly at that time of year; and in Zones 1, 5 and 6, influenced by the contributions of organic matter from the rivers, there was a decrease in conduct??. Despite these variations in all the zones and months of the sampling, dissolved oxygen values were higher than 4 mg L-1, considered to be the minimal value for the preservation of flora and fauna according to Colombian legislation (Decree 1594/84, Minagricultura, 1984). Only in Zone 1 in April the average value was slightly below the reference value.
In general, the pH values for all the zones during the four sampling months were slightly basic, except for Zone 5 during February where the pH average was lower (6.47 ± 0.05). In terms of resource quality for preserving flora and fauna according to Decree 1594 of Colombian legislation (Minagricultura, 1984), the pH of surface water in the six zones during the entire sampling period was within acceptable levels (6.5 a 9.0).
Concentrations of total suspended solids (TSS) increased between February and April in all zones, except in Zone 0 (figure 24).

- 35 -
0
50
100
150
200
250
300
350
400
450
500
2 4 2 4 2 4 2 4 2 4 2 4
Zona 0 Zona 1 Zona 2 Zona 3 Zona 5 Zona 6
Meses y Zonas de Muestreo
Sól
idos
Sus
pend
idos
Tot
ales
(m
g/L)
Figure 24. Space and time variation of total suspended solids (mg/L) average of surface
water in February (2) and April (4) of 2008 in the six zones of CGSM sampling.
In Zone 5, TSS averages were more than twice the averages in the rest of the zones because of the contributions of sediments from the Magdalena River. This parameter in CGSM has historically shown (1993-2007) obvious inter-annual variations, influenced by the El Niño and La Niña climatic events, as well as the reopening of the Clarín, Aguas Negras and Renegado channels allowing for a greater amount of sediment to be brought in by the Magdalena River into the lagoon complex (INVEMAR, 2007)
The greatest chlorophyll content was recorded in Zones 1, 2 and 3(figure 25) which are the zones having clearly estuary characteristics. With the exception of Zone 0 (marine), the other zones showed a decrease in the concentration of chlorophyll-a from February (dry season) to April (beginning of the first rains), especially in Zones 1 and 2 where the concentrations recorded in April were close to being lower than the concentrations recorded in February. This parameter was not measured in Zone 5 because of the great amount of solids in suspension that interfered with measurements.

- 36 -
0,0
5,0
10,0
15,0
20,0
25,0
30,0
35,0
40,0
45,0
2 4 2 4 2 4 2 4 2 4
Zona 0 Zona 1 Zona 2 Zona 3 Zona 6
Meses y Zonas de Muestreo
Clo
rofil
a a
(µg/
L)
Figure 25. Space and time variation of Chlorophyll-a concentration (µg/L) in surface
water between February and May 2008 in the six CGSM sampling zones.
The ranges in hydrological fluctuation presented in the lagoon system can cause effects on the dynamics of the nutrients playing an important role in the primary productivity and in the localized production processes and oxygen demand (INVEMAR, 2007).
Nitrates (NO3-1) in the lagoon system fluctuated in an average range of 5,44 ± 0,36 in Zones 5
and 6, and 0,02 ± 0,01 µmol L-1 in Zones 0, 1, 2 and 3 (figure 26). High concentrations of NO3-1
in Zones 5 and 6 relate to the inorganic nitrogen contributions into the lagoon system coming from Magdalena River through the interconnecting channels.
0,0
1,0
2,0
3,0
4,0
5,0
6,0
7,0
2 2 4 2 4 2 4 2 4 2 4
Zona 0 Zona 1 Zona 2 Zona 3 Zona 5 Zona 6
Meses y Zonas de Muestreo
Nitr
atos
(µm
ol/L
)
Figure 26. Space and time variation of nitrates NO3 (µmol L-1
) in the surface waters of the
six CGSM sampling zones in February (2) and April (4) 2008.
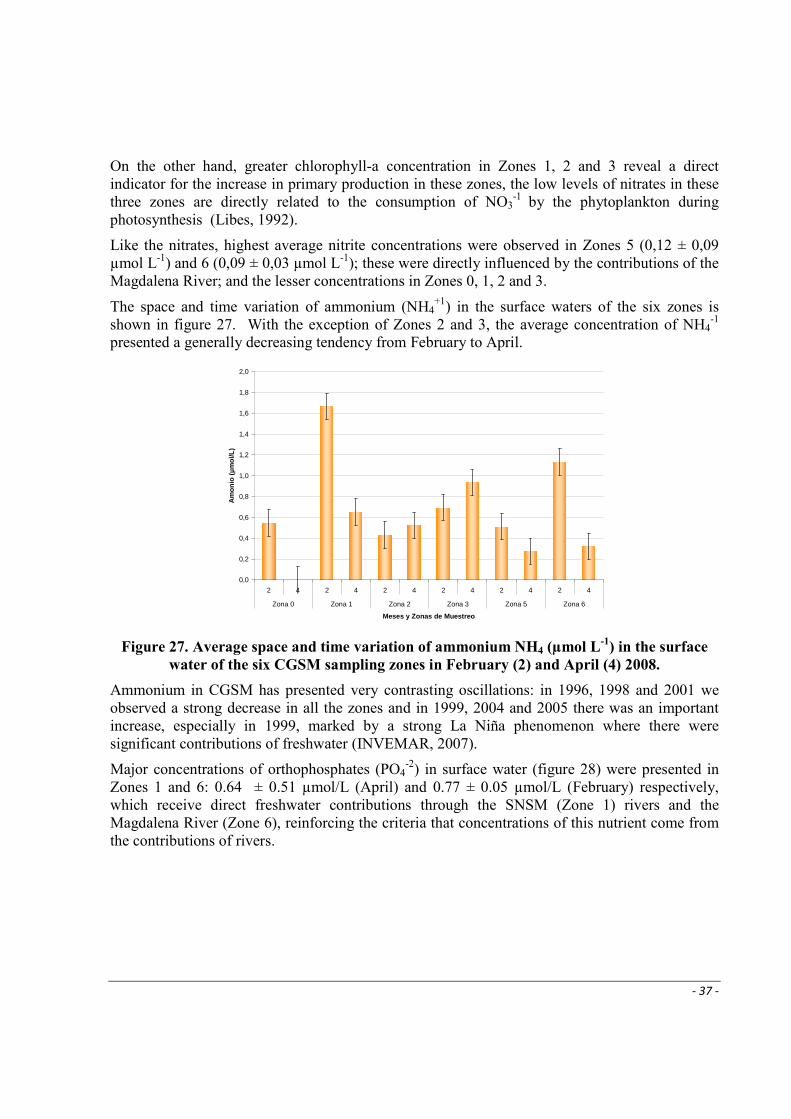
- 37 -
On the other hand, greater chlorophyll-a concentration in Zones 1, 2 and 3 reveal a direct indicator for the increase in primary production in these zones, the low levels of nitrates in these three zones are directly related to the consumption of NO3
-1 by the phytoplankton during photosynthesis (Libes, 1992).
Like the nitrates, highest average nitrite concentrations were observed in Zones 5 (0,12 ± 0,09 µmol L-1) and 6 (0,09 ± 0,03 µmol L-1); these were directly influenced by the contributions of the Magdalena River; and the lesser concentrations in Zones 0, 1, 2 and 3.
The space and time variation of ammonium (NH4+1) in the surface waters of the six zones is
shown in figure 27. With the exception of Zones 2 and 3, the average concentration of NH4-1
presented a generally decreasing tendency from February to April.
0,0
0,2
0,4
0,6
0,8
1,0
1,2
1,4
1,6
1,8
2,0
2 4 2 4 2 4 2 4 2 4 2 4
Zona 0 Zona 1 Zona 2 Zona 3 Zona 5 Zona 6
Meses y Zonas de Muestreo
Am
onio
(µm
ol/L
)
Figure 27. Average space and time variation of ammonium NH4 (µmol L-1
) in the surface
water of the six CGSM sampling zones in February (2) and April (4) 2008.
Ammonium in CGSM has presented very contrasting oscillations: in 1996, 1998 and 2001 we observed a strong decrease in all the zones and in 1999, 2004 and 2005 there was an important increase, especially in 1999, marked by a strong La Niña phenomenon where there were significant contributions of freshwater (INVEMAR, 2007).
Major concentrations of orthophosphates (PO4-2) in surface water (figure 28) were presented in
Zones 1 and 6: 0.64 ± 0.51 µmol/L (April) and 0.77 ± 0.05 µmol/L (February) respectively, which receive direct freshwater contributions through the SNSM (Zone 1) rivers and the Magdalena River (Zone 6), reinforcing the criteria that concentrations of this nutrient come from the contributions of rivers.

- 38 -
0,0
0,1
0,2
0,3
0,4
0,5
0,6
0,7
0,8
0,9
2 4 2 4 2 4 2 4 2 4 2 4
Zona 0 Zona 1 Zona 2 Zona 3 Zona 5 Zona 6
Meses y Zonas de Muestreo
Ort
ofos
fato
s (µ
mol
/L)
Figure 28. Average space and time variation of Orthophosphates PO3-
4 (µmol L-1
) in
surface water of the six CGSM sampling zones in February (2) and April(4) 2008.
The microbiological indicators of the coliform group were measured to evaluate the sanitary quality of waters adjacent to human settlements located in the stilt-houses (human settlements in the waters of the swamp) and in the CGSM coastal towns. The greatest concentration of total coliform (TTC) was presented in the station close to the Trojas de Aracataca stilt-houses, with values of 17000 NMP/100 mL (Figure 29 ) which were more than three times above the reference value established by Colombian legislation for secondary contact activities such as fishing (5000 NMP/ 100 mL; Minagricultura, 1984).
0
2500
5000
7500
10000
12500
15000
17500
20000
2 4 2 4 2 4 2 4 2 4
Islas del Rosario Trojas de Aracataca Tasajera Buenavista Nueva Venecia
Zona 0 Zona 1 Zona 2 Zona 3
Meses y Zonas de Muestreo
Col
iform
es T
otal
es (
NM
P/1
00 m
L)
Figure 29. Space and time variations of total coliform (NMP/100 mL) measured in surface
water and adjacent to stilt-housing and CGSM coastal settlements in February (2) and
April (2 ) 2008.
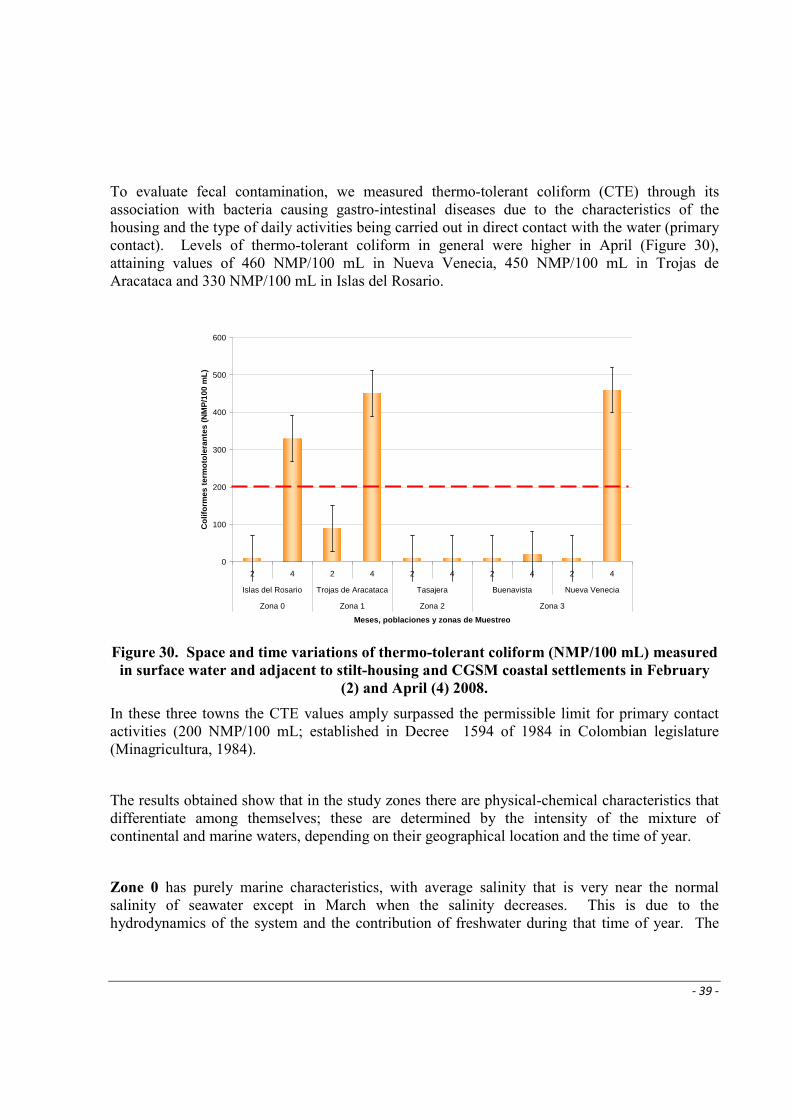
- 39 -
To evaluate fecal contamination, we measured thermo-tolerant coliform (CTE) through its association with bacteria causing gastro-intestinal diseases due to the characteristics of the housing and the type of daily activities being carried out in direct contact with the water (primary contact). Levels of thermo-tolerant coliform in general were higher in April (Figure 30), attaining values of 460 NMP/100 mL in Nueva Venecia, 450 NMP/100 mL in Trojas de Aracataca and 330 NMP/100 mL in Islas del Rosario.
0
100
200
300
400
500
600
2 4 2 4 2 4 2 4 2 4
Islas del Rosario Trojas de Aracataca Tasajera Buenavista Nueva Venecia
Zona 0 Zona 1 Zona 2 Zona 3
Meses, poblaciones y zonas de Muestreo
Col
iform
es te
rmot
oler
ante
s (N
MP
/100
mL)
Figure 30. Space and time variations of thermo-tolerant coliform (NMP/100 mL) measured
in surface water and adjacent to stilt-housing and CGSM coastal settlements in February
(2) and April (4) 2008.
In these three towns the CTE values amply surpassed the permissible limit for primary contact activities (200 NMP/100 mL; established in Decree 1594 of 1984 in Colombian legislature (Minagricultura, 1984).
The results obtained show that in the study zones there are physical-chemical characteristics that differentiate among themselves; these are determined by the intensity of the mixture of continental and marine waters, depending on their geographical location and the time of year.
Zone 0 has purely marine characteristics, with average salinity that is very near the normal salinity of seawater except in March when the salinity decreases. This is due to the hydrodynamics of the system and the contribution of freshwater during that time of year. The
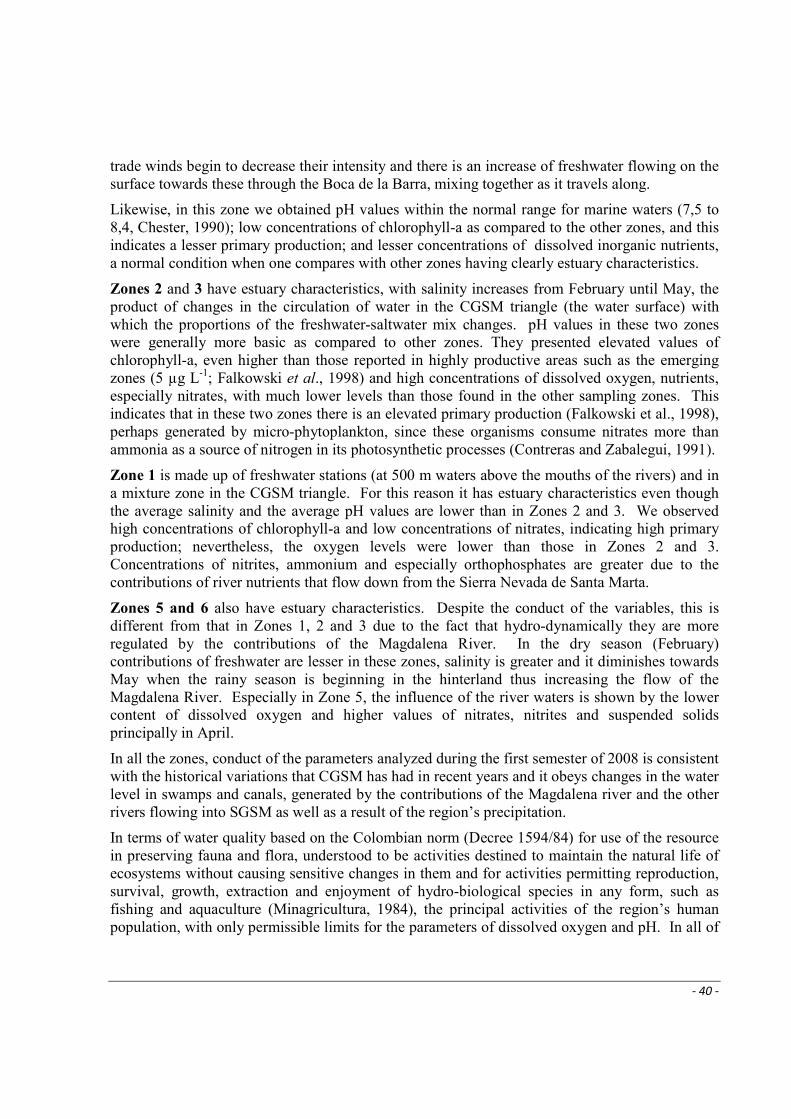
- 40 -
trade winds begin to decrease their intensity and there is an increase of freshwater flowing on the surface towards these through the Boca de la Barra, mixing together as it travels along.
Likewise, in this zone we obtained pH values within the normal range for marine waters (7,5 to 8,4, Chester, 1990); low concentrations of chlorophyll-a as compared to the other zones, and this indicates a lesser primary production; and lesser concentrations of dissolved inorganic nutrients, a normal condition when one compares with other zones having clearly estuary characteristics.
Zones 2 and 3 have estuary characteristics, with salinity increases from February until May, the product of changes in the circulation of water in the CGSM triangle (the water surface) with which the proportions of the freshwater-saltwater mix changes. pH values in these two zones were generally more basic as compared to other zones. They presented elevated values of chlorophyll-a, even higher than those reported in highly productive areas such as the emerging zones (5 µg L-1; Falkowski et al., 1998) and high concentrations of dissolved oxygen, nutrients, especially nitrates, with much lower levels than those found in the other sampling zones. This indicates that in these two zones there is an elevated primary production (Falkowski et al., 1998), perhaps generated by micro-phytoplankton, since these organisms consume nitrates more than ammonia as a source of nitrogen in its photosynthetic processes (Contreras and Zabalegui, 1991).
Zone 1 is made up of freshwater stations (at 500 m waters above the mouths of the rivers) and in a mixture zone in the CGSM triangle. For this reason it has estuary characteristics even though the average salinity and the average pH values are lower than in Zones 2 and 3. We observed high concentrations of chlorophyll-a and low concentrations of nitrates, indicating high primary production; nevertheless, the oxygen levels were lower than those in Zones 2 and 3. Concentrations of nitrites, ammonium and especially orthophosphates are greater due to the contributions of river nutrients that flow down from the Sierra Nevada de Santa Marta.
Zones 5 and 6 also have estuary characteristics. Despite the conduct of the variables, this is different from that in Zones 1, 2 and 3 due to the fact that hydro-dynamically they are more regulated by the contributions of the Magdalena River. In the dry season (February) contributions of freshwater are lesser in these zones, salinity is greater and it diminishes towards May when the rainy season is beginning in the hinterland thus increasing the flow of the Magdalena River. Especially in Zone 5, the influence of the river waters is shown by the lower content of dissolved oxygen and higher values of nitrates, nitrites and suspended solids principally in April.
In all the zones, conduct of the parameters analyzed during the first semester of 2008 is consistent with the historical variations that CGSM has had in recent years and it obeys changes in the water level in swamps and canals, generated by the contributions of the Magdalena river and the other rivers flowing into SGSM as well as a result of the region’s precipitation.
In terms of water quality based on the Colombian norm (Decree 1594/84) for use of the resource in preserving fauna and flora, understood to be activities destined to maintain the natural life of ecosystems without causing sensitive changes in them and for activities permitting reproduction, survival, growth, extraction and enjoyment of hydro-biological species in any form, such as fishing and aquaculture (Minagricultura, 1984), the principal activities of the region’s human population, with only permissible limits for the parameters of dissolved oxygen and pH. In all of
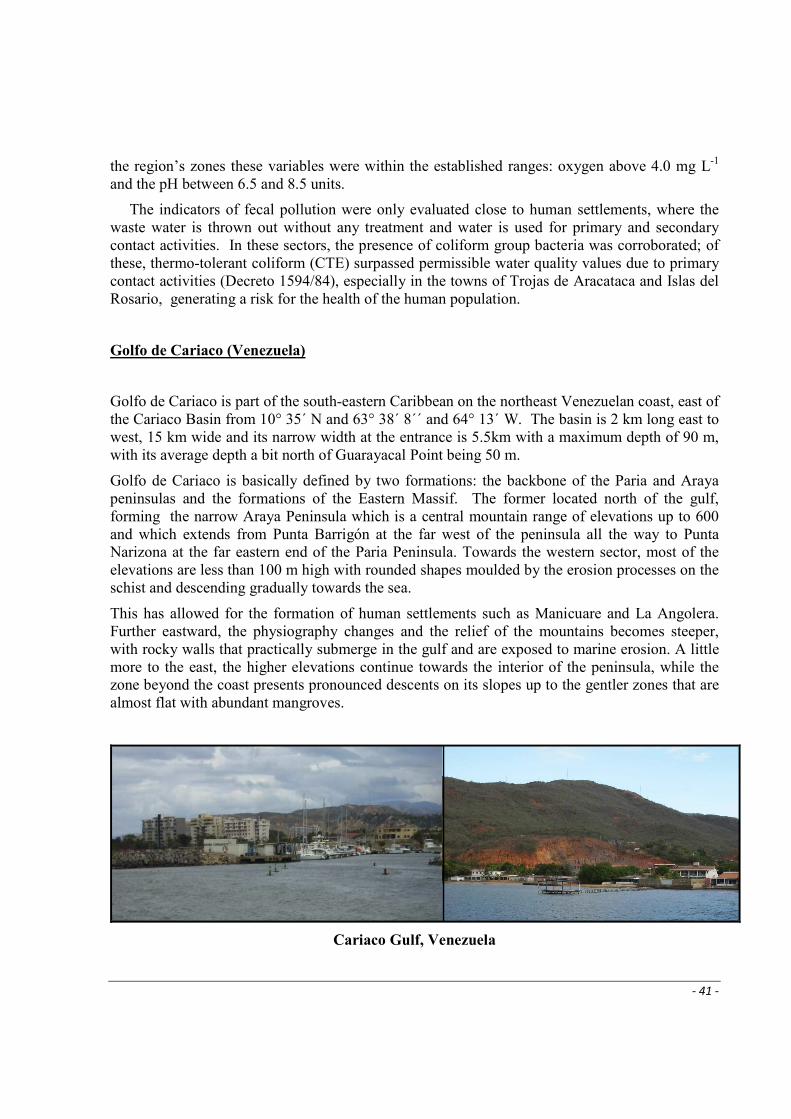
- 41 -
the region’s zones these variables were within the established ranges: oxygen above 4.0 mg L-1 and the pH between 6.5 and 8.5 units.
The indicators of fecal pollution were only evaluated close to human settlements, where the waste water is thrown out without any treatment and water is used for primary and secondary contact activities. In these sectors, the presence of coliform group bacteria was corroborated; of these, thermo-tolerant coliform (CTE) surpassed permissible water quality values due to primary contact activities (Decreto 1594/84), especially in the towns of Trojas de Aracataca and Islas del Rosario, generating a risk for the health of the human population.
Golfo de Cariaco (Venezuela)
Golfo de Cariaco is part of the south-eastern Caribbean on the northeast Venezuelan coast, east of the Cariaco Basin from 10° 35´ N and 63° 38´ 8´´ and 64° 13´ W. The basin is 2 km long east to west, 15 km wide and its narrow width at the entrance is 5.5km with a maximum depth of 90 m, with its average depth a bit north of Guarayacal Point being 50 m.
Golfo de Cariaco is basically defined by two formations: the backbone of the Paria and Araya peninsulas and the formations of the Eastern Massif. The former located north of the gulf, forming the narrow Araya Peninsula which is a central mountain range of elevations up to 600 and which extends from Punta Barrigón at the far west of the peninsula all the way to Punta Narizona at the far eastern end of the Paria Peninsula. Towards the western sector, most of the elevations are less than 100 m high with rounded shapes moulded by the erosion processes on the schist and descending gradually towards the sea.
This has allowed for the formation of human settlements such as Manicuare and La Angolera. Further eastward, the physiography changes and the relief of the mountains becomes steeper, with rocky walls that practically submerge in the gulf and are exposed to marine erosion. A little more to the east, the higher elevations continue towards the interior of the peninsula, while the zone beyond the coast presents pronounced descents on its slopes up to the gentler zones that are almost flat with abundant mangroves.
Cariaco Gulf, Venezuela
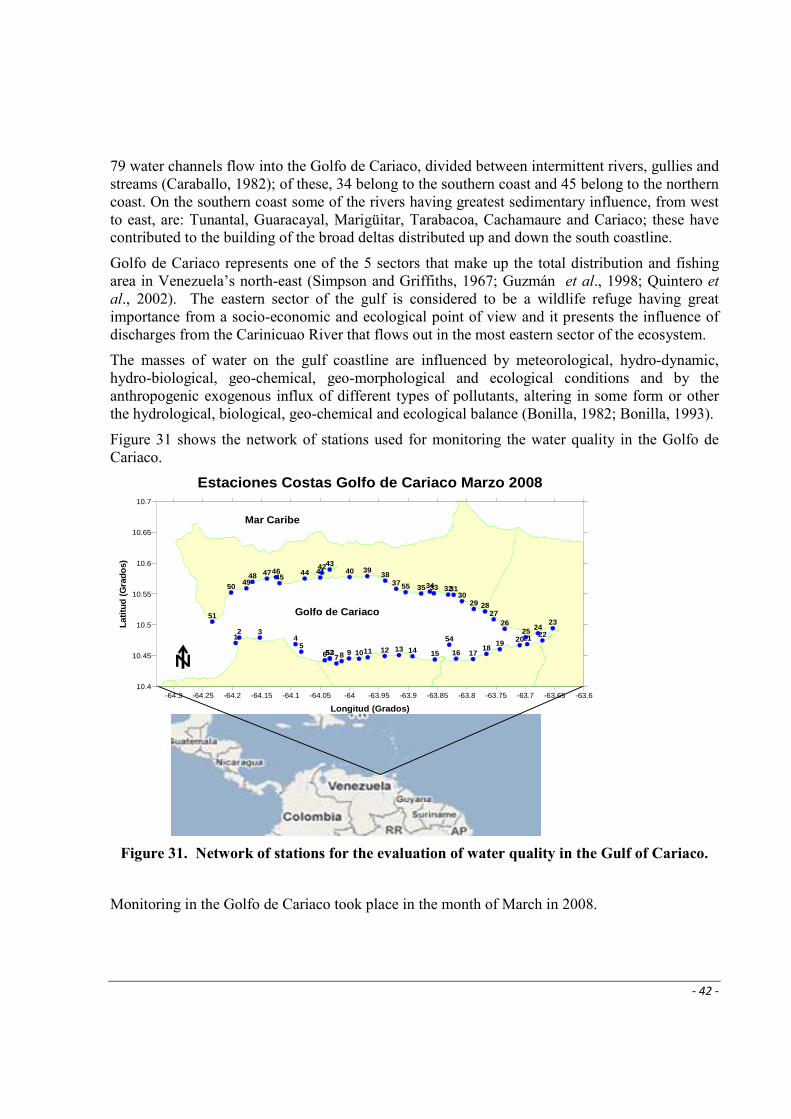
- 42 -
79 water channels flow into the Golfo de Cariaco, divided between intermittent rivers, gullies and streams (Caraballo, 1982); of these, 34 belong to the southern coast and 45 belong to the northern coast. On the southern coast some of the rivers having greatest sedimentary influence, from west to east, are: Tunantal, Guaracayal, Marigüitar, Tarabacoa, Cachamaure and Cariaco; these have contributed to the building of the broad deltas distributed up and down the south coastline.
Golfo de Cariaco represents one of the 5 sectors that make up the total distribution and fishing area in Venezuela’s north-east (Simpson and Griffiths, 1967; Guzmán et al., 1998; Quintero et al., 2002). The eastern sector of the gulf is considered to be a wildlife refuge having great importance from a socio-economic and ecological point of view and it presents the influence of discharges from the Carinicuao River that flows out in the most eastern sector of the ecosystem.
The masses of water on the gulf coastline are influenced by meteorological, hydro-dynamic, hydro-biological, geo-chemical, geo-morphological and ecological conditions and by the anthropogenic exogenous influx of different types of pollutants, altering in some form or other the hydrological, biological, geo-chemical and ecological balance (Bonilla, 1982; Bonilla, 1993).
Figure 31 shows the network of stations used for monitoring the water quality in the Golfo de Cariaco.
-64.3 -64.25 -64.2 -64.15 -64.1 -64.05 -64 -63.95 -63.9 -63.85 -63.8 -63.75 -63.7 -63.65 -63.6
Longitud (Grados)
Estaciones Costas Golfo de Cariaco Marzo 2008
10.4
10.45
10.5
10.55
10.6
10.65
10.7
Latit
ud (
Gra
dos)
12 3
45
6 7 8 9 1011 12 13 14 15 16 1718
19 2021 22
232425
2627
282930
313233343537
38394041
424344
45464748
4950
51
5253
54
55
Golfo de Cariaco
Mar Caribe
Figure 31. Network of stations for the evaluation of water quality in the Gulf of Cariaco.
Monitoring in the Golfo de Cariaco took place in the month of March in 2008.
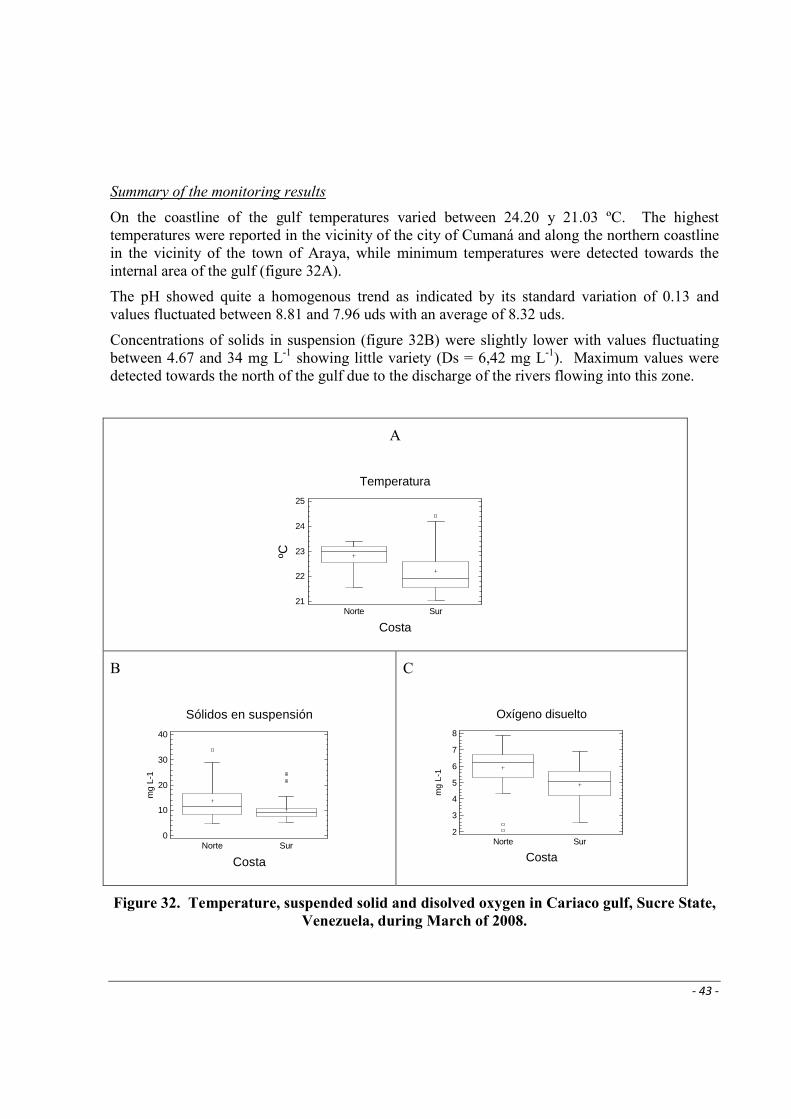
- 43 -
Summary of the monitoring results
On the coastline of the gulf temperatures varied between 24.20 y 21.03 ºC. The highest temperatures were reported in the vicinity of the city of Cumaná and along the northern coastline in the vicinity of the town of Araya, while minimum temperatures were detected towards the internal area of the gulf (figure 32A).
The pH showed quite a homogenous trend as indicated by its standard variation of 0.13 and values fluctuated between 8.81 and 7.96 uds with an average of 8.32 uds.
Concentrations of solids in suspension (figure 32B) were slightly lower with values fluctuating between 4.67 and 34 mg L-1 showing little variety (Ds = 6,42 mg L-1). Maximum values were detected towards the north of the gulf due to the discharge of the rivers flowing into this zone.
A
Temperatura
ºC
CostaNorte Sur
21
22
23
24
25
B
Sólidos en suspensión
mg
L-1
CostaNorte Sur
0
10
20
30
40
C
Oxígeno disuelto
mg
L-1
CostaNorte Sur
2
3
4
5
6
7
8
Figure 32. Temperature, suspended solid and disolved oxygen in Cariaco gulf, Sucre State,
Venezuela, during March of 2008.
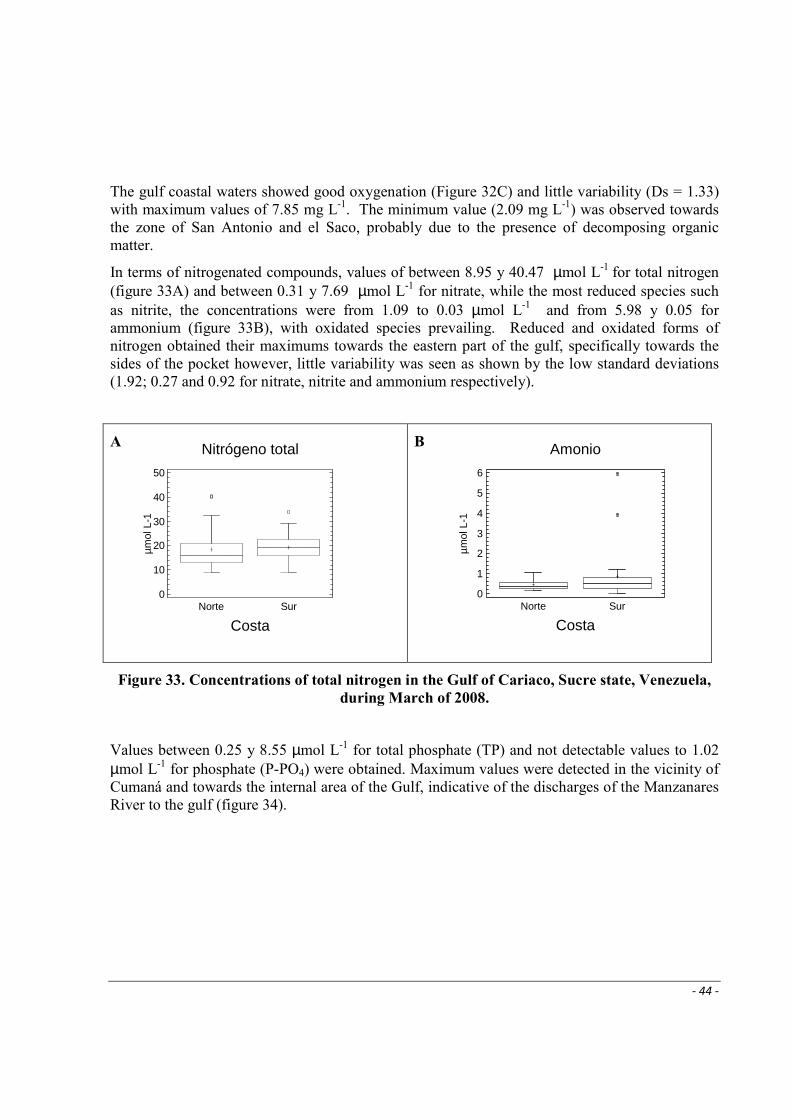
- 44 -
Nitrógeno total
µm
ol L
-1
CostaNorte Sur
0
10
20
30
40
50
Amonio
µm
ol L
-1
CostaNorte Sur
0
1
2
3
4
5
6
The gulf coastal waters showed good oxygenation (Figure 32C) and little variability (Ds = 1.33) with maximum values of 7.85 mg L-1. The minimum value (2.09 mg L-1) was observed towards the zone of San Antonio and el Saco, probably due to the presence of decomposing organic matter.
In terms of nitrogenated compounds, values of between 8.95 y 40.47 µmol L-1 for total nitrogen (figure 33A) and between 0.31 y 7.69 µmol L-1 for nitrate, while the most reduced species such as nitrite, the concentrations were from 1.09 to 0.03 µmol L-1 and from 5.98 y 0.05 for ammonium (figure 33B), with oxidated species prevailing. Reduced and oxidated forms of nitrogen obtained their maximums towards the eastern part of the gulf, specifically towards the sides of the pocket however, little variability was seen as shown by the low standard deviations (1.92; 0.27 and 0.92 for nitrate, nitrite and ammonium respectively).
A B
Figure 33. Concentrations of total nitrogen in the Gulf of Cariaco, Sucre state, Venezuela,
during March of 2008.
Values between 0.25 y 8.55 µmol L-1 for total phosphate (TP) and not detectable values to 1.02 µmol L-1 for phosphate (P-PO4) were obtained. Maximum values were detected in the vicinity of Cumaná and towards the internal area of the Gulf, indicative of the discharges of the Manzanares River to the gulf (figure 34).

- 45 -
A
Fósforo total
µm
ol L
-1
CostaNorte Sur
0
2
4
6
8
10
B
Fosfatos
µm
ol L
-1
CostaNorte Sur
0
0,2
0,4
0,6
0,8
1
1,2
Figure 34. Concentrations of ammonium (A) and phosphate (B) in the Cariaca Gulf, Sucre
state, Venezuela, during March of 2008.
Values for silicate (Si-SiO3) were higher close to the discharge of the Manzanares and Carinicuao rivers, with concentrations fluctuating between 2.18 up to 29.12 µmol L-1 (figure 35A).
A
Silicatos
µm
ol L
-1
CostaNorte Sur
0
5
10
15
20
25
30
B
DBO 5
mg
L-1
CostaNorte Sur
0
20
40
60
80
Figure 35. Concentrations of silicate in the Gulf of Cariaco, Sucre state, Venezuela, during
March of 2008.
The maximum values of the BOD5 (71.49 y 62. 07 mg L-1) were obtained in the proximity of the discharge of Manzanares and Carinicuao rivers, a result to be expected due to the accumulation in
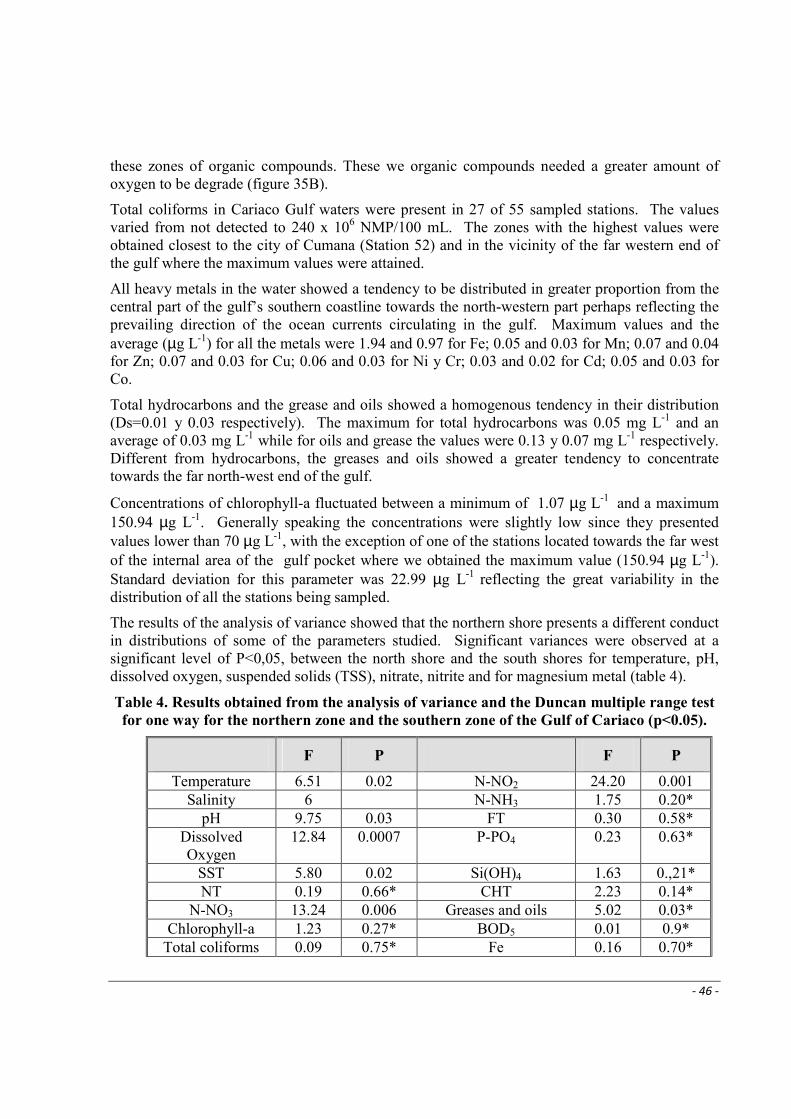
- 46 -
these zones of organic compounds. These we organic compounds needed a greater amount of oxygen to be degrade (figure 35B).
Total coliforms in Cariaco Gulf waters were present in 27 of 55 sampled stations. The values varied from not detected to 240 x 106 NMP/100 mL. The zones with the highest values were obtained closest to the city of Cumana (Station 52) and in the vicinity of the far western end of the gulf where the maximum values were attained.
All heavy metals in the water showed a tendency to be distributed in greater proportion from the central part of the gulf’s southern coastline towards the north-western part perhaps reflecting the prevailing direction of the ocean currents circulating in the gulf. Maximum values and the average (µg L-1) for all the metals were 1.94 and 0.97 for Fe; 0.05 and 0.03 for Mn; 0.07 and 0.04 for Zn; 0.07 and 0.03 for Cu; 0.06 and 0.03 for Ni y Cr; 0.03 and 0.02 for Cd; 0.05 and 0.03 for Co.
Total hydrocarbons and the grease and oils showed a homogenous tendency in their distribution (Ds=0.01 y 0.03 respectively). The maximum for total hydrocarbons was 0.05 mg L-1 and an average of 0.03 mg L-1 while for oils and grease the values were 0.13 y 0.07 mg L-1 respectively. Different from hydrocarbons, the greases and oils showed a greater tendency to concentrate towards the far north-west end of the gulf.
Concentrations of chlorophyll-a fluctuated between a minimum of 1.07 µg L-1 and a maximum 150.94 µg L-1. Generally speaking the concentrations were slightly low since they presented values lower than 70 µg L-1, with the exception of one of the stations located towards the far west of the internal area of the gulf pocket where we obtained the maximum value (150.94 µg L-1). Standard deviation for this parameter was 22.99 µg L-1 reflecting the great variability in the distribution of all the stations being sampled.
The results of the analysis of variance showed that the northern shore presents a different conduct in distributions of some of the parameters studied. Significant variances were observed at a significant level of P<0,05, between the north shore and the south shores for temperature, pH, dissolved oxygen, suspended solids (TSS), nitrate, nitrite and for magnesium metal (table 4).
Table 4. Results obtained from the analysis of variance and the Duncan multiple range test
for one way for the northern zone and the southern zone of the Gulf of Cariaco (p<0.05).
F P F P
Temperature 6.51 0.02 N-NO2 24.20 0.001 Salinity 6 N-NH3 1.75 0.20*
pH 9.75 0.03 FT 0.30 0.58* Dissolved Oxygen
12.84 0.0007 P-PO4 0.23 0.63*
SST 5.80 0.02 Si(OH)4 1.63 0.,21* NT 0.19 0.66* CHT 2.23 0.14*
N-NO3 13.24 0.006 Greases and oils 5.02 0.03* Chlorophyll-a 1.23 0.27* BOD5 0.01 0.9*
Total coliforms 0.09 0.75* Fe 0.16 0.70*
- 47 -
Mn 18.04 0.001 Cu 3.27 0.08* Ni 0.18 0.68* Cr 3.54 0.06* Zn 6.38 0.01 Cd 0.054 0.46*
* no significant
The presence of compounds such as hydrocarbons, heavy metals, nitrogen and phosphorus compounds in moderately high concentrations, as well as the presence of coliform, combining with the low concentrations of chlorophyll-a detected in most of the sampled stations, lead to the supposition that direct discharges of domestic and industrial waters are producing an impact on the waters that are putting the ecology of this important ecosystem at risk.
The north shore presents a different conduct in the distributions of some of the parameters studied in regards to the south shore, possibly because of the type of human settlements located in this zone which generally have no public services of any kind and must dispose of their waters directly into the sea.
In conclusion, the results show anthropogenic intervention in the waters of Cariaco Gulf, due to three main factors: 1) the discharge of Manzanares (west) and Carinicuao (east) rivers; 2) anthropogenic contributions of near populations and 3) the currents system inside the gulf, which transports to the polluting compounds from the south coast until north.
It is recommended to carry out a continuous monitoring of physical-chemical indicaors in waters and sediments, and include flows and loads from the rivers that discharge in the Gulf. As well as, it would be convenient the implementation of waste water treatment system.
Kingston Harbour (Jamaica)
Kingston Harbour is located on the south coast of Jamaica at 17º57 'latitude north and at 76º48 'longitude west. It is a long bay extending for 16.5 km east to west and 6.5 km north to south, with a surface total area of approximately 51 km2 (Vadee, 1976).
The city of Kingston is located at the north end of the bay and at the farthest western end we find the residential area of Portmore.
Originally the western side of the bay was continuous with a low zone (Hunts Bay). In 1967 the mouth of this small bay was partially occluded by the construction of a highway with a bridge in order to allow the continued exchange of water between this zone and the rest of the bay.
The entrance to the bay is a canal 2 km wide at the south-west (Vadee, 1976) which leads to a natural curved river-bed that has been modified by natural (earthquakes) and human (construction of an airport and highway) activities.
Kingston Harbour can be divided into three basic areas: the first is the Outer Harbour, a deep area within the mouth of the bay between Port Royal on the east and Port Henderson on the west which has a maximum depth of 18 m. The second is the Inner Harbour which extends along the central principal east-west axis. The third is the Upper Basin in the most eastern part of the bay. A special zone to the north-east of the bay is Hunts Bay which has an average depth of 1.5 m.
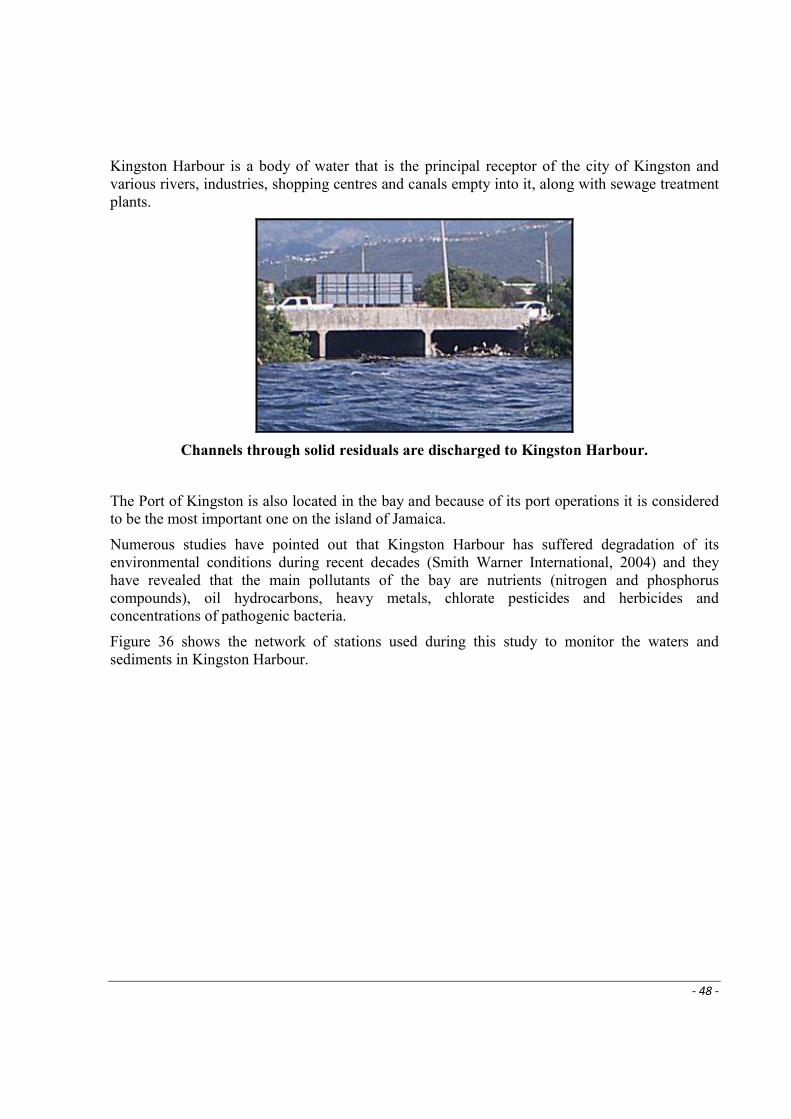
- 48 -
Kingston Harbour is a body of water that is the principal receptor of the city of Kingston and various rivers, industries, shopping centres and canals empty into it, along with sewage treatment plants.
Channels through solid residuals are discharged to Kingston Harbour.
The Port of Kingston is also located in the bay and because of its port operations it is considered to be the most important one on the island of Jamaica.
Numerous studies have pointed out that Kingston Harbour has suffered degradation of its environmental conditions during recent decades (Smith Warner International, 2004) and they have revealed that the main pollutants of the bay are nutrients (nitrogen and phosphorus compounds), oil hydrocarbons, heavy metals, chlorate pesticides and herbicides and concentrations of pathogenic bacteria.
Figure 36 shows the network of stations used during this study to monitor the waters and sediments in Kingston Harbour.
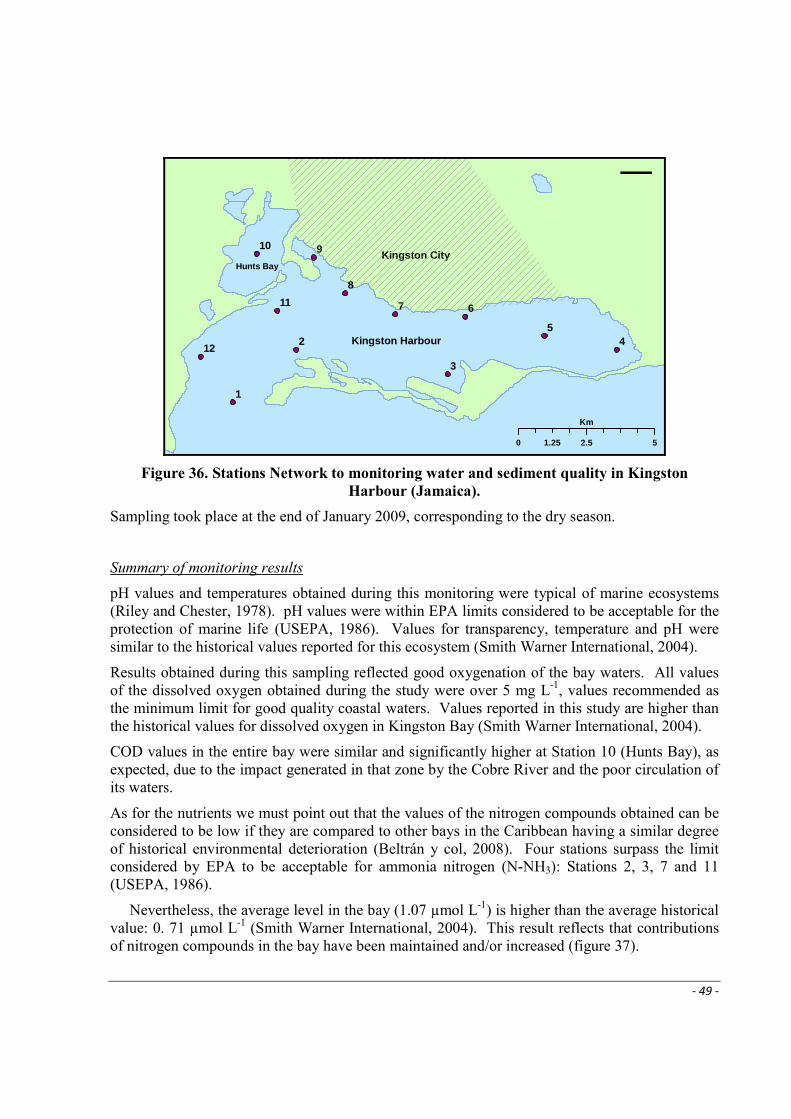
- 49 -
Kingston Harbour
Kingston CityHunts Bay
9
8
7 6
54
3
2
1
12
11
10
¯
0 2.5 51.25
Km
Figure 36. Stations Network to monitoring water and sediment quality in Kingston
Harbour (Jamaica).
Sampling took place at the end of January 2009, corresponding to the dry season.
Summary of monitoring results
pH values and temperatures obtained during this monitoring were typical of marine ecosystems (Riley and Chester, 1978). pH values were within EPA limits considered to be acceptable for the protection of marine life (USEPA, 1986). Values for transparency, temperature and pH were similar to the historical values reported for this ecosystem (Smith Warner International, 2004).
Results obtained during this sampling reflected good oxygenation of the bay waters. All values of the dissolved oxygen obtained during the study were over 5 mg L-1, values recommended as the minimum limit for good quality coastal waters. Values reported in this study are higher than the historical values for dissolved oxygen in Kingston Bay (Smith Warner International, 2004).
COD values in the entire bay were similar and significantly higher at Station 10 (Hunts Bay), as expected, due to the impact generated in that zone by the Cobre River and the poor circulation of its waters.
As for the nutrients we must point out that the values of the nitrogen compounds obtained can be considered to be low if they are compared to other bays in the Caribbean having a similar degree of historical environmental deterioration (Beltrán y col, 2008). Four stations surpass the limit considered by EPA to be acceptable for ammonia nitrogen (N-NH3): Stations 2, 3, 7 and 11 (USEPA, 1986).
Nevertheless, the average level in the bay (1.07 µmol L-1) is higher than the average historical value: 0. 71 µmol L-1 (Smith Warner International, 2004). This result reflects that contributions of nitrogen compounds in the bay have been maintained and/or increased (figure 37).
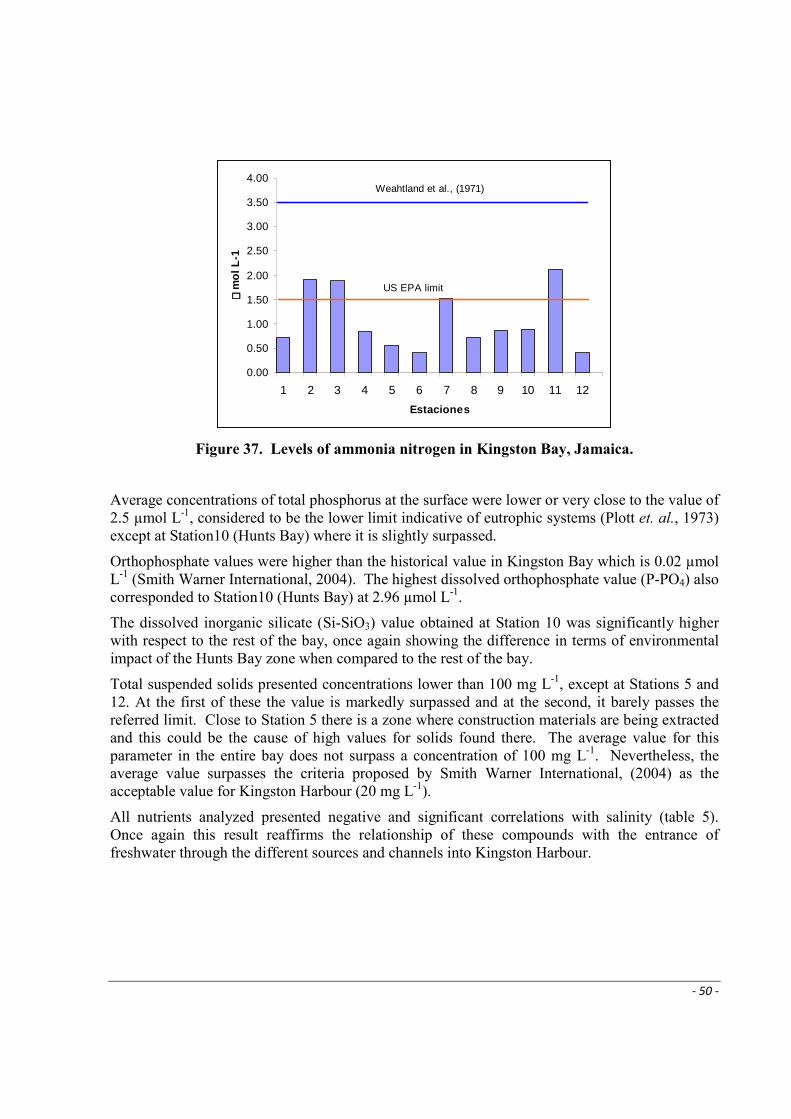
- 50 -
0.00
0.50
1.00
1.50
2.00
2.50
3.00
3.50
4.00
1 2 3 4 5 6 7 8 9 10 11 12
Estaciones
≅≅ ≅≅ m
ol L
-1
US EPA limit
Weahtland et al., (1971)
Figure 37. Levels of ammonia nitrogen in Kingston Bay, Jamaica.
Average concentrations of total phosphorus at the surface were lower or very close to the value of 2.5 µmol L-1, considered to be the lower limit indicative of eutrophic systems (Plott et. al., 1973) except at Station10 (Hunts Bay) where it is slightly surpassed.
Orthophosphate values were higher than the historical value in Kingston Bay which is 0.02 µmol L-1 (Smith Warner International, 2004). The highest dissolved orthophosphate value (P-PO4) also corresponded to Station10 (Hunts Bay) at 2.96 µmol L-1.
The dissolved inorganic silicate (Si-SiO3) value obtained at Station 10 was significantly higher with respect to the rest of the bay, once again showing the difference in terms of environmental impact of the Hunts Bay zone when compared to the rest of the bay.
Total suspended solids presented concentrations lower than 100 mg L-1, except at Stations 5 and 12. At the first of these the value is markedly surpassed and at the second, it barely passes the referred limit. Close to Station 5 there is a zone where construction materials are being extracted and this could be the cause of high values for solids found there. The average value for this parameter in the entire bay does not surpass a concentration of 100 mg L-1. Nevertheless, the average value surpasses the criteria proposed by Smith Warner International, (2004) as the acceptable value for Kingston Harbour (20 mg L-1).
All nutrients analyzed presented negative and significant correlations with salinity (table 5). Once again this result reaffirms the relationship of these compounds with the entrance of freshwater through the different sources and channels into Kingston Harbour.

- 51 -
Table 5. Correlations matrix between the hydro-chemical indicators (significant
correlations are in red)
pH
Temp
Sal DO NO2 N-NO3 N-NH4 PT P-PO4 Si-SiO3 TSS
pH 1.00
Temp -0.46 1.00
Sal -0.13 0.58 1.00
DO -0.40 0.08 -0.11 1.00
N-NO2 0.34 -0.55 -0.84 0.17 1.00
N-NO3 0.26 -0.70 -0.92 0.10 0.83 1.00
N-NH4 -0.02 0.05 0.06 -0.40 -0.26 -0.22 1.00
PT 0.43 -0.61 -0.77 0.11 0.90 0.80 -0.38 1.00
P-PO4 0.38 -0.55 -0.86 0.25 0.95 0.84 -0.33 0.93 1.00
SiSiO3 0.21 -0.59 -0.92 0.30 0.95 0.92 -0.27 0.88 0.94 1.00
TSS -0.05 0.42 0.53 0.18 -0.08 -0.40 -0.49 -0.13 -0.14 -0.23 1.00
Figure 38 shows the concentrations of dissolved and dispersed oil hydrocarbons (HPDD) found in the surface waters of the study zone. These concentrations are expressed as equivalents of pure chrysene (CARIPOL, 1980).
HPDD
12 3
4
5
6
7
8
910 11
12
0
2
4
6
8
10
12
14
ESTACIONES
ug L -1
Figure 38. Values for HPDD concentration in the stations studied.
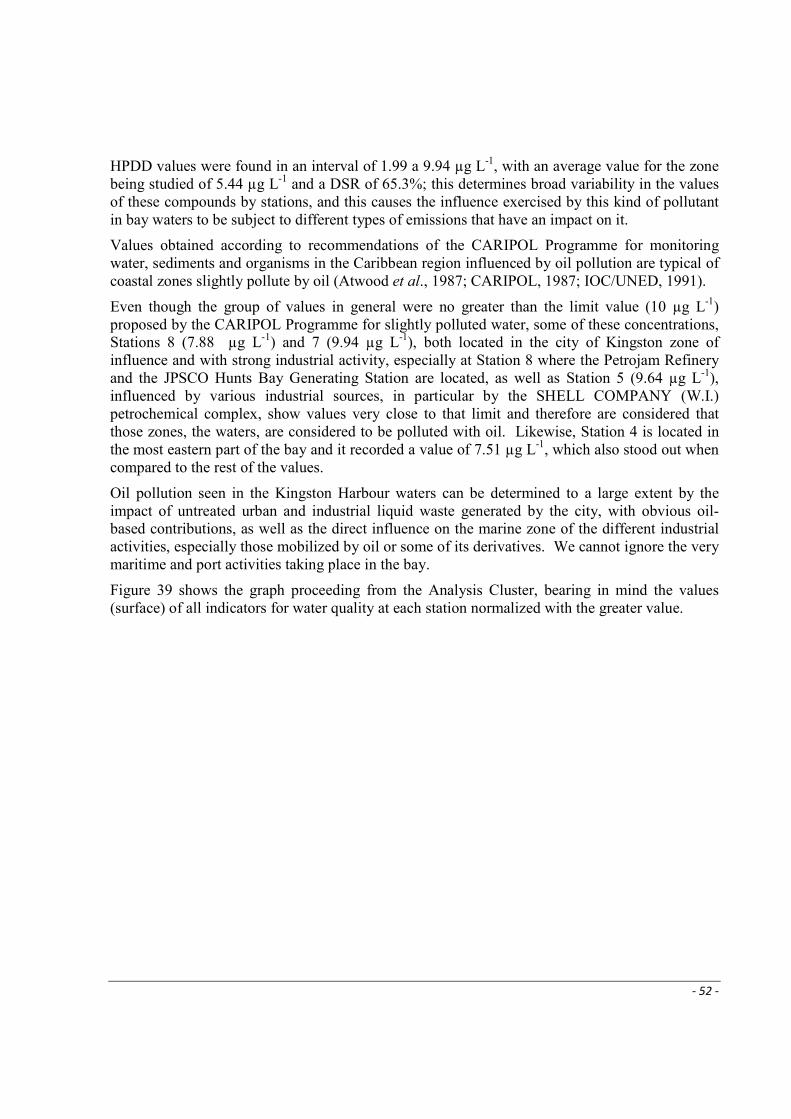
- 52 -
HPDD values were found in an interval of 1.99 a 9.94 µg L-1, with an average value for the zone being studied of 5.44 µg L-1 and a DSR of 65.3%; this determines broad variability in the values of these compounds by stations, and this causes the influence exercised by this kind of pollutant in bay waters to be subject to different types of emissions that have an impact on it.
Values obtained according to recommendations of the CARIPOL Programme for monitoring water, sediments and organisms in the Caribbean region influenced by oil pollution are typical of coastal zones slightly pollute by oil (Atwood et al., 1987; CARIPOL, 1987; IOC/UNED, 1991).
Even though the group of values in general were no greater than the limit value (10 µg L-1) proposed by the CARIPOL Programme for slightly polluted water, some of these concentrations, Stations 8 (7.88 µg L-1) and 7 (9.94 µg L-1), both located in the city of Kingston zone of influence and with strong industrial activity, especially at Station 8 where the Petrojam Refinery and the JPSCO Hunts Bay Generating Station are located, as well as Station 5 (9.64 µg L-1), influenced by various industrial sources, in particular by the SHELL COMPANY (W.I.) petrochemical complex, show values very close to that limit and therefore are considered that those zones, the waters, are considered to be polluted with oil. Likewise, Station 4 is located in the most eastern part of the bay and it recorded a value of 7.51 µg L-1, which also stood out when compared to the rest of the values.
Oil pollution seen in the Kingston Harbour waters can be determined to a large extent by the impact of untreated urban and industrial liquid waste generated by the city, with obvious oil-based contributions, as well as the direct influence on the marine zone of the different industrial activities, especially those mobilized by oil or some of its derivatives. We cannot ignore the very maritime and port activities taking place in the bay.
Figure 39 shows the graph proceeding from the Analysis Cluster, bearing in mind the values (surface) of all indicators for water quality at each station normalized with the greater value.

- 53 -
10 5 9 8 6 12 4 7 3 11 20.0
0.2
0.4
0.6
0.8
1.0
1.2
1.4
1.6
Dis
tanc
ia d
e E
nlac
e
Figure 39. Analysis Cluster with surface average values per station of all the hydro-
chemical indicators in Kingston Harbour.
The Analysis Cluster shows that Station 10 (Hunts Bay) is notably different from the rest of the stations. In this station the greatest concentrations of nutrients and the greatest COD (permanganate oxidability) was obtained. In this zone of the bay there is little depth and it presents poor circulation of its waters. Contributions from the Cobre River can be influencing the water quality of this zone of the bay. According to the results of this study this zone is one of the most environmentally affected in Kingston Harbour.
Figure 40 presents the classification of surface sediments collected in the zone in the study according to Ballinger and McKee (1971). In most of the stations the corresponding sediments can be classified as Type III sediments, with a high nitrogen contribution. It can be seen that there is a sustained contribution of nitrogen.
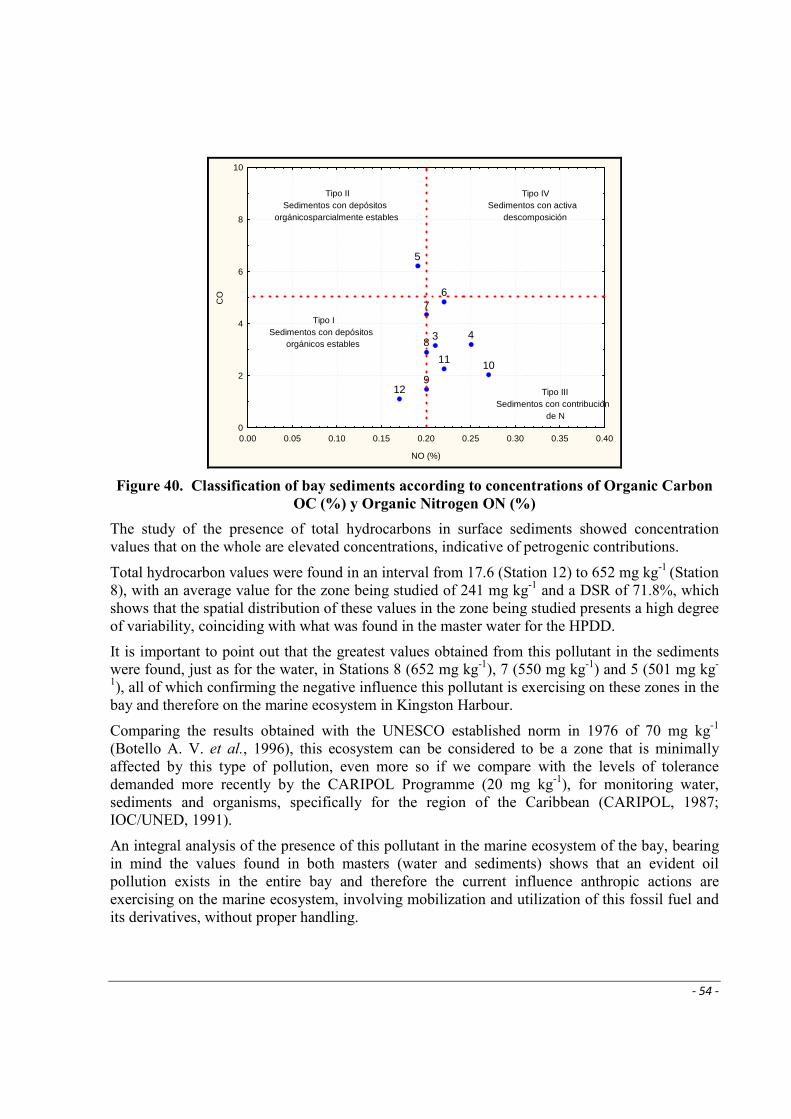
- 54 -
3 4
5
67
8
91011
12
0.00 0.05 0.10 0.15 0.20 0.25 0.30 0.35 0.40
NO (%)
0
2
4
6
8
10
CO
Tipo IISedimentos con depósitos
orgánicosparcialmente estables
Tipo ISedimentos con depósitos
orgánicos estables
Tipo IVSedimentos con activa
descomposición
Tipo IIISedimentos con contribución
de N
Figure 40. Classification of bay sediments according to concentrations of Organic Carbon
OC (%) y Organic Nitrogen ON (%)
The study of the presence of total hydrocarbons in surface sediments showed concentration values that on the whole are elevated concentrations, indicative of petrogenic contributions.
Total hydrocarbon values were found in an interval from 17.6 (Station 12) to 652 mg kg-1 (Station 8), with an average value for the zone being studied of 241 mg kg-1 and a DSR of 71.8%, which shows that the spatial distribution of these values in the zone being studied presents a high degree of variability, coinciding with what was found in the master water for the HPDD.
It is important to point out that the greatest values obtained from this pollutant in the sediments were found, just as for the water, in Stations 8 (652 mg kg-1), 7 (550 mg kg-1) and 5 (501 mg kg-
1), all of which confirming the negative influence this pollutant is exercising on these zones in the bay and therefore on the marine ecosystem in Kingston Harbour.
Comparing the results obtained with the UNESCO established norm in 1976 of 70 mg kg-1
(Botello A. V. et al., 1996), this ecosystem can be considered to be a zone that is minimally affected by this type of pollution, even more so if we compare with the levels of tolerance demanded more recently by the CARIPOL Programme (20 mg kg-1), for monitoring water, sediments and organisms, specifically for the region of the Caribbean (CARIPOL, 1987; IOC/UNED, 1991).
An integral analysis of the presence of this pollutant in the marine ecosystem of the bay, bearing in mind the values found in both masters (water and sediments) shows that an evident oil pollution exists in the entire bay and therefore the current influence anthropic actions are exercising on the marine ecosystem, involving mobilization and utilization of this fossil fuel and its derivatives, without proper handling.
- 55 -
Figure 41 shows the values of the Clostridium perfringens concentrations on surface sediments.
1
10
100
1,000
10,000
Co
nce
ntr
aci
ón
(N
MP
/g
)
Esta
ción
3
Esta
ción
4
Esta
ción
5
Esta
ción
6
Esta
ción
7
Esta
ción
8
Esta
ción
9
Esta
ción
10
Esta
ción
11
Esta
ción
12
Figure 41. Values of Clostridium perfringens concentration at the different stations sampled
in Kingston Bay
The most elevated concentration of this indicator belongs to Stations 3, 6, 7, 9 and 10. Stations 6, 7, 8 and 9 are located close to the city of Kingston in the industrial zone which includes oil refinery, power generating station and factories. Especially at Station 7 polluted rainfall drainage from the city enters intermittently, causing these high concentrations of C. perfringens in the sediment, also appearing during the rainy season.
Station 10 (Hunts Bay) showed the greatest values of C. perfringens concentration in this sampling. This lobe practically does not communicate with the rest of the bay and it receives the influence of waters coming from the Cobre and Duhaney rivers which cross agricultural, industrial and residential areas; as well as other smaller streams that are part of the sewage system of the city (Wade 1976).
These results confirm the criteria that these are waste waters with black water influence, the most important contributing factor to bacteriological pollution in Kingston Harbour (Webber, 2003).
The results obtained in this sampling of water and sediment quality in Kingston Harbour correspond to the dry season in the region where the polluting contributions to the bay decrease considerably. In Kingston Bay values of nutrients and solids in suspension have been historically reported (Smith Warner International, 2004) that were greater than those obtained in this study. During the rainy season, the movement of waste of all kinds through the rivers, the drainage and the canals is considerable high and it causes a thick layer of solid waste to be formed on the surface of the bay’s waters.
In spite of the encouraging effect of some of the results obtained in this pilot study, they are not enough for us to consider that a notable improvement has been made in the quality of water and sediments in Kingston Harbour at other times of the year in order to establish a sustained criteria from a scientific point of view about the evolution of that ecosystem.

- 56 -
Evaluation about the quality of coastal water in the small islands of the Caribbean.
With the aim of learning about the quality of the marine-coastal waters in the small developing islands of the Caribbean (SIDS) the Caribbean Environmental Health Institute (CEHI) carried out a study divided into two parts: the first consisted of a search for information with the environmental officials on various islands, regarding:
• A short geographical and socio-economic description of the principal polluted coastal area on the small islands.
• The main pollution problems in coastal waters of the small islands.
• A brief analysis of the possible causes of pollution.
• A comparison (if possible) with the national or regional norms for marine coastal water.
A survey was designed requesting information about the above and it was sent via Fax and E-mail to the environmental authorities of the following countries:
• Anguila
• Antigua & Barbuda
• Bahamas
• Barbados
• British Vírgin Islands
• Dominica
• Grenada
• Guyana
• Jamaica
• Montserrat
• San Kitts & Nevis
• Santa Lucia
• Saint. Vincent & The Grenadines
• Trinidad & Tobago
• Turks and Caicos Islands
The greatest challenge experienced during this study was the collection of data, something that was incomplete since many countries did not answer or sent incomplete answers.
Despite the low level of participation by the countries in the study, data and information was obtained that allowed us to affirm the following:
1. The predominant sources of pollution in small Caribbean islands are commercial and industrial activity and urban development.
2. All commercial ports with their respective urban centres that surround them are considered to be high risk areas, along with leisure ports and industrial centres.
3. On many islands the development of tourism is a reason for concern. Poor functioning of sewage water treatment plants can be considered to be a critical source of pollution.
4. Agricultural activity is also a pollution source mentioned by small Caribbean islands in terms of contribution of sediments and chemical products used for such ends, although to a lesser degree as compared to other pollution sources.
- 57 -
5. In spite of the fact that most of the countries evaluate microbiological pollution, the contribution of matter in suspension and of nutrients from their respective high risk areas do not have a structured or an implemented system of regular monitoring.
6. Today it is the policy in most of the small Caribbean islands that data about the quality of marine coastal waters is state property and so its free distribution is restricted as is knowledge about the environmental state of said waters.
- 58 -
FINAL CONSIDERATIONS
The results of monitoring the quality of water and sediments in high risk areas evaluated during this project confirm that the causes of marine pollution are the same ones as in most of the coastal areas studied and are mainly associated with anthropic activities. Said causes are fundamentally the following:
• The contribution of water coming from coastal cities, settlements and towns
• The contribution of industrial waste
• The presence of floating solid waste coming from rivers, canals and rainfall drainage.
• Maritime-port related activities
Likewise, the main pollution problems of the region are ratified;
• High presence of rich compounds organic matter and in nutrients (fundamentally composed of phosphorus and nitrogen)
• Elevated concentrations of organic and inorganic toxic substances (oil hydrocarbons and heavy metals)
• Concentrations of micro-organisms coming from fecal matter above the national and international quality criteria that are even affecting recreational coastal areas and thus implicating them for those purposes
The results obtained in this monitoring do not differ significantly from those obtained from earlier regional projects; this confirms that the causes of pollution are being maintained in most of the coastal areas.
The total or partial absence of continuing monitoring programmes in many of the coastal areas which are environmentally implicated in the Wider Caribbean Region makes it impossible to establish tendencies or historical conduct and thus it is also not possible to evaluate the effectiveness of the cleanup systems in the cases where they do exist.
With this study we have proven that most of the countries in the Wider Caribbean region do not possess national environmental quality norms for coastal areas or in other cases they exist but are incomplete; this makes it difficult to establish comparison criteria.
There is still insufficient institutional capacity and human resources in some of the countries in the region to carry out monitoring programmes.
- 59 -
RECOMENDACIONES
Considering the situation of contamination of the coastal areas of Wider Caribbean. Conscious of the contamination coming from sources and terrestrial activities constitute the main cause and a serious threat for the marine and coastal resources and for the human health in the region.
Aware of the high ecological, economic, scientific, recreational and cultural value of the marine and coastal ecosystems of the Wider Caribbean Region and recognizing the inequality in the economic and social development of the countries of the WCR and the necessity of cooperating among all to achieve a sustainable development, recommends:
That the countries signatories of the Convention for the Protection and Development of the Marine Environmental of the Wider Caribbean, come as soon as possible to the RATIFICATION of the Protocol Concerning Pollution from Land-Based Sources and Activities, to entry in force, since it constitutes the bases document from the point of view juridical and technical scientist so that the countries of the region can achieve an effective collaboration in marine contamination coming from the land bases sources.
- 60 -
BIBLIOGRAPHY.
•••• Atwood, D.K., Burton, F.J., Corredor, J.E., Harvey, G.R., Mata-Jimenez, A.J., Vasquez-Botello, A. and Wade, B.A., (1987a). “Results of the CARIPOL petroleum pollution monitoring project in the wider Caribbean”. Marine Pollution Bulletin 18, 540-548.
•••• Atwood, D.K., Burton, F.J., Corredor, J.E., Harvey, G.R., Mata-Jiménez, A.J., Vázquez-Botello, A. and Wade, B.A., (1987b). “Petroleum pollution in the Caribbean”.Oceanus 30, 25-32.
•••• Atwood, D.K., Dinkel-McKay, S., Case-Romero, G. and van Vleet, E., (1987c). “Floating tar and dissolved / dispersed petroleum hydrocarbons in the Northern Gulf of Mexico and the Straits of Florida”. Caribbean Journal of Science 23, 73-76.
•••• Ballinger I. G. (1971). “Chemical characterization of bottom sediment”. JWPCF 43 (2) 216- 227.
•••• Beltrán J. y col. (2008). “Control y evolución de la calidad ambiental de la Bahía de La Habana”. Informe final. Vigilancia ambiental para la Bahía de La Habana. Cimab, 61p.
•••• Blanco J. A., J. C Narváez B. y E. A. Viloria. (2007). “Enso and the rise and fall of a tilapia fishery in northern Colombia”. Fisheries Research 88:100–108.
•••• Blanco, J.A., E.A. Viloria y J.C. Narváez. (2006). “ENSO and interannual salinity changes in the Ciénaga Grande de Santa Marta coastal lagoon system, Colombian Caribbean”. Est. Coast. Shelf. Sci., 66: 157-167.
•••• Bonilla J (1982). “Algunas características geoquímicas de los sedimentos superficiales del Golfo de Cariaco, Venezuela”. Bol. Inst. Oceanog. Vzla. Univ. Oriente. 18 (1&2):133-155
•••• Bonilla J (1993). “Características hidroquímicas: Comportamiento y significados de modelos estadísticos multivariantes en el bioecosistema marino Costero de Jose, Edo. Anzoátegui”. Trabajo de Ascenso a Profesor titular. Inst. Oceanog. Univ. Oriente. 231 pp.
•••• Botello, A. V.; J. L. Rojas, J.A. Benítez y D. Zárate (1996). “Contaminación e Impacto Ambiental: Diagnóstico y tendencias”. Caps. Contaminantes críticos: Plaguicidas; Hidrocarburos, Metales, Contaminación Microbiológica. EPOMEX Serie Científica 5. Golfo de México. Universidad. Autónoma de Campeche. 666p.
•••• Botero, L. y H. Salzwedel, (1999). “Rehabilitation of the Cienaga Grande de Santa Marta, a mangrove-estuarine system in the Caribbean coast of Colombia”. Ocean Coast. Manage., 42: 243-256.
•••• Cancio, E., J. C. Narváez y J. A. Blanco (2006). “Dinámica poblacional del coroncoro Micropogonias furnieri (Pisces: Sciaenidae) en la Ciénaga Grande de Santa Marta, Caribe colombiano”. Bol. Invest. Mar. Cost., 35: 37-58.
•••• Caraballo L (1982) “El Golfo de Cariaco. Parte I. Morfología y batometría submarina. Estructura y Tecnosismo reciente”. Bol. Inst. Oceanog. Vzla. Univ. Oriente.21 (1&2): 13-35
•••• CARIPOL (1980). “Manual of Petroleum Pollution Monitoring”. LAB (4301). Rickenbaker, Causing Miami, Fla. 33149. 14p.
•••• CARIPOL (1987). “Proceeding of Symposium on the Results of the CARIPOL Petroleum Monitoring Project”. Caribbean Journal of Science. Vol. 23 No1:1-14.
•••• Contreras et. al. (1995). “Hidrología, nutrientes y productividad primaria en las lagunas costeras del estado Oaxaca”, México.
- 61 -
•••• Dumailo S. (2003). “Evaluación de la problemática ambiental por medio del estudio de algunos aspectos de sedimentación y contaminación en la laguna de Bluefields, RAAS, Nicaragua. Tesis de Maestría.
•••• Friligos, N. (1989). “Distribution of Nutrient Salt in the Aegean Sea”. Thalassic Yugoslavian, 17(2): 131 - 134.
•••• GEF/PNUD. (1998). “Planificación y manejo ambiental de bahías y zonas costeras fuertemente contaminadas del Gran Caribe”. Proyecto Regional: Estudio de caso Bahía de La Habana, Cuba. Informe final. Resultado 1.2: Rehabilitación de los fondos contaminados. Cimab, 153p.
•••• Gónima, L., Mancera-Pineda, J. y Botero, L. (1998). “Aplicación de imágenes de satélite al diagnóstico ambiental de un complejo lagunar estuarino tropical: Ciénaga Grande de Santa Marta, Caribe Colombiano”. Santa Marta, INVEMAR. 56 p.
•••• Guerra-García J.M, González-Villa F.J. & García-Gómez J.C. (2003). “Aliphatic hydrocarbon pollution and macrobenthic assemblages in Ceuta harbour: a multivariate approach”. Marine Ecology Progress Series 263, 127-138.
•••• Guzmán R, Gómez, G, Penott M (1998) “Aspectos Biológicos y Pesquería de la sardina (sardinilla aurita) en el golfo de Cariaco, Venezuela”. Zootecnia Tropical. Vol. 16(2): 149-162
•••• IMA, Institute of Marine Affairs (1982). “Point Lisas environmental protection Project. Vol. IV Marine seawater quality” A joint project document prepared for Point Lisas Industrial Port Development Corporation (PLIPDECO), p 69.
•••• INVEMAR. (2007). “Monitoreo de las condiciones ambientales y los cambios estructurales y funcionales de las comunidades vegetales y de los recursos pesqueros durante la rehabilitación de la Ciénaga Grande de Santa Marta”. Informe Técnico Final. Santa Marta, 105 p.
•••• IOC/UNEP (1991). “Report of the Caribbean Environmental Program for the Assessment and Control of Marine Pollution”. CEP. Technical Report 8, Jamaica. 41p.
•••• Jørgensen, S. E. y Vollenweider, R. A. (1989). “Directrices para la Gestión del Lagos”. Vol.1: Principios Generales sobre Gestión de Lagos.
•••• Libes, S.M. (1992). “An Introduction to Marine Biogeochemistry”. John Wiley and Sons, Inc., New York, 734 p.
•••• Lozano, P. y P.C. Sierra-Correa (2005). “Propuesta metodológica para delimitación de bosques de manglar a partir de datos satelitales utilizando SPRING v 4.1, en la reserva de biosfera Ciénaga Grande de Santa Marta, Caribe Colombiano”. Anais XII Simpósio Brasileiro de Sensoriamento Remoto, Goiânia.
•••• Machain, M y Ruíz, A., (2007). “Indicadores biofísicos en sedimentos acuáticos”. Coyoacan, Mexico. D.F.
•••• Minagricultura. (1984). DECRETO No. 1594 DEL 26 DE JUNIO DE 1984. Ministerio de Agricultura, República de Colombia, Bogotá
•••• Morell, J. M. and Corredor, J. E., (2001). “Photomineralization of fluorescent dissolved organic matter in the Orinoco River plume: Estimation of ammonium release”. Journal of Geophysical Research, Vol. 106, No. C8, 16,807-16813.
•••• Norman, P.E. (1986). A Case Study of “Sewage Pollution at Chaguaramas, Trinidad”’. Environmental Quality Division. Institute of Marine Affairs.
- 62 -
•••• Núñez Ribón, Ismael. (1999). “El comportamiento conservativo del Fósforo en los Estuarios: Un acercamiento a través del mecanismo de amortiguamiento del fósforo”. México-Mazatlán.
•••• Okuda. T. (1982). “Rate of water renewal and phosphate input in the Gulf of Cariaco, Venezuela”. Bol. Inst. Oceanog. Venez. Univ. Oriente, 21 (1-2): 3-12
•••• ONNa. (1999). “Evaluación de los objetos hídricos de uso pesquero”. Norma Cubana (NC 25: 1999) Oficina Nacional de Normalización La Habana. 9p.
•••• ONNb. (1999). “Lugares de Baño en Costas y Masas de Aguas Interiores. Requisitos Higiénicos Sanitarios”. Norma Cubana (NC 22: 1999). Oficina Nacional de Normalización. La Habana. 9p.
•••• Plott, T.R.; J. Conover, R. Louks, K. Mann, D.L. Peer; A. Prekask y D.D. Saamoto (1973). “Study of eutrophication in a marine basin”. FAO Technical Conference on marine pollution and its effects on living resources and fishing. FAO/FIR/MP70/E-30. 8p.
•••• PNUD- PNUMA-UNESCO (1984): Investigación y control de la contaminación marina en la Bahía de La Habana. Proyecto CUB-80-001. Metodologías. Vol. 1. 295p.
•••• Quintero A, Terejova G, Vicent G, Padrón A, Bonilla J (2002). “Los pescadores del Golfo de Cariaco”. Interciencia.27 (6) 286-292
•••• Riley, J. A. and R. Chester (1978). “Chemical Oceanography”. Academy Press, 2nd Edition Vol. 7, London, 647p.
•••• Rivera-Monroy, V. H., R.R. Twilley, E. Mancera, A. Alcantara-Eguren, E. Castañeda-Moya, O. Casas, P. Reyes, J. Restrepo, L. Perdomo, E. Campos, G. Cotes y E. Vitoria. (2006). “Aventuras y desventuras en Macondo: rehabilitación de la Ciénaga Grande de Santa Marta”, Colombia. Ecotropicos., 19(2): 72-93.
•••• Simpson J, Griffith R (1967). “La distribución de densidad pesquera en el Golfo de Cariaco, Venezuela oriental.” Serie recursos y explotación pesqueros”. 1(8): 305-320.
•••• Smith Warner International (2004). “Institutional Strengthening and Preparation of a Zoning and Physical Development Master Plan for Kingston Harbors”. Literature Review Report. Project No. ATN/SF-8164-JA.
•••• USEPA, (1986). “Quality Criteria for Water”, EPA Report 440/5-86-001, Washington, D.C. •••• USEPA, (1995). “Quality Criteria for Water”. Prepared by Health and Ecological Criteria
Division, Office of Water U.S. Environmental Protection Agency Washington, D.C. •••• Wade, B. A. (1976). “The Pollution Ecology of the Kingston Harbors, Jamaica”. Scientific
Report of the U.W.I. - O.D.M. Kingston Harbors Research Project 1972 - 1975, Vols. 1, 2 & 3.
•••• Webber, D.F. and P.Wilson-Kelly (2003). “Characterization of Sources of Organic Pollution to Kingston Harbors, the Extent of Their Influence and Some Rehabilitation”. Bul. Mar. Sci., Vol. 73, No. 2: 257 – 271.


![Global Earthquake Model (GEM) activities in the Caribbean and the wider region; Garcia [dec 2012]](https://img.pdfslide.us/doc/110x75/54c14d324a7959267c8b4589/global-earthquake-model-gem-activities-in-the-caribbean-and-the-wider-region-garcia-dec-2012.jpg)