Embed Size (px)
Citation preview

Logo
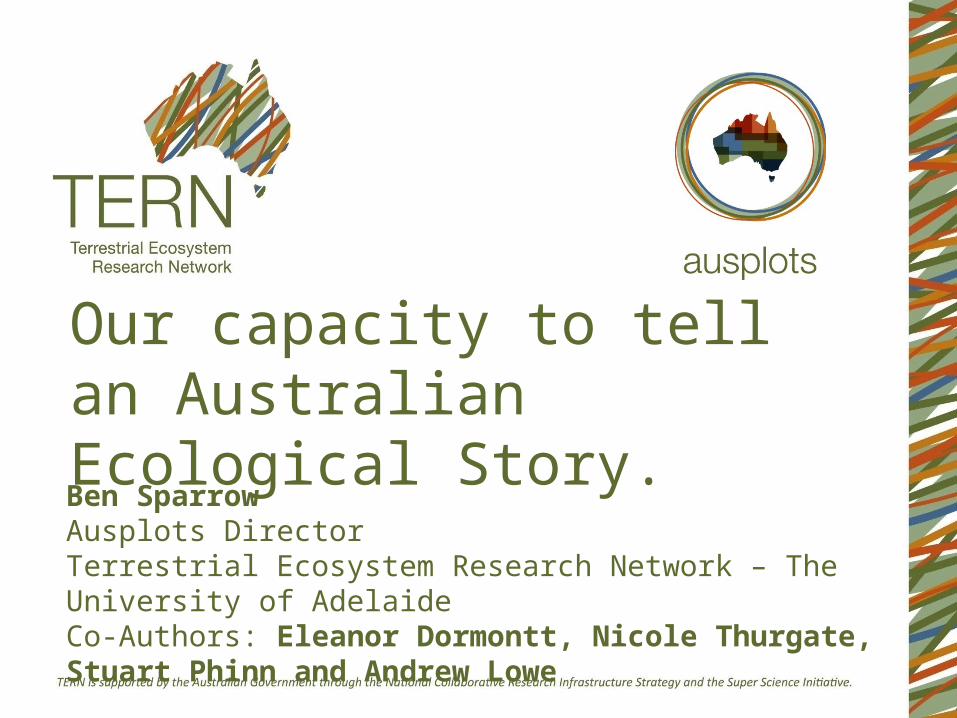
Our capacity to tell an Australian Ecological Story.Ben SparrowAusplots DirectorTerrestrial Ecosystem Research Network – The University of AdelaideCo-Authors: Eleanor Dormontt, Nicole Thurgate, Stuart Phinn and Andrew Lowe
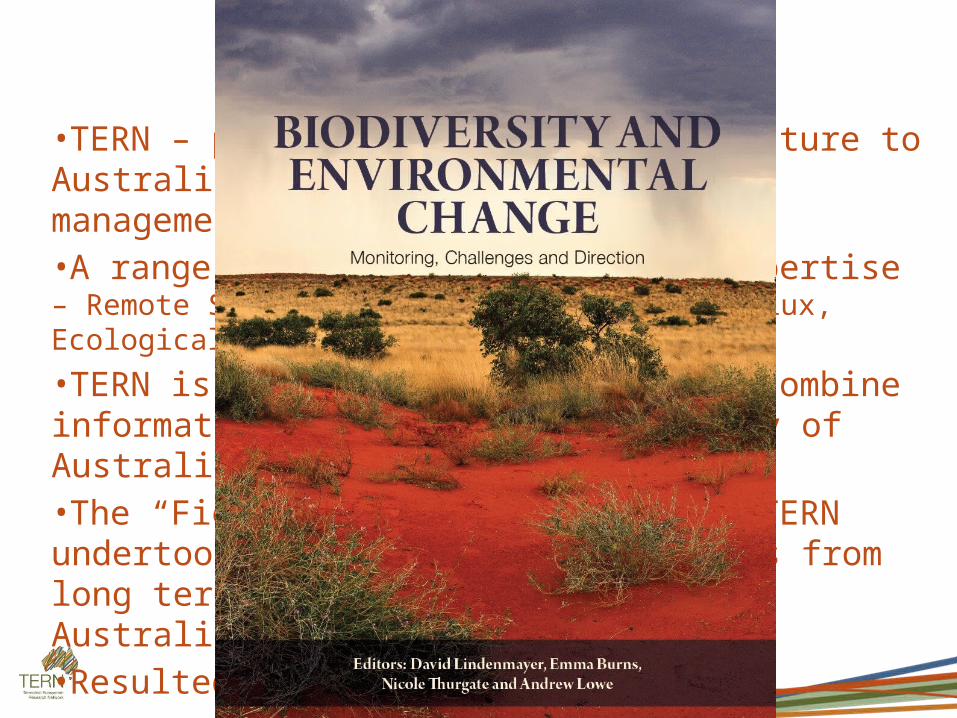
•TERN – provides research infrastructure to Australia’s ecosystem science and management community•A range of facilities combining expertise– Remote Sensing, Soils, Biogeochemical flux, Ecological plots
•TERN is developing a framework to combine information to inform on the ecology of Australian environments•The “Field Ecology” components of TERN undertook to synthesise key findings from long term ecological research for Australia ( > 10 years of sampling)•Resulted in a book:
Context

Chapters investigate what is know about particular ecosystems based on long term ecological research
Chapter 3 looks at which ecosystems we have reasonable sampling density, and which communities are under-represented (i.e. gaps)
Logo
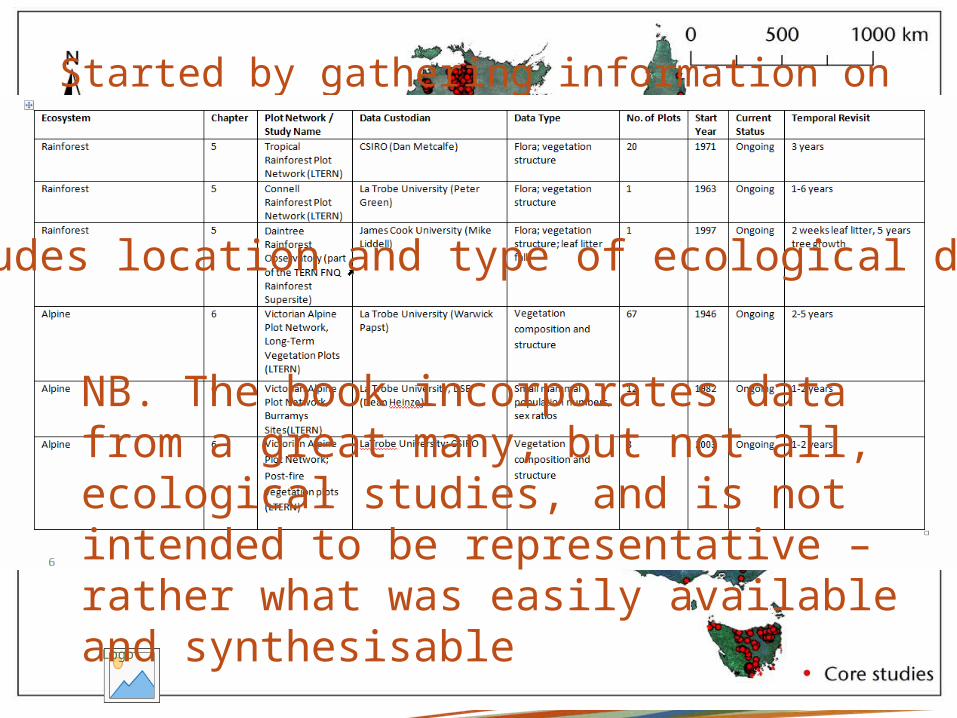
Started by gathering information on long term studies covered in book
Logo
NB. The book incorporates data from a great many, but not all, ecological studies, and is not intended to be representative – rather what was easily available and synthesisable
Includes location and type of ecological data

Coverage of ecological data assessed against
• Climate – Hutchinson’s Agroclimatic Zones
• Vegetation – NVIS Major Vegetation Groups
• Biomes
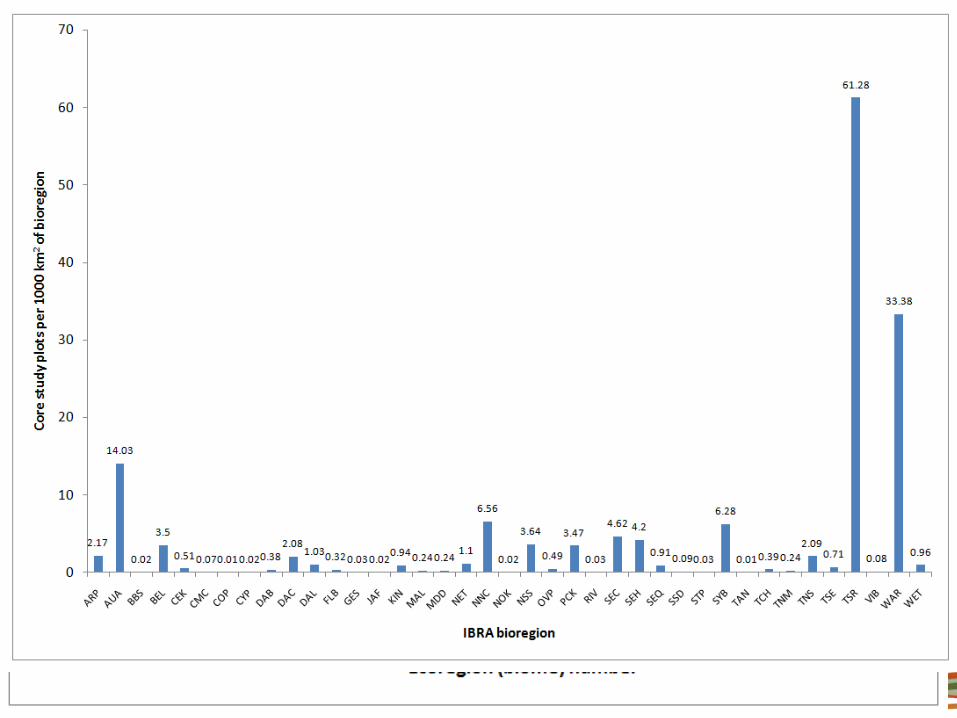
• The Interim Biogeographic Regionalisation of Australia
• Natural Resource Management Regions
Logo

LogoHutchinson’s Agro-climatic Zones
Alpine
Temperate
Mediteranean
Tropical
Semi- Arid – Summer rain
Semi-AridWinter Rain
Arid

MVG
Logo
Hummock grasslands Acacia Systems
Chenopods

Animate Ecoregions/NRM/Ibra
Logo
NRM Regions
The Interim Biogeographic Regionalisation of Australia
GIS analysis
Assessed all ecological sites against these ecosystem classification layers and summarised results in terms of depth of coverage
Logo

Results - Climate
Hut
Logo
Red – Poorly SampledYellow – SampledGreen – Well Sampled

Logo
Red – Poorly SampledYellow – SampledGreen – Well Sampled
Logo
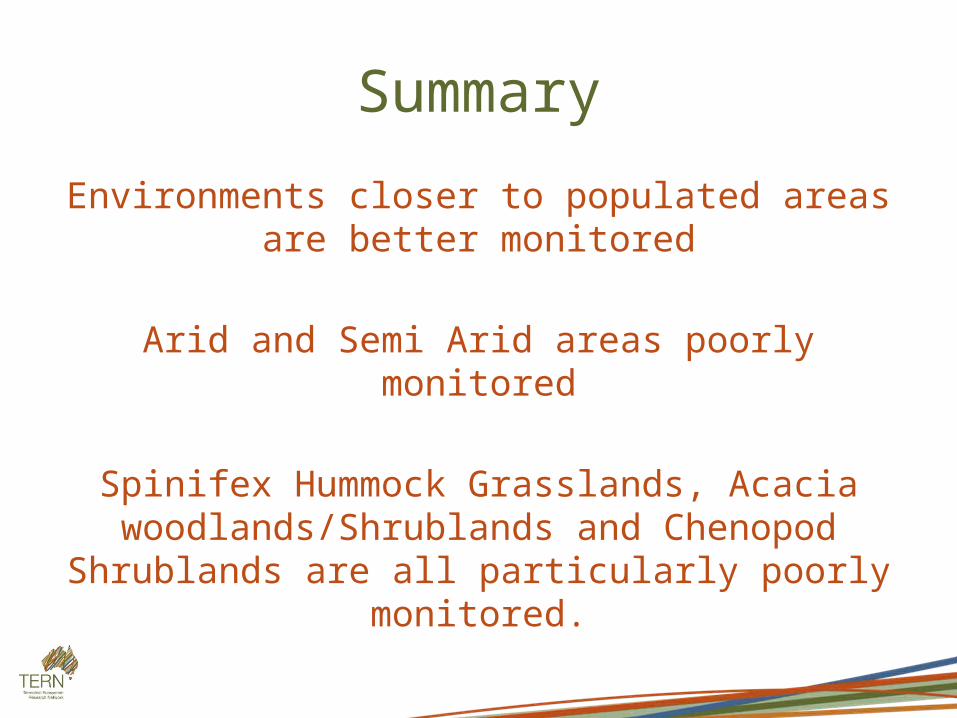
Summary
Environments closer to populated areas are better monitored
Arid and Semi Arid areas poorly monitored
Spinifex Hummock Grasslands, Acacia woodlands/Shrublands and Chenopod Shrublands are
all particularly poorly monitored.
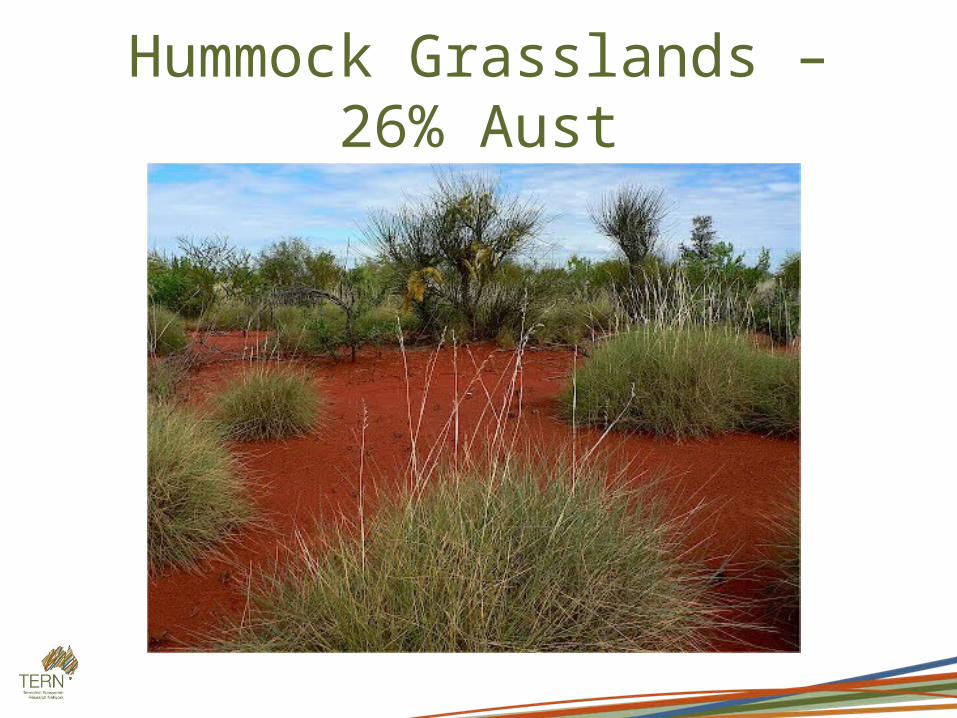
Hummock Grasslands – 26% Aust

Acacia Systems ~18% Aust

Chenopods - ~9% Aust

-More info in the book

- More info in the book -New TERN infrastructure helping to fill these gaps over time.-Ausplots sampling in Rangelands – 500 plots

- More info in the book -New TERN infrastructure helping to fill these gaps over time.-Ausplots sampling in Rangelands – 500 plots-Standardised nationally consistent method

- More info in the book -New TERN infrastructure helping to fill these gaps over time.-Ausplots sampling in Rangelands – 500 plots-Standardised nationally consistent method-Electronic data collection
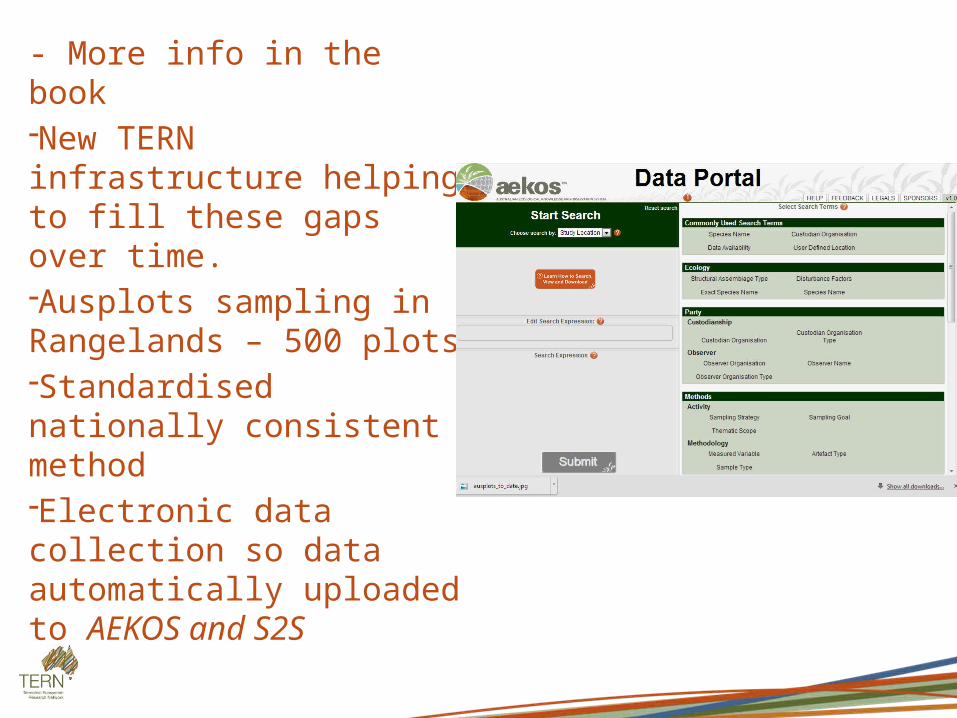
- More info in the book -New TERN infrastructure helping to fill these gaps over time.-Ausplots sampling in Rangelands – 500 plots-Standardised nationally consistent method-Electronic data collection so data automatically uploaded to AEKOS and S2S

- More info in the book -New TERN infrastructure helping to fill these gaps over time.-Ausplots sampling in Rangelands – 500 plots-Standardised nationally consistent method-Electronic data collection so data automatically uploaded to AEKOS-Development of new methods
- www.tern.org.au

Logo