Embed Size (px)
Citation preview

Monitoring of Inorganic Ions in Ambient Air
Mr. S. D. Joshi Scientist
Air Pollution Control Division, NEERI, Nagpur - 440020
Introduction
The air besides containing gaseous pollutants like S02, NOx, CO, HC also
contains particulate matter which is made up of complex organic compounds,
inorganic elements and their oxides and secondary particulates viz, sulphate,
nitrate etc. These secondary particulates are formed from their precursors in
presence of sunlight humidity and metal ion species by oxidation or reduction
processes. The acid precursors viz. sulfate and nitrate, and chloride require
more concern as these have deleterious effects on aquatic and forest eco-
systems and are potentially harmful for a variety of building materials, accelerate
corrosion of metals, damage sculptures and cause chronic respiratory problems
in human beings. In view of possible large social, economic, ecological and
aesthetic value, it has become important to analyse these pollutants in the
ambient air.
These particulates are emitted in the atmosphere by different
anthropogenic and natural sources. Sulphate (SO4-) is formed in the
atmosphere by reduction or oxidation in presence of hydroxy! ion (OH"). The
main sources of sulfur oxides are power houses, sulphuric acid, petroleum
industries, oil refineries, coal burning and domestic use of fuels. Acid
manufacturing, automobile exhaust, explosive industry, fuel burning etc. are the
main sources of nitrogen oxides. Chloride occurs predominantly in coastal cities.
Other sources of chloride are coal burning, waste incineration, automobile
exhaust, burning of chlorinated hydrocarbons. Fluoride is emitted in the
atmosphere by fertiliser industry, aluminium industry, steel making and acid
making industries.

Analytical Techniques
Different methods are available for the analysis of anions. The
conventional methods, viz., titrimetric, colorimetric, spectrophotometric,
gravimetric and ion selective electrode methods though commonly used, are
ion specific, time consuming and less sensitive. Ion Chromatography (IC) is the
only instrumental technique which can be used for rapid, sequential analysis of
different anions simultaneously.
Ion Chromatography
Chromatography encompasses wide range of techniques of separation of
the components of a mixture as a result of differential migration of the component
molecules between stationary phase and mobile phase. It was Hamish, Small of
DOW chemical corporation whose pioneering work in mid seventies in the
analysis of multiple -ion mixture developed into, 'Ion Chromatography" Ion
chromatograph provides a single instrumental technique for rapid sequential
analysis of different anions present in a sample. Ion chromatograph eliminates
the need to use hazardous reagents and it effectively distinguishes among the
halides (Cr,F~) and the oxides (NO3", SO4"). For ambient air monitoring, IC is
the most suitable technique though it is expensive. The anions SO4", NO3", CI",
F" are being monitored in ambient air using IC 2000i/SP and DX-100 models
under NAQM project, NEERI.
Several approaches have been initiated to solve the problem of separation
and detection of ions either independently or in integrated fashion. Three major
approaches are:
i) suppressed ion chromatography
ii) non-suppressed ion chromatography and
iii) indirect detection ion chromatography

Suppressed Ion chromatography
In the group of separation techniques employing ionic interactions ion
exchange is the oldest one. The separation is carried out with the packing that
possess charge bearing functional groups. The most common retention
mechanism is simple ion exchange of sample ions X and mobile phase ion Y
with the charged groups R of the stationary phase.
X" + R+Y_ Y" + R+X" anion exchange
X+ + R"Y+ Y+ + R"X+ cation exchange
For anion exchange separation the sample ions X" are in competition with
the mobile phase ions Y" for the ionic sites R+ of the ion exchanger. Sample ions
that interact weakly with the ion exchanger, in the presence of competing mobile
phase ion will be retained on the column for a shorter duration whereas sample
ion interacting strongly to with the ion exchanger will be retained for larger.
Conductivity being universal property of ionic species in solution, showing
simple dependence on the concentration of ions, has been considered to solved
detection problem since long. However, in ion exchange separation conductivity
response is masked by the mobile phase electrolyte. This problem was tackled
by employing a novel combination of ion exchange columns to remove the
background electrolyte leaving only the ionic solute of interest as conducting
species in the column effluent.
The second column called the stripper or the suppresser complicates the
use of ion chromatography. The stripper column needs periodic regeneration
and furthermore ion exclusion effects and some band broadening in the
suppresser column deteriorates the analysis.
To optimise the regeneration and chromatographic efficiency of
conventional suppressor column, the relative volumes and specific ion exchange
capacities of separator and stripper columns are adjusted. For good
chromatographic efficiency volume ratio of stripper and separator column is kept
iii

low unity being desirable but values upto 10 acceptable. Regeneration
requirements are minimised by using low capacity pellicular particles or surface
modified resins in separating columns, low ionic strength mobile phase, small
sample size and conventional high capacity porous ion exchange resin in the
stripper. Typical low capacity separator column can be used alongwith
conventional high capacity suppresser column for 8 to 10 hours without requiring
regeneration. Automatic - regeneration feature in commercial instruments
further simplify the analysis. However suppresor should not react with the
sample ions in a way that would remove them from the eluant or reduce their
conductivities or retain them permanently undergoing irreversible changes.
Non Suppressed Ion Chromatography
The ion chromatographic systems with suppresser columns are generally
dedicated and relatively costly. Analysis by non-suppressed systems depends
on existence of a significant measurable difference between sample ions and the
prevailing eiuent ions. For improving sensitivity low capacity exchanges and
proper displacing ions are required. Low capacity exchanger match the low ionic
strength eiuent employed, which enable detection of small amounts of samples
and proper displacing ions can display a useful difference in equivalent
conductance in comparison with common inorganic ions. Low capacity micro
porous anion exchange resin also have been developed for the separation of
inorganic anions. The resins used macro reticular cross-linked polystyrene
beads as substrate. The conductivity detector used for this method requires a
large electronic offset range for nulling the background conductivity of the eiuent
and small cell currents to minimise heat dissipation in the cell and resulting
baseline drift and noise. This detector given best results when used with low
background conductivity of the eiuent and fine temperature stability.
Indirect Detection Ion Chromatography
Many inorganic ions display strong absorbance in UV region but at
wavelengths that were previously inaccessible to liquid chromatography
photometers. With the development of UV detectors that reach down to 190 nm.
These ions are easily amenable to sensitive monitoring and determination. Direct
iv

UV absorbance has been coupled with several separation modes for variety of
samples. However, the major drawback of these methods is the low sensitivity
even after employing high purity solutes to minimise background absorbance.
Recently the method of indirect detection is gaining applications.
Generally in ion exchange or ion pair separation ultraviolet detector is used in
conjunction with mobile phases with very low absorbance at the monitoring
wavelength.
The sample contains the chromospheres and when they elute and pass
through the detector, absorption of light takes place and positive peak is
recorded.
Generally low capacity ion exchange columns are employed as separators
and an aqueous solutions of potassium hydrogen phthalate (10~4 to 10"3M) as
mobile phase. This salt gives suitable absorption at the wavelength 265 mm.
The choice of the mobile phase and its strength is decided by the anions of
interest and analysis time.
A large number of organic and and inorganic ions have been studied by
this technique. Analogous schemes for cation analysis have also been reported.
Simultaneous analysis of anions and cations in a single chromatogram also can
be done by this system.
Refractive index detector also has been used in this indirect mode. Both
UV & Rl methods are more sensitive than conductivity detection and they give
less baseline noise.
Interference : Any substance that has retention time coinciding with that
of any anion to be determined will interference. For example relatively high
concentrations of low molecular weight organic acids interfere with the
determination of chloride and fluoride. Sample dilution over comes many
interferences. Spurious peaks may result from contaminants in reagent water,
glassware or sample processing apparatus.
Minimum Detectable Limit
The minimum detectable concentration of an anion is a function of sample
size and conductivity scale used. Generally, minimum detectable concentrations
are near 0.1 mg/l for Br, CI", NO3-, N02", P0 43 " and S0 4
2 " with a 25 pi loop
and a 10 pS/cm full scale setting on the conductivity detector.
Air Monitoring/Sampling Collection
For ambient air anion sampling and analytical technique being used for
these pollutants require a large volume of air to be sampled in order to reach
needed detections limits. This has been accomplished utilising the high volume
(1400 Ipm) air sampler for the collection of total suspended particulate matter.
While for respirable suspended particulate matter, respirable dust sampler
is used. This sampler can be adapted with an optional PM-10 aerodynamic
aerosol inlet cut-point design which is insensitive to small variations in sampling
flow rate.
Preparation of Sample Filter
The filter papers are dried in desiccators for hours before, use. To ensure
acceptable filters, they are extracted with water and extracts are analysed by ion
chromatography. A filter blank of less than 0.1 pg per filter is considered
acceptable for field use.
Calibration of Sampling System
Each sampler is to be calibrated i) when new ii) after major repairs or
maintenance iii) whenever any audit point deviates from the calibration curve by
more than 7% iv) when a different sample collection media, other than that which
the sampler was originally calibrate to will be used for sampling, v) before and
after each test series.
vi

Construct a best fit curve for the points generated and use this relationship
for future work employing the flow sensor device.
Sample Retrieval
At the end of the desired sampling period the power is turned off.
Carefully remove the sampling head containing the filter. Remove filter from the
upper chamber using clean, teflon tipped forceps. Fold the filter in half twice
(Sampled side inward) and place it in an labeled envelope. These filters should
stored in dessicator containing dry silica gel. If the time span between sample
collection and laboratory analysis is to exceed 24 hour samples must be kept
refrigerated at 4°C. At least on field filter should be returned to the laboratory
with each group of samples. A field blank is treated exactly as a sample except
that no air is drawn throughout the filter.
Analysis
Reagents : Deionised or distilled water free from interferences at the
minimum detection limit of each constituent.
Eluant Solution : Eluant solution is a mixture of 1.7 mm sodium
bicarbonate and 1.8 mm Sodium Carbonate.
Regenerant Solution
Regenerant solution is all glass double distilled water for continous
regeneration.
Standard Anion Solution
Prepare a series of standard anion solutions by weighing the inducted
amount of salt, dried to a constant weight at 105°C to 1000 ml. Store in plastic
bottles in a refrigerator. These solutions are stable for at least one month. Verify
stability.
vii

Combine Working Standard Solution
Prepare a combined working standard solution by mixing appropriate
quantity of stock solution and store in plastic bottle protected from light. Prepare
fresh daily.
Ultrasonic Extraction Method
The extraction of anions is carried out by ultrasonic compact cleaner
model SW 45 (Toshniwal). The tank volume of extractor is 4.5 lits. It has a
sonifer cell disrupter .40 KHz power ultrasonic generator capable of dialing
150/130 w accurately with 127 cm horn distrupter sonabox.
From the exposed filter paper 18 circles of 1.5 cm diameter each were
taken by punching with steel punch (area 31.8 cm2) in a clean 100 ml beaker. To
these circles 20 ml deionised water was added and extracted for 5 min in
ultrasonicator. The extract was vacuum filtered with the help of G4 sintered glass
crucible in a clean plastic bottle. Again 20 ml water was added and extraction
was done for 10 min. The filtrate was collected in same bottle. The extraction
procedure was repeated third time for 15 minutes. The extracted samples were
stored in fridge till analysis.
Calibration Curve
Prepare standards of different concentration by mixing known volume of
different ions. Inject standards containing single anion or a mixture and
determine approximate retention time. Inject atleast three different concentrations
for each anion to be measured and construct a calibration curve by plotting peak
height or area against concentration on linear graph paper. Recalibrate
whenever detector setting is changed. Record the peak height or area and
retention time for calculation of the calibration factor CF.
Calibration Factor CF = Total area of peak
Mass injected (in microgram)

if the percent relative standard deviation (% RSD) of the calibration factor is less
than 20% over the working range, linearity through the origin can be assumed,
and average calibration factor can be used in place of a calibration curve.
The working calibration curve or calibration factor must be verified on each
working day by the injection of one or more calibration standards. If the response
factor for any analyte varies from the predicted response by more than + 20% a
new calibration curve must be prepared for that analyte. Calculate the percent
variance by the following equation-
Percent variance = [(R2 -Ri)/R<|] X 100
Before analysis can be performed the retention time windows must be
established for each analyte. Make three injections of the standard containing all
compounds for retention time window determination. The retention time window
is defined as the plus or minus three times the standard deviation of the absolute
retention times for each standard.
System Equillibration
Turn on ion chromatograph and adjust eluant flow rate. Adjust detector to
desired setting and let system come to equilibrium (20 to 30 min). A stable
baseline indicates equilibrium conditions. Adjust detector offset to zero out eluant
conductivity; with fibre or membrane suppressor adjust the regeneration flow rate
to maintain stability usually 2 to 3 mL/min.
Ion Chromatography with Conductivity Detector
Under the calibration procedures (external)the % RSD of the calibration
factor should be <20% over the linear working range of a five point calibration
curve.
Under the calibration procedures (external) daily working calibration curve
for each analyte should not vary from the predicted response by more than +
20%.
ix

For each analyte the retention time window must be established, verified
on a daily basis and established for each analyte throughout the course of a 72
hour period.
For each analyte the mid level standard must fall within the retention time
window on a daily basis as a qualitative performance evaluation of the IC system.
The surrogate standard recovery must not deviate by more than 20%.
Calibration
The stock standard solutions were prepared by adding exactly weighed
known amount of compound to a one litre volumetric flask and voiume was made
up by deionised water. A series of different concentrations of standards were
prepared by diluting stock standard solution.
Retention Time
The retention time is the time required for complete elution of a component
from the point of injection of sample. The retention time windows for each analyst
was determined. The retention time window is defined as plus or minus three
times the standard deviation of the absolute retention times for each standard.
Range and Sensitivity
The minimum detectable limit for chloride ion at sensitivity 100 is 2.44 pg.
The minimum detectable concentration of chloride ion for particulates collected
on one glass fiber filter of approximately 400 cm2 is 0.064 pg if 480 m3 of air are
sampled in the ambient atmosphere. The minimum detectable limit for SO4 is
3 pg for fluoride 0.4 pg and for nitrate 0.5 pg at sensitivity 100 on 2000 i/SP
Dionex ion chromatograph.
Precision and Accuracy
The blank fiber filter paper was spiked by known concentration of anions
and extracted ultrasonically. The relative standard deviation (RSD) for 3
ultrasonic extract for SO4 was ±1.35. For nitrate 5.54% for chloride 4.23% and for
fluoride 4.5%. The percentage recovery for SO4 is 98.02 for chloride 97.4, for
nitrate 98.0 and for fluoride 95.0.
Similarly the exposed filter papers were also spiked by known
concentration of anions. The RSD for 2 ultrasonic extract for sulphate was 1.44
for nitrate 5.8 for chloride 5.2 & for fluoride 5.5. The percentage recovery for SO4
is 97.01 for chloride 95.2 for nitrate 95 and for fluoride 90.58%.
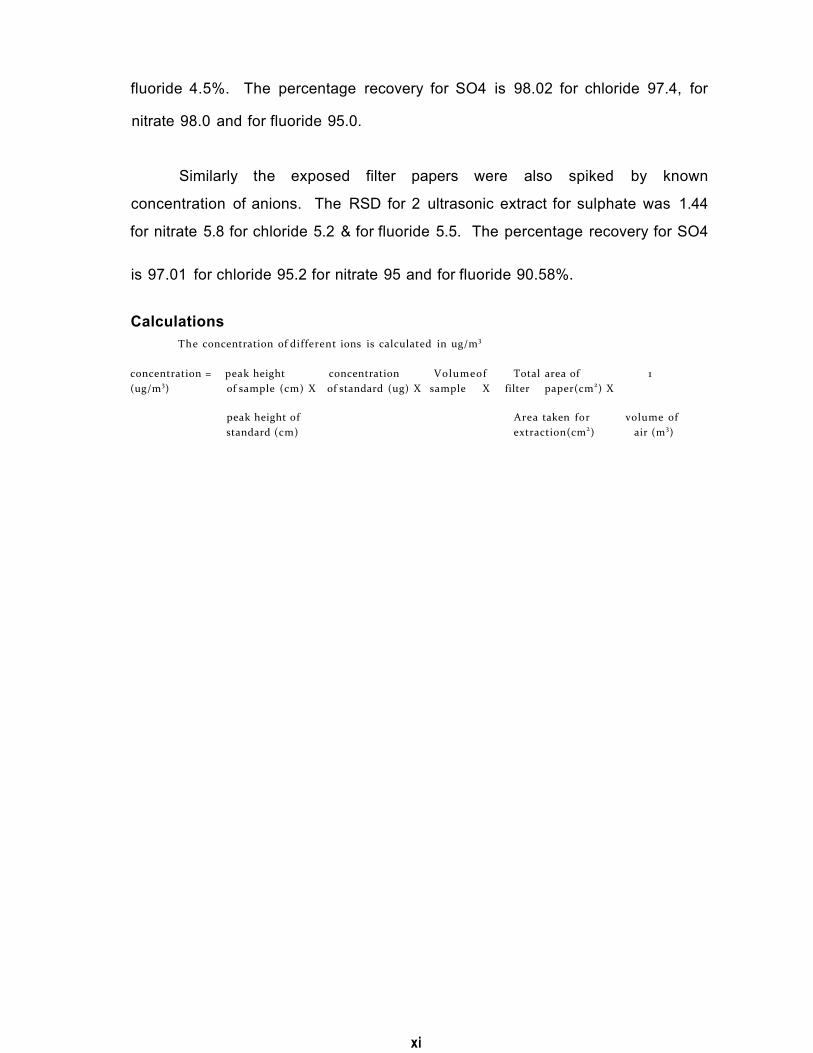
Calculations The concentration of different ions is calculated in ug/m3
concentration = peak height concentration Volumeof Total area of 1 (ug/m3) of sample (cm) X of standard (ug) X sample X filter paper(cm2) X
peak height of Area taken for volume of standard (cm) extraction(cm2) air (m3)
xi

F
SAMPLE
Anions Separation in Rain Water Sample by Ion-chromatograph
SAMPLE
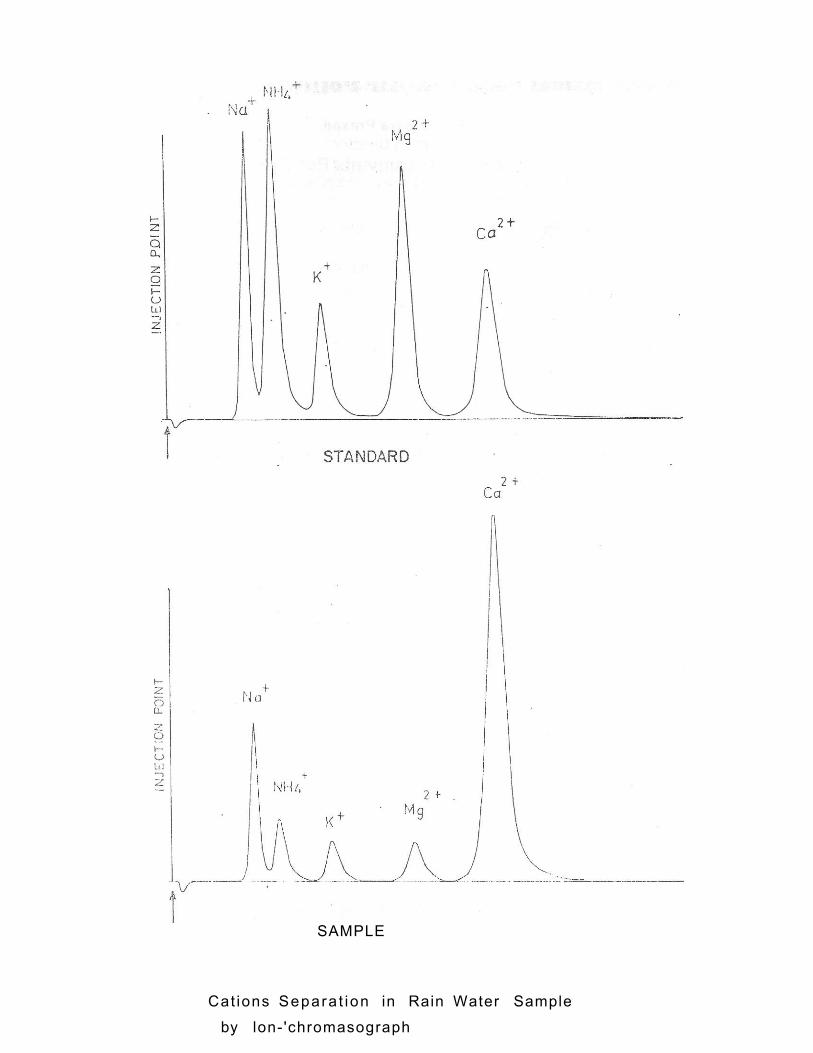
Cat ions Separa t ion in Rain Water Sample
by lon- 'chromasograph


![Index [application.wiley-vch.de] · Index 1835 – – healthy and diseased subjects concentration distribution 955, 956 – – immunoassay formats 953, 954 – – inorganic ions](https://img.pdfslide.us/doc/110x75/5eccfef5d8862845760e30f0/index-index-1835-a-a-healthy-and-diseased-subjects-concentration-distribution.jpg)