Embed Size (px)
Citation preview

UN
IT
ED
N
AT
IO
NS
E
NV
IR
ON
ME
NT
P
RO
GR
AM
ME
A key question that relates to the very broad and intensive use of metals is whether society needs to be concerned about long-term supplies of any or many of them. This is a many-faceted question that cannot be answered quickly or unequivocally. To address it, the Global Metal Flows Group envi-sions a series of six reports, of which this is the second-b one ad-dressing opportunities, limits and infrastructure for metal recycling. This report follows report second-a, which has demonstrated the status quo of global recycling rates for sixty metals.
Product-Centric recycling is dis-cussed in this report by acknowl-edged experts. This approach is considered to be an essential enabler of resource effi ciency by increasing recycling rates. Due to complex functionality, modern products contain complex mixes of almost any imaginable metal, material and compound. This re-port provides a techno-economic, product design and physics basis to address the challenges of recy-cling these increasingly complex products in the 21st century.
Published in April 2013
Metal Recycling
For more information, contact:Resource Panel Secretariat UNEP DTIESustainable Consumptionand Production Branch15 rue de Milan75441 Paris CEDEX 09FranceTel: +33 1 44 37 14 50Fax: +33 1 44 37 14 74E-mail: [email protected] www.unep.org/resourcepanel
DTI/1535/PAISBN: 978-92-807-3267-2
Opportunities, Limits, Infrastructure
About the UNEP Division of Technology,Industry and Economics
The UNEP Division of Technology, Industry and Economics (DTIE) helps governments, local authorities and decision-makers in business and industry to develop and implement policies and practices focusing on sustainable development.
The Division works to promote:> sustainable consumption and production,> the effi cient use of renewable energy,> adequate management of chemicals,> the integration of environmental costs in development policies.
The Offi ce of the Director, located in Paris, coordinates activities
through:
> The International Environmental Technology Centre - IETC (Osaka, Shiga), which implements integrated waste, water and disaster management programmes, focusing in particular on Asia.
> Sustainable Consumption and Production (Paris), which promotes sustainable consumption and production patterns as a contribution to human development through global markets.
> Chemicals (Geneva), which catalyzes global actions to bring about the sound management of chemicals and the improvement of chemical safety worldwide.
> Energy (Paris and Nairobi), which fosters energy and transport policies for sustainable development and encourages investment in renewable energy and energy effi ciency.
> OzonAction (Paris), which supports the phase-out of ozone depleting substances in developing countries and countries with economies in transition to ensure implementation of the Montreal Protocol.
> Economics and Trade (Geneva), which helps countries to integrate environmental considerations into economic and trade policies, and works with the fi nance sector to incorporate sustainable development policies.
UNEP DTIE activities focus on raising awareness,
improving the transfer of knowledge and information,
fostering technological cooperation and partnerships, and
implementing international conventions and agreements.
For more information,see www.unep.fr
AcknowledgmentsEditor: International Resource Panel, Working Group on the Global Metal FlowsLead author: Markus Reuter
Authors: Markus Reuter, Outotec Oyj, Finland and Aalto University, Finland; Christian Hudson, DIW, Germany; Antoinette van Schaik, MARAS, Netherlands; Kari Heiskanen, Aalto University, Finland; Christina Meskers, Umicore, Belgium and Christian Hagelüken, Umicore, Germany.
Contributors (Alphabetical): Helmut Antrekowitsch, University Leoben, Austria; Diran Apelian, WPI, USA; Bo Bjorkman, Luleå University of Technology, Sweden; Bart Blanpain, Leuven University, Belgium; Françoise Bodenan, BRGM, France; Mieke Campforts, Umicore, Belgium; Amélia Enríquez, UNEP, Brazil; Bernd Friedrich RWTH Aachen, Germany; Stefan Gössling-Reisemann, University of Bremen, Germany; Daniel Froelich, ENSAM, Chambéry, France; Tom Jones, Leuven University, Belgium; Yasushi Kondo, Waseda University, Japan; Jinhui Li Tsinghua University, China; Hans-Rainer Lotz, Volkswagen, Germany; Stefan Luidold, University Leoben, Austria; Elisabeth Maris, ENSAM, Chambery, France, Kazuyo Matsubae, Tohoku University, Japan; Nourredine Menad, BRGM, France; Shinsuke Murakami, Tokyo University, Japan; Kenichi Nakajima, NIES, Japan; Tetsuya Nagasaka, Tohoku University, Japan; Shinichiro Nakamura, Waseda University, Japan; Sheraz Neffati, ICDA, France; Shuji Owada, Waseda University, Japan; Jim Petrie, University of Cape Town, South Africa; Georg Rombach, Hydro Aluminium, Germany; Susanne Rotter, University of Berlin, Germany; Mathias Schluep, EMPA, Switzerland, Guido Sonnemann, Uni-versity of Bordeaux, France, Philip Strothmann, UNEP, France; Pia Tanskanen, Nokia, Finland; Karel van Acker, Leuven University, Belgium; Jacques Villeneuve, BRGM, France; Harro von Blottnitz, University Cape Town, South Africa; Patrick Waeger, EMPA, Switzerland; Philippe Wavrer, BRGM, France; Rolf Widmer, EMPA, Switzerland; Patrick Wollants, Leuven University, Belgium and Guomei Zhou, Ministry of Envi-ronmental Protection, China.
We would like to thank Christian Hudson and Marinus Kluijver for providing scientifi c and English editorial support for the full report.
The report went through several rounds of peer-review coordinated in an effi cient and constructive way by Patrice Christmann together with the International Resource Panel Secretariat. Valuable comments were received from several anonymous reviewers in this process. The preparation of this report also benefi ted from discussions with many colleagues at various meetings.
Special thanks go to Ernst Ulrich von Weizsäcker and Ashok Khosla as Co-Chairs of the International Resource Panel for their continuing support and encouragement, as well as to the members of the International Resource Panel and its Steering Committee for their dedication and commitment and additional helpful comments.
Special thanks go to Anu Ketelä (Aalto University, Finland) for her support during the fi nal stages of the document preparation. Shaoyi Li, Janet Salem, Thomas Marques and Philip Strothmann, UNEP, provided valuable input and comments; the International Resource Panel’s Secretariat coordinated the preparation of this report. Sybille Schmidtchen and the team from 3f design were instrumental in creating and editing the fi gures and graphics.
The main responsibility for errors remains with the authors.
UNEP promotes environ-
mentally sound practices globally and in its own activities.
Please print this publication – when printing is necessary – on recycling
paper or FSC certi� ed paper. Our distri-bution policy aims to reduce UNEP’s
carbon footprint.
Copyright © United Nations Environment Programme, 2013The report should be referenced as follows:UNEP (2013) Metal Recycling: Opportunities, Limits, Infrastructure, A Report of the Working Group on the Global Metal Flows to the Inter-national Resource Panel. Reuter, M. A.; Hudson, C.; van Schaik, A.; Heiskanen, K.; Meskers, C.; Hagelüken, C.
Design/layout: 3f design; cover concept, UNEP.Photos: iStockphoto.com: background title/page 38 © Harrie Marinus, title 1 © oneclearvision, title 2 © Marco Hegner, title 3 © Milos Peric, title 4 © DNY 59, page 2 © Youra Pechkin, page 6 © Ermin Gutenberger, page 22 fi gure 1_5 © Sergei Devyatkin, page 27 fi gure 3/page 108 fi gure 38_1 © Ivan Stevanovic, 3_2 © Jacob Wackerhausen, 3_9 © Pete Saloutos, page 30 fi gure 4/page 62 fi gure 15/page 108 fi gure 38 center © Joerg Reimann, page 54 fi gure 12 © Christopher Pollack, page 86 © urbancow, page 130 © Lee Pettet, page 164 © best-foto, page 242 © Richard Clark, page 262 © ugur bariskan, page 266 © James Whittaker, page 310 © Huguette Roe. PhotoDisc.com: page 191 fi gure 83 © Don Farrall. Photocase.com: page 22 © NormanBates. Fotolia.com: page 42 © Blackosaka. Others: see captions.
This publication may be reproduced in whole or in part and in any form for educational or nonprofi t purposes without special permission from the copyright holder, provided acknowledgement of the source is made. UNEP would appreciate receiving a copy of any publication that uses this publication as a source.
No use of this publication may be made for resale or for any other commercial purpose whatsoever without prior permission in writing from the United Nations Environment Programme.
DisclaimerThe designations employed and the presentation of the material in this publication do not imply the expression of any opinion whatsoever on the part of the United Nations Environment Programme concerning the legal status of any country, territory, city or area or of its authorities, or concerning delimitation of its frontiers or boundaries. Moreover, the views expressed do not necessarily represent the decision or the stated policy of the United Nations Environment Programme, nor does citing of trade names or commercial processes constitute endorsement.
ISBN: 978-92-807-3267-2 Job Number: DTI/1535/PA
Metal Recycling
* This is report 2b of the Global Metal Flows Working Group of the International Resource Panel of UNEP.
Opportunities, Limits, Infrastructure*
2
Metal Recycling – Opportunities, Limits, Infrastructure
Foreword
The challenge of sustainable development at the beginning of the 21st century has become a systemic one, with environmental, social and economic dimensions on an equal foot-ing. UNEP and the UNEP-hosted Internation-al Resource Panel consider that our contri-butions also need to be systemic, for example through the promotion of resource efficiency, improved materials recycling and life-cycle thinking. This report from the Panel, Met-al Recycling - Opportunities, Limits, Infra-structure, provides unrivalled science to in-form policy makers about how the recycling of metals can be optimized on an economic and technological basis along product life cy-cles in the move towards sustainable metals management.
The report shows that sustainable metals management requires more than improv-ing recycling rates of selected materials. We need to change thewhole mindset on recy-cling of metals, moving away from a Materi-al-Centric approach to a Product-Centric ap-proach. Recycling has become increasingly difficult today and much value is lost due to the growing complexity of products and com-plex interactions within recycling systems.
While common commodity metals like steel, magnesium and copper can be recovered rel-atively easily, as these are often used in rela-tively simple applications, the small amounts of metals in, for example, electrical and elec-tronic waste can be harder to recover be-cause they are often just one among up to 50 elements. As an example, a mobile phone can contain more than 40 elements including base metals such as copper and tin, special metals such as cobalt, indium and antimo-ny, and precious and platinum-group met-als including silver, gold, palladium, tungsten and yttrium. Fluorescent lamps contain vari-ous materials and elements which include a range of Rare Earth elements, and other crit-ical metal resources. And a modern car con-tains nearly all metals available, as it is a
3
Metal Recycling – Opportunities, Limits, Infrastructure
product that integrates a broad range of oth-er metal-containing products.
This is why thefocus needs to be on optimiz-ing the recycling of entire products at their end-of-life instead of focusing on the individ-ual materials contained in them. The global mainstreaming of a product-centric view on recycling will be a remarkable step towards efficient recycling systems, resource effi-ciency, and a green economy in the context of sustainable development and poverty eradi-cation.
Such a transition will depend on the mobi-lization of everyone in the value chain, from operators in the primary production of metals and metal-containing products to the recy-cling and collection industry to the consum-ers. Industry can be the source of driving in-novation that maximizes resource efficiency when policy makers draw on their expertise and tools. Experts from the extraction indus-try, for example, can make a crucial con-tribution through their knowledge of met-al streams and Best Available Techniques (BATs) for the separation and recovery of dif-ferent components of a product. Moreover, the manufacturing industry plays a key role in the design of products that facilitate recy-cling, leading to a substantial increase in re-cycling efficiency. However, making so-called “urban mines” valuable through recycling can only happen if consumers dispose waste products at collection points operated ac-cording to BAT and decide against informal or illegal disposal.
As populations in emerging economies adopt similar technologies and lifestyles as cur-rently used in OECD countries, global met-al needs will be 3 to 9 times larger than all the metals currently used in the world. This poses a significant call for increased second-ary production of metals. Two former reports from the International Resource Panel on the
quantity of metal stocks and on metal recy-cling rates outlined the so-far untapped
potential and necessity to enhance global metals recycling. This follow-up report analy-ses the current limitations of metals recy-cling and discusses how to increase metal-secondary production – and thus resource efficiency – from both quantity and quality viewpoints. The report emphasizes that only a wide, systemic view of recycling looking at the industrial and economic factors driving recycling can deal with the complexity of in-teractions between metals.
It acknowledges that recycling is primarily an economic industrial activity, driven by the val-ue of the recovered metals and materials. An infrastructure for optimized recycling would therefore make use of economic incentives. Those economic drivers must align with long-term economic goals, such as conserving critical metal resources for future applica-tions, even if their recovery may be currently uneconomic.
Getting all stakeholders on board is crucial if we want to meet the increasing metal needs of the future in a sustainable way. This is a challenging task for policy makers. A wide, systemic approach based on the solid under-standing of the industrial and economic fac-tors driving recycling will be needed. Such a knowledge base will allow to develop a co-herent regulatory framework and powerful incentives for all stakeholders to participate in recycling and thus in our transition to a re-source efficient society.
Achim Steiner
UN Under-Secretary General and Executive Director UNEP
Nairobi, Kenya

4
Metal Recycling – Opportunities, Limits, Infrastructure
Preface
The increasing demand for metals in the course of the last century, putting permanent pressure on natural resources, has revealed that met-als are a priority area for decoupling economic growth from resource use and environmental degradation. The imperative of decoupling will become even more pressing in the future with a global demand for metals on the rise: In de-veloping countries due to rapid industrialization and in developed countries due to modern, met-al intensive technologies that are crucial not only but especially for the transformation to-wards green technologies. Ensuring appropriate levels of supply while reducing the negative en-vironmental footprints will therefore be essen-tial on our way towards a global green economy.
In this regard, recycling and thus resource ef-ficiency plays a crucial role, as it decreases the necessity to fulfil the demand by exploiting our natural resources further. Using secondary re-sources temporarily locked up in so-called “ur-ban mines” hence decreases not only the en-vironmental impacts associated with mining, but also decreases the release of – partly toxic – wastes into the environment. Taking into ac-count that most modern technologies rely on ‘critical’ elements, which are not abundant in nature, it is of crucial importance to preserve and reuse them as much as possible.
The International Resource Panel’s working group on Global Metal Flows contributes to the promotion of an international sound material-cycle society by providing a series of six scien-tific and authoritative assessment studies on the global flows of metals. To achieve best sci-entific results, it cooperates with a number of actors, including metal industry associations. The present, report builds on the findings of the two previously published assessments of met-al stocks in society and recycling rates, which came to the conclusion that despite huge metal “mines above ground”, recycling rates remain low. It aims at leveraging secondary production of metals through a close analysis of the neces-sary conditions and enablers of recycling.
The report identifies a number of shortcom-ings in current recycling policies but also shows ways for their improvement. It emanates from the report that recycling systems need to adjust
to the fact that recycling has become increas-ingly difficult due to the rising complexity of products. Raising metal-recycling rates there-fore needs realignment away from a material-centric towards a product-centric approach. A focus on products discloses the various trade-offs between for example achieving weight-based policy targets and the excessive energy consumed in efforts to meet these targets. Re-cycling objectives that go beyond what is ther-modynamically possible, thus rather hinder than promote recycling. Appropriate recycling goals, which draw on the expertise and tools available within the recycling industry, are a better way to enhance recycling of metals.
The present report responds to the pressing need to optimize current recycling schemes with the help of a better understanding of the limits imposed by physics, chemistry, thermo-dynamics and kinetics, as well as by the tech-nological, economic and social barriers and in-efficiencies encountered. Much is at stake when thinking about how to improve recycling sys-tems: closing loops, reducing related environ-mental impacts, safeguarding the availability of metals, minimizing metal prices, and promoting meaningful and safe jobs for poor people in de-veloping countries.
We are very grateful to the lead author Markus Reuter and principal contributors Christian Hudson, Antoinette van Schaik, Kari Heiskanen, Christina Meskers and Christian Hagelüken for having generated such a thorough and valuable report.
Dr. Ernst Ulrich von Weizsäcker
Emmendingen, Germany
Dr. Ashok Khosla
New Delhi, India
Co-Chairs, International Resource Panel
5
Metal Recycling – Opportunities, Limits, Infrastructure
Preface
Metal recycling is increasingly promoted as an effective way to address resource scarcity and mitigate environment impacts associated with metal production and use, but there is little systemic information available regard-ing recycling performance, and still less on the true recycling rates that are possible and how to do better considering the system in its totality. The former topic was the subject of an earlier report from the International Re-source Panel (Recycling Rates of Metals: A Status Report, 2011). In the present report, the second topic is addressed.
This new report discusses the benefits and necessity of approaching recycling from prod-ucts, considering them as complex “designer minerals” with typical structures and join-ings. This Product Centric approach therefore takes account of the complexities of modern products (which are often much more com-plex than geological minerals), and the ways in which non-traditional mixtures of elements are now common. The approach gains much useful perspective from experience in clas-sical minerals and metallurgical processing. All contained metals in all streams can be tracked by revealing the “mineralogies” of the material particles, thereby allowing a more detailed and deeper understanding of these complex systems.
As the report argues, modern technology systems require not only efficient end-of-life collection of products, but also effective sort-ing after collection, and then the optimum suite of physical separation and metallurgical technologies for an economically viable re-covery of metals from the sorted recyclates. The report shows how failure at any stage of the recycling chain limits recycling perfor-mance, and shows as well that basic thermo-dynamic, technological, and economic limi-tations may prevent metallurgical metal re-covery for some combinations of metals and materials.
The complementary Material Centric recy-cling view point, as presented in the first re-port, has the capability to answer the ques-tion of how much is recycled but does not pretend to answer why and what should be done to improve recycling of metals. This new report sheds light on how to improve the re-covery of especially those critical technology elements that were shown to have low recy-cling rates.
The report concludes with a number of tools that can aid decision-makers in arriving at improved recycling approaches. This provides a physics basis for performing Design for Re-cycling and Sustainability, Eco-labeling, and quantifying resource efficiency, as well as es-timating the opportunities, limits, and infra-structure of recycling.
Prof. Thomas E. Graedel
Leader of the Global Metal Flows Working Group
Prof. Markus Reuter
Lead Author
6
Metal Recycling – Opportunities, Limits, Infrastructure

7
Metal Recycling – Opportunities, Limits, Infrastructure
Table of Contents
Prefaces ________________________________________________________________________ 2
Table of Contents ___________________________________________________________________ 7
List of Figures ______________________________________________________________________ 8
List of Tables ______________________________________________________________________ 12
Executive Summary ________________________________________________________________ 22
1 Brief Overview of Factors Affecting Recycling _______________________________________ 39
2 Recycling Opportunities __________________________________________________________ 67
3 Limiting Factors in Recycling _____________________________________________________ 87
4 Consequence of Limiting Factors _________________________________________________ 125
5 Infrastructure for Optimizing Recycling ___________________________________________ 131
6 Tools to Aid Decision Making _____________________________________________________ 151
7 Policy Drivers and Recommendations for Recycling _________________________________ 165
Appendix A. Details on Recovery of Metals from Recyclates _____________________________ 181
Appendix B. Details on Metals Found in WEEE _________________________________________ 212
Appendix C. Details on Battery Recycling _____________________________________________ 227
Appendix D. Mobile Phone Collection ________________________________________________ 239
Appendix E. Models and Simulation in Recycling ______________________________________ 243
Appendix F. Physics of Extractive Metallurgy __________________________________________ 267
References ______________________________________________________________________ 290
Acronyms and Definitions __________________________________________________________ 312
International Resource Panel _______________________________________________________ 316
Global Metal Flows Working Group __________________________________________________ 316

8
Metal Recycling – Opportunities, Limits, Infrastructure
List of FiguresFigure 1: Product Centric Recycling: Application of economically viable technology and
methods throughout the recovery chain to extract metals from the complex inter-linkages within designed “minerals” i. e. products, gleaning from the deep know-how of recovering metals from complex geological minerals. ______________________ 22
Figure 2: The best footprint of sustainability and resource efficiency may be achieved by reducing losses during processing by bringing together the various stakeholders, thus minimizing the use of resources in their widest sense. No society can truly achieve a “closed-loop” status; there will always be some loss and economic growth implies more raw-material needs; there-fore, Figure 2 shows how this footprint is affected by the various activities of transforming raw materials. ____________________________________________ 24
Figure 3: Product-Centric recycling – A schematic diagram of the life cycle of metal-containing products going through recycling, showing the inevitable loss-es. Design for resource efficiency covers all details of the figure in order to minimize losses _________________________________________________________ 27
Figure 4: The “Metal Wheel”, based on primary metallurgy but equally valid for met-als recycling reflects the destination of different elements in base-metal minerals as a function of interlinked metallurgical process technology. Each slice represents the complete infrastructure for base- or Carrier-Metal re-fining. As there are so many different combinations of materials in End-of-Life products, only physics-based modelling can provide the basis for valid predictions. In essence, primary metallurgy is situated in a segment a com-plete processing plant, while the complexity of consumer product mineral-ogy requires an industrial ecological network of many metallurgical produc-tion infrastructure to maximize recovery of all elements in end-of-life prod-ucts (Reuter and van Schaik, 2012a&b; Ullmann’s Encyclopaedia, 2005). _________ 30
Figure 5: Example of existing software for flowsheet design, based on composition-al data for a product (here LCD screens), which lead to simulated resource efficiency data that, in turn, lead to a recyclability index based on environ-mental analysis – a metallurgical processing infrastructure is prerequisite (Reuter 1998). __________________________________________________________ 31
Figure 6: Resource cycles should be linked by flowsheeting and simulation tools based on rigorous physics before interactively linking them to environmen-tal-impact assessment software (HSC Sim and GaBi). ________________________ 32
Figure 7: Past exponential growth of different battery technologies (Eurometaux, 2010). _____________________________________________________ 41
Figure 8: Gold ore grades between 1830 and 2010 (Source: UNEP 2011c, p. 24). __________ 44
Figure 9: Various definitions of recycling rates and corresponding data for elements in the periodic table (UNEP, 2011b). ________________________________________ 48
Figure 10: Recycling performance calculations as a function of various objectives, constraints and scenarios. Results are expressed per scenario in terms of overall Recycling + recovery rate; Recycling rate (material recycling); Re-covery rate (energy recovery); Produced waste; as well as Steel and Copper recycling rates. _________________________________________________________ 52
9
Metal Recycling – Opportunities, Limits, Infrastructure
Figure 11: The ever-increasing use of complex mixtures of metals in products has a key effect on the recyclability of metals (Adapted by Reuter from Achzet and Reller, 2011). ________________________________________________________ 53
Figure 12: Example of alloying elements affecting copper-alloy properties ranging from strength, wear resistance to corrosion resistance (Copper Develop-ment Association, 2012). _________________________________________________ 54
Figure 13: The changing weights of cars over the years (International Aluminium In-stitute, 2007). ___________________________________________________________ 55
Figure 14: Various REEs and their application in electric vehicles. ________________________ 60
Figure 15: The “Metal Wheel”, based on primary metallurgy but equally valid for met-als recycling reflects the destination of different elements in base-met-al minerals as a function of interlinked metallurgical process technology. Each slice represents the complete infrastructure for base- or Carrier-Metal refining. As there are so many different combinations of materials in End-of-Life products, only physics-based modelling can provide the basis for valid predictions. In essence, primary metallurgy is situated in a seg-ment a complete processing plant, while the complexity of consumer prod-uct mineralogy requires an industrial ecological network of many metal-lurgical production infrastructure to maximize recovery of all elements in end-of-life products (Reuter and van Schaik, 2012a&b; Ullmann’s Encyclo-paedia, 2005). ___________________________________________________________ 62
Figure 16: Material efficiency vis-à-vis energy efficiency (Allwood et al., 2011) in a context of Material and Product-Centric Recycling. __________________________ 63
Figure 17: Schematic overview of the historic and (potential) future evolution of waste management. (Jones, 2008; Jones and De Meyere, 2009; Jones et al. 2012). _____ 65
Figure 18: Mean number of items out of 11 that are being recycled (Damanhuri, 2012). _____ 66
Figure 19: Typical material fractions in WEEE (Ongondo et al., 2011). _____________________ 67
Figure 20: Metals found in printed circuit boards. _____________________________________ 72
Figure 21: Plant solutions based on commodity-metals production technology best handle the, often low-volume, critical-element recycling. The above Korea Zinc flowsheet not only creates no ponded residue, but also recovers many valuable elements associated with zinc minerals, such as indium, which are critical to flat-panel TV technology (Hoang et al., 2009). ___________________ 76
Figure 22: Conventional phosphorus flow through chemical and iron & steel indus-tries and possible new flow (grey arrows) when P-recovery technology from steelmaking slag comes on stream. Arrow width corresponds to quantity of flow (Yoshida et al., 2012). _________________________________________________ 78
Figure 23: Critical levels of some elements (U.S. Department of Energy, 2010). ____________ 80
Figure 24: Primary carbon footprint of selected elements in WEEE goods (EU, 2010) (Appendix F: “Physics of Extractive Metallurgy”). ____________________________ 84

10
Metal Recycling – Opportunities, Limits, Infrastructure
Figure 25: Main WEEE recycling activities in China and India, types of produced emis-sions and general environmental pathways. (Sepúlveda et al., 2010). ___________ 85
Figure 26: Study of developing and developed markets about what people did with their previous cell phone (Damanhuri, 2012). ________________________________ 88
Figure 27: Asian e-waste traffic – who gets the waste? (Baker et al., 2005). _______________ 89
Figure 28: The link between joined particles, their shredding or dismantling into groups, and their subsequent separation into economically valuable recy-clates (van Schaik and Reuter, 2012; Reuter and van Schaik, 2012a&b). _________ 94
Figure 29: Impure quality recyclates created during physical separation of shredded cars (Reuter et al., 2005). _________________________________________________ 95
Figure 30: Groups of components best sorted by hand for producing the cleanest re-cyclates (van Schaik and Reuter, 2010b). ____________________________________ 96
Figure 31: Characteristics of connection types related to their specific degree and non-randomness of liberation behaviour after a shredding operation (van Schaik and Reuter, 2007a&b; van Schaik and Reuter, 2012). ___________________ 98
Figure 32: Example of recycling cars, a complex network of processes and inter-connected material flows. Separation processes are of key importance in producing suitable recyclates for processing in a metallurgical plant (van Schaik and Reuter, 2012, HSC Sim 1974 – 2013). ____________________________ 100
Figure 33: Generic separator using the laws of physics and material properties for separating materials. ___________________________________________________ 101
Figure 34: Separation-efficiency curve for an arbitrary material during physical sepa-ration (Heiskanen, 1993; King, 2001). ______________________________________ 102
Figure 35: Maximum grade-recovery curve (left) for liberation characteristics of scrap (right). ________________________________________________________________ 105
Figure 36: Maximum grade-recovery curve (left) for liberation characteristics of scrap (right) (Heiskanen, 1993). ________________________________________________ 105
Figure 37: Typical WEEE material composition (European Topic Centre on Sustainable Consumption and Production, 2009). ______________________________________ 106
Figure 38: Design for resource efficiency showing the destination of elements from an end-of-life material. If a WEEE product falls in the copper and Zn/Pb slic-es, many metals can be recovered, but if it falls in the incorrect slice, e. g. the steel cycle, the metals may be lost, diminishing the resource efficiency. Policy should thus pay particular attention to the complete infrastructure and systems. __________________________________________________________ 108
Figure 39: Electric Arc Furnace (EAF) for smelting steel scrap (Krüger et al., 2005; SMS-Siemag: www.sms-siemag.com). ____________________________________ 109
Figure 40: Technologies used in aluminium recycling for various scrap types, includ-ing salt-slag smelting for producing cast aluminium from scrap (Boin and Bertram, 2005; Bertram et al., 2009). _____________________________________ 111

11
Metal Recycling – Opportunities, Limits, Infrastructure
Figure 41: The effect of scrap surface area (left) on recovery (right) of two scrap types – recovery is held back by inactive alumina coating scrap, so scrap with a higher surface area/volume ratio (upper picture) has lower recovery rates than larger pieces (bottom set) (Xiao and Reuter, 2002). _____________________ 112
Figure 42: The flow of elements associated with copper production (hydro- and pyro-metallurgy) showing the link between primary production and recycling. Gangue minerals are not included. (Nakajima et al., 2008; 2009; 2011; Na-kamura and Nakajima, 2005; Nakamura et al., 2007). This flowsheet fits into the copper segment of the Metal Wheel (Figure 15). _____________________ 113
Figure 43: Weight and material composition of the SuperLightCar light-weight BIW concept (SuperLightCar, 2005 – 2009; Goede et al., 2008; Krinke et al., 2009). ____ 114
Figure 44: Metal-production flowsheet integrating copper and lead hydro- and pyro-metallurgy for maximizing metal recovery from Boliden’s operating facil-ity (Outotec, 2012; NewBoliden, 2012), fitting into the Pb and Cu segment of the Metal Wheel (Figure 15). _____________________________________________ 115
Figure 45: The Umicore flowsheet based on copper and lead hydro- and pyro-metal-lurgy, using a TSL furnace for copper and a blast furnace for lead, which permits the processing of slag, matte, speiss, slimes, sludges, dross, etc. (Hagelüken et al., 2009) – This flowsheet fits in the two Pb&Cu segments of the Metal Wheel (Figure 15). _____________________________________________ 116
Figure 46: The Kayser Recycling System for recycling copper metal and other copper containing residues. This flowsheet fits into the Cu segment of the Metal Wheel (Figure 15). ______________________________________________________ 117
Figure 47: Various smelters for the recycling of a wide range of materials including copper, lead, zinc, critical elements, e-waste, slimes, batteries, scrap, etc. All with high environmental standards as they are all located in or next to towns. ______________________________________________________________ 117
Figure 48: The link between the Iron and the zinc cycles for galvanized steel, a Mate-rial (& Metal)-Centric view (Reuter et al., 2005). _____________________________ 118
Figure 49: Process steps of EoL product treatment with indicators of economic gain/cost (Tanskanen and Takala, 2006). ________________________________________ 120
Figure 50: Steel scrap prices following iron ore prices (USGS, 2011). ____________________ 121
Figure 51: Past and projected growth in available EoL appliances with LCD screens in EU25 (Salhofer et al., 2011). ______________________________________________ 123
Figure 52: Recycling efficiency between a common formal system in Europe and the informal sector in India for the gold yield from printed wire boards. ____________ 125
Figure 53: Metal recycling rates predicted by the recycling model for different met-als for disassembled Printed Wire Boards (PWBs) either directly fed into a copper smelter or shredded with varying intensity. Note the low recovery of gold and copper for shredding and the high recycling values if the PWBs are directly recycled to furnace without shredding (van Schaik and Reuter, 2010a). _______________________________________________________________ 126
12
Metal Recycling – Opportunities, Limits, Infrastructure
Figure 54: The various stakeholders of recycling in a two dimensional simplified rep-resentation of a multi-dimensional complex product centric approach (Harro von Blottnitz, 2011). _______________________________________________ 131
Figure 55: Ratio of scrap recovered and domestic consumption (%) – 2009 (The Alu-minium Association www.abal.org.br). _____________________________________ 139
Figure 56: Recycling rates for beverage cans (Sources: Brazilian Aluminium Associa-tion, ABAL, who collected data from: Brazilian Association of Highly Recy-clable Cans, The Japan Aluminium Can Recycling Association, Camara Ar-gentina de la Industria del Aluminio y Metales Afines, The Aluminium As-sociation, and European Aluminium Association). ___________________________ 139
Figure 57: Features affecting consumer recycling behaviour (Mäkelä, 2011). _____________ 141
Figure 58: Manual dismantling in the informal sector in China. _________________________ 142
Figure 59: Product-Centric recycling of EoL goods with a networked structure of tech-nologies for dealing with the various streams.This Figure shows the com-plex network of technologies that can be applied to manage resource ef-ficiency (van Schaik and Reuter, 2004a; 2004b; 2007; 2010a; 2010b; van Schaik and Reuter, 2012; van Schaik, 2011; Reuter et al., 2005; Reuter, 2009; Ignatenko et al., 2008). _____________________________________________ 143
Figure 60: A key message concerning Product-Centric recycling: Product design must be linked to liberation, separation efficiency, and quality of both re-cyclate and of final output streams, based on the thermodynamic limits of recycling (Reuter et al., 2005; Reuter and van Schaik, 2008, 2012a&b; van Schaik and Reuter, 2012). _______________________________________________ 145
Figure 61: LCA of a personal computer (Choi et al., 2006). _____________________________ 147
Figure 62: All functions in a company play an important role in Life Cycle Manage-ment (adapted from UNEP, 2007a). ________________________________________ 148
Figure 63: Life-cycle management within ALCAN, engaging and collaborating with stakeholders in the value chain (Balkau and Sonnemann, 2010). ______________ 149
Figure 64: Element radar chart for metallurgical processing of selected metals, showing element distribution in metal, slag, and gas phases based on thermodynamic analysis and metallurgical data of specific single reactors. (Nakajima et al., 2008; 2009; 2011; Nakamura and Nakajima, 2005; Naka-mura et al., 2007). The copper Peirce Smith converter of Figure 44 repre-sents the Cu (Converter) segment here.____________________________________ 152
Figure 65: Water cycle connected to metal and sludge processing, showing that recy-cling is not linear but complexly interlinked (van Schaik and Reuter, 2010b; Fagan et al., 2010). _____________________________________________________ 157
Figure 66: Linking design with sophisticated recycling tools drives innovation and improves resource efficiency through DfR for the SuperLightCar project (Goede et al., 2008; SuperLightCar, 2005 – 2009). ___________________________ 159
13
Metal Recycling – Opportunities, Limits, Infrastructure
Figure 67: LCA visualization of the SuperLightCar concept (Goede et al., 2008; Krinke et al., 2009). ____________________________________________________________ 160
Figure 68: Total life cycle impact of a CFRP body in white (BIW) compared to a conven-tional steel BIW. Only the difference in fuel consumption is considered in the use phase (van Acker and Verpoest, 2011; Duflou et al., 2008, 2012). ________ 162
Figure 69: Rough cost-breakdown for a typical shredder, where manual dismantling contributes up to 80 % of the ELV recyclate (Ferrão and Amaral, 2006). _________ 166
Figure 70: Schematic explanation of the stakeholder’s obligations according to Swiss WEEE legislation ORDEE (Widmer et al., 2008). _____________________________ 171
Figure 71: A Material (&Metal)-Centric view of recycling: Linear and sequential repre-sentation of recycling for non-complex metal applications such as in con-struction, packaging etc. (UNEP, 2011b). This recycling-rate definition is one-dimensional and lacks the required non-linear predictive qualities for successfully driving a recycling system. ___________________________________ 172
Figure 72: Sensor based automatic sorting for metal particles from a mixture of glass, polymer, stone, etc. (from HSC Sim 1974 – 2013). ______________________ 181
Figure 73: Eddy Current physics: light grey highly conductive and light, white non-conductive, and black slightly magnetic. Magnetic field strength, rotation speed, and positioning of the two splitters, among others, determine recy-clate purity (from HSC Sim 1974 – 2013). ___________________________________ 182
Figure 74: Rising-current separator using a rising water flow in a column to recover a light floating fraction from a feed also containing heavy material that drops to the bottom of the water column. ________________________________________ 182
Figure 75: A hydrocyclone separating feed into light and a heavy fractions. ______________ 183
Figure 76: The heavy-medium separator separates feed into a heavy fraction that sinks to the bottom of a rotating drum that lifts it to the top where it dis-charges onto a conveyor belt. The light fraction floats on the separating medium (water, FeSi slurry, etc.) and is collected and discharged via the floats conveyor belt. Cleaning of the float medium creates a sludge that has to be processed. ____________________________________________________ 184
Figure 77: Different process routes for steelmaking. A comparison of the energy re-quirements (GJ/t) of the different routes are given on p. 80 (World Steel, 2011a). _______________________________________________________________ 185
Figure 78: The technology of stainless-steel production (Johnson et al., 2008). ___________ 186
Figure 79: Primary and recycling copper production (Outotec). _________________________ 187
Figure 80: Dedicated copper-smelting production (Outotec). ___________________________ 187
Figure 81: The share of various technologies for processing zinc-containing residues (Outotec). ______________________________________________________________ 189
Figure 82: Waelz kiln for the processing of EAF dust (Ullmanns, 2005). __________________ 190
14
Metal Recycling – Opportunities, Limits, Infrastructure
Figure 83: The main reactions in a Waelz kiln (International Zinc Association, 2001 – 2002). ___________________________________________________________ 191
Figure 84: Red mud production and inventory (Klauber et al., 2011a, b). __________________ 193
Figure 85: Various patents for the processing of red mud (Klauber et al., 2011a; 2011b). ___ 193
Figure 86: Dry granulation of slag with heat recovery shown here for blast-furnace slags (Jahanshahi et al., 2011). ___________________________________________ 195
Figure 87: Simplified view of a recycling plant (including extensive PST processing) where 1153 cars were recycled, showing a generalized composition of a fluff after extensive treatment (Reuter et al., 2005; Reuter and van Schaik, 2012a&b). _____________________________________________________________ 196
Figure 88: Economy-wide flow of phosphorus in Japan for the year 2000 (kt-P) (Mat-subae-Yokoyama et al., 2009&2010). _______________________________________ 201
Figure 89: EPMA image of dephosphorization slag (FetO = 19 %, CaO/SiO2 = 4.4 %, P2O5 = 2.8 %) (Matsubae-Yokoyama et al., 2009&2010). ________________________ 202
Figure 90: Recrystallized slags with minerals. _______________________________________ 203
Figure 91: Flowsheets for the zinc process (left) and the coldstream process (right) (Lassner and Schubert, 1999). ___________________________________________ 205
Figure 92: Flowsheets for the reclamation of niobium and tantalum from different sources (Habashi, 1997). _________________________________________________ 207
Figure 93: A schematic overview of the cutting and physical sorting of lamps (Europe-an Lamp Companies Federation, 2012). ___________________________________ 209
Figure 94: Production of yttrium oxide from xenotime (McGill, 2010). ____________________ 210
Figure 95: A scheme for recycling manufacturing scrap, but EoL scrap can be mixed with other types thus complicating matters. (First Solar, Inc., 2012). __________ 211
Figure 96: Materials in a mobile phone (UNEP, 2009). _________________________________ 221
Figure 97: Worldwide battery market in 2010 HEV is mostly Ni/MH, while large re-chargeable includes Ni/Cd and Ni/MH, created with data from May (2011). ______ 227
Figure 98: General composition of a battery (Umicore). ________________________________ 227
Figure 99: Schematic overview of Li-ion battery recycling processes. ___________________ 230
Figure 100: Process flowsheet for Umicore Battery Recycling (2010). _____________________ 231
Figure 101: Dependency on natural resource categories for recycled (A) and primary material (B) to fill the Co and Ni requirement of a Li-ion cathode (Dewulf and van Langenhove, 2005). _____________________________________________ 233
Figure 102: Processing of NiMH batteries (Müller and Friedrich, 2006; Pietrelli et al., 2002). ________________________________________________________________ 234
Figure 103: Flowsheet of the IME-ACCUREC recycling concept. _________________________ 235

15
Metal Recycling – Opportunities, Limits, Infrastructure
Figure 104: The demand for Lithium for 50 % market penetration of electric vehicles (EU, 2010; Schüler et al., 2011). ___________________________________________ 237
Figure 105: The use of Ni, REs, Co and Li in batteries in the EU and the use of the met-als relative to total production (HEV: Hybrid Electric Vehicle; EV: Full Elec-tric Vehicle) (Eurometaux, 2010) – (also EU Critical Metals).___________________ 238
Figure 106: Reasons for not recycling a mobile phone (Damanhuri, 2012). _________________ 239
Figure 107: Recycling envelope for mobile phone. _____________________________________ 240
Figure 108: Product-Centric multi-level dynamic process simulation models that pre-dict recyclate quality, grade, and recovery levels linked to product design (Reuter and van Schaik, 2012a&b; van Schaik and Reuter, 2012a&b). __________ 243
Figure 109: Dynamic recycling-performance calculations of an e-waste product as a function of time, showing different recycling rates due to distributed prop-erties, such as material liberation, complex interlinked materials in prod-ucts due to functionality, quality distribution of recyclates, distribution of analyses, range of products and changing designs (van Schaik and Reuter, 2012). ________________________________________________________________ 245
Figure 110: Dynamic recycling rates per material (total recycling rates given in Fig-ure 109) as a function varying product weights, composition and plant input over time (van Schaik and Reuter, 2012). __________________________________ 246
Figure 111: Post-shredder technology plant for ELVs as operated by ARN (2013). __________ 247
Figure 112: Bandwidth of various produced recyclate streams (van Schaik and Reuter, 2012). ________________________________________________________________ 247
Figure 113: Quality of ferrous recyclate stream including the quantification and specifi-cation of the composition and contamination of the recyclate streams – it is obvious that the 3.1 % copper in the top figure is not good for steel quality (van Schaik and Reuter, 2012). ___________________________________________ 248
Figure 114: Quality of (a) ferrous and (b) aluminium recyclate streams, including quan-tification and specification of the composition/contamination of recyclate streams (c) and (d) respectively for ferrous and aluminium fraction (pre-sented as bandwidths as a function of changes in input, recycling routes, etc.) (Reuter et al., 2005; SuperLightCar, 2005 – 2009). _______________________ 249
Figure 115: Dynamic recycling models that include also the convolution integral, and hence permitting the simulation as a function of standard deviation of all analyses and flows of the system for products and mixture of products (van Schaik and Reuter, 2004a). _______________________________________________ 253
Figure 116: Design for Resource Efficiency Designer Mineral to Metal (The effect of Aluminium in WEEE on Slag and Metal Properties in Smelter). Metal re-covery as a function of process technology, thermodynamics and trans-port processes, here showing the effect of liberated and un-liberated steel on the recycling quality of aluminium and slag (Reuter et al., 2005; Reuter, 2011a). Products with high aluminium content, which oxidizes during pro-cessing, have a disruptive effect on processing and hence on resource effi-
16
Metal Recycling – Opportunities, Limits, Infrastructure
ciency as the systems have to be diluted with virgin material to operate them well. _____________________________________________________________ 254
Figure 117: Overview of the fuzzy rule liberation recycling model, predicting liberation behaviour and hence recycling/recovery rate as a function of design speci-fications (list of materials, joints and material combinations) (van Schaik and Reuter, 2007). ______________________________________________________ 255
Figure 118: Example of recycling-rate calculations for the SLC concept in the fuzzy re-cycling model (illustrated for Al) as a function of variations in design for steel and polymer content. There is no single recycling value as it is a com-plex function (van Schaik and Reuter, 2007). The figure shows why the sim-plistic one-dimensional recycling rate definitions used in the IRP’s report 2a (UNEP 2011b) only apply to limited cases as they do not consider complexity. ____________________________________________________________ 255
Figure 119: The importance of good data (for a coffee machine) that are aligned and of value to modelling and simulation of processes, either with recon-ciled mass-balance data and/or simulation tools (Chancerel et al., 2009; Chancerel and Rotter, 2009a). ____________________________________________ 257
Figure 120: Aluminium recyclates from EoL vehicles, showing the effect of product/component composition and material connections on the particulate na-ture and degree of (im)purity of recyclates (Reuter et al., 2005; Reuter and van Schaik, 2008). ______________________________________________________ 258
Figure 121: The LCA framework according to the ISO 14040/14044 series (ISO, 2006a). ______ 261
Figure 122: A comparison of pure copper scrap melting 756.9 MJ/t Cu (top) and impure copper recyclate smelting 1493.8 MJ/t Cu, showing the effect of impurities in scrap feed (down) at 1250 °C as calculated by HSC for adiabatic condi-tions with methane as fuel (HSC Chemistry 7, 1974 – 2013). ___________________ 267
Figure 123: The abundance (atom fraction) of the chemical elements in the earth’s up-per crust as a function of their atomic number. The rarest elements (yel-low) are the densest. Major industrial metals are shown in red (USGS)._________ 268
Figure 124: Various thermochemical data for the given reaction (HSC Chemistry 7, 1974 – 2013). ___________________________________________________________ 269
Figure 125: Various ΔG (Ellingham) functions of temperature for given oxides, showing that the REO La2O3 is most stable and CuO the least. Therefore it is easiest to create metal from CuO and most difficult from La2O3 (HSC Chemistry 7, 1974 – 2013). ___________________________________________________________ 271
Figure 126: Standard free energy of formation of selected oxides, corresponding to the general reaction (2x/y)M + O2 = (2/y)MxOy kcal/mol (HSC Chemistry 7, 1974 – 2013). __________________________________________________________ 272
Figure 127: The use of C (red line producing CO(g)), CO(g) (magenta line producing CO2(g)) and H2(g) (dark blue line producing H2O(g)) as reductants kJ/mol (HSC Chemistry 7, 1974 – 2011). ___________________________________________ 273

17
Metal Recycling – Opportunities, Limits, Infrastructure
Figure 128: A simplified SiO2-FeO-CaO phase diagram showing the area that is molten at 1300 °C with an industrially safe range of Fe/SiO2 as shown (FACT Sage). _____ 275
Figure 129: A simplified SiO2-FeO-CaO phase diagram showing the area that is molten at 1250 °C and the operating point (FACT Sage). _____________________________ 276
Figure 130: A simplified SiO2-FeO-CaO phase diagram showing the area that is molten at 1300 °C with the operating point well within the molten slag area (FACT Sage). ___________________________________________________________ 277
Figure 131: General flowsheet of the Mintek Enviroplas process (Input flows are in green, output flows in red) (Denton et al., 2005). _____________________________ 281
Figure 132: Phase relationship in molten metal alloy and multi-oxide slag (ternary dia-gram) (FACT Sage; Castro et al., 2004; Castro et al., 2005; Reuter, 2011a; Reuter, 2009). __________________________________________________________ 283
Figure 133: The effect of different alumina levels (from aluminium in e-waste) on the slag liquidus temperature, on solids in solution as a function of tempera-ture, and on oxygen partial pressure of a typical slag (FACT Sage; Reuter et al., 2011b). _____________________________________________________________ 284
Figure 134: The stability of some of tin (Sn) and indium (In) oxides under different op-erating conditions: (a, left) shows more reducing conditions while (b, right) shows more oxidizing conditions (HSC Chemistry 7, 1974 – 2013; Outotec). ______ 284
Figure 135: The distribution of indium and copper between metal and slag as a func-tion of lime addition at 1300 oC, Fe/SiO2 = 1.1-1.2 and log(pO2) = -7 (Anindya et al., 2011). ____________________________________________________________ 285
Figure 136: Ellingham Diagram for the Stability of various compounds in e-waste – the bottom compounds being the most stable (HSC Chemistry 7, 1974 – 2013; Outotec). ______________________________________________________________ 285
Figure 137: Eh-pH diagram for an aqueous electrolyte showing the behaviour of differ-ent dissolved elements, which are subsequently recovered by various refin-ing processes (HSC 1974 – 2013). __________________________________________ 286
Figure 138: Using computational fluid dynamics for optimizing conditions within fur-naces (which can be 10 – 40 m high) – this drives process understanding to its limits and maximizes resource efficiency (Huda et al., 2012). _______________ 287
Figure 139: Manipulating conditions within a TSL to achieve desired metal production and energy recovery, recycling and waste processing (www.outotec.com). ______ 288
Figure 140: Recycling lithium-ion batteries (Recupyl SAS). ______________________________ 289

18
Metal Recycling – Opportunities, Limits, Infrastructure
List of TablesTable 1: Compatibility matrix as a function of metallurgical recovery (van Schaik
and Reuter, 2012; Reuter and van Schaik, 2012a&b) (PMs: precious metals; PGMs: platinum group minerals). _________________________________________ 26
Table 2: Rare Earth Elements, their estimated supply and demand in 2016, and pro-jected shortfalls (Lynas Corporation, 2011). _________________________________ 42
Table 3: Growth in element use projected to 2030. The 2006 and 2030 indicators show the proportion of ETRD compared to 2006 production, e. g. Ga: Indica-tor 2006 = 28/152 = 0.18 and Indicator 2030 = 603/152 = 3.97) (EU, 2010; BGR, 2010). ____________________________________________________ 43
Table 4: The scrap value of office equipment and a simplified cost breakdown for a PC with value of about 1100 1/tonne, including the weight and value of vari-ous parts, in 2012 (Hieronymi, 2012). _______________________________________ 46
Table 5: Steel-can recycling rates, left, and steel-recycling rates by sector in the USA (Worldsteel 2012; Yellishetty et al., 2011). ______________________________ 47
Table 6: Some average data for petrol and diesel vehicles (Nemry et al., 2008). __________ 56
Table 7: Average composition of a car (Nemry et al., 2008) and changing alumini-um content (International Aluminium Institute, 2007) to mitigate the weight gain of vehicles. _________________________________________________________ 57
Table 8: The use of different metal/elements in EEE. _________________________________ 68
Table 9: E-waste generation in different countries (Ongondo et al., 2011). _______________ 69
Table 10: Value versus weight distribution of different materials in various devices (Hagelüken et al., 2009). __________________________________________________ 71
Table 11: Examples of composition of mobile phones, PCs and laptops and the im-pact on ‘metal demand’ based on 2010 sales (UNEP, 2009; Hagelüken and Corti, 2010). _____________________________________________________________ 73
Table 12: World mine production, electrical and electronic equipment (EEE) demand and application relative to mine production for several critical elements. Values exceeding 100 % are due to recycling. Metal prices from Metal Bul-letin, Mine production from USGS (Ru from Johnson-Matthey, 2011), (see some recent metal prices Sept/Oct 2011 reflecting the large possible changes). __ 79
Table 13: The use of rare earth elements (REE) in 2012 and projected demand and growth by 2016 (Lynas Corporation, 2011). __________________________________ 81
Table 14: The selection of technology in various recycling plants (Vermeulen et al., 2011). _________________________________________________________________ 103
Table 15: Comparison of precious metals recovery rates from suitable material streams after pre-processing. ____________________________________________ 104
Table 16: A brief overview of earnings and costs for a 1000 tpa NiMH battery recy-cling facility (Müller and Friedrich, 2006). __________________________________ 120
Table 17: Recovery rates for gold and palladium achieved by recovery processes of the formal sector (Chancerel, 2010). _______________________________________ 127
19
Metal Recycling – Opportunities, Limits, Infrastructure
Table 18: Various recovery rates for end-of-life vehicles (ELVs) depending on the ob-jective function of the system optimization model (Ignatenko et al., 2008). ______ 129
Table 19: A table of challenges in separation still required in WEEE recycling. ___________ 136
Table 20: The benefits of recycling (International Aluminium Institute and Brazilian Association of Aluminium www.abal.org.br). ________________________________ 138
Table 21: Compatibility matrix for materials in a car, showing compatible and incom-patible metals in terms of recovery (Castro et al., 2004, 2005; Reuter et al., 2005). _________________________________________________________________ 158
Table 22: Possible approaches to EPR and examples (OECD, 2001). ____________________ 169
Table 23: Typical analyses of zinc residues (International Zinc Association, 2001 – 2002). __ 188
Table 24: Average composition of zinc concentrates obtained in flotation also show-ing the mineralogical and thermodynamic basis for the Metal-Wheel (see Zn-pie) (Grant, 1993). ____________________________________________________ 189
Table 25: Typical Zn and Pb containing recycled raw materials (Schneider et al., 2000). ___ 190
Table 26: Typical analyses of the raw materials and products of a Waelz kiln (Meurer, 2010). _________________________________________________________ 191
Table 27: Composition of major zinc drosses and ashes (James, 2000). _________________ 192
Table 28: Composition of ASR light and heavy fluff for different operators (Numbers in brackets refer to references in Vermeulen et al. 2011). _____________________ 196
Table 29: A typical cost breakdown of an ELV dismantler (Ferrão and Amaral, 2006). ______ 198
Table 30: Tungsten scrap in pyrometallurgy (Lassner and Schubert, 1999). ______________ 206
Table 31: World reserves, demand for EEE, mine production and the amount by weight (g) of metals in different WEEE categories (Ongondo et al., 2011). _______ 212
Table 32: Percentage of printed wire board (PWB) and precious-metal contents in di-verse electrical equipment (Chancerel et al., 2009; Chancerel and Rotter, 2009a; United Nations University, 2007; Wecycle, 2011; Witik et al., 2011). ______ 213
Table 33: The average composition of PWBs in fractions (total=1) of the various WEEE categories (United Nations University, 2007). _________________________ 215
Table 34: Various elements in e-waste, and their application, typical concentration and emission (Williams et al., 2008). _______________________________________ 216
Table 35: Average composition of a PC (European Commission DG Environment, 2006). ___ 217
Table 36: Composition of CRT TVs based on different literature sources. ________________ 219
Table 37: Calculated “critical” materials in CRT TVs (Van Schaik, 2011). _________________ 220
Table 38: Composition of mobile phones from various sources. ________________________ 222
Table 39: Average composition of various white goods (Wecycle, 2011; Van Schaik, 2011). _________________________________________________________________ 223
20
Metal Recycling – Opportunities, Limits, Infrastructure
Table 40: Variation in the composition of washing machines and large white goods from various literature sources. __________________________________________ 224
Table 41: Summary of data and calculated amount of REOs per lamp (Van Schaik, 2011). __ 225
Table 42: Calculated mass of REOs in EU27 (Van Schaik, 2011 based on data by Chemconserve, 2011; United Nations University, 2007). ______________________ 225
Table 43: Production, demand and use of REOs in 2010 (Van Schaik, 2011 based on data by United Nations University, 2007; European Lamp Companies Fed-eration, 2009; Hoek van den et al. 2010). ___________________________________ 226
Table 44: Material compositions of some battery types by weight. _____________________ 228
Table 45: Battery-chemistry for different battery types. _______________________________ 229
Table 46: Table with metal-recycling-loop examples (Dubreuil et al.,2010). ______________ 263
Table 47: Common compounds in a slag and their melting points (HSC Chemistry 7). Note that due to various crystalline forms of SiO2 a lower value of 1600 °C is given. For CaO a value of 2572 °C is reported showing some variations in data. 274
Table 48: Common compound mixtures in a slag (see Figure 128 and Figure 129) and their melting points and Fe/SiO2 ratios (HSC Chemistry 7). ___________________ 274

21
Metal Recycling – Opportunities, Limits, Infrastructure
List of BoxesBox 1: Alloys _________________________________________________________________ 54
Box 2: Car recycling ___________________________________________________________ 55
Box 3: Material-Centric Approaches _____________________________________________ 63
Box 4: Various elements used in WEEE ___________________________________________ 68
Box 5: The Houthalen-Hechteren landfill in Belgium _______________________________ 77
Box 6: Cell-phone recycling attitudes ____________________________________________ 88
Box 7: “Circular Economy” policy in China ________________________________________ 91
Box 8: The effect of joints on liberation ___________________________________________ 97
Box 9: Steel recycling _________________________________________________________ 107
Box 10: Aluminium recycling (European Aluminium Association, 2006) ________________ 110
Box 11: SuperLightCar _________________________________________________________ 114
Box 12: The influence of economics: Indium in LCD screens _________________________ 123
Box 13: Predictability of input streams ___________________________________________ 134
Box 14: Recycling of aluminium in Brazil - income generation as the main motivation __ 138
Box 15: Mobile-phone recycling in India and China _________________________________ 141
Box 16: Steps by the aluminium industry for recycling non-ferrous materials from Municipal Solid Waste (MSW) ____________________________________________ 150
Box 17: Available tools for constructing multi-level recycling models _________________ 153
Box 18: Physics-based simulators _______________________________________________ 156
Box 19: The SuperLight Car _____________________________________________________ 160
Box 20: EU WEEE and WEEE-2 Directive __________________________________________ 170
Box 21: AEB Amsterdam _______________________________________________________ 200
Box 22: Iron recovery from Basic Oxygen Furnace (BOF) steel slags __________________ 203
Box 23: A theory for modelling recycling systems __________________________________ 252
Box 24: How to build improved models for aluminium recycling – Multi-level simulation 258
Box 25: Exergy of a smelter _____________________________________________________ 281
Box 26: Pyrometallurgy: maximal recovery of materials into a valuable liquid metal phase ___________________________________________________________ 282
Box 27: Hydrometallurgy: maximal recovery of materials into a valuable aqueous phase ________________________________________________________ 286
Box 28: Recycling of gallium-arsenide on a printed wire boards vis-à-vis steel bev-erage can recycling _____________________________________________________ 286
Box 29: A final example – recovery of all constituents from a cup of coffee ____________ 289
Box 30: A final example - recycling of lithium ion batteries _________________________ 289

Geological Copper MineralChalcopyrite CuFeS2
More than
15 Minors e.g. Au, As, Pd, Se, etc.
Designed Copper “Mineral”
More than
40 ElementsComplexly Linked as Alloys, Compounds etc. for Product Functionality Reasons
GeologicalLinkages
MaterialConnections
JoinedMaterials
Product Design and Material Combina-tions Create New “Minerals”
22
Metal Recycling – Opportunities, Limits, Infrastructure
Figure 1:
Product Centric Recycling: Application of economically viable technology and methods throughout the recovery chain to extract metals from the complex interlinkages within designed “minerals” i. e. products, gleaning from the deep know-how of recovering metals from complex geological minerals.
23
Metal Recycling – Opportunities, Limits, Infrastructure
Executive Summary
Metal recycling is a complex business that is becoming increasingly difficult! Recycling started long ago, when people realized that it was more resource- and cost-efficient than just throwing away the resources and starting all over again. Until recently, such relative-ly straightforward recycling concentrated on specific materials, including metals, as most products were relatively simple; this form of recycling follows the so-called Material (& Metal)-Centric (MMC) approach.
However, thanks to the increasingly sustain-ability enabling technological advancement of the 21st Centuries, products have become increasingly complex, mixing almost any im-aginable metal or other material. Recycling these products became increasingly difficult as trying to recover one material would of-ten destroy or scatter another, and it became clear that we needed a Product-Centric ap-proach. Here, recycling targets the specif-ic components of a product, devising ways to separate and recover them. To do this for metals, recyclers increasingly seek the help and expertise of metal miners, who extract mineral ores often containing several met-als and have developed ways and means of recovering the metals of interest via com-plex methods that are based on physical and chemical principles.
Apart from the technological complexity, as always, the basic problem is whether it will pay. And, if not, and as we need the metal anyway, how can we make it pay?
In this report, we discuss how to increase metal-recycling rates – and thus resource ef-ficiency – from both quantity and quality view-points. The discussion is based on data about recycling input, and the technological infra-structure and worldwide economic realities of recycling. Decision-makers set increasing-ly ambitious targets for recycling, but far too much valuable metal today is lost because of the imperfect collection of end-of-life (EoL) products, improper practices, or structural
deficiencies within the recycling chain, which hinder achieving our goals of high resource efficiency and resource security, and of bet-ter recycling rates.
The report consists of seven chapters and six appendices. The chapters deal, successively, with:
1. A brief overview of the factors affecting recycling.
2. Recycling opportunities.
3. Limiting factors in recycling.
4. Consequences of limiting factors.
5. Infrastructure for optimizing recycling.
6. Tools to aid decision making.
7. Policy drivers and recommendations for recycling.
The appendices highlight some of these sub-jects, including a last section on the physics and thermodynamics underlying extractive metallurgy.
These practical considerations are the basis for recommendations to decision-makers, some of which turn existing policy approach-es on their head. We particularly focus on the recycling of high-value, low-volume metals that are essential elements of existing and future high-tech products. Such metals are often scarce, but essential for sustainable growth, though typically lost in current recy-cling processes.
Factors affecting recycling
For many purposes, the above-mentioned MMC and Product-Centric approaches of re-cycling can be considered together. Howev-er, designing recycling systems from a purely Product-Centric viewpoint needs a good un-derstanding of separation physics, thermody-namics and metallurgy, as well as of the as-

24
Metal Recycling – Opportunities, Limits, Infrastructure
sociated economics, in order to innovate and optimize product design. Figure 2 illustrates this, describing some of the major factors that increase resource efficiency by maxi-mizing recycling rates.
Increasing metal-recycling rates is possible when considering and applying a Product-Centric approach of which the MMC approach is a subset. A Product-Centric approach is far better in considering the complex interac-tions in a recycling system than just an MMC approach, as it contemplates how to improve the recycling of an entire EoL product. It also assesses what comes out of the system, in order to minimize the losses from each step, thus quantifying the economic feasibility of a potential recycling chain, and, ultimately, for awarding operating licences to the stake-holders involved. It takes its cue from classi-cal extraction of metals from geological min-erals; where the objective has always been to maximize recovery of all elements into eco-nomically valuable products, while maximiz-ing energy recovery and minimizing the crea-tion of residues.
Three interrelated factors determine the suc-cess of recycling and maximize resource ef-ficiency:
1. The recycling processes and the major physical and chemical influences on the metals and other materials in the pro-cessing stream.
2. The collection and pre-sorting of waste.
3. The physical properties and design of the end-of-life products in the waste streams.
While reading this document consider the three points above and consider the techno-logical and economic challenge of produc-ing pure water, sugar, milk and coffee from a cup of coffee – a consumer product. This illustrates the complexity of recycling, the ef-fect of dissolution of metals in each other and then separating them into pure or alloy prod-ucts of economic value as shown by Figure 2.
RecourceMaterials
CrushingComminutionThickening
Resource Efficient Metallurgy Metals Prozessing & Energy Recovery
ConcentrationMetal & ConsumerProduct Centric System
Recycling
Residues | Sludges | Plant Footprint | WaterEnergie | Materials etc.
Emmisions | Residues | Energy | Plant Footprint Availability | Unutilized Resources Cost & Product Driven etc.
Water RecyclingReagents
Plant Footprint etc.
EoL Scrap | ConsumerProduction Scrap Collection | Legislation etc.
Figure 2:
The best footprint of sustainability
and resource efficiency may
be achieved by reducing
losses during processing by
bringing together the various
stakeholders, thus minimizing
the use of resources in their
widest sense. No society can truly achieve a “closed-loop” status; there
will always be some loss and
economic growth implies more raw-material
needs; therefore, Figure 2 shows
how this footprint is affected by the various activities
of transforming raw materials.
25
Metal Recycling – Opportunities, Limits, Infrastructure
It is impossible to optimize one factor with-out considering the others. To get the best results out of recycling, product designers, collectors and processors must know what is happening in the other parts of the system, which requires a multi-faceted approach that considers all metals, compounds, and other materials.
Recycling saves resources, as it strength-ens the primary supply from primary mining by using the resources temporarily locked up in “urban minesa”. Especially ‘critical’ ele-ments, not abundant in nature, must be pre-served and reused as much as possible.
An added advantage is that the energy con-sumption of metal recovery from recycled sources is usually less than that of primary production, as recycling often “only” involves the re-melting of metals. In addition, a re-source-efficient system minimizes water use and maximizes the quality of wastewater be-fore discharge.
The basic assumption of recycling is that the value of the recovered (and other materi-als) has to pay for all collection, dismantling, sorting and other recycling activities. The economics of such recycling is based on es-timating the true value of recyclates from the best recovery of refined metals, alloys and compounds.
Recycling is thus driven by the value of the recovered metal (and material). In any case, all metallurgical plants always try to recover all valuable elements. If there is an economic incentive, recovery will happen.
a The word “urban mine” has been used for some years and has been registered since many years e.g.
Details for Australian Trademark No. 1371937. Number Australian Trademark No. 1371937. Mark URBAN MINE. Owner RECUPYL SAS. Service Refer to WIPO Address for Correspondence. Filingdate in Australia 16 March 2010. The applicant has advised that the English translation of
the words appearing in the trade mark is URBAN MINE.
Another point of great importance is that modern product design should consider the complexity of recycling such products. If pos-sible, the design should avoid incompatible metal mixtures, or joints between product parts that hinder recycling. This is not always possible, because the primary function of the product will always prevail, but, if necessary, policy should reinforce this point.
In summary, we discuss how the environ-mental footprint of society is minimized by maximizing resource efficiency on an eco-nomic and technological basis.
Above, mention was made of the fact that many modern products are incredibly com-plex. Table 1, below, illustrates this fact for a few “household” objects.

26
Metal Recycling – Opportunities, Limits, Infrastructure
Opportunities and limiting factors in recycling, and their consequencesIf each product were made from a single sub-stance, recycling would be relatively simple and its interactions linear, up and down the ‘recycling chain’. However, the reality is that many products contain several metals, and their alloys and compounds. Several ‘recy-cling chains’ are thus necessary from end-of-life (EoL) product to metal, which will in-teract because of the functional connections of these materials. This creates a multi-di-mensional system, whose level of complex-ity must be clear to stakeholders and policy makers.
Figure 3 shows these complex interactions, which are in fact partly bi-directional along the chain. It also shows that the metals and alloys arriving at recycling operations are al-most always mixed with other materials and compounds, including plastics and other modern materials, such as composites, fill-ers and paints. These materials all have a monetary value that increases with their pu-rity, affecting treatment charges incurred by custom smelters and processors of the recy-clates. However, they can also negatively af-fect the processing in a physical and chemi-cal sense.
Table 1:
Compatibility matrix as a function of
metallurgical recovery (van
Schaik and Reuter, 2012;
Reuter and van Schaik, 2012a&b)
(PMs: precious metals; PGMs:
platinum group metals).
Recovery possibleIf separatly recovered and/or if there is appropriate technology and recovery available.
Recoverabilityper application
Washing machineLarge Hh ApplianceVideo recorderDVD playerHifi unitRadio setCRT TVMobile telephoneFluorescent lampsLEDLCD screensBatteries (NiMH)
Limited recovery under certain conditions
Washing machineLarge Hh ApplianceVideo recorderDVD playerHifi unitRadio setCRT TVMobile telephoneFluorescent lampsLEDLCD screens
Batteries (NiMH)
No separate Recovery
For a combination of colours, e. g.
Washing machineLarge Hh ApplianceVideo recorderDVD playerHifi unitRadio setCRT TVMobile telephoneFluorescent lampsLEDLCD screensBatteries (NiMH)
Ag Au Pd Pt Y Eu Other Sb
OtherRare Earth (Oxides)PGMsPMsCo In Ga W Ta
If separatly recovered. Partial or substantial losses during separation and/or processing/metallurgy. Recovery if appropriate systems exist.
Pure recovery not possible. Lost in bulk recyclates during separation and/or during metallurgy into different non-valuable phases.
Depending on the process route followed, high recovery rates as well as high losses are possible. Hence a careful attention to design, infrastructure,legislation etc. is necessary. This is especially possible for metals closely linked where one metal can be recovered while the other due to this selection of recovery then goes lost. This is driven by thermodynamics, technology, design etc.
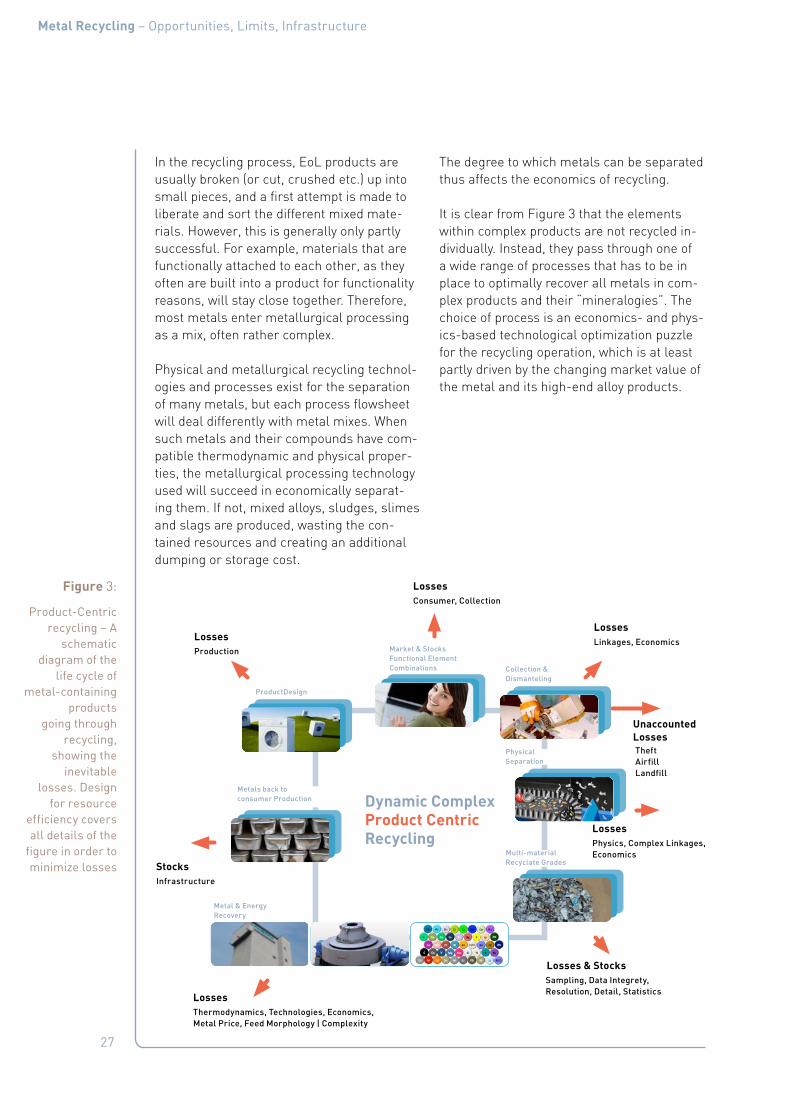
27
Metal Recycling – Opportunities, Limits, Infrastructure
In the recycling process, EoL products are usually broken (or cut, crushed etc.) up into small pieces, and a first attempt is made to liberate and sort the different mixed mate-rials. However, this is generally only partly successful. For example, materials that are functionally attached to each other, as they often are built into a product for functionality reasons, will stay close together. Therefore, most metals enter metallurgical processing as a mix, often rather complex.
Physical and metallurgical recycling technol-ogies and processes exist for the separation of many metals, but each process flowsheet will deal differently with metal mixes. When such metals and their compounds have com-patible thermodynamic and physical proper-ties, the metallurgical processing technology used will succeed in economically separat-ing them. If not, mixed alloys, sludges, slimes and slags are produced, wasting the con-tained resources and creating an additional dumping or storage cost.
The degree to which metals can be separated thus affects the economics of recycling.
It is clear from Figure 3 that the elements within complex products are not recycled in-dividually. Instead, they pass through one of a wide range of processes that has to be in place to optimally recover all metals in com-plex products and their “mineralogies”. The choice of process is an economics- and phys-ics-based technological optimization puzzle for the recycling operation, which is at least partly driven by the changing market value of the metal and its high-end alloy products.
Figure 3:
Product-Centric recycling – A
schematic diagram of the
life cycle of metal-containing
products going through
recycling, showing the
inevitable losses. Design
for resource efficiency covers all details of the
figure in order to minimize losses
Dynamic Complex Product Centric Recycling
Losses
Stocks
Losses & Stocks
Losses
Losses
Losses
Losses
Production
Infrastructure
Sampling, Data Integrety,Resolution, Detail, Statistics
Physics, Complex Linkages,Economics
TheftAirfillLandfill
Consumer, Collection
Thermodynamics, Technologies, Economics,Metal Price, Feed Morphology | Complexity
Linkages, EconomicsMarket & StocksFunctional Element Combinations Collection &
Dismanteling
Metals back to consumer Production
Product Design
Multi-materialRecyclate Grades
Metal & EnergyRecovery
Physical Separation
UnaccountedLosses

28
Metal Recycling – Opportunities, Limits, Infrastructure
Infrastructure for optimizing recycling
The Product-Centric approach (Figures 2 to 4) is an example of the practical applica-tion of several physics-based systems to a complex multi-dimensional issue, with strong implications for public recycling policy. It suggests that, for optimizing recycling, the following conditions and infrastructure have to exist:
■ BAT: EoL, waste, and residue streams des-tined for recycling must be processed by Best Available Technique (BAT), accord-ing to specific performance standards and being mindful of environmental and social costs and benefits. These BATs can differ between products and regions, and do not need to be high technology per se. They may include hand sorting in the earlier steps of the recycling chain, thus creating jobs. Where waste streams enter uncon-trolled flows or less suitable processes, value will be lost and the environmental impact may be severe.
■ POLICY: Targets must align with the eco-nomic drivers of a complete system. With so many operators in the collection and recycling industry, enforcing regulations is unlikely to be sufficient for steering the destination of metal-containing waste streams. Policy must create the econom-ic incentives for waste to be handled by registered BAT operations, rather than by ‘grey’ recycling, or even improper practice. Economic drivers must align with long-term economic goals, such as conserving critical metal resources for future appli-cations, even if their recovery currently is uneconomic. Policy targets should con-sider the “loss” of metals due to a complex recyclate composition. Policies should nei-ther exceed what is physically and thermo-dynamically possible, nor prioritize one or two metals at the inadvertent expense of other metals found in the input stream.
■ KNOWLEDGE: The metallurgical recycling industry has the knowledge needed for linking BAT processes so that they sepa-rate a maximum of valuable metals and create a minimum of secondary residues. Successful and resource-efficient met-al producers generally aim at producing a wide range of metals, rather than focus-ing on one or two metals as their produc-tion output.
■ INCENTIVES: They exist for all participants in recycling – from product design to pur-chasing recycled metal – to work with the other participants in the system for im-proving the recycling performance of the system as a whole. Practical ways exist for improving information flow between the participants; for example, producer-re-sponsibility laws motivate a product man-ufacturer to innovate in recycling-process technology for meeting recycling targets. Such incentives can be purely legislative or purely economic, but work best as a com-bination of policy and profit.
■ MODELLING: Physics-based-modelling and simulation of how products recycle can help designing a product that facili-tates recycling, based on how products and their constituents break up and separate in BAT recycling processes. Such design goes beyond “design for disassembly” and “design for recycling”, to become “design for resource efficiency”. Here disassembly breaks down complex products into com-ponents or subassemblies that then can be directed into more suitable recycling processes, such as the easy removal of a circuit board from a plastic, aluminium or steel housing.
The report discusses the facts behind these required conditions and their implications for policy.
29
Metal Recycling – Opportunities, Limits, Infrastructure
Tools to aid decision-making
Various tools exist for supporting decision-making to maximize resource efficiency. What needs further development is a rig-orous multiphysics basis that clearly links the stakeholders within the Product-Centric chain as shown in Figures 2 and 3. Existing physics-based tools cover separation physics as well as thermodynamics, various simula-tion approaches and life-cycle assessments. Multiphysics is a new concept, covering stud-ies that combine hitherto separate physics-based tools, generating relational mathe-matical models and validating them experi-mentally to improve our understanding of natural systems.
A major new tool is the Metal Wheel, a sim-plified version of which is shown in Figure 4. The wheel is separated into slices, one for each basic metal used by society or Carrier Metal, and showing its main BAT processing route. The light-blue, white and green rings show the main potentially valuable elements associated with this Carrier Metal (CM). The first contains mostly metallic elements that dissolve in CM (generally using pyrometal-lurgy), the white ring contains compound el-ements mostly treated by hydrometallurgy, and the green ring shows associated ele-ments that are generally lost in waste.
The available computer-based tools can be ranked in several classes. The most impor-tant are:
■ Liberation modelling, when coupled with modelling of the thermodynamics of a specific processing plant, allows defin-ing recyclate grades and thus the resulting economic value. Design for Resource Effi-ciency (DfRE), of which Design for Recy-cling (DfR) is a sub-set, demands knowl-edge of liberation behaviour (particulate quality of recyclates; separation efficien-cy; compatibility and recovery and/or loss of material) as a function of design choice, connection type and connected materials.
■ Life Cycle Assessment or LCA is a tool that facilitates understanding and quan-tification of the ecological and human-health impacts of a product or system over its complete life cycle. It must be linked to rigorous simulation tools to quantify re-source efficiency.
■ Design for Sustainability requires product designers to assess which material prom-ises the best sustainability performance, for example with regard to energy efficien-cy combined with other factors like recy-clability, durability, etc., by taking a life cycle perspective. Products must be de-signed such that compatible groupings of metals are easy to dismantle to be directed into the correct metallurgical processing infrastructure.
■ Life Cycle Management, LCM, is a busi-ness approach that can help companies achieving sustainable development. It helps reducing, for instance, a products’ carbon, material and water footprints, as well as improving its social and economic performance. LCM is about making life-cy-cle thinking and product sustainability op-erational for businesses that aim for con-tinuous improvement.

30
Metal Recycling – Opportunities, Limits, Infrastructure
The usual basis for any bankable feasibil-ity study at the heart of all process design is a thorough description of the Product-Centric recycling system. This requires rigorous simu-lation, including closure of all mass balances of not only the bulk materials, but also of the elements contained in organic and inorgan-ic compounds and alloys. The energy balance has to be closed as well, showing the details
of all inflow and outflow for quantification of the streams. This detail is required to deter-mine the environmental impact of all recycling streams. Nothing less rigorous will provide in-novative solutions for a sustainable future.
Figure 5 shows how rigorous process sim-ulation and design models for complex flowsheets are linked to environmental soft-
Figure 4:
The “Metal Wheel”, based on
primary metal-lurgy but equally
valid for metals recycling reflects
the destina-tion of different
elements in base-metal minerals as a function of
interlinked met-allurgical process
technology. Each slice represents
the complete infrastructure for base- or Carrier-
Metal refining. As there are so many different
combinations of materials in End-of-Life products,
only physics-based modelling
can provide the basis for valid predictions. In
essence, primary metallurgy is
situated in a seg-ment a complete
processing plant, while the com-plexity of con-
sumer product mineralogy
requires an in-dustrial eco-
logical network of many metallurgi-
cal production infrastructure
to maximize recovery of all
elements in end-of-life products (Reuter and van
Schaik, 2012a&b; Ullmann’s Ency-clopaedia, 2005).
Mainly Element Lost, not always compatible with Carrier Metal or Product Detrimental to properties and cannot be economically recovered from e.g. slag unless e.g. iron is a collector and goes to further processing.
Dissolves mainly in Carrier Metal if Metallic (Mainly to Pyrometallurgy) Valuable elements recovered from these or lost (metallic, speiss, compounds or alloy in EoL also determines destination as also the metallurgical conditions in reactor).
Compounds Mainly to Dust, Slime, Speiss, Slag (Mainly to Hydrometallurgy) Collector of valuable minor elements as oxides/sulphates etc. and mainly recovered in appropriate metallurgical infrastructure if economic (EoL material and reactor conditions also affect this).
Mainly to Benign Low Value Products Low value but inevitable part of society and materials processing. A sink for metals and loss from system as oxides and other compounds. Comply with strict environmental legislation.
Mainly Recovered Element Compatible with Carrier Metal as alloying Element or that can be recovered in subsequent Processing.
Mainly Element in Alloy or Compound in Oxidic Product, probably Lost With possible functionality, not detrimental to Carrier Metal or product (if refractory metals as oxidic in EoL product then to slag / slag also intermediate product for cement etc.).
Mainly Element Lost, not always compatible with Carrier Metal or Product Detrimental to properties and cannot be economically recovered from e.g. slag unless e.g. iron is a collector and goes to further processing.
RE
ThO2
Li2O
FeOx
FeOx
TiO2
TiO2
SiO2
SiO2
SiO2
SiO2
SiO2
SiO2
SiO2
AIXy
CaXy
SiXy
MgO MgO
MgO
MgO
MgO
MnO
MnO
MnO
CaO
CaO
CaO
CaO
CaO
CaO
CaO
SrO
SrO
MgO
TiO2
ThO2
ZrO2
ZrO2
ZrO2
FeOx
FeOx
V2O5
V2O5
V2O5
Al2O3
Nb2O5
Sb2O3
Ga2O3
Ta2O5Al2O3
Al2O3
Al2O3
Al2O3Al2O3
Al2O3
Ga/As
F/ClBr
InIn2O3
Ta2O5
Nb2O3
In2O3Ga2O3
Cu2ONiO
NiCo
TaNb V
WTiCr
Ta2O5
Nb2O3
InIn2O3
K/Na
Al2O3
FeOxCaF2
FeOx
FeOx
P2O5
WO3
WO3
BaO
RE(O)s
TiO2 ZrO2
CaF2
WO3
REOs
REs
REOs
REOs
REOs
CaO REOs BaOMgO
BaO
REs
REs
Hg
HgCl
Cl
El
Cl
Na
Na
K F
B
F
F
P
P
P
BiAg
Ag
Au
Au
Pt
Pt
Rh
MoCo
Co
Cd
Cd
Zn
Cu In
Sb
Fe
Ni
Cr
Te
PdAg
Al
AlZr
Th
As
AsAs
Cd
Cd
Pb
Mo Si
Pb
Pb
Pb
Pb
ZnFe
Ti
Mn Si MgNiSn Cu
AgAu
Sb
Tr
Cr
SnMo
Si
ZrNbV
Cr
Al
PtPd
In
Zn
ZnCl
Ge
GaGe
Se
Sn
Sn
Bi
Bi
Fe
BrHg
Zn
Zn
Sb
Sb
Si
Sb
Au Sn
Th
Br
PtRh
Pd
P K
K
P
K
Na
Cu
Cu
Cu
Ni
Co
Bi
SrOKCl
SrO
AlTi
Li
Zn
REPb
Sn
Fe
Cu/Ni
MgMn
Ni/Cr
El
El
RemeltRefine
Smelt/RefineSmelt/Refine
Stainless Steel
TRIP SteelAustenitic
RLE/Fume
SmeltRefine
PyroMetallurgyRemelt
Hydro MetallurgyRemelt
Hydro-Metallurgy
Special BatteryRecycling
Hydro&Pyrometallurgy
Steel (BOF&EAF)
ProductEoLAn
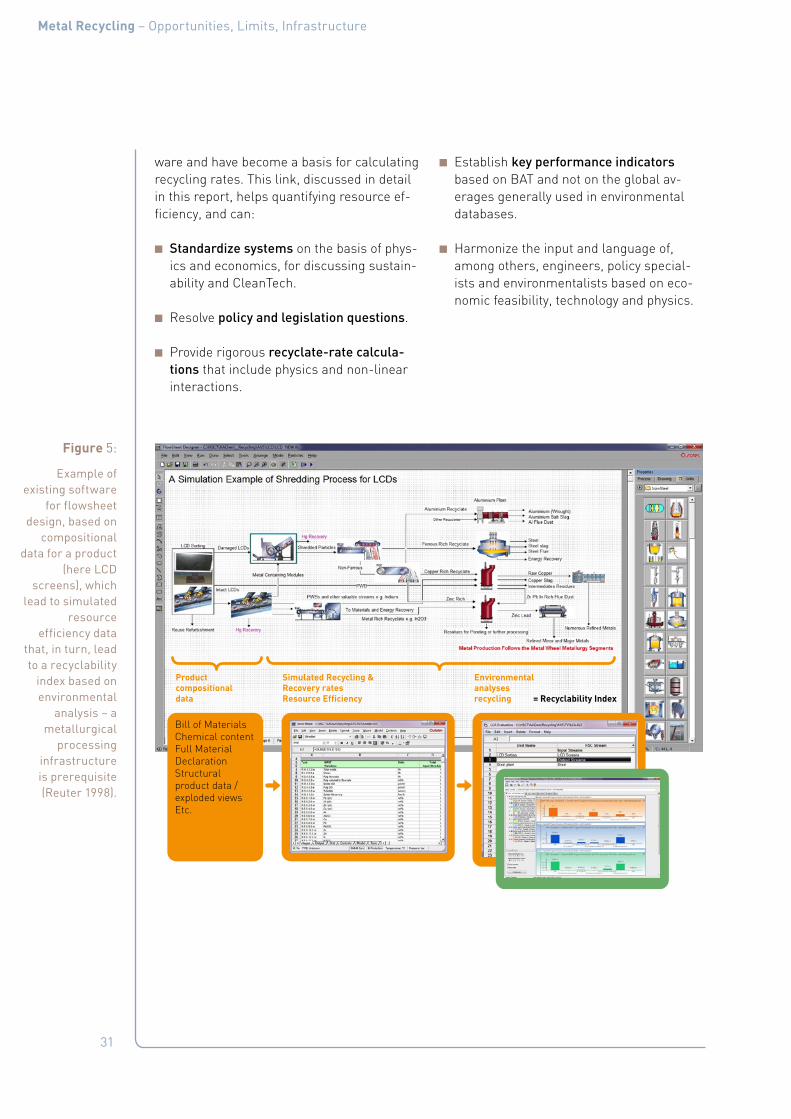
31
Metal Recycling – Opportunities, Limits, Infrastructure
ware and have become a basis for calculating recycling rates. This link, discussed in detail in this report, helps quantifying resource ef-ficiency, and can:
■ Standardize systems on the basis of phys-ics and economics, for discussing sustain-ability and CleanTech.
■ Resolve policy and legislation questions.
■ Provide rigorous recyclate-rate calcula-tions that include physics and non-linear interactions.
■ Establish key performance indicators based on BAT and not on the global av-erages generally used in environmental databases.
■ Harmonize the input and language of, among others, engineers, policy special-ists and environmentalists based on eco-nomic feasibility, technology and physics.
Figure 5:
Example of existing software
for flowsheet design, based on
compositional data for a product
(here LCD screens), which
lead to simulated resource
efficiency data that, in turn, lead to a recyclability
index based on environmental
analysis – a metallurgical
processing infrastructure is prerequisite (Reuter 1998).
Product compositional data
Simulated Recycling & Recovery rates Resource Efficiency
Environmental analyses recycling = Recyclability Index
Bill of MaterialsChemical contentFull Material DeclarationStructural product data / exploded viewsEtc.

32
Metal Recycling – Opportunities, Limits, Infrastructure
In summary, a whole set of tools is availa-ble to help decision-makers understand the recycling system, assess how they can best increase recycling, and facilitate the informa-tion exchange between stakeholders. Each of these tools provides an easy way for decision-makers to access the detailed information usually held by industry-sector experts. Such tools enable the decision-makers in one part of the recycling system (designers or metal processors, for example) to arrive at better
predicting the results of the system of any changes that they would make, such as in-vestments in new technology.
A final observation: true Design for Recy-cling can only take place with tools that are based on a rigorous application of physics, thermodynamics and process technology, as reflected by, for example, Figure 6.a
Figure 6:
Resource cycles are linked by
flowsheeting and simulation tools
(Reuter 1998 & 2011) based on
rigorous physics before inter-
actively linking them to environ-
mental-impact assessment
software (HSC Sim and GaBi).
BAT, Flow Sheets & Recvcling System MaximizingResource Efficiency – Benchmarks$US / t Product (CAPEX & OPEX)Recyclability lndex (based on system simulation of whole cycle)
• GJ & MWh/ t Product (source specific) and Exergy• kg CO2 / tProduct• kg SO2 /tProduct• g NO2 /tProduct• m3 Water /t Product (including ions in solution)• kg Residue /t Product (including composition)• kg Fugitive Emissions /t Product• kg Particulate Emissions /t Product• Etc.
Environmental Indicators based on BATDriving Benchmarks of Industry
• Global Warming Potential (GWP)• Acidification Potential (AP)• Eutrification Potential (EP)• Human Toxicity Potential (HTP)• Ozone Layer Depletion Potential (ODP)• Photochemical Ozone Creation Potential (POCP)• Aquatic Ecotoxicity Potential (AETP)• Abiotic Depletion (ADP)• Etc.
a 7th Principle of the Earth Charter (www.earthcharterinac-tion.org): Adopt patterns of production, consumption, and reproduction that safeguard Earth’s regenerative capaci-ties, human rights, and community well-being.
1. Reduce, reuse, and recycle the materials used in pro-duction and consumption systems, and ensure that re-sidual waste can be assimilated by ecological systems.
2. Act with restraint and efficiency when using energy, and rely increasingly on renewable energy sources such as solar and wind.
3. Promote the development, adoption, and equitable trans-fer of environmentally sound technologies.
4. Internalize the full environmental and social costs of goods and services in the selling price, and enable con-sumers to identify products that meet the highest social and environmental standards.
5. Ensure universal access to health care that fosters repro-ductive health and responsible reproduction.
6. Adopt lifestyles that emphasize the quality of life and ma-terial sufficiency in a finite world.
33
Metal Recycling – Opportunities, Limits, Infrastructure
Policy recommendations
Many of the world’s existing recycling poli-cies have grown out of environmental policy, and are often still under the jurisdiction of environmental ministries. This duly reflects the potential environmental benefits from increased recycling as well as the poten-tial harm from insufficient waste treatment. However, it can also obscure the fact that recycling is primarily an economic industri-al activity with a strong environmental and social implication, and is strongly affected, for better and for worse, by all policies that influence the costs and benefits of recycling. Waste- and recycling policies directly affect the cost of recycling processes (e. g. where environmental requirements change such processes) as well as the cost of alternatives to recycling, such as waste disposal. These policies also influence the availability and composition of waste streams for recycling. Relevant, too, are trade restrictions on waste or metals, and all policies regulating indus-trial activity such as taxation, labour regula-tion and energy costs. Governments should be conscious, in crafting and implementing such policies, of their impact on sustainable development.
Defining the system boundaries for which targets are stipulated is of critical impor-tance. Furthermore, weight-based targets hinder rather than promote recycling of the many critical elements in complex products, usually present in very low concentrations. In addition, priorities have to be set for dif-ferent metals, such as base metals, special metals, critical-technology metals, etc. This further highlights the dilemma of defining re-cycling targets for metals that are present in small quantities in products. Targets that go beyond what is thermodynamically possible for recycling are likely to fail and might lead to excessive energy consumption in efforts to meet the recycling target. Policy makers can set appropriate targets from a life cycle per-spective and by drawing on the expertise and tools available within the recycling industry.
A Product-Centric view helps understanding the tradeoffs between achieving high recy-cling targets and natural-resource depletion. If this product complexity is fully understood, this will improve the recycling of valuable critical and scarce elements, and the recy-cling rates of the commodity metals. Includ-ing a Product-Centric view of recycling into the discussion requires thorough rethinking of policies to ensure that resource efficiency is maximized.
Product design strongly affects the physical properties of the waste stream, as do collec-tion methods. Optimal recycling can only suc-ceed through increased physics-based De-sign for Recycling (DfR) or Design for Sus-tainability (DfS). This is better covered by the term Design for Resource Efficiency that is more economics based with links to Prod-uct-Centric recycling. Here, product design is based on, or at least cognisant of, recy-cling BAT (as concisely reflected by the Metal Wheel).
Optimal design for recycling and recycling systems demands good understanding of the limits imposed by physics, chemistry, ther-modynamics and kinetics, as well as by the technological, economic and social barriers and inefficiencies encountered. Functional-ity demands mean that this optimal design is not always possible; it might dictate that cer-tain metals and materials must be combined, rendering Design for Recycling inefficient.

34
Metal Recycling – Opportunities, Limits, Infrastructure
The information in this document leads to the following points that are relevant for policy formulation:
General perspectives
■ A wider, systemic, view of recycling must look at the environmental, industrial and economic factors driving recycling. Sim-plified approaches to recycling – speci-fying desired recycling outputs – will not adequately support a drive for resource efficiency. A linear, one-dimensional, ap-proach cannot deal with the complexity of interactions between metals, mixing of waste streams, and the economics behind processes.
■ For maximizing resource efficiency, a Product-Centric approach to recycling must be based on a good understanding of the physics of materials in products. This allows simultaneous consideration of the interactions, why and when they dynami-cally vary, and the economic value of the resulting recyclates, as well as the impact on resource conservation and environmen-tal sustainability.
■ Stimulating the use of BAT by certified operators raises the overall level of re-cycling. Quantitative computer models, based on the physics and economics of re-cycling with BAT, can be used for resolving complexity and guiding policy, thus replac-ing simple material-flow analysis.
■ As dictated by the Second Law of Ther-modynamics, there will always be losses from a recycling system. Concepts such as ‘Closing the loop’, ‘Circular Economy’ and ‘Cradle-to-Cradle’ represent unattainable ideal conditions, but they bring systemic thinking into material-efficiency discus-sions, and provide an upper limit to the po-tential economic benefits.
Economics of recycling and legislation
■ Policy and legislation play a key role in shaping the economic incentives and guid-ing conditions for overall system perfor-mance. Where the economic incentives for collection of waste by private or public op-erators are not aligned with policy goals, significant resource volumes can be lost to illegal or informal recycling, or are sim-ply unaccounted for, sometimes through ‘cherry picking’. This often leads to envi-ronmental problems, damaging health im-pacts and impacts on water or climate, as regulatory standards are ignored.
■ The best policy and legislative results are achieved by creating a level playing field that internalizes external costs. This helps stakeholders in the recycling system to operate on a ‘best practice’ basis, along social, environmental, technological and economic considerations. TBD by UNEP.
■ Policy and legislation can improve results if it focuses on promoting BAT in recycling systems, setting up the framework for in-novative business models. In some cases, this will mean providing incentives for cop-ing with negative revenues from parts of the treatment process for EoL products. Actions increasing the willingness of prod-uct manufacturers and their customers to recycle EoL products and use recycled ma-terials produced with BAT, can also drive the recycling market.
■ For some minor elements, the required economies of scale will only be reached through processing at a sufficiently large “central” facility. However, in order to achieve this, effective international ar-rangements would be required to facilitate cross-border transportation in a transpar-ent and sustainable manner.

35
Metal Recycling – Opportunities, Limits, Infrastructure
Industrial infrastructure and technology are essential
■ The infrastructure and knowledge for the processing of waste into recycled metal is often the same as that used for prima-ry metal production. Therefore, the health of such production is vitally important for recycling, as a healthy balance between primary and recycled metal production fosters metallurgical systems knowledge. This balance also mitigates the cyclical na-ture of the primary metals industry.
■ Technology and expert knowledge of the academic communities and industries of society should be adaptive and able to deal with changing complexity. We can revital-ize the significance of these industries for sustainability with a suitably inspiring ex-planation of the sometimes dry and dif-ficult physics underpinning recycling. For instance, current pre-processing technol-ogy is inappropriate for increasingly min-iaturized technology or complex products, such as today’s cars. A recycling system needs suitable dismantling, cutting, sort-ing and whole-product-smelting technol-ogies. As product change is much faster than the change in processing equipment, processing must use flexible technology, such as the highly adaptive manual sort-ing, and some physical separation and sorting equipment may be moved to where scrap is being generated.
Collection as part of the recycling system
■ Optimized recycling requires secure and large volumes of waste, collected (or sort-ed) in ways that assist its metallurgical processing. Two essential factors for suc-cessful waste collection are: (i) a suitable infrastructure for collection, and (ii) eco-nomic incentives for the delivery of waste to BAT operators, rather than to informal or illegal operators.
■ Where economic incentives exist, private operators often set up collection infra-structures. In some cases, public-policy intervention must help the creation or ca-pacity building of such infrastructure, for example when setting up recycling sys-tems for mobile phones. Where waste ends up in areas with no or poor-quality recycling, the resources are often lost. Re-sponsibility for collection can be shared between all stakeholders in ways that best finance and increase the capability of col-lection systems in such areas.

36
Metal Recycling – Opportunities, Limits, Infrastructure
Design for Resource Efficiency (DfRE)
■ For optimal recycling, the industrial-waste and End-of-Life-product streams that en-ter processing should be economically and physically compatible with the metal-production system. Both product design and collection methods strongly affect the physical properties of a waste stream. Op-timal recycling can only succeed by better physics-based Design for Resource Effi-ciency (DfRE). Design can then try to avoid putting metals together in a stream that cannot be separated by the BAT. Neverthe-less, material linkages can make any DfRE useless, as the consumer primarily pur-chases product functionality.
■ Computer models can facilitate DfRE, which includes Design for Recycling. These, like any engineering-process de-sign model, should have enough detail that captures the physics of recycling, for pre-dicting recycling-output quality and eco-nomic value. To be effective, they must be based on thermodynamics and the recy-cling techniques used. Detailed data must be collected for the materials chain to op-timize the system, as too simple data col-lection makes Design for Recycling and Resource Efficiency impossible.
■ Design changes can do much to improve recycling, though many “critical” elements may be intertwined in products to ensure their complex functions. Here, better de-sign for disassembling the relevant – in terms of critical/valuable metals – subas-semblies is an evident necessity. Design for Resource Efficiency is based on a per-spective that looks at the impact of prod-ucts over their life cycle (life cycle man-agement, or LCM), and policy should assist the adoption of LCM by manufacturers.
Technologically feasible policy objectives must be set to reflect product complexity
■ Recycling rates as currently defined in EU waste legislation, such as the ELV and WEEE directives, do not refer to the ac-tual recycling of individual metals in the recycling chain. Current system bounda-ries are the output of pre-processing steps and their resulting fractions, which again are a mix of different substances. The final smelting and refining step is not consid-ered in the recycling rates.
■ Legal recycling-rate targets have two im-plicit weaknesses:
(i) They do not differ between individual substances, but are calculated solely by weight based on an entire fraction. Hence, to achieve the targets, recovery of mass substances such as plastics, glass or steel becomes much more important than recovery of precious and special metals, which are usually only present in small amounts.
(ii) As the targets do not consider metal-lurgical steps, the high legal recycling targets pretend a recycling quality that in reality is not obtained. For instance, the EU’s ELV directive requires a 85 % recycling rate (material and energy re-covery), to be increased to 95 % by 2015. If smelting and refining are included, real recycling rates will be much lower, especially for precious and special met-als.
■ Due to product complexity and the in-herently random separation of metals in the recycling process, there are no sin-gle optimal recycling rates for metals in End-of-Life products. The same product, put through BAT, can produce different amounts of recycled metal, with a differing quality depending on the system and mar-ket conditions.

37
Metal Recycling – Opportunities, Limits, Infrastructure
■ It may be counter-productive to use ma-terial-based recycling-performance out-put standards, such as mass or percent-age of a single metal in a waste stream. They can ignore the complexity of recycling and its inherent trade-off between outputs of different recycled metals from mixed waste streams. This may lead to wasting of valuable metals. For example, a system focused on increasing recycled iron out-put may lose valuable metals with complex links to iron, such as vanadium.
■ We must reconsider the current practice of using recycling rates of single metals, or of percentages of product mass, as the Key Performance Indicator (KPI) of a re-cycling system. Approaches based on the understanding of recycling physics can im-prove MMC indicators to render them more Product-Centric, especially if they include economics-based indicators.
■ Economics-based and environmentally benign KPI processes should be consid-ered as a BAT. Rather than industry having to achieve a mandated performance target, policy and industry need to create the con-ditions and incentives that facilitate high performance. This, however, requires pol-icy actions across the system to overcome the bottlenecks that currently hold back optimized recycling.
Education and information – High-quality people and training
■ Research and education is critically im-portant for preserving expert knowledge, especially of the processing of key met-als, and for driving innovation that maxi-mizes resource efficiency. Moreover, much knowledge is tacit – held and transmit-ted by vitally important experts who can-not be traded like a commodity – and that is lost when industry sectors are too cycli-cal. There is a need for disseminating the physics-based systems approach to recy-cling, as described in this report.
■ Market operations are significantly helped when recycling operators can estimate fu-ture needs for recycling infrastructure by quantifying the “urban orebody”, its loca-tion and waste flows. Policy can stimulate or assist towards estimating the metals in market products.
38
Metal Recycling – Opportunities, Limits, Infrastructure
39
Metal Recycling – Opportunities, Limits, Infrastructure
1. Brief Overview of Factors affecting Recycling
The Green Economy Initiative set up by United Nations Environmental Programme (UNEP), spearheads the transformations needed to create a viable future for generations to come. Its aim is to shape an economy “that results in improved human well-being and social equity, while significantly reducing en-vironmental risks and ecological scarcities. In its simplest expression, a green economy can be thought of as one which is low car-bon, resource efficient and socially inclusive” (UNEP, 2011a).
The production and use of metals plays a crucial role in creating that future economy. According to the Green Economy Initiative Report, the main sources of future economic development and growth will be renewable-energy technologies, resource- and energy-efficient buildings and equipment, low-car-bon public transport systems, infrastructure for fuel-efficient and clean-energy vehicles, and waste management and recycling facili-ties (UNEP, 2011b). All of these rely heavily on metals.
This is one reason why metals and metal re-cycling are central in the work of UNEP’s International Resource Panel (IRP) and its Global Metal Flows Working Group. Another reason is that, while some studies exist on the local impact of mining, the environmental effects of recycling, or geological and anthro-pogenic metal stocks, no global and com-prehensive overview of scientific data exist-ed until now. To fill this gap, the Metal Flows Working Group commissioned several Status Reports of which this report is one.
We prepared the present report, following the one on Recycling Rates, as a response to several significant trends in society’s ever more complex use of metals. We briefly dis-cuss some aspects of anthropogenic met-al flows and cycles, covering issues around
the local impact of mining, energy use of the metal life cycle, the effect of metal emissions from non-metal sources such as fossil fuels and phosphate fertilizer, as well as the ef-fect of final metal sinks and residues. This aspects are all covered in more detail in the Global Metal Flows Working Group's third re-port on "Environmental Risks and Challenges of Anthropogenic Metals Flows and Cycles" (UNEP, 2013).
Report 1 – Metal Stocks in Society
Report 2a – Recycling Rates of Metals
Report 2b – Metal Recycling
Report 3 – Environmental Risks and Challenges of Anthropogenic Metals Flows and Cycles
Report 4 – Future Demand Scenarios for Metals
Report 5 – Critical Metals and Metal Policy Options
The first five reports form the necessary basis for the last report.
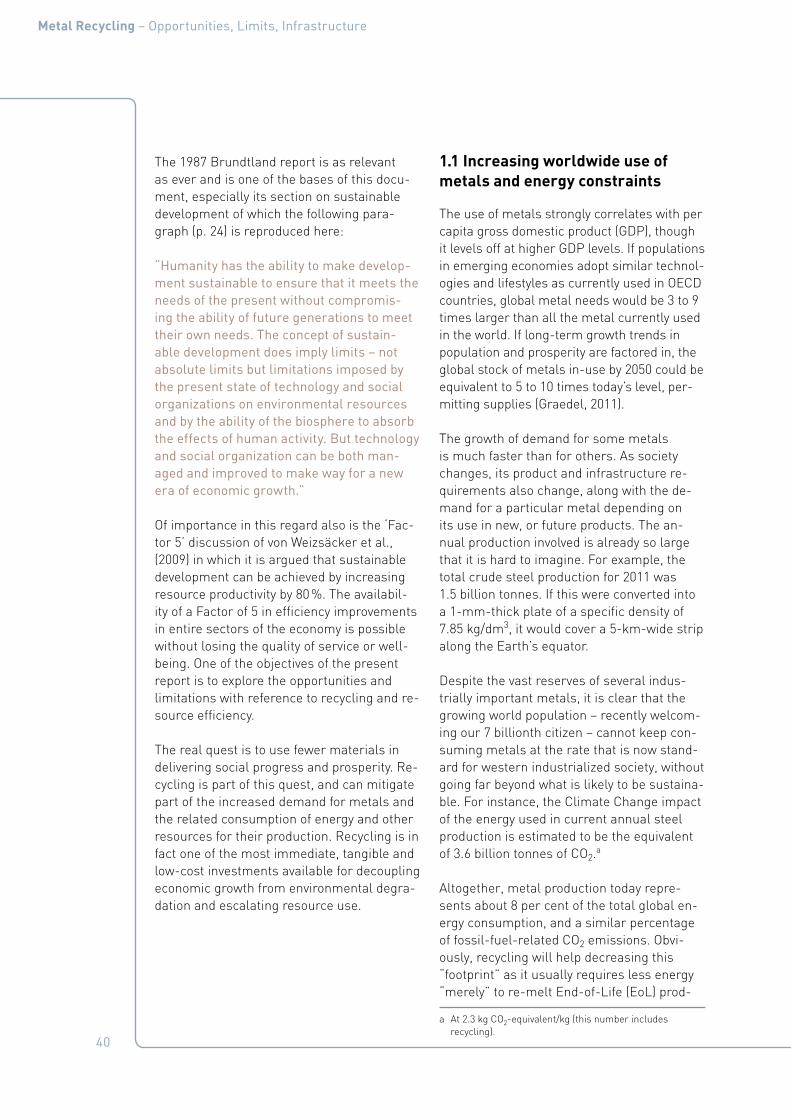
40
Metal Recycling – Opportunities, Limits, Infrastructure
The 1987 Brundtland report is as relevant as ever and is one of the bases of this docu-ment, especially its section on sustainable development of which the following para-graph (p. 24) is reproduced here:
“Humanity has the ability to make develop-ment sustainable to ensure that it meets the needs of the present without compromis-ing the ability of future generations to meet their own needs. The concept of sustain-able development does imply limits – not absolute limits but limitations imposed by the present state of technology and social organizations on environmental resources and by the ability of the biosphere to absorb the effects of human activity. But technology and social organization can be both man-aged and improved to make way for a new era of economic growth.”
Of importance in this regard also is the ‘Fac-tor 5’ discussion of von Weizsäcker et al., (2009) in which it is argued that sustainable development can be achieved by increasing resource productivity by 80 %. The availabil-ity of a Factor of 5 in efficiency improvements in entire sectors of the economy is possible without losing the quality of service or well-being. One of the objectives of the present report is to explore the opportunities and limitations with reference to recycling and re-source efficiency.
The real quest is to use fewer materials in delivering social progress and prosperity. Re-cycling is part of this quest, and can mitigate part of the increased demand for metals and the related consumption of energy and other resources for their production. Recycling is in fact one of the most immediate, tangible and low-cost investments available for decoupling economic growth from environmental degra-dation and escalating resource use.
1.1 Increasing worldwide use of metals and energy constraints
The use of metals strongly correlates with per capita gross domestic product (GDP), though it levels off at higher GDP levels. If populations in emerging economies adopt similar technol-ogies and lifestyles as currently used in OECD countries, global metal needs would be 3 to 9 times larger than all the metal currently used in the world. If long-term growth trends in population and prosperity are factored in, the global stock of metals in-use by 2050 could be equivalent to 5 to 10 times today’s level, per-mitting supplies (Graedel, 2011).
The growth of demand for some metals is much faster than for others. As society changes, its product and infrastructure re-quirements also change, along with the de-mand for a particular metal depending on its use in new, or future products. The an-nual production involved is already so large that it is hard to imagine. For example, the total crude steel production for 2011 was 1.5 billion tonnes. If this were converted into a 1-mm-thick plate of a specific density of 7.85 kg/dm3, it would cover a 5-km-wide strip along the Earth’s equator.
Despite the vast reserves of several indus-trially important metals, it is clear that the growing world population – recently welcom-ing our 7 billionth citizen – cannot keep con-suming metals at the rate that is now stand-ard for western industrialized society, without going far beyond what is likely to be sustaina-ble. For instance, the Climate Change impact of the energy used in current annual steel production is estimated to be the equivalent of 3.6 billion tonnes of CO2.a
Altogether, metal production today repre-sents about 8 per cent of the total global en-ergy consumption, and a similar percentage of fossil-fuel-related CO2 emissions. Obvi-ously, recycling will help decreasing this “footprint” as it usually requires less energy “merely” to re-melt End-of-Life (EoL) prod-
a At 2.3 kg CO2-equivalent/kg (this number includes recycling).
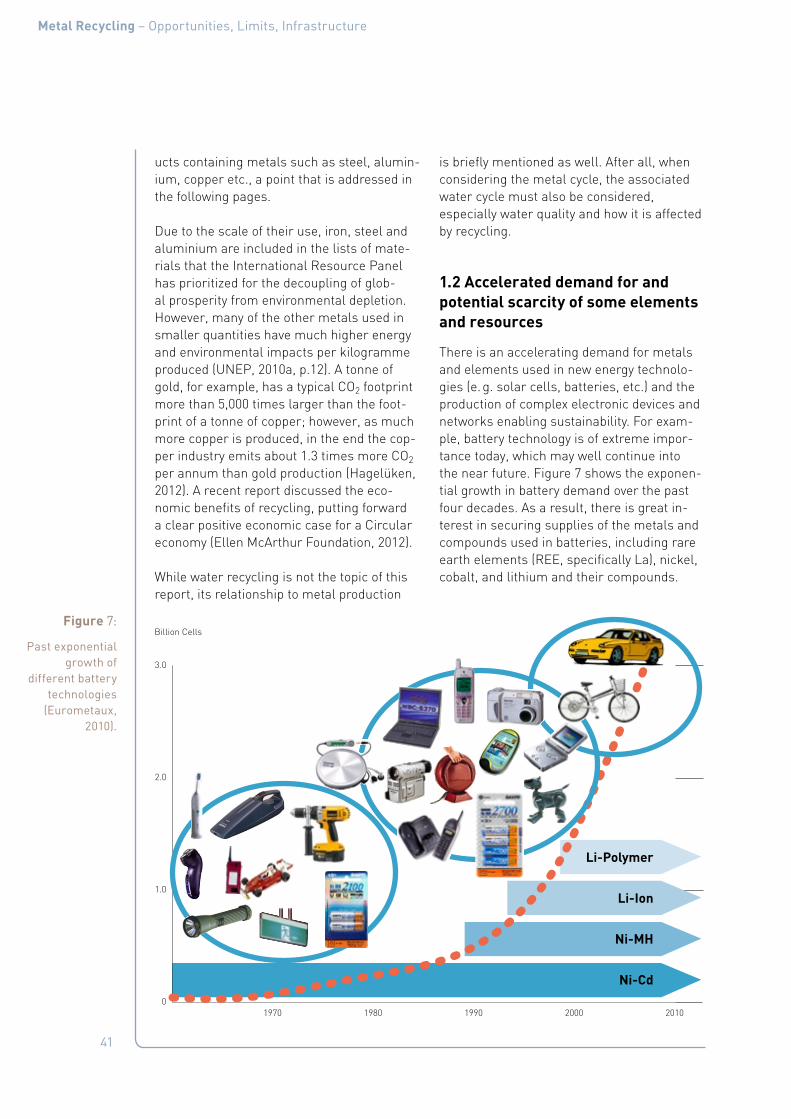
41
Metal Recycling – Opportunities, Limits, Infrastructure
ucts containing metals such as steel, alumin-ium, copper etc., a point that is addressed in the following pages.
Due to the scale of their use, iron, steel and aluminium are included in the lists of mate-rials that the International Resource Panel has prioritized for the decoupling of glob-al prosperity from environmental depletion. However, many of the other metals used in smaller quantities have much higher energy and environmental impacts per kilogramme produced (UNEP, 2010a, p.12). A tonne of gold, for example, has a typical CO2 footprint more than 5,000 times larger than the foot-print of a tonne of copper; however, as much more copper is produced, in the end the cop-per industry emits about 1.3 times more CO2 per annum than gold production (Hagelüken, 2012). A recent report discussed the eco-nomic benefits of recycling, putting forward a clear positive economic case for a Circular economy (Ellen McArthur Foundation, 2012).
While water recycling is not the topic of this report, its relationship to metal production
is briefly mentioned as well. After all, when considering the metal cycle, the associated water cycle must also be considered, especially water quality and how it is affected by recycling.
1.2 Accelerated demand for and potential scarcity of some elements and resources
There is an accelerating demand for metals and elements used in new energy technolo-gies (e. g. solar cells, batteries, etc.) and the production of complex electronic devices and networks enabling sustainability. For exam-ple, battery technology is of extreme impor-tance today, which may well continue into the near future. Figure 7 shows the exponen-tial growth in battery demand over the past four decades. As a result, there is great in-terest in securing supplies of the metals and compounds used in batteries, including rare earth elements (REE, specifically La), nickel, cobalt, and lithium and their compounds.
Figure 7:
Past exponential growth of
different battery technologies
(Eurometaux, 2010).
0
1.0
2.0
3.0
20102000199019801970
Li-Polymer
Li-Ion
Ni-MH
Ni-Cd
Billion Cells
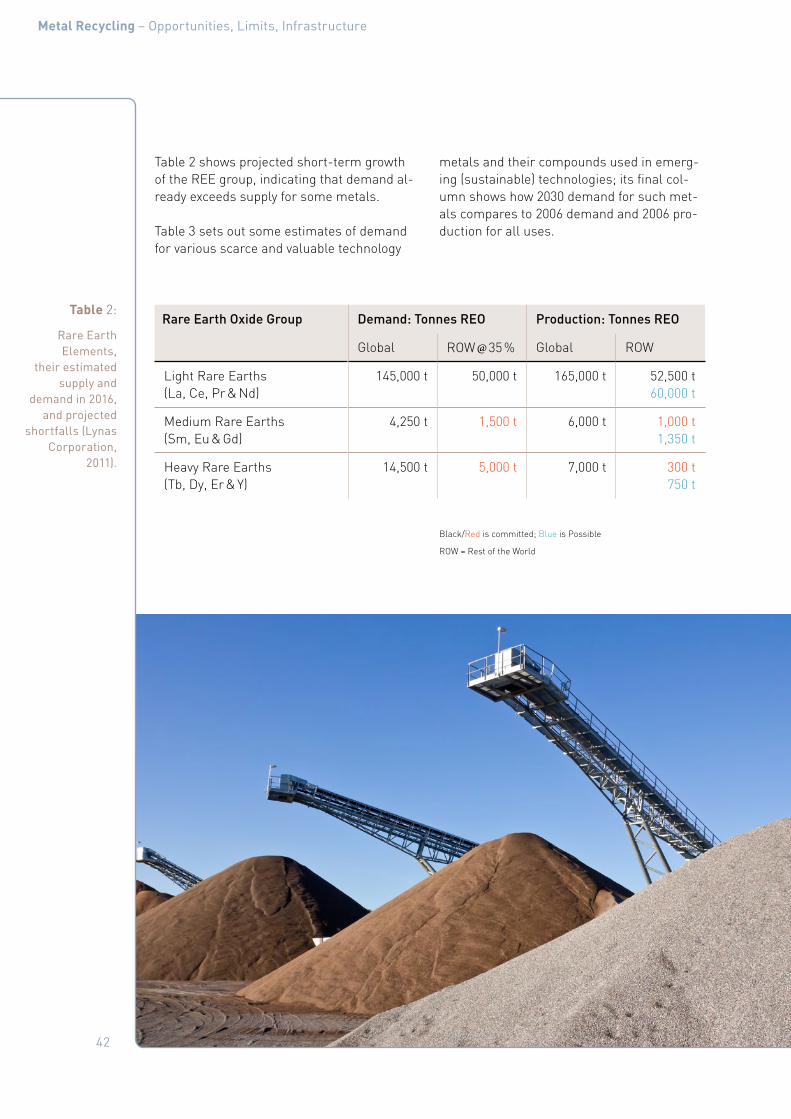
42
Metal Recycling – Opportunities, Limits, Infrastructure
Table 2 shows projected short-term growth of the REE group, indicating that demand al-ready exceeds supply for some metals.
Table 3 sets out some estimates of demand for various scarce and valuable technology
metals and their compounds used in emerg-ing (sustainable) technologies; its final col-umn shows how 2030 demand for such met-als compares to 2006 demand and 2006 pro-duction for all uses.
Black/Red is committed; Blue is Possible
ROW = Rest of the World
Table 2:
Rare Earth Elements,
their estimated supply and
demand in 2016, and projected
shortfalls (Lynas Corporation,
2011).
Rare Earth Oxide Group Demand: Tonnes REO Production: Tonnes REO
Global ROW @ 35 % Global ROW
Light Rare Earths (La, Ce, Pr & Nd)
145,000 t 50,000 t 165,000 t 52,500 t 60,000 t
Medium Rare Earths (Sm, Eu & Gd)
4,250 t 1,500 t 6,000 t 1,000 t 1,350 t
Heavy Rare Earths (Tb, Dy, Er & Y)
14,500 t 5,000 t 7,000 t 300 t 750 t

43
Metal Recycling – Opportunities, Limits, Infrastructure
As many of these emerging technologies are essential for the smooth transition to a green economy, meeting the demand for these metals appears to be an essential part of our move to a sustainable, prosperous economy (see Appendix B: Details on Metals found in WEEE, Appendix C: Details on Battery Recy-cling, Appendix D: Mobile Phone Collection).
Table 3:
Growth in element use projected to
2030. The 2006 and 2030
indicators show the proportion
of ETRD compared to
2006 production, e. g. Ga: Indicator
2006 = 28/152 = 0.18 and Indicator 2030 = 603/152 =
3.97) (EU, 2010; BGR, 2010).
Raw material
Production 1)
(t)ETRD 2006 (t)
ETRD 2030 (t)
Indicator 2006
Indicator 2030
Gallium 152 5) 28 603 0,18 1) 3,97 1)
Indium 581 234 1.911 0,40 1) 3,29 1)
Germanium 100 28 220 0,28 1) 2,20 1)
Neodymium 6) 16.800 4.00 27.900 0,23 1) 1,66 1)
Platinum 7) 255 very small 345 0 1,35 1)
Tantalum 1.384 551 1.410 0,40 1) 1,02 1)
Silver 19.051 5.342 15.823 0,28 1) 0,83 1)
Cobalt 62.279 12.820 26.860 0,21 1) 0,43 1)
Palladium 7) 267 23 77 0,09 1) 0,29 1)
Titanium 7.211.000 3) 15.397 58.148 0,08 0,29
Copper 15.093.00 1.410.000 3.696.070 0,09 0,24
Ruthenium 7) 29 4) 0 1 0 0,03
Niobium 44.531 288 1.410 0,01 0,03
Antimony 172.223 28 71 < 0,01 < 0,01
Chromium 19.825.713 2) 11.250 41.900 < 0,01 < 0,01
ETRD = Emerging Technologies Raw Material Demand1)Data updated by the BGR based on new information 2)Chromite 3)Ore concentrate 4)Consumption 5)Estimation of full pro-
duction in China and Russia 6)rare earth 7)platinum group metals

44
Metal Recycling – Opportunities, Limits, Infrastructure
1.3 Declining ore grades and the consequences
As global demand for many metals contin-ues to rise, more low-quality ores are mined, leading to an overall decrease in ore grades. Figure 8 shows this decrease in ore grades for gold over time, representative of a trend seen in many metals. The mining of lower-grade ore causes increased energy use and thus rising GHG emissions, even with im-proved extraction methods. Today, depending on the metal concerned, about three times as much material needs to be moved for the same ore extraction as a century ago, with concomitant increases in land disruption, wa-ter use and pollution, and energy use (UNEP, 2011c).
Figure 8:
Gold ore grades between 1830
and 2010 (Source: UNEP 2011c,
p. 24).
0
10
20
30
40
50
Brazil
USA
South Africa
Canada
Australia
2010199019701950193019101890187018501835
Gold Ore Grade (g/t Au)

45
Metal Recycling – Opportunities, Limits, Infrastructure
1.4 Increasing stocks in society – importance of their collection
On average, the metal stocks used in more-developed countries equate to between ten and fifteen metric tonnes per citizen. Of this amount, five metals – iron, aluminium, cop-per, zinc, and manganese – make up more than 98 %. UNEP’s report on “Metals Stocks in Society” (UNEP, 2010b) reviewed 54 stud-ies on metal stocks, finding that reliable es-timates for in-use stocks exist for only four of those metals: aluminium, copper, iron and lead.
Trends in the production and use of metals show that worldwide stocks of metals in use by society are increasing. At the end of its use, this metal stock is an increasingly valua-ble resource. Therefore, future metal produc-tion must not only focus on ore mining, but also on recycling and the “urban mine”, the stock of metals in use above ground. In other words, recycling is a key factor in the future use of metals. However, the “geology” of the “urban mine” is complex and unpredictable and makes economic predictions difficult.
An important point for recycling is that the residence times for these stocks vary sub-stantially. The average residence time for iron in construction steel is several decades, while for indium in electronic appliances it is a few years or less. The effects of product in-novation further affect such varying residence times. The steel types added to the stock to-day contain alloying elements not used dec-ades ago. This is very marked in electronic appliances, where new product generations rapidly follow each other, causing a huge variation in stock properties. Another major point in recycling is the ever-increasing in-terconnectedness of stocks. The iron stock is getting more connected to REE stock via the addition of high-performance super-alloy steels.
The stocks have different availabilities at the end of their service life. Stocks of industri-al-investment and infrastructure goods are
more readily available and collectable for re-cycling than those in private hands.
“Mining” the valuable recycling sources of many technologically valuable elements re-quires extreme attention to collection, to en-sure that End-of-Life (EoL) goods, especially privately owned, do not disappear into land-fill or into systems and processes that cannot fully recover the most valuable elements.
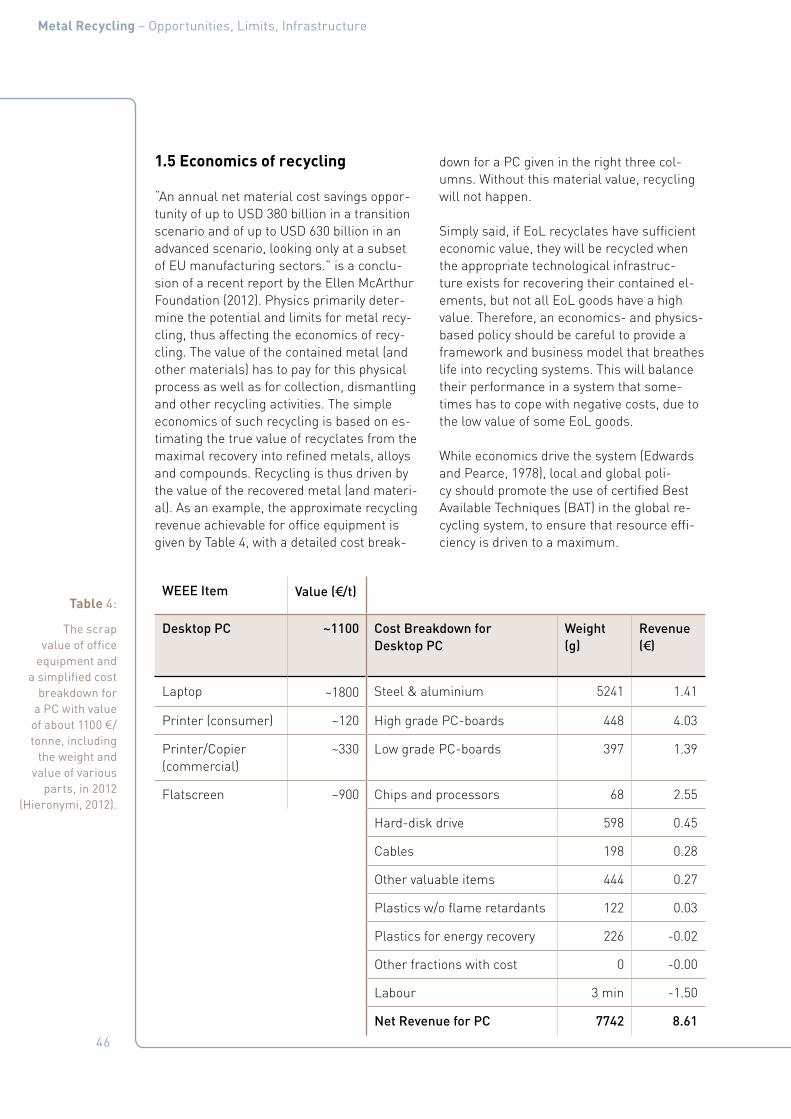
46
Metal Recycling – Opportunities, Limits, Infrastructure
1.5 Economics of recycling
“An annual net material cost savings oppor-tunity of up to USD 380 billion in a transition scenario and of up to USD 630 billion in an advanced scenario, looking only at a subset of EU manufacturing sectors.” is a conclu-sion of a recent report by the Ellen McArthur Foundation (2012). Physics primarily deter-mine the potential and limits for metal recy-cling, thus affecting the economics of recy-cling. The value of the contained metal (and other materials) has to pay for this physical process as well as for collection, dismantling and other recycling activities. The simple economics of such recycling is based on es-timating the true value of recyclates from the maximal recovery into refined metals, alloys and compounds. Recycling is thus driven by the value of the recovered metal (and materi-al). As an example, the approximate recycling revenue achievable for office equipment is given by Table 4, with a detailed cost break-
down for a PC given in the right three col-umns. Without this material value, recycling will not happen.
Simply said, if EoL recyclates have sufficient economic value, they will be recycled when the appropriate technological infrastruc-ture exists for recovering their contained el-ements, but not all EoL goods have a high value. Therefore, an economics- and physics-based policy should be careful to provide a framework and business model that breathes life into recycling systems. This will balance their performance in a system that some-times has to cope with negative costs, due to the low value of some EoL goods.
While economics drive the system (Edwards and Pearce, 1978), local and global poli-cy should promote the use of certified Best Available Techniques (BAT) in the global re-cycling system, to ensure that resource effi-ciency is driven to a maximum.
Table 4:
The scrap value of office
equipment and a simplified cost
breakdown for a PC with value
of about 1100 1/tonne, including
the weight and value of various
parts, in 2012 (Hieronymi, 2012).
WEEE Item Value (3/t)
Desktop PC ~1100 Cost Breakdown for Desktop PC
Weight (g)
Revenue (3)
Laptop ~1800 Steel & aluminium 5241 1.41
Printer (consumer) ~120 High grade PC-boards 448 4.03
Printer/Copier (commercial)
~330 Low grade PC-boards 397 1.39
Flatscreen ~900 Chips and processors 68 2.55
Hard-disk drive 598 0.45
Cables 198 0.28
Other valuable items 444 0.27
Plastics w/o flame retardants 122 0.03
Plastics for energy recovery 226 -0.02
Other fractions with cost 0 -0.00
Labour 3 min -1.50
Net Revenue for PC 7742 8.61

47
Metal Recycling – Opportunities, Limits, Infrastructure
1.6 Recycling Rates and their Distribution
Given the predicted growth of metal demand, metal recycling can only mitigate a part of fu-ture demand. This is: a) Because of the delay between the initial sale of products and them becoming available as scrap; b) Because the amount of metals put into the market several years ago was lower than today; and c) Be-cause of metal losses during recycling.
Recycling was already referred to in 1556 by the German Agricola, when commenting on forms of metal production in the oldest met-allurgical textbook written (Agricola, 1556). For metals in simple products such as steel in cans, or even for steel from EoL vehicles, the recycling rate can be very high (Table 5).
UNEP’s report on Recycling Rates of met-als (UNEP, 2011b) reported ranges for vari-ous recycling rate metrics for sixty metals as summarized by Figure 9, which uses simple one-dimensional recyclate rate definitions. These are, however, limited in their use for single metals and do not reflect the use of a variety of metals in complex products (van Schaik and Reuter, 2004a, 2010), i. e. these recycling-rate definitions exclude non-linear physical interactions in the complete recy-cling chain and therefore have a limited theo-retical basis and little predictive value.
Table 5:
Steel-can recycling rates, left, and steel-
recycling rates by sector in the USA (Worldsteel 2012; Yellishetty et al.,
2011).
Sector Recovery rate 2007 (%)
Estimated Recovery rate 2050 (%)
Life cycle in years
Construction 85 90 40 – 70
Automotive 85 90 7 – 15
Machinery 90 95 10 – 20
Electrical and domestic appliances 50 65 4 – 10
Weighted global average 83 90 N/A

48
Metal Recycling – Opportunities, Limits, Infrastructure
Figure 9:
Various definitions
of recycling rates and
corresponding data for elements
in the periodic table (UNEP,
2011b).
EoL-RR for sixty metals: The periodic table of global average EoL (post-consumer) functional recycling (EoL-RR) for sixty met-als. Functional recycling is recycling in which the physical and chemical properties that made the material desirable in the first place are retained for subsequent use. Unfilled boxes indicate that no data or estimates are available, or that the element was not addressed as part of this study. These evaluations do not consider metal emissions from coal power plants.
> 50 %
> 25–50 %
> 10–25 %
1–10 %
< 1 %
1H
2He
3Li
4Be
5B
6C
7N
8O
9F
10Ne
11Na
12Mg
13Al
14Si
15P
16S
17Cl
18Ar
19K
20Ca
21Sc
22Ti
23V
24Cr
25Mn
26Fe
27Co
28Ni
29Cu
30Zn
31Ga
32Ge
33As
34Se
35Br
36Kr
37Rb
38Sr
39Y
40Zr
41Nb
42Mo
43Tc
44Ru
45Rh
46Pd
47Ag
48Cd
49In
50Sn
51Sb
52Te
53I
54Xe
55Cs
56Ba
* 72Hf
73Ta
74W
75Re
76Os
77Ir
78Pt
79Au
80Hg
81Tl
82Pb
83Bi
84Po
85At
86Rn
87Fr
88Ra
** 104Rf
105Db
106Sg
107Sg
108Hs
109Mt
110Ds
111Rg
112Uub
113Uut
114Uug
115Uup
116Uuh
117Uus
118Uuo
57La
58Ce
59Pr
60Nd
61Pm
62Sm
63Eu
64Gd
65Tb
66Dy
67Ho
68Er
69Tm
70Yb
71Lu
89Ac
90Th
91Pa
92U
93Np
94Pu
95Am
96Cm
97Bk
98Cf
99Es
100Fm
101Md
102No
103Lr
* Lanthanides
** Actinides

49
Metal Recycling – Opportunities, Limits, Infrastructure
1H
2He
3Li
4Be
5B
6C
7N
8O
9F
10Ne
11Na
12Mg
13Al
14Si
15P
16S
17Cl
18Ar
19K
20Ca
21Sc
22Ti
23V
24Cr
25Mn
26Fe
27Co
28Ni
29Cu
30Zn
31Ga
32Ge
33As
34Se
35Br
36Kr
37Rb
38Sr
39Y
40Zr
41Nb
42Mo
43Tc
44Ru
45Rh
46Pd
47Ag
48Cd
49In
50Sn
51Sb
52Te
53I
54Xe
55Cs
56Ba
* 72Hf
73Ta
74W
75Re
76Os
77Ir
78Pt
79Au
80Hg
81Tl
82Pb
83Bi
84Po
85At
86Rn
87Fr
88Ra
** 104Rf
105Db
106Sg
107Sg
108Hs
109Mt
110Ds
111Rg
112Uub
113Uut
114Uug
115Uup
116Uuh
117Uus
118Uuo
57La
58Ce
59Pr
60Nd
61Pm
62Sm
63Eu
64Gd
65Tb
66Dy
67Ho
68Er
69Tm
70Yb
71Lu
89Ac
90Th
91Pa
92U
93Np
94Pu
95Am
96Cm
97Bk
98Cf
99Es
100Fm
101Md
102No
103Lr
* Lanthanides
** Actinides
> 50 %
> 25–50 %
> 10–25 %
1–10 %
< 1 %
The periodic table of global average recycled content (RC, the fraction of secondary [scrap] metal in the total metal input to metal production) for sixty metals. Unfilled boxes indicate that no data or estimates are available, or that the element was not addressed as part of this study.

50
Metal Recycling – Opportunities, Limits, Infrastructure
OSR for sixty metals: The periodic table of global average old scrap ratios (OSR, the fraction of old [post-consumer] scrap in the recycling flow) for sixty metals. Unfilled boxes indicate that no data or estimates are available, or that the element was not addressed as part of this study.
1H
2He
3Li
4Be
5B
6C
7N
8O
9F
10Ne
11Na
12Mg
13Al
14Si
15P
16S
17Cl
18Ar
19K
20Ca
21Sc
22Ti
23V
24Cr
25Mn
26Fe
27Co
28Ni
29Cu
30Zn
31Ga
32Ge
33As
34Se
35Br
36Kr
37Rb
38Sr
39Y
40Zr
41Nb
42Mo
43Tc
44Ru
45Rh
46Pd
47Ag
48Cd
49In
50Sn
51Sb
52Te
53I
54Xe
55Cs
56Ba
* 72Hf
73Ta
74W
75Re
76Os
77Ir
78Pt
79Au
80Hg
81Tl
82Pb
83Bi
84Po
85At
86Rn
87Fr
88Ra
** 104Rf
105Db
106Sg
107Sg
108Hs
109Mt
110Ds
111Rg
112Uub
113Uut
114Uug
115Uup
116Uuh
117Uus
118Uuo
57La
58Ce
59Pr
60Nd
61Pm
62Sm
63Eu
64Gd
65Tb
66Dy
67Ho
68Er
69Tm
70Yb
71Lu
89Ac
90Th
91Pa
92U
93Np
94Pu
95Am
96Cm
97Bk
98Cf
99Es
100Fm
101Md
102No
103Lr
* Lanthanides
** Actinides
> 50 %
> 25–50 %
> 10–25 %
1–10 %
< 1 %
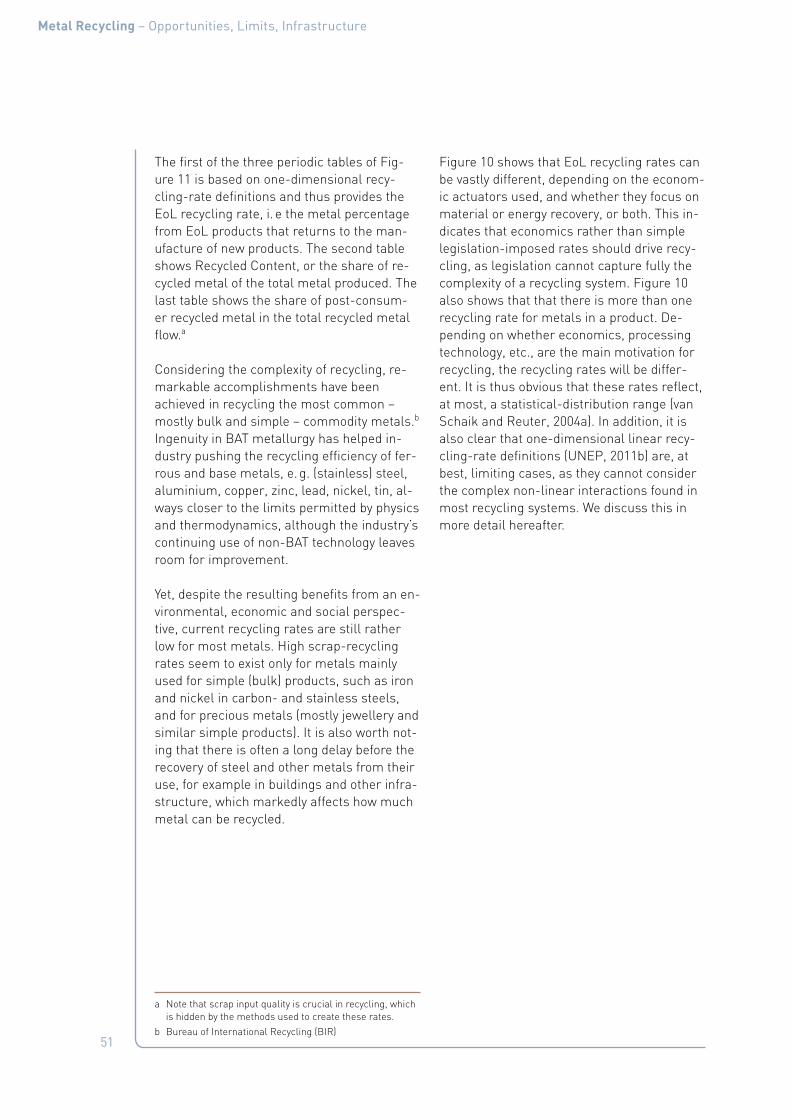
51
Metal Recycling – Opportunities, Limits, Infrastructure
The first of the three periodic tables of Fig-ure 11 is based on one-dimensional recy-cling-rate definitions and thus provides the EoL recycling rate, i. e the metal percentage from EoL products that returns to the man-ufacture of new products. The second table shows Recycled Content, or the share of re-cycled metal of the total metal produced. The last table shows the share of post-consum-er recycled metal in the total recycled metal flow.a
Considering the complexity of recycling, re-markable accomplishments have been achieved in recycling the most common – mostly bulk and simple – commodity metals.b Ingenuity in BAT metallurgy has helped in-dustry pushing the recycling efficiency of fer-rous and base metals, e. g. (stainless) steel, aluminium, copper, zinc, lead, nickel, tin, al-ways closer to the limits permitted by physics and thermodynamics, although the industry’s continuing use of non-BAT technology leaves room for improvement.
Yet, despite the resulting benefits from an en-vironmental, economic and social perspec-tive, current recycling rates are still rather low for most metals. High scrap-recycling rates seem to exist only for metals mainly used for simple (bulk) products, such as iron and nickel in carbon- and stainless steels, and for precious metals (mostly jewellery and similar simple products). It is also worth not-ing that there is often a long delay before the recovery of steel and other metals from their use, for example in buildings and other infra-structure, which markedly affects how much metal can be recycled.
a Note that scrap input quality is crucial in recycling, which is hidden by the methods used to create these rates.
b Bureau of International Recycling (BIR)
Figure 10 shows that EoL recycling rates can be vastly different, depending on the econom-ic actuators used, and whether they focus on material or energy recovery, or both. This in-dicates that economics rather than simple legislation-imposed rates should drive recy-cling, as legislation cannot capture fully the complexity of a recycling system. Figure 10 also shows that that there is more than one recycling rate for metals in a product. De-pending on whether economics, processing technology, etc., are the main motivation for recycling, the recycling rates will be differ-ent. It is thus obvious that these rates reflect, at most, a statistical-distribution range (van Schaik and Reuter, 2004a). In addition, it is also clear that one-dimensional linear recy-cling-rate definitions (UNEP, 2011b) are, at best, limiting cases, as they cannot consider the complex non-linear interactions found in most recycling systems. We discuss this in more detail hereafter.
52
Metal Recycling – Opportunities, Limits, Infrastructure
Although plastics are not discussed here, their complex interactions with some metals, lowering their recycling rate as well as their energy content, make them an intimate part of metal- and residue recycling. This also af-fects the recycling rate of plastics, which is generally rather low. In fact, due to their complexity, most plastics today are used in energy-recovery processes (Plastics Europe, 2012).
Figure 10:
Recycling performance calculations
as a function of various
objectives, constraints
and scenarios. Results are
expressed per scenario in
terms of overall Recycling +
recovery rate; Recycling
rate (material recycling);
Recovery rate (energy recovery);
Produced waste; as well as Steel
and Copper recycling rates.
0,0 0,1 0,2 0,3 0,4 0,5 0,6 0,7 0,8
Max. recycling and recovery (recovery <10%)
Max. recycling and recovery
Max. metal recycling
Max. Recycling
Current situation
Copper Recycling Rate
Steel Recycling Rate
Produced Waste
Recovery Rate
Recycling Rate
Recycling+recovery Rate
Recycling performance/recovery [%]
Recycling performance/recovery [%]

53
Metal Recycling – Opportunities, Limits, Infrastructure
1.7 The impact on recycling of increased material complexity
Materials within products are selected to ful-fil a specific function. The increasing com-plexity of this functional demand has led to the use of an increasing number of elements (Figure 11). To improve functionality, prod-uct design increasingly mixes a large variety of different materials within products. Metals are used as chemical compounds, as com-ponents in metal alloys, or, in some special cases, as pure metal. Depending on which metals are being alloyed, properties change as shown by Figure 12, with copper being the principal metal alloyed with the various shown alloying elements.
Figure 11:
The ever-increasing use of
complex mixtures of metals in
products has a key effect on the
recyclability of metals (Adapted
by Reuter from Achzet and Reller,
2011).
Metal/Element Use Intensity in Products
1700 1800 1900 2000

54
Metal Recycling – Opportunities, Limits, Infrastructure
To achieve more advanced functions, other complex materials structures include com-bining metal alloys with ceramics and fibres for creating composites, gluing honeycomb structures, making metal foams, depositing
thin films, and creating nanoparticle struc-tures. Functionality is often further enhanced by coatings for improving wear, corrosion or fire resistance, for safety and for improving aesthetic aspects.
BOX 1: AlloysAlloying of metals is done to achieve better strength, workability and for better welding, to name a few reasons. Different alloys improve different properties (Figure 12). An alloy typi-cally contains a major component and several other components in much smaller concen-trations. Not all alloys of the same main components will be compatible from a recycling point of view, as is shown by the three examples below:
■ Steel: There are about 5000 carbon-steel alloys, from simple construction steel to ul-tra-high-strength steel, in addition to steels for high-temperature and high-wear uses. Stainless steels also come in six major alloy groups.
■ Aluminium is alloyed into seven main wrought alloy groups with varying properties, suit-able for making such different products as airplane frames, beverage cans, engines, electrical cables and foils. Aluminium is also used in several types of cast-alloy grades.
■ Copper alloys fall in eight main groups, the most common ones being with zinc (brass) and tin (bronze), and together as gunmetal. Copper alloys have moved from the age-old bronze and brass to more than four hundred alloys, with different alloying metals (Fig-ure 12) creating different properties of the Cu-alloys.
Figure 12:
Example of alloying elements affecting copper-
alloy properties ranging from
strength, wear resistance
to corrosion resistance
(Copper Development Association,
2012).
AlBeZr Fe
CrP
SnZn Ni
Pb
S
ZnSn
Al
Ni
NiSn
SiMn
TeZn
Fe
AgMn
Ag
Al
Si
Si SnCd
Strength
Corrosion Resistance
Wear Resistance
Machinability
Colour

55
Metal Recycling – Opportunities, Limits, Infrastructure
1.8 Implications of product complexity for recycling
Continuous product development affects its design, components and weight. This, in turn, changes its composition and volume for waste-recycling streams, as illustrated in BOX 2 for cars (Figure 13, Tables 6 and 7). This increased use of many compounds, complexly bound together for functional
reasons, dictates the physical and chemi-cal properties of the materials available for recycling. In addition, the combining of such different materials also changes from sim-ple rivets or nuts and bolts, to welding, gluing and molecular deposition, dictated by func-tionality and production cost.
BOX 2: Car recyclingThe average weight of a vehicle in the EU has increased substantially (Figure 13 and as documented by van Schaik and Reuter, 2004a) from 856kg in 1981 to 1207kg in 2001.
Figure 13:
The changing weights of cars over the years (International
Aluminium Institute, 2007).
19701970 19741974 19941994 19981998 20022002 2006200619781978 19821982 19861986 19901990
kg
750
850
650
950
1050
1150
1250
1350
1450
1550
Toyota Corolia
General Trend
VW Golf
Opel Astra
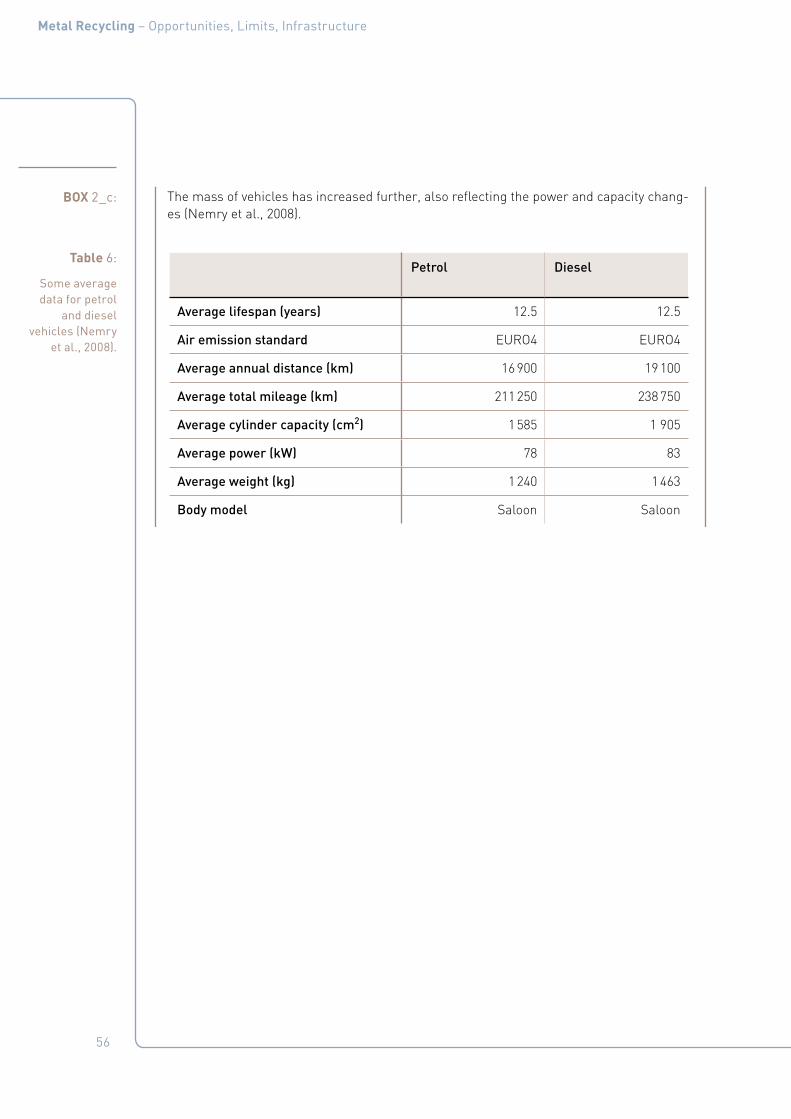
56
Metal Recycling – Opportunities, Limits, Infrastructure
BOX 2_c: The mass of vehicles has increased further, also reflecting the power and capacity chang-es (Nemry et al., 2008).
Table 6:
Some average data for petrol
and diesel vehicles (Nemry
et al., 2008).
Petrol Diesel
Average lifespan (years) 12.5 12.5
Air emission standard EURO4 EURO4
Average annual distance (km) 16 900 19 100
Average total mileage (km) 211 250 238 750
Average cylinder capacity (cm2) 1 585 1 905
Average power (kW) 78 83
Average weight (kg) 1 240 1 463
Body model Saloon Saloon
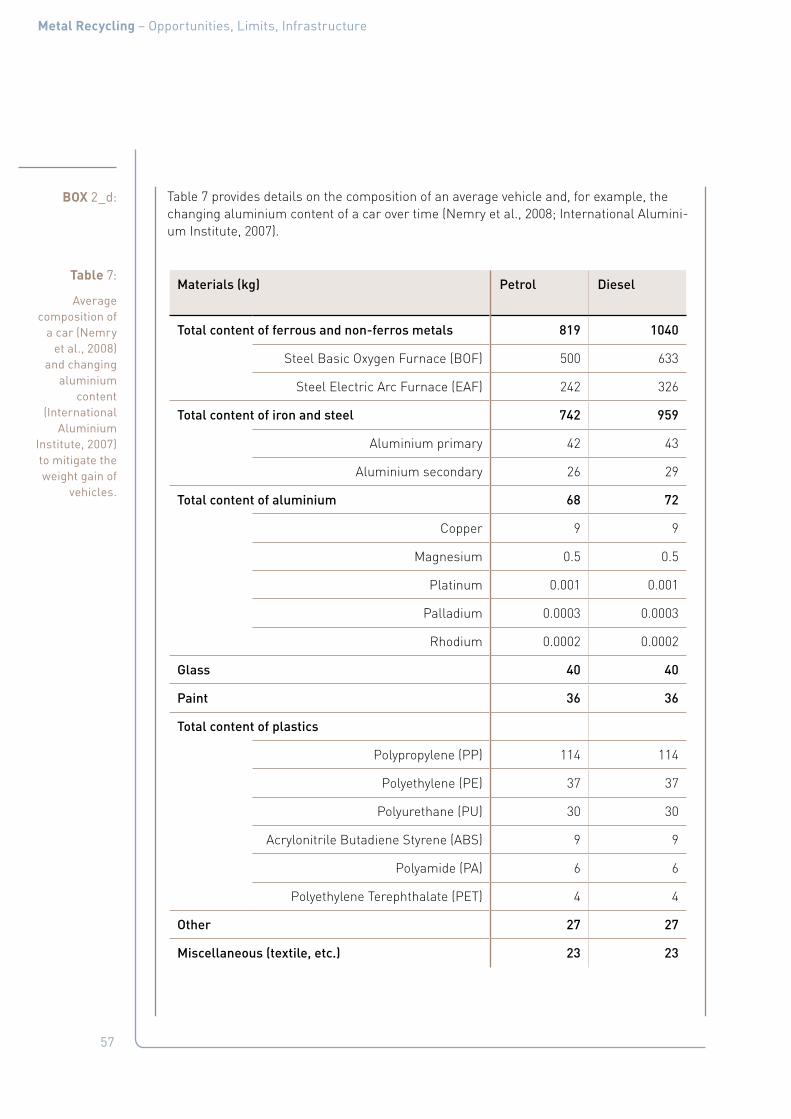
57
Metal Recycling – Opportunities, Limits, Infrastructure
BOX 2_d: Table 7 provides details on the composition of an average vehicle and, for example, the changing aluminium content of a car over time (Nemry et al., 2008; International Alumini-um Institute, 2007).
Table 7:
Average composition of
a car (Nemry et al., 2008)
and changing aluminium
content (International
Aluminium Institute, 2007) to mitigate the weight gain of
vehicles.
Materials (kg) Petrol Diesel
Total content of ferrous and non-ferros metals 819 1040
Steel Basic Oxygen Furnace (BOF) 500 633
Steel Electric Arc Furnace (EAF) 242 326
Total content of iron and steel 742 959
Aluminium primary 42 43
Aluminium secondary 26 29
Total content of aluminium 68 72
Copper 9 9
Magnesium 0.5 0.5
Platinum 0.001 0.001
Palladium 0.0003 0.0003
Rhodium 0.0002 0.0002
Glass 40 40
Paint 36 36
Total content of plastics
Polypropylene (PP) 114 114
Polyethylene (PE) 37 37
Polyurethane (PU) 30 30
Acrylonitrile Butadiene Styrene (ABS) 9 9
Polyamide (PA) 6 6
Polyethylene Terephthalate (PET) 4 4
Other 27 27
Miscellaneous (textile, etc.) 23 23
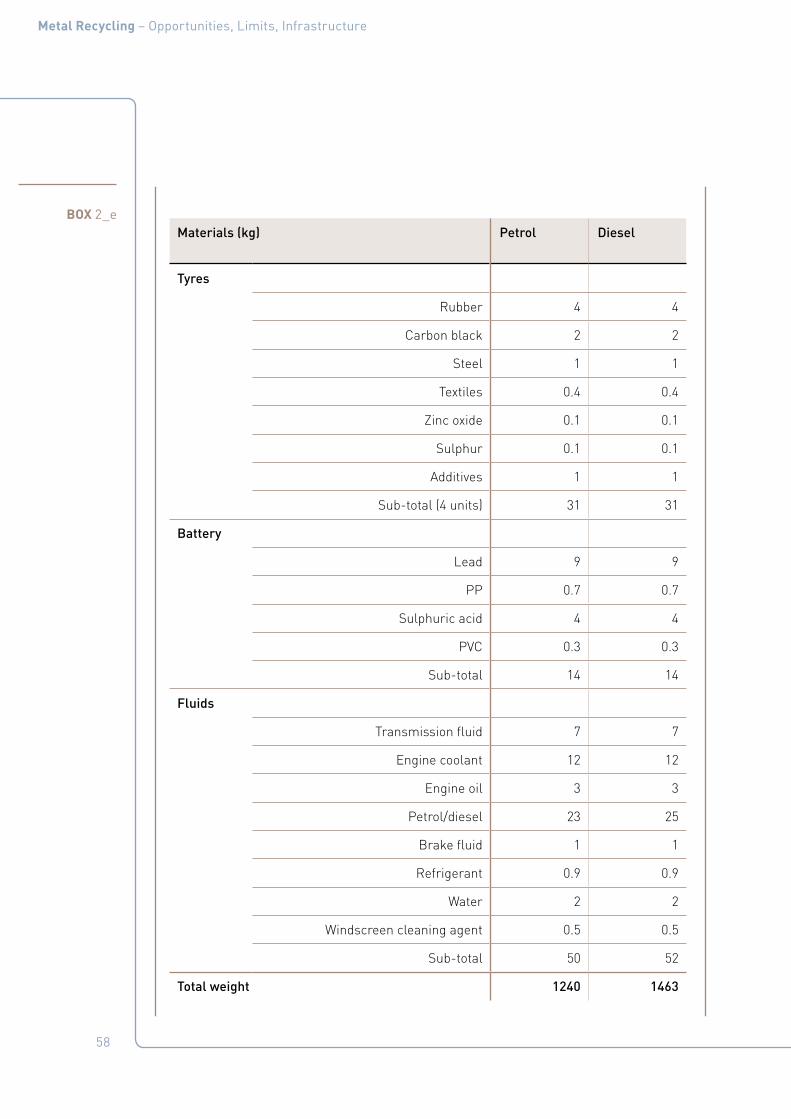
58
Metal Recycling – Opportunities, Limits, Infrastructure
BOX 2_eMaterials (kg) Petrol Diesel
Tyres
Rubber 4 4
Carbon black 2 2
Steel 1 1
Textiles 0.4 0.4
Zinc oxide 0.1 0.1
Sulphur 0.1 0.1
Additives 1 1
Sub-total (4 units) 31 31
Battery
Lead 9 9
PP 0.7 0.7
Sulphuric acid 4 4
PVC 0.3 0.3
Sub-total 14 14
Fluids
Transmission fluid 7 7
Engine coolant 12 12
Engine oil 3 3
Petrol/diesel 23 25
Brake fluid 1 1
Refrigerant 0.9 0.9
Water 2 2
Windscreen cleaning agent 0.5 0.5
Sub-total 50 52
Total weight 1240 1463

59
Metal Recycling – Opportunities, Limits, Infrastructure
BOX 2_fComponent Aluminium form*
North America Europe* Japan
2002 kg/car
2006 kg/car
2002 kg/car
2006 kg/car
2002 kg/car
2006 kg/car
Engines Castings
42.0 51.6 36.6 40.3 44.5 45.8
Transmission and driveline Castings
28.1 31.5 15.4 16.3 20.5 21.8
Chassis, suspension and steering Castings/Forgings/ Extrusions/Sheets
6.2 10.1 8.2 12.5 2.9 3.7
Wheels and spares Castings/Forgings/(Sheets)
22.4 23.6 14.2 17.7 17.8 18.9
Heat exchanger Sheets/Extrusions
14.5 14.5 11.0 12.3 12.0 13.6
Brakes Castings/Forgings
2.5 3.5 2.7 3.7 1.7 3.4
Closures Sheets/Extrusions/(Castings)
2.0 2.5 2.4 4.0 0.3 1.6
Body and IP beams Sheets/Extrusions/Castings
0.5 0.5 1.8 2.8 0.1 0.2
Heat shields Sheets
1.7 1.8 1.2 1.4 0.5 1.0
Bumper beams Extrusions
0.6 0.8 1.4 2.8 0.8 0.8
All other components Sheets/Extrusions/Castings/Forgings
4.1 4.1 3.9 3.9 2.8 3.2
Total 124.6 144.6 98.8 117.6 103.9 114.0

60
Metal Recycling – Opportunities, Limits, Infrastructure
The recycling of old cars and vans – End-of-Life vehicles (ELVs) – already plays an impor-tant role in closing resource cycles for a variety of critical commodity materials. Yet the modern car is ever more complex, with increasing electronics and other gadgets that ren-der it an extremely complex product. This will become even worse for electric cars; sever-al “critical” materials including Rare Earths Elements (REEs) and Platinum Group Metals (PGMs) in fuel cells will be needed in vehicles such as shown in Figure 14.
BOX 2_g
Figure 14:
Various REEs and their application
in electric vehicles.
Glass & MirrorsPolishing Powder• Cerium
25+ Electric MotorsThroughout Vehicle• Neodymium (NdFeB) Magnets
Hybrid ElectricMotor and Generator• Neodymium • Praseodymium• Dysprosium• Terbium
LCD Screen• Europium• Yttrium• Cerium
UV CutGlas• Cerium
Diesel FuelAdditive• Lanthanum• Cerium
Hybrid NiMHBattery• Lanthanum• Cerium
CatalyticConverter• Cerium/Zirconium• Lanthanum
The increasingly complex composition of End-of-Life (EoL) scrap, including cars, now includes a multitude of interlinked materials: commodity materials (pure metal, alloys and compounds, such as steel, copper, alumin-ium, zinc and nickel), plastics, rubber, and scarce elements identified as ‘critical’ a for the future economy. Recycling now common-ly has to deal with over 50 elements, rather than a “mere” 20 or so in a zinc concentrate. This has large implications for metal purity and makes recovery of the metals and mate-rials increasingly difficult, in addition to inter-twining different metal cycles.
Losses further increase if no metallurgical infrastructure is available for the economic
a e. g. the EU Raw Materials Initiative (COM, 2008).
production of high-purity metals and mate-rials from a mix of incompatible elements. For example, some metals contaminate steel and aluminium in which they dissolve during processing and from which they cannot be removed economically, or even not at all for thermodynamic reasons.
This inherent complexity requires a Product-Centric view to recycling rather than a Mate-rial-Centric view, a point that will be further discussed later on and also briefly in the fol-lowing section.
61
Metal Recycling – Opportunities, Limits, Infrastructure
1.9 Simulation and design tools – Design for Resource Efficiency (DfRE)Product function may require a complex in-teraction of its components, thus creating complex waste streams. To recover the met-als and materials in them requires a thor-ough understanding of separation physics as well as of the complete system. Design for Recycling (DfR) tools will incorporate these complex physics for showing the inevitable losses due to the functional connections in products. Appendix E: Models and Simulation in Recycling and Appendix F: Physics of Ex-tractive Metallurgy explain this in more detail. Figure 15 shows the underlying thermody-namics and design issues that close the ma-terial cycle.
Commonly, DfR makes no sense, as the met-al value is too low. In that case, the design effort should bear on Recycling Systems for optimal Resource Recovery and Resource Efficiency. Design for Resource Efficiency should drive the creation of a BAT-based re-cycling system that is certified to meet this requirement.
Not all the metals can be extracted from EoL goods, for reasons explained here and shown by Figure 4. Common commodity metals like steel, magnesium and copper can be re-covered relatively easily, as these are often used in relatively simple applications, but the small amounts of precious/critical/valuable metals in, for example, WEEE can be harder to recover from commonly in excess of 50 el-ements.
Table 1 considers some of these precious/critical metals and illustrates where they can be recovered with current BAT practices.
Although different appliances may contain similar suites of functional materials loose-ly called “mineralogies”, i. e. contained ele-ments and functional connections, their re-covery is not the same and hence their recy-cling rates are different. Table 1 shows that, depending on the product and the combina-
tions of materials, the recovery of metals may be different due to chemistry, concentration and metallurgical processes being incompat-ible.
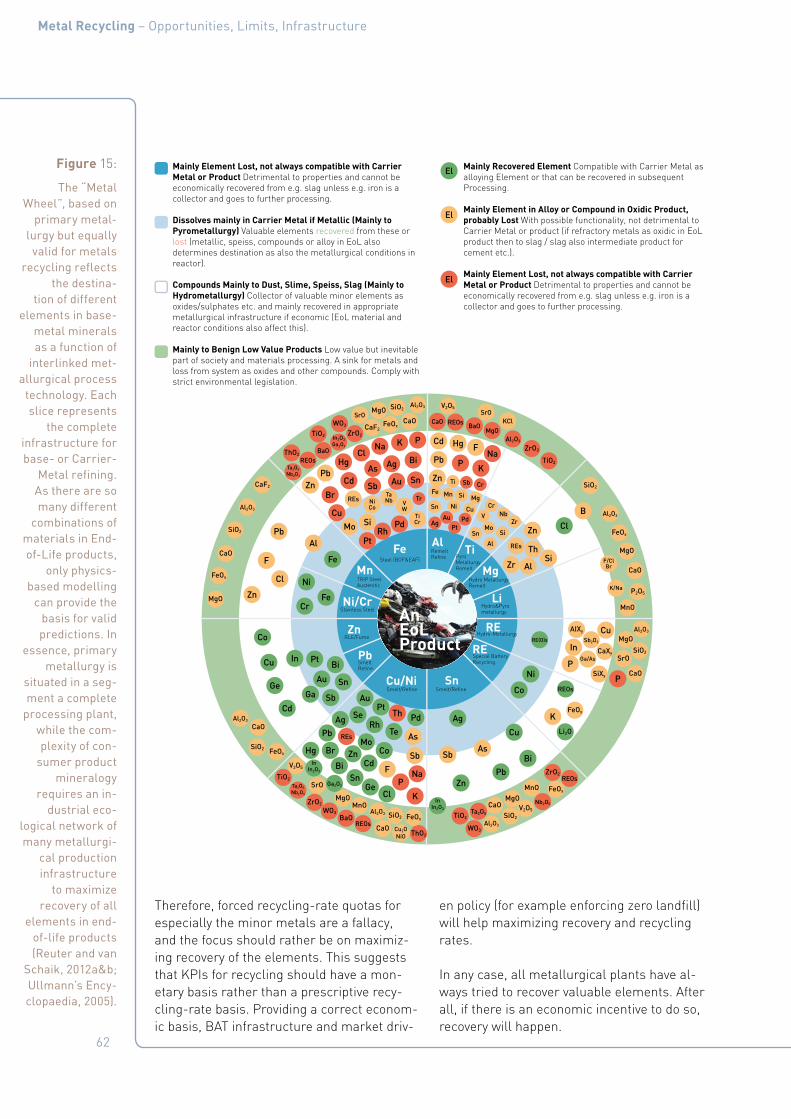
62
Metal Recycling – Opportunities, Limits, Infrastructure
Therefore, forced recycling-rate quotas for especially the minor metals are a fallacy, and the focus should rather be on maximiz-ing recovery of the elements. This suggests that KPIs for recycling should have a mon-etary basis rather than a prescriptive recy-cling-rate basis. Providing a correct econom-ic basis, BAT infrastructure and market driv-
en policy (for example enforcing zero landfill) will help maximizing recovery and recycling rates.
In any case, all metallurgical plants have al-ways tried to recover valuable elements. After all, if there is an economic incentive to do so, recovery will happen.
Figure 15:
The “Metal Wheel”, based on
primary metal-lurgy but equally
valid for metals recycling reflects
the destina-tion of different
elements in base-metal minerals as a function of
interlinked met-allurgical process
technology. Each slice represents
the complete infrastructure for base- or Carrier-
Metal refining. As there are so many different
combinations of materials in End-of-Life products,
only physics-based modelling
can provide the basis for valid predictions. In
essence, primary metallurgy is
situated in a seg-ment a complete
processing plant, while the com-plexity of con-
sumer product mineralogy
requires an in-dustrial eco-
logical network of many metallurgi-
cal production infrastructure
to maximize recovery of all
elements in end-of-life products (Reuter and van
Schaik, 2012a&b; Ullmann’s Ency-clopaedia, 2005).
Mainly Element Lost, not always compatible with Carrier Metal or Product Detrimental to properties and cannot be economically recovered from e.g. slag unless e.g. iron is a collector and goes to further processing.
Dissolves mainly in Carrier Metal if Metallic (Mainly to Pyrometallurgy) Valuable elements recovered from these or lost (metallic, speiss, compounds or alloy in EoL also determines destination as also the metallurgical conditions in reactor).
Compounds Mainly to Dust, Slime, Speiss, Slag (Mainly to Hydrometallurgy) Collector of valuable minor elements as oxides/sulphates etc. and mainly recovered in appropriate metallurgical infrastructure if economic (EoL material and reactor conditions also affect this).
Mainly to Benign Low Value Products Low value but inevitable part of society and materials processing. A sink for metals and loss from system as oxides and other compounds. Comply with strict environmental legislation.
Mainly Recovered Element Compatible with Carrier Metal as alloying Element or that can be recovered in subsequent Processing.
Mainly Element in Alloy or Compound in Oxidic Product, probably Lost With possible functionality, not detrimental to Carrier Metal or product (if refractory metals as oxidic in EoL product then to slag / slag also intermediate product for cement etc.).
Mainly Element Lost, not always compatible with Carrier Metal or Product Detrimental to properties and cannot be economically recovered from e.g. slag unless e.g. iron is a collector and goes to further processing.
RE
ThO2
Li2O
FeOx
FeOx
TiO2
TiO2
SiO2
SiO2
SiO2
SiO2
SiO2
SiO2
SiO2
AIXy
CaXy
SiXy
MgO MgO
MgO
MgO
MgO
MnO
MnO
MnO
CaO
CaO
CaO
CaO
CaO
CaO
CaO
SrO
SrO
MgO
TiO2
ThO2
ZrO2
ZrO2
ZrO2
FeOx
FeOx
V2O5
V2O5
V2O5
Al2O3
Nb2O5
Sb2O3
Ga2O3
Ta2O5Al2O3
Al2O3
Al2O3
Al2O3Al2O3
Al2O3
Ga/As
F/ClBr
InIn2O3
Ta2O5
Nb2O3
In2O3Ga2O3
Cu2ONiO
NiCo
TaNb V
WTiCr
Ta2O5
Nb2O3
InIn2O3
K/Na
Al2O3
FeOxCaF2
FeOx
FeOx
P2O5
WO3
WO3
BaO
RE(O)s
TiO2 ZrO2
CaF2
WO3
REOs
REs
REOs
REOs
REOs
CaO REOs BaOMgO
BaO
REs
REs
Hg
HgCl
Cl
El
Cl
Na
Na
K F
B
F
F
P
P
P
BiAg
Ag
Au
Au
Pt
Pt
Rh
MoCo
Co
Cd
Cd
Zn
Cu In
Sb
Fe
Ni
Cr
Te
PdAg
Al
AlZr
Th
As
AsAs
Cd
Cd
Pb
Mo Si
Pb
Pb
Pb
Pb
ZnFe
Ti
Mn Si MgNiSn Cu
AgAu
Sb
Tr
Cr
SnMo
Si
ZrNbV
Cr
Al
PtPd
In
Zn
ZnCl
Ge
GaGe
Se
Sn
Sn
Bi
Bi
Fe
BrHg
Zn
Zn
Sb
Sb
Si
Sb
Au Sn
Th
Br
PtRh
Pd
P K
K
P
K
Na
Cu
Cu
Cu
Ni
Co
Bi
SrOKCl
SrO
AlTi
Li
Zn
REPb
Sn
Fe
Cu/Ni
MgMn
Ni/Cr
El
El
RemeltRefine
Smelt/RefineSmelt/Refine
Stainless Steel
TRIP SteelAustenitic
RLE/Fume
SmeltRefine
PyroMetallurgyRemelt
Hydro MetallurgyRemelt
Hydro-Metallurgy
Special BatteryRecycling
Hydro&Pyrometallurgy
Steel (BOF&EAF)
ProductEoLAn
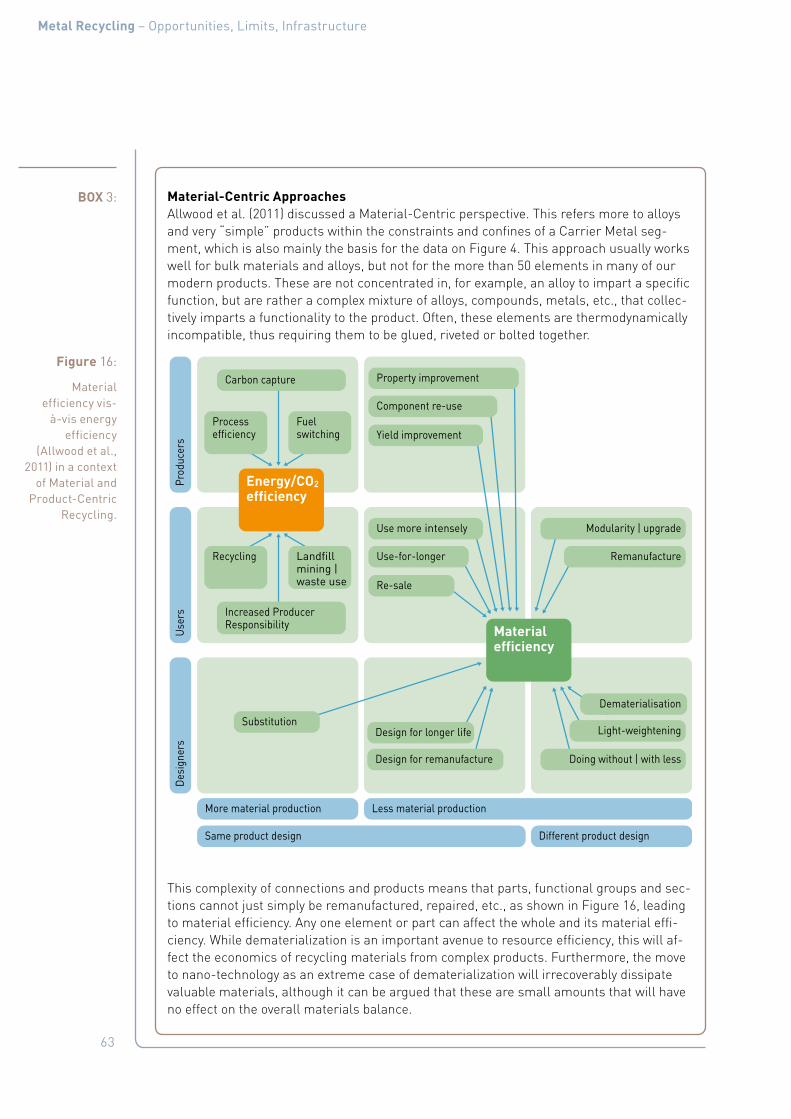
63
Metal Recycling – Opportunities, Limits, Infrastructure
BOX 3: Material-Centric ApproachesAllwood et al. (2011) discussed a Material-Centric perspective. This refers more to alloys and very “simple” products within the constraints and confines of a Carrier Metal seg-ment, which is also mainly the basis for the data on Figure 4. This approach usually works well for bulk materials and alloys, but not for the more than 50 elements in many of our modern products. These are not concentrated in, for example, an alloy to impart a specific function, but are rather a complex mixture of alloys, compounds, metals, etc., that collec-tively imparts a functionality to the product. Often, these elements are thermodynamically incompatible, thus requiring them to be glued, riveted or bolted together.
This complexity of connections and products means that parts, functional groups and sec-tions cannot just simply be remanufactured, repaired, etc., as shown in Figure 16, leading to material efficiency. Any one element or part can affect the whole and its material effi-ciency. While dematerialization is an important avenue to resource efficiency, this will af-fect the economics of recycling materials from complex products. Furthermore, the move to nano-technology as an extreme case of dematerialization will irrecoverably dissipate valuable materials, although it can be argued that these are small amounts that will have no effect on the overall materials balance.
Figure 16:
Material efficiency vis-
à-vis energy efficiency
(Allwood et al., 2011) in a context
of Material and Product-Centric
Recycling.
Prod
ucer
s
Property improvement
Component re-use
Carbon capture
Increased ProducerResponsibility
Yield improvement
Use more intensely
Use-for-longer
Re-sale
Substitution
More material production
Different product design
Less material production
Same product design
Processefficiency
Fuelswitching
Recycling Landfill mining |waste use
Design for longer life
Design for remanufacture
Dematerialisation
Light-weightening
Remanufacture
Doing without | with less
Modularity | upgrade
Use
rsD
esig
ners
Materialefficiency
Energy/CO2
efficiency
64
Metal Recycling – Opportunities, Limits, Infrastructure
1.10 Recycling Data
Design for Resource Efficiency not only re-quires detailed knowledge on the total flow of materials and recyclates, but it also requires these data as (statistical) standard-devia-tion and average-distribution values for each flow. The shape of this distribution (Normal, Weibull, or even multi-modal) must be known as well. In addition, as the metals contained in recyclates are the economic target, their average and standard-deviation distributions in the input recyclates should be known as well.
Such understanding within a context of physi-cal and metallurgical recycling technology and its economics, permits the calibration of detailed mass-balance models (van Schaik and Reuter, 2004a, 2007a&b, 2010). It also fa-cilitates the construction of detailed Design for Resource Efficiency models for maximiz-ing resource efficiency, a point already dis-cussed in detail by Buckminster Fuller (1981). Such theoretical knowledge is common prac-tice in standard mineral processing and ex-tractive metallurgy, used daily for optimizing metal recovery at all levels of the business. While the theoretical basis was developed for dealing with physical recycling, it is not gen-erally applied. To advance recycling, the theo-retical basis of physical recycling will have to be applied in industry, in order to match the sophistication of classic mineral processing that now is on par with metallurgical pro-cessing.
Identifying the detailed metal, compound, etc., contents in all flows will help optimiz-ing the recycling system, as is already the case for the maximum recovery of metals in concentrates from known ore and product streams, giving a rather precise mass bal-ance for all total, compound and elemental flows.
1.11 Some policy trends
Given the above-described trends in metal content of waste-recycling flows, policies in many parts of the world increasingly aim at better recycling efficiency. Government poli-cies for waste treatment were usually first put in place to tackle environmental prob-lems caused by waste dumping or poor treat-ment. Today, they increasingly move toward extracting valuable materials and energy from waste streams.
Recycling can have two goals: a means for End-of-Life management and securing a ma-terial resource supply. Figure 17 shows these trends for consumer waste (Municipal Solid Waste, MSW) and industry waste (IW), indi-cating estimated future evolution. However, care must be taken to ensure that the “Ur-ban Mine” has a well-defined mineralogy. It is already difficult to recover metals economi-cally from the Earth’s minerals, but “chaoti-cally” dumped materials in a landfill further complicate their economically viable “min-ing”, due to a poorly described, for the most part unknown and large heterogeneous com-position.

65
Metal Recycling – Opportunities, Limits, Infrastructure
Recycling legislation for EoL home applianc-es, especially for the larger ones (air-con-ditioners, refrigerators, TV sets or washing machines), now exists in various parts of the world (e. g. European Commission). In Ja-pan, EoL legislation has been effective since April 2001. Though this law had more an end-of-life-management motivation, the Japa-nese government now has implemented vari-ous recycling policies for securing resourc-es. This has been one of the four important approaches in Japanese mineral resource policy: securing stable supplies from (most-ly overseas) mines, material substitution, stockpiling and recycling.
As a result of such legislation, the recy-cling of products made of one material type, such as newspapers, glass or plastic bot-tles, or metal cans, is already common prac-tice in many countries, and becoming more so. More complicated products, such as cars, batteries and electronic products, are now slowly entering the recycling stream as well. These, however, require a careful policy re-think for maximizing resource efficiency. Fig-ure 18 shows how the recycling of 11 prod-ucts (paper/cardboard, plastic bottles, cans, glass, metals, clothes/shoes, cell phones, batteries, television sets, refrigerators and computers) varies for various countries, showing that there is much room for increas-ing resource efficiency.
Figure 17:
Schematic overview of the
historic and (potential) future
evolution of waste management. (Jones, 2008;
Jones and De Meyere, 2009;
Jones et al. 2012).
MSW: Municipal Solid
Waste
IW: Industry Waste
LFM: Landfill
Management
ELFM: Enhanced Landfill
Management
EWM: Enhanced Waste
Management
EPR: Extended Producer
Responsibility
MSW
Stocks of closed landfills
Past 1980s 1990s 2000+ Future
EMW
LFM Energyrecovery
Material recovery
Uncontrolleddumping
Controlledlandfilling
Controlledlandfilling
IncinerationwithoutE-recovery
Prevention
Recuperation(glass, paper)
Incinerationwithout/withE-recovery
Controlledlandfilling
Prevention
Re-use(industrial ecology, CtC)
Incineration
Landfilling as a final solution
Prevention
Recuperation(glass, paper)
IncinerationwithE-recovery
Landfilling
Prevention
Re-use(industrial ecology)
IncinerationE-recovery
Landfilling
Increasing
TemporarystorageEPR
Uncontrolleddumping
Controlledlandfilling
IW
ELFM ELFM

66
Metal Recycling – Opportunities, Limits, Infrastructure
Recycling is one part of a wider transition to a ‘Green’ or ‘Resource Efficient’ Economy. Many nations and international organizations have seen the benefits from a well-paced move to an economy that delivers social pro-gress, while using fewer natural resources. The UN’s own Green Economy Initiative and the OECD’s Green Growth Strategy are two examples. Another one is China’s 12th 5-year plan (released in 2011) that has a strong fo-cus on reducing the material and energy in-tensity of its economy. Finally, the EU has prioritized increasing resource efficiency as a key part of its economic goals for 2020, and has laid out its strategy for achieving this goal.
The World Business Council for Sustainable Development (WBCSD) supports increasing material efficiency as the route to the future. It promotes recycling within a wider strategy of longer and more efficient use of materials and “products” in improved designs, through repair, re-manufacture, reuse, re-sale, mod-ularity, dematerialization, and light-weighting (Ellen McArthur Foundation, 2012). While this report (ibid.) discusses recycling, it does so more from a Material (& Metal)-Centric point of view, without addressing in detail the vari-ous limitations for providing a complete pic-ture of recycling.
1.12 Summary: Enabling and achieving resource efficiency
In summary, we discuss how the environ-mental footprint of society can be minimized, by maximizing resource efficiency on a tech-nological and economic basis as well as through a deep understanding of physics.
It is obvious that, when considering metals, all other resources, such as water, land, en-ergy, etc., come into play as well. Hereafter, we briefly discuss the inherent multi-level complexity of the system, providing indica-tions how this system can be optimized for maximizing resource efficiency.
This report’s intention is also to empower the highest level of recycling. The opportunity is therefore also discussed of fostering clean recycling (inclusive of dismantling) in the de-veloping world.
Figure 18:
Mean number of items out
of 11 that are being recycled
(Damanhuri, 2012).
USA5.8
UK6.5
Argentina2.4
India3.8
China4.4
Indonesia1.8
UAE1.6Nigeria
1.8
Finland7.8
Germany7.4
Spain7.2

67
Metal Recycling – Opportunities, Limits, Infrastructure
2. Recycling Opportunities
Recycling can greatly increase the amount of available metals for society, provided the potential sources and recycling technologies exist. The opportunities described below in-dicate why increased recycling is one of the important ways that the global economy can continue to sustain itself in the future.
The benefits of recycling are potentially very significant: it reduces the future scarcity of some high-demand elements, creates eco-nomic value, reduces greenhouse gas emis-sions and limits other environmental harm. It forms a vital part of the transition to a green economy, where societal progress is decou-pled from unsustainable natural-resource depletion, and, last but not least, it provides a source of metals in high demand for sustain-ability-enabling technology.
The opportunities come from a wide range of recycling sources. Some of these are de-scribed below, but the reader can also con-sult Appendix A: "Details on Recovery of Met-als from Recyclates", Appendix B: "Details on Metals found in WEEE", Appendix C: "Details on Battery Recycling", and Appendix D: "Mo-bile Phone Collection".
2.1 Recovery of high-tech and high-value metals from different sources
2.1.1 Waste electronic and electrical equipment, lamps, LEDs, batteries etc.One of the most promising recycling sourc-es is waste electronic and electrical equip-ment (WEEE), containing many of the metals with rising demand. It is the post-consump-tion waste of consumer and business devic-es like mobile phones, computers, screens, monitoring appliances and kitchen applianc-es. Figure 19 shows just how much of WEEE is typically metal – not only the 60 % ‘Metals’ slice, but also the metal and metallic com-pounds found in printed circuit boards, CRT and LCD screens, cables and metal-plastic mixes. See also Appendix B: "Details on Met-als found in WEEE", Appendix C: "Details on Battery Recycling", and Appendix D: "Mobile Phone Collection".
Figure 19:
Typical material fractions in WEEE
(Ongondo et al., 2011).
Metals
Others
Plastics
Metal-plastic mixture
Cables
CRT & LCD screens
Printed circuit boards
Pollutants
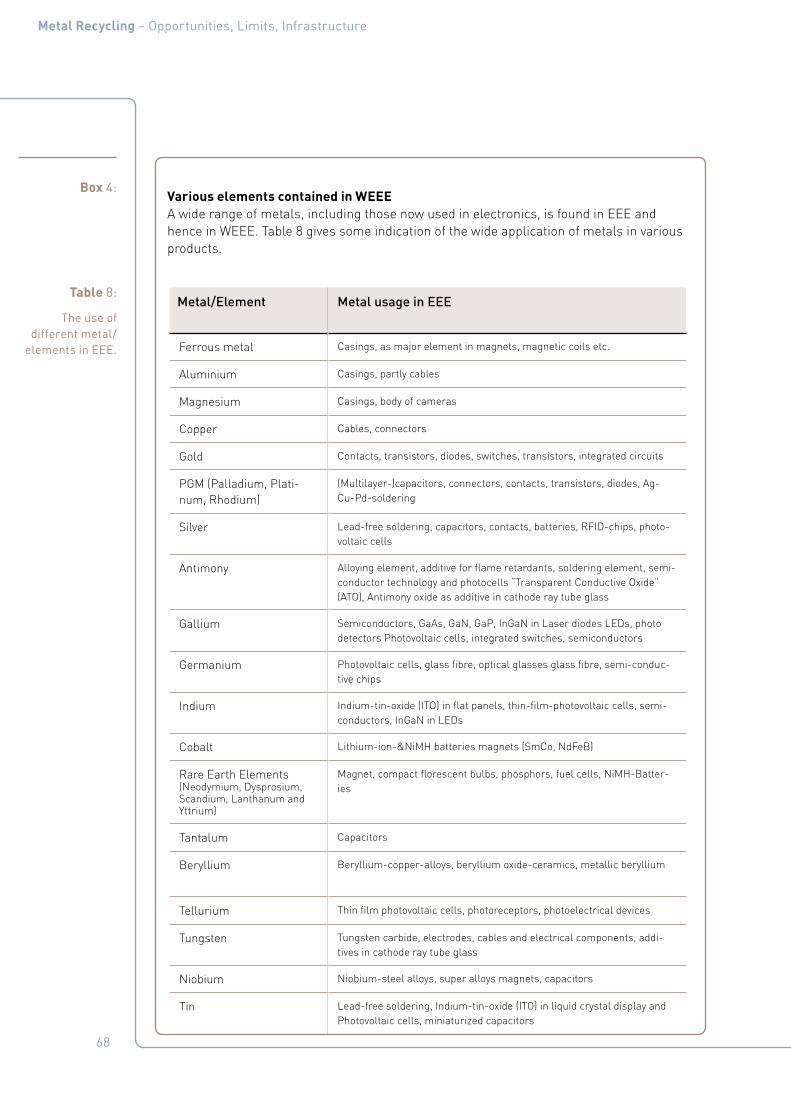
68
Metal Recycling – Opportunities, Limits, Infrastructure
Box 4: Various elements contained in WEEEA wide range of metals, including those now used in electronics, is found in EEE and hence in WEEE. Table 8 gives some indication of the wide application of metals in various products.
Table 8:
The use of different metal/
elements in EEE.
Metal/Element Metal usage in EEE
Ferrous metal Casings, as major element in magnets, magnetic coils etc.
Aluminium Casings, partly cables
Magnesium Casings, body of cameras
Copper Cables, connectors
Gold Contacts, transistors, diodes, switches, transistors, integrated circuits
PGM (Palladium, Plati-num, Rhodium)
(Multilayer-)capacitors, connectors, contacts, transistors, diodes, Ag-Cu-Pd-soldering
Silver Lead-free soldering, capacitors, contacts, batteries, RFID-chips, photo-voltaic cells
Antimony Alloying element, additive for flame retardants, soldering element, semi-conductor technology and photocells “Transparent Conductive Oxide” (ATO), Antimony oxide as additive in cathode ray tube glass
Gallium Semiconductors, GaAs, GaN, GaP, InGaN in Laser diodes LEDs, photo detectors Photovoltaic cells, integrated switches, semiconductors
Germanium Photovoltaic cells, glass fibre, optical glasses glass fibre, semi-conduc-tive chips
Indium Indium-tin-oxide (ITO) in flat panels, thin-film-photovoltaic cells, semi-conductors, InGaN in LEDs
Cobalt Lithium-ion-&NiMH batteries magnets (SmCo, NdFeB)
Rare Earth Elements (Neodymium, Dysprosium, Scandium, Lanthanum and Yttrium)
Magnet, compact florescent bulbs, phosphors, fuel cells, NiMH-Batter-ies
Tantalum Capacitors
Beryllium Beryllium-copper-alloys, beryllium oxide-ceramics, metallic beryllium
Tellurium Thin film photovoltaic cells, photoreceptors, photoelectrical devices
Tungsten Tungsten carbide, electrodes, cables and electrical components, addi-tives in cathode ray tube glass
Niobium Niobium-steel alloys, super alloys magnets, capacitors
Tin Lead-free soldering, Indium-tin-oxide (ITO) in liquid crystal display and Photovoltaic cells, miniaturized capacitors
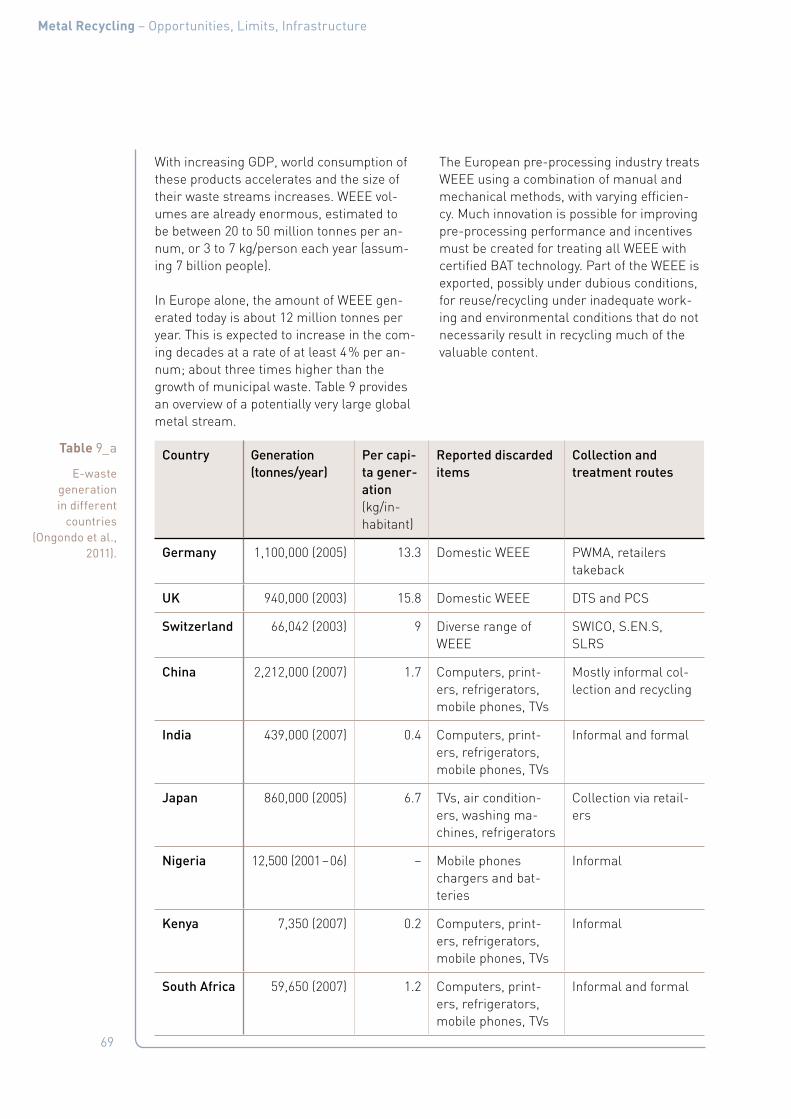
69
Metal Recycling – Opportunities, Limits, Infrastructure
With increasing GDP, world consumption of these products accelerates and the size of their waste streams increases. WEEE vol-umes are already enormous, estimated to be between 20 to 50 million tonnes per an-num, or 3 to 7 kg/person each year (assum-ing 7 billion people).
In Europe alone, the amount of WEEE gen-erated today is about 12 million tonnes per year. This is expected to increase in the com-ing decades at a rate of at least 4 % per an-num; about three times higher than the growth of municipal waste. Table 9 provides an overview of a potentially very large global metal stream.
The European pre-processing industry treats WEEE using a combination of manual and mechanical methods, with varying efficien-cy. Much innovation is possible for improving pre-processing performance and incentives must be created for treating all WEEE with certified BAT technology. Part of the WEEE is exported, possibly under dubious conditions, for reuse/recycling under inadequate work-ing and environmental conditions that do not necessarily result in recycling much of the valuable content.
Table 9_a
E-waste generation in different
countries (Ongondo et al.,
2011).
Country Generation (tonnes/year)
Per capi-ta gener-ation (kg/in-habitant)
Reported discarded items
Collection and treatment routes
Germany 1,100,000 (2005) 13.3 Domestic WEEE PWMA, retailers takeback
UK 940,000 (2003) 15.8 Domestic WEEE DTS and PCS
Switzerland 66,042 (2003) 9 Diverse range of WEEE
SWICO, S.EN.S, SLRS
China 2,212,000 (2007) 1.7 Computers, print-ers, refrigerators, mobile phones, TVs
Mostly informal col-lection and recycling
India 439,000 (2007) 0.4 Computers, print-ers, refrigerators, mobile phones, TVs
Informal and formal
Japan 860,000 (2005) 6.7 TVs, air condition-ers, washing ma-chines, refrigerators
Collection via retail-ers
Nigeria 12,500 (2001 – 06) – Mobile phones chargers and bat-teries
Informal
Kenya 7,350 (2007) 0.2 Computers, print-ers, refrigerators, mobile phones, TVs
Informal
South Africa 59,650 (2007) 1.2 Computers, print-ers, refrigerators, mobile phones, TVs
Informal and formal

70
Metal Recycling – Opportunities, Limits, Infrastructure
WEEE: waste electrical and electronic equipment; TV: television; PWMA: public waste management authorities; DTS: distributor takeback scheme; PCS: producer compliance scheme; SWICO: Swiss association for information, communication and organisation technology; S.E.N.S: Swisss foundation for waste management; SLRS: Swiss light recycling foundation
Table 9_b
E-waste generation in different
countries (Ongondo et al.,
2011).
Country Generation (tonnes/year)
Per capi-ta gener-ation (kg/in-habitant)
Reported discarded items
Collection and treatment routes
Argentina 100,000 2.5 Excludes white goods, TVs and some consumer electronics
Small number of takeback schemes, municipal waste ser-vices
Brazil 679,000 3.5 Mobile and fixed phones, TVs, PCs, radios, washing maschines, refriger-ators and freezers
Municipalities, recy-clable waste collec-tors
USA 2,250,000 (2007) 7.5 TVs, mobile phones, computer products
Municipal waste ser-vices: a number of voluntary schemes
Canada 86,000 (2002) 2.7 Consumer equip-ment, kitchen and household appli-ances
A number of volun-tary schemes
Australia – – Computers, TVs, mobile phones and fluorescent lamps
Proposed nation-al recycling scheme from 2011; voluntary takeback

71
Metal Recycling – Opportunities, Limits, Infrastructure
High-value or potentially scarce metals are not equally distributed in different scrap equipment. Specifically, small WEEE will have high concentrations of precious and specialty metals (Table 10).
Printed circuit boards can form a significant part of EEE, providing a wealth of metals, compounds and alloys (Figure 20). Together, mobile phones and desktop personal com-puters (PC) account for 39 % of the precious metal in WEEE, based on data for 2007 for Germany (Chancerel and Rotter, 2009a&b). The global sales volumes of these devices suggest that they contain significant metal volumes (Table 11). However, adequate col-lection of all devices remains a significant challenge for tapping this large source of material.
Table 10:
Value versus weight
distribution of different
materials in various devices
(Hagelüken et al., 2009).
Weight-share Fe Al Cu plas-tics
Ag (ppm) Au (ppm) Pd (ppm)
Monitor-board 30 % 15 % 10 % 28 % 280 20 10
PC-board 7 % 5 % 18 % 23 % 900 200 80
Mobile phone 7 % 3 % 13 % 43 % 3000 320 120
Portable audio 23 % 1 % 21 % 47 % 150 10 4
DVD-player 62 % 2 % 5 % 24 % 115 15 4
Calculator 4 % 5 % 3 % 61 % 260 50 5
Value-share Fe Al Cu Sum PM
Ag Au Pd
Monitor-board 4 % 14 % 35 % 47 % 7 % 33 % 7 %
PC-board 0 % 1 % 13 % 86 % 5 % 69 % 12 %
Mobile phone 0 % 0 % 6 % 93 % 11 % 71 % 11 %
Portable audio 3 % 1 % 73 % 21 % 4 % 16 % 3 %
DVD-player 15 % 3 % 30 % 52 % 5 % 42 % 5 %
Calculator 1 % 4 % 10 % 85 % 6 % 76 % 3 %
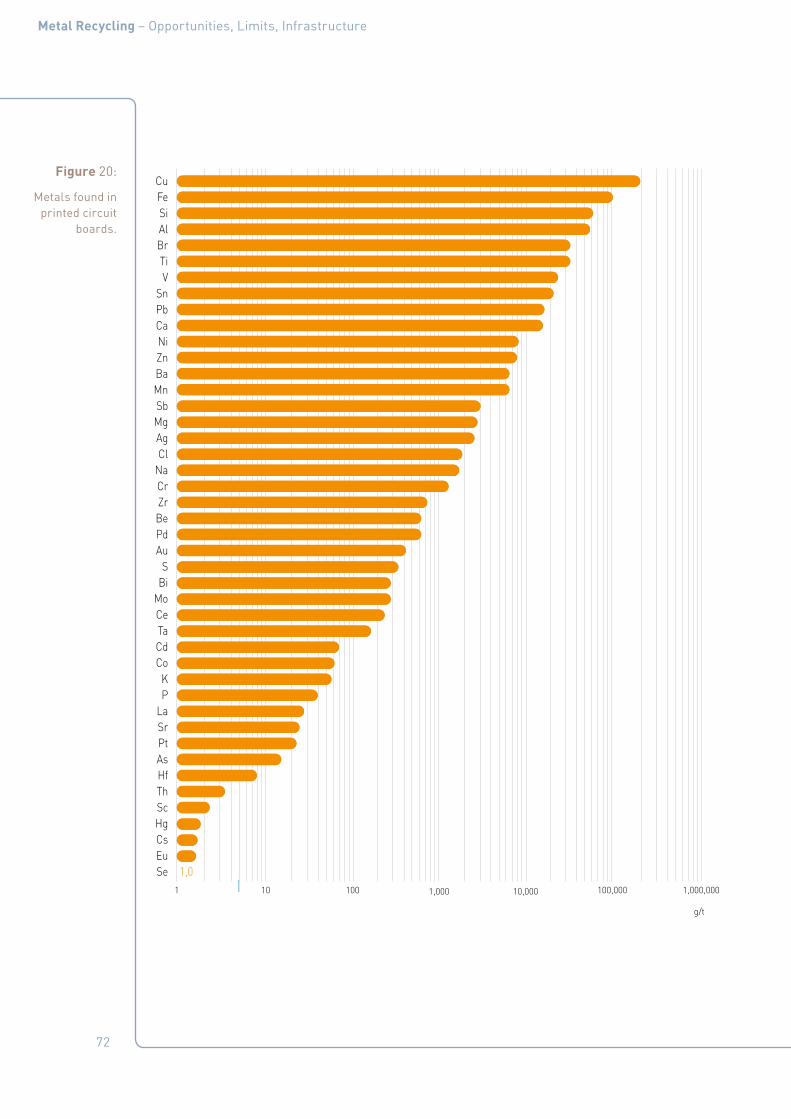
72
Metal Recycling – Opportunities, Limits, Infrastructure
Figure 20:
Metals found in printed circuit
boards.
1 10 100 100,000 1,000,00010,0001,000
g/t
EuCs
Se 1,0
HgScThHfAsPtSrLaPK
CoCdTaCeMoBiS
AuPdBeZrCrNaClAgMgSbMnBaZnNiCaPbSn
VTi
BrAlSiFeCu
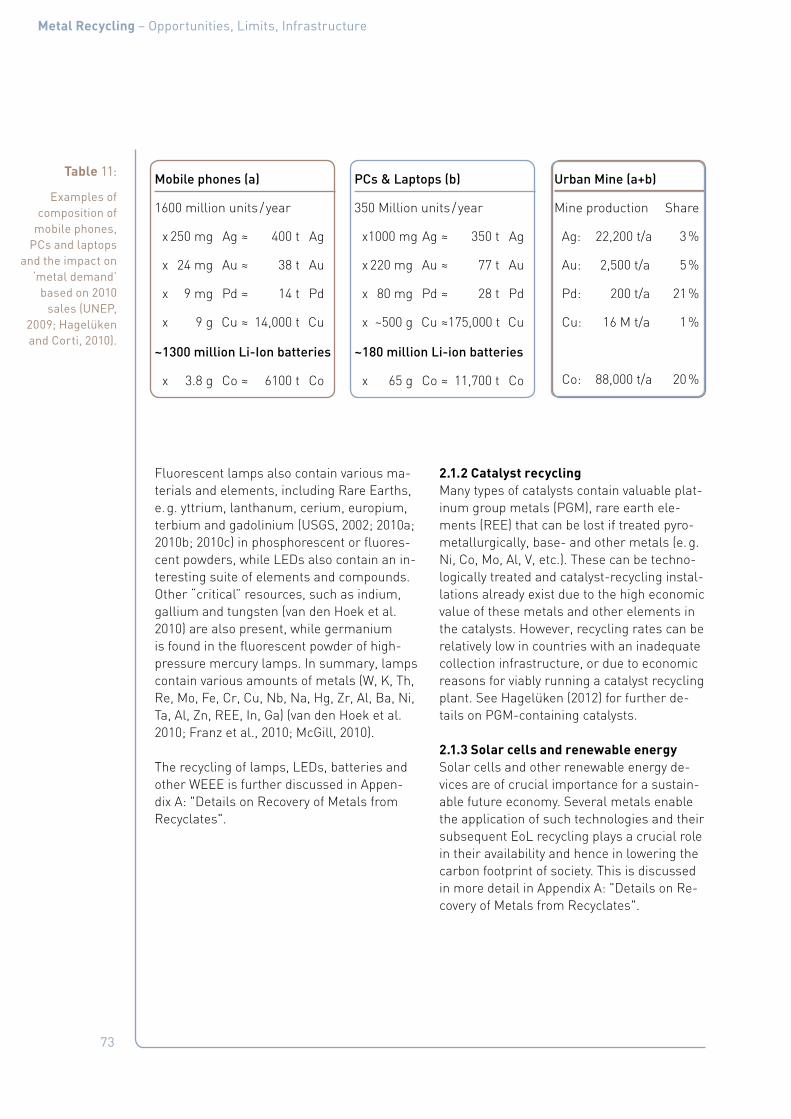
73
Metal Recycling – Opportunities, Limits, Infrastructure
Fluorescent lamps also contain various ma-terials and elements, including Rare Earths, e. g. yttrium, lanthanum, cerium, europium, terbium and gadolinium (USGS, 2002; 2010a; 2010b; 2010c) in phosphorescent or fluores-cent powders, while LEDs also contain an in-teresting suite of elements and compounds. Other “critical” resources, such as indium, gallium and tungsten (van den Hoek et al. 2010) are also present, while germanium is found in the fluorescent powder of high-pressure mercury lamps. In summary, lamps contain various amounts of metals (W, K, Th, Re, Mo, Fe, Cr, Cu, Nb, Na, Hg, Zr, Al, Ba, Ni, Ta, Al, Zn, REE, In, Ga) (van den Hoek et al. 2010; Franz et al., 2010; McGill, 2010).
The recycling of lamps, LEDs, batteries and other WEEE is further discussed in Appen-dix A: "Details on Recovery of Metals from Recyclates".
2.1.2 Catalyst recyclingMany types of catalysts contain valuable plat-inum group metals (PGM), rare earth ele-ments (REE) that can be lost if treated pyro-metallurgically, base- and other metals (e. g. Ni, Co, Mo, Al, V, etc.). These can be techno-logically treated and catalyst-recycling instal-lations already exist due to the high economic value of these metals and other elements in the catalysts. However, recycling rates can be relatively low in countries with an inadequate collection infrastructure, or due to economic reasons for viably running a catalyst recycling plant. See Hagelüken (2012) for further de-tails on PGM-containing catalysts.
2.1.3 Solar cells and renewable energySolar cells and other renewable energy de-vices are of crucial importance for a sustain-able future economy. Several metals enable the application of such technologies and their subsequent EoL recycling plays a crucial role in their availability and hence in lowering the carbon footprint of society. This is discussed in more detail in Appendix A: "Details on Re-covery of Metals from Recyclates".
Table 11:
Examples of composition of
mobile phones, PCs and laptops
and the impact on ‘metal demand’
based on 2010 sales (UNEP,
2009; Hagelüken and Corti, 2010).
Mobile phones (a)
1600 million units / year
x 250 mg Ag ≈ 400 t Ag
x 24 mg Au ≈ 38 t Au
x 9 mg Pd ≈ 14 t Pd
x 9 g Cu ≈ 14,000 t Cu
~1300 million Li-Ion batteries
x 3.8 g Co ≈ 6100 t Co
PCs & Laptops (b)
350 Million units / year
x 1000 mg Ag ≈ 350 t Ag
x 220 mg Au ≈ 77 t Au
x 80 mg Pd ≈ 28 t Pd
x ~500 g Cu ≈ 175,000 t Cu
~180 million Li-ion batteries
x 65 g Co ≈ 11,700 t Co
Urban Mine (a+b)
Mine production Share
Ag: 22,200 t/a 3 %
Au: 2,500 t/a 5 %
Pd: 200 t/a 21 %
Cu: 16 M t/a 1 %
Co: 88,000 t/a 20 %

74
Metal Recycling – Opportunities, Limits, Infrastructure
2.1.4 REE recovery from EoL products and residues – A key issueNew processing capacity for recovering REE is being installed (Toyota Tsusho Corpora-tion, 2010; Lynas Corporation, 2011; Schüler et al., 2011). Appendix F: "Physics of Extrac-tive Metallurgy" provide more information. REE can also be recovered from various other secondary sources, residues, magnets, etc. The problem lies not so much in the chemis-try of REE extraction, but rather in providing suitable concentrates/recyclates from which they can be economically recovered. Hence, efforts must focus on physical separation and concentration. The metallurgical extraction chemistry is well-known, but must learn how to deal with the unusual impurities that ac-company recyclates.
2.2 Recovery of Carrier Metals and materials from recycled metals, materials and sludges
2.2.1 Steel (Fe-C-X), high Mn steel (austenitic Fe-Mn-X), stainless steel (Fe-Cr-Ni-X), copper (Cu-X), nickel (Ni-X), aluminium (Al-X) (where X are alloying elements)These important metals and alloys generally have a higher recycling rate than others that, however, can be improved, for example by better separation of metals from recyclates and residues. Contamination is the biggest challenge, as is the fact that many stain-less-steel types as well as high-Mn austen-itic steels are non-magnetic, and therefore are not readily recovered by simple magnetic means.
In addition the various speciality nickel alloys, such as Hastelloy (molybdenum, chromium, some tungsten, used as premier corrosion-resistant alloys in various tough environ-ments), Alnico (aluminium, cobalt; used in magnets), etc., which, if collected, can again be refined into these valuable alloys. See also Appendix A: "Details on Recovery of Metals from Recyclates".
2.2.2 Recovery of metals from residuesA group of potentially rich recycling sources of metal are the various residues produced by industrial processes. Though the technology commonly is available for the recycling and recovery of metals and/or their compounds from residues, this may not always be eco-nomically viable – e. g. when only one or two of the metals in the residue are recovered – as gate fees, processing costs, etc., can exceed processing and treatment incomes. However, this economic hurdle can be over-come by an intelligent combination of differ-ent metallurgical processes for recovering a wider range of metals. For example, although hard metal scrap contains only relatively small amounts of elements such as niobium, tantalum and titanium, these can be recov-ered from a residue produced during the ex-traction of tungsten from such scraps.
75
Metal Recycling – Opportunities, Limits, Infrastructure
2.2.2.1 Zinc-containing residues When zinc metal is produced from primary sources, some of the created residues (e. g. goethite precipitate) are potential sources of recycled zinc and other valuable metals, like silver, cobalt, indium, germanium and anti-mony. These can be processed in an exist-ing type of integrated plant that is suitable for dealing with elements that are associated, and thermodynamically “compatible”, with Cu, Zn and Pb.
Estimates based on pioneering work by Pi-ret (2006) and Alfantazi and Moskalyk (2003) suggest that the worldwide amounts of these jarosite and goethite residues from zinc hy-drometallurgy are: jarosite: 3290 ktpa un-treated (ca. 100 ktpa contained Zn); goethite: 310 ktpa untreated (ca. 20 ktpa contained Zn). Assuming around 200 g/t and 130 g/t silver in jarosite and goethite, respectively, an esti-mated further 120 tonnes of silver might be recovered per year from these residues, or about 0.6 % of 2007 world production (Piret, 2006), together with the other valuable met-als. Companies such as KoreaZinc economi-cally recover various metals and materials from zinc-processing goethite residues.
2.2.2.2 Electric arc furnace dust and other Pb, Zn, Cu containing residuesWhen steel scrap is processed in an Elec-tric Arc Furnace (EAF), about 15 – 20 kg of dust is formed per tonne of steel. Extrapolat-ing figures for EAF production in 2010, this means that between 5.2 and 7 million tonnes EAF dust is produced each year (Global Steel Dust, 2012). This EAF dust contains quanti-fiable amounts of zinc, lead and other met-als. Most of it is processed through a ‘Waelz’ kiln, which produces an oxide that can then be further processed in a zinc plant for pro-ducing LME-grade zinc. Other zinc- and lead-containing residues or waste from zinc-using industries, or dust from a cupola furnace, can be similarly processed. The main recycling route for EAF dust is the Waelz kiln, proven to consume much less energy than other re-cycling processes for steel mill dust (Befesa, 2012). Other processes such as REZEDA ex-ist, that produce Zn powder directly. The pow-
der can be directly remelted and reused for the galvanizing of steel.
2.2.2.3 Red Mud from alumina productionWorldwide disposal areas of bauxite resi-due (‘Red Mud’) contain an estimated 2.7 bil-lion tonnes of residue, a figure that each year grows by about 120 million tonnes (Klauber et al., 2011a; 2011b). This mud contains valu-able gallium with a considerable econom-ic value, in addition to up to 10 % by weight of TiO2, chromium, vanadium and zirconium (and about 1000 ppm scandium, yttrium and other REE). The current form of disposal – dumping into ‘ponds’ – increasingly runs into problems of environmental permits.
In the past, several attempts were made to recycle and process this residue. Many of these investigations aimed at extracting iron, titanium, or aluminium, but some attempts were also made to recover other elements, such as REE (Luidold and Antrekowitsch, 2011). Usually, the economics are prohibitive, although technology such as TSL (Outotec) can treat this material and mitigate the en-vironmental issues. However, the reprocess-ing of Red Mud, combining the reclamation of iron, titanium and concentrates of different scarce elements, is now potentially feasible due to the currently (2012) high prices of REE and other “critical” elements, such as gal-lium.
2.2.2.4 Residue cleaningIn various parts of the world, furnaces are now in use that recover a wide range of ele-ments from residues and produce a final be-nign granulated slag for construction pur-poses. This is usually done as a combination of processes that can also recover elements such as indium, silver, germanium and other valuable metals. By understanding the phys-ics and economics of recycling, these pro-cesses permit maximal recovery of metals through an intelligent and innovative combi-nation of pyro- and hydro-metallurgy (Fig-ure 21).
The type of infrastructure and knowledge shown in Figure 21 is a good example of what

76
Metal Recycling – Opportunities, Limits, Infrastructure
is needed for recycling and residue process-ing. It provides all the technology for dealing with elements that are associated and work thermodynamically with Cu, Zn and Pb met-allurgy. In this respect, we should also high-light metal recovery from foundry sands and other contaminated sands.
2.3 Other end-of-life waste streams
Further potential metal sources are oth-er EoL waste types in either current or past streams, as described hereafter and dis-cussed in more detail in Appendix A: "Details on Recovery of Metals from Recyclates".
2.3.1 Aluminium in municipal solid waste (MSW)Municipal Solid Waste (MSW) often con-tains aluminium metal. Based on MSW sam-ple analyses, CEWEP (Coalition of European Waste to Energy Plants, WtoE) estimates an average aluminium content of 1 % or more in all metallic and non-metallic MSW sent to WtoE plants, the maximum amount that can be transferred to bottom ashes as metallic aluminium. It is estimated that between 50
to 75 % of the aluminium comes from pack-aging, much of which will oxidize. Pruvost (2011) estimated that residual MSW in the EU-27 in 2006 contained about 1684 kt of alu-minium, of which 533 kt went to WtoE plants.
These numbers – and thus the potential – vary from country to country, depending on
the aluminium packaging mix (e. g. a small or large market share of aluminium cans) and the alternative collection schemes in place. Aluminium also turns up in MSW from non-household sources, such as small- and me-dium-sized businesses or restaurants, or as a compound within other materials, demoli-tion debris or street waste.
Non-ferrous metals extraction is already a profitable activity, with metal prices rang-ing from 300 1/t to 1000 1/t. Most operators interviewed for a 2009 study (Pruvost, 2011) mentioned a payback period for their equip-ment investment of maximum two years. However, this situation is open for improve-ment. For example, in the EU-27 and EFTA countries, it was estimated that, in 2006, about 130,000 tonnes of non-ferrous metals
Figure 21:
Plant solu-tions based on
commodity-metals produc-tion technology
best handle the, often low-volume,
critical-element recycling. The
above Korea Zinc flowsheet not
only creates no ponded residue,
but also recovers many valuable
elements as-sociated with zinc minerals, such as indium, which are
critical to flat-panel TV technol-ogy (Hoang et al.,
2009).
FeedsPb Secondary ResiduesAg & Pb Concentrates
FumeLeachingPlant
QSL Pb AusmeltPlant
ZnPlant
CuSpeiss
Residue
Pb ResidueGoethite
SlagBullion
BullionCuDross
Bullion
Pb Slime
High Pb Slag
FumeZn/Pb Fume
CuSpeiss
CuRemoval
LeachedResidues
AgConcentrates
Ausmelt TSL Zn Fumers
Ausmelt TSL Residue Fumers
Ausmelt TSL QSL Fumers
Cu Ausmelt TSL
Pb Refinery
PMR
Zn & otherBy Poducts
DiscardSlag
Steam &Energy
Cu Pb Bi, Ag, Au,In

77
Metal Recycling – Opportunities, Limits, Infrastructure
(gross weight) were extracted from bottom ashes, with around 60 – 65 % of that being aluminium (about 80,000 tonnes) or around 75 % of the potential. Better technology and increased waste flow into WtoE plants could triple this to 250,000 tonnes of aluminium a year by 2020.
Another major objective of waste manage-ment should be to avoid incinerating valua-ble materials, as these usually get lost in the rather unsophisticated operation of this tech-nological option.
2.3.2 Enhanced landfill mining (ELFM) and enhanced waste management (EWM)The waste that has already been dumped (and thus stored) in landfills worldwide, is a valu-able resource. Landfill "mining" of waste from the ground for valuable metals such as cop-per or aluminium, or methane gas reclama-tion, are relatively common operations (van der Zee et al., 2004; Jones, 2008; Prechthai et al., 2008; Jones et al. 2012). Billions of tonnes of waste are now in landfill; for instance, it is estimated that there are around 150,000 land-fills in Europe (Hogland et al., 2011).
Enhanced landfill mining is a relatively new concept that valorizes landfill waste for both materials and energy (Bosmans et al., 2012). Organic and high-calorific value waste can be used by advanced technology for producing energy from plasma, together with producing a usable slag containing valuable metals. It must be stressed that this option should only be used for existing landfills and should not be considered as a technology and policy op-tion for the future, due to its inherently high losses of valuable metals.
Box 5: The Houthalen-Hechteren landfill in BelgiumA joint venture was set up to exploit the Houthalen-Hechteren landfill site in Belgium us-ing ELFM, storing more than 16 million tonnes of waste, half municipal solid waste and the other half industrial waste. Preliminary calculations showed that about 45 % of the waste could be recycled, either directly or after controlled treatment. The recycling resi-due can be used as energy (and material) by firing a 75 to 100 MW electrical power plant based on plasma technology. In addition to the electricity/heat generating plant, up to 50 hectares of greenhouses are planned, heated by steam and using part of the CO2 emitted by the generating plant. The project is expected to require an investment of approximately 230 M 1 and would employ up to 800 full-time staff. The installations should become op-erational by the end of 2013 and be in use for at least 20 years.

78
Metal Recycling – Opportunities, Limits, Infrastructure
2.3.3 Recovery of phosphorus from recycled sourcesPhosphorus is an essential nutrient for plants and animals, with increasing global demand and for 80 – 90 % used in agriculture. There are no substitutes for phosphorus. Its mineral supply is concentrated in only a few countries, and recent years have seen price volatility due to supply and demand imbal-ances. In addition, it poses significant sus-tainability challenges (Abelson, 1999; Chris-ten, 2007).
However, substantial dissipation of phospho-rus occurs in metal production. In Japan, for example, the amount of phosphorus ending up in dephosphorization slag from steel mak-ing is equal to its total phosphate-ore import. The proposed phosphorus-recovery technol-ogy (Yokoyama et al., 2007) could significantly reduce worldwide losses of this valuable re-source, providing new phosphorus streams to mitigate the problems with existing mineral extraction (Figure 22).
2.4 Benefits from increased recycling
More and better recycling holds great eco-nomic rewards: from the sale of metal that would otherwise be lost, including various valuable and scarce elements, and from re-cycling processes that reduce energy use in metal production. Substantial savings are also possible in Greenhouse Gas emissions and other environmental benefits.
2.4.1 Value of recovered metals Metal prices directly or indirectly influence the financial rewards of recovery. These are related to the physics of primary and recycled recovery of a metal, to the relative abundance of the various elements in primary minerals, and to the demand for greater sustainabil-ity and other services provided by the met-al. Table 12 shows the economic potential of world (mine) production compared to electri-cal and electronic equipment (EEE) demand, estimating the value of metals going into EEE in billions of dollars. This is a strong incen-tive for setting up profitable recycling sys-
Figure 22:
Conventional phosphorus flow
through chemical and iron & steel
industries and possible new flow
(grey arrows) when P-recovery technology from
steelmaking slag comes on stream.
Arrow width corresponds to quantity of flow (Yoshida et al.,
2012).
Phosphate RockManganese Ore
ChemicalIndustry
PhosphorusFertilizer
AgriculturalSoil
Iron Ore Coke
Conventional FlowNew Flow
Iron & SteelIndustry
SteelmakingSlag
FumePlant
High Phosphorus Iron Ore
Slag Recycling
New Iron Source
Reduction of Emission
New Phosphorus and Manganese Source
Reduction of Use of Ferro-Manganese
Reduction of Environmental Burden During Mining

79
Metal Recycling – Opportunities, Limits, Infrastructure
tems with a sufficient economy of scale and based on BAT. However, these metals often are intimately linked, calling for technological ingenuity to separate them and produce pure metal and compounds. The key to recycling is thus to do this in an appropriate metallurgi-cal infrastructure that is protected by suitable long-term vision and policy.
The (precious) metal content of various de-vices can do much to boost the economic re-cycling of WEEE products. For instance, the metal value of used rechargeable batteries is
significant, driven mainly by Co and Ni, which in 2010 had average prices of $45 and $21 per kg, respectively (Metal Bulletin, 2010). The Ni contained in one tonne of NiMH bat-teries has a value of about $6,000. Even more value can be extracted from recycled batter-ies, if their materials are recovered as com-pounds instead of breaking them down to an elemental state. However, this obviously re-quires a market for these compounds to flow back into the products, implying that these could have a high market value and thus ren-dering the recycling economic.
Table 12:
World mine production,
electrical and electronic
equipment (EEE) demand
and application relative to mine
production for several critical
elements. Values exceeding 100 % are due to recycling. Metal
prices from Metal Bulletin, Mine
production from USGS (Ru from
Johnson-Matthey, 2011), (see some
recent metal prices Sept/Oct
2011 a reflecting the large possible
changes).
a Metal prices from Metal Bulletin 7/9/2011 pp. 35 – 41 ($/kg): Ag 972; Au 58,546; Pd 24,981; Pt 59,253; Re 4,800; Ru 5,626; Rh 60,282; Cu 9 (down lately to 7); Sn 24; Sb 15; Co 35; Bi 29; Se 136; In 785 (oth-ers not in table Ga 850; Ge 1,650; Ni 22; Pb 2.5; Te 380; Zn 2.2; W 470)
Important EEE metals
World mine production
EEE demand
EEE demand/ mine production
Metal price
Value of EEE use
t/a t/a $/kg billion $
Silver Ag 22,200 7,554 34 % $ 649 $ 4.90
Gold Au 2,500 327 13 % $ 39.443 $ 12.90
Palladium Pd 229 44 19 % $ 16.948 $ 0.74
Platinum Pt 188 7 4 % $ 51.811 $ 0.37
Ruthenium Ru 29 21 72 % $ 5.069 $ 0.11
Copper Cu 16,200,00 7,174,000 44 % $ 8 $ 54.08
Tin Sn 261,000 129,708 50 % $ 20 $ 2.65
Antimony Sb 135,000 67,500 50 % $ 9 $ 0.61
Cobalt Co 88,000 16,470 19 % $ 45 $ 0.75
Bismuth Bi 7,600 1,216 16 % $ 20 $ 0.02
Selenium Se 2,260 185 8 % $ 82 $ 0.02
Indium In 574 717 125 % $ 566 $ 0.41
Total $ 77.56
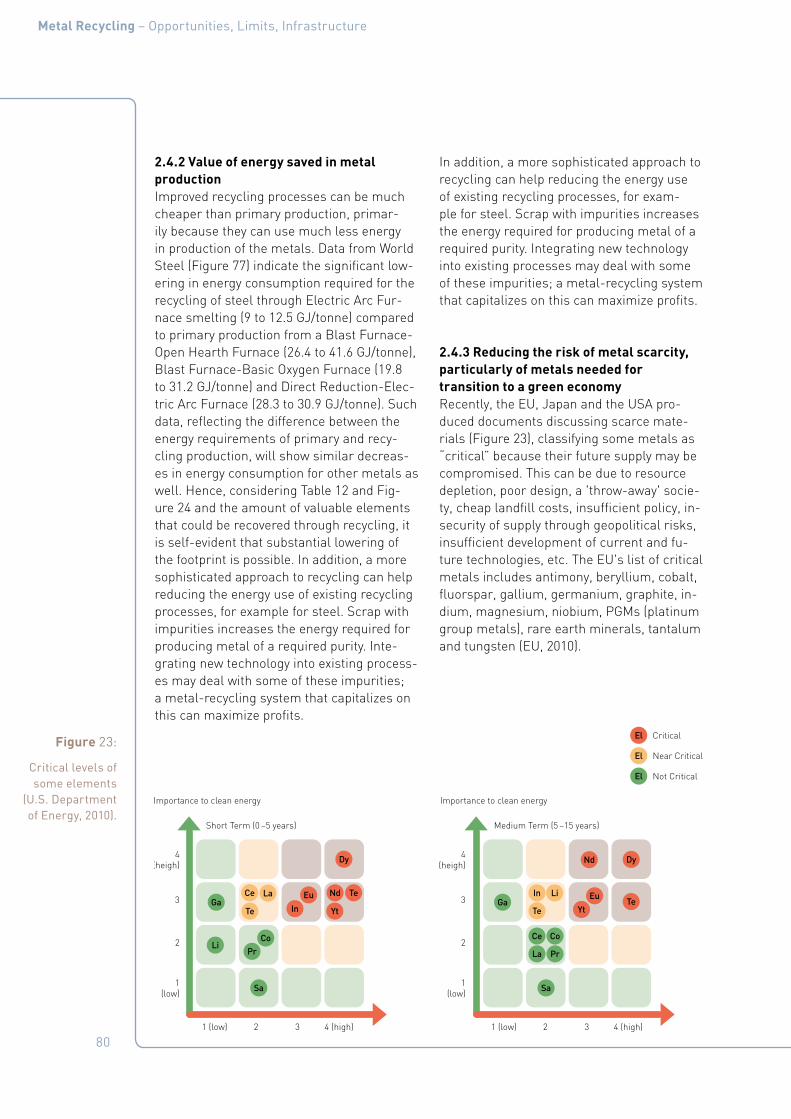
80
Metal Recycling – Opportunities, Limits, Infrastructure
2.4.2 Value of energy saved in metal productionImproved recycling processes can be much cheaper than primary production, primar-ily because they can use much less energy in production of the metals. Data from World Steel (Figure 77) indicate the significant low-ering in energy consumption required for the recycling of steel through Electric Arc Fur-nace smelting (9 to 12.5 GJ/tonne) compared to primary production from a Blast Furnace-Open Hearth Furnace (26.4 to 41.6 GJ/tonne), Blast Furnace-Basic Oxygen Furnace (19.8 to 31.2 GJ/tonne) and Direct Reduction-Elec-tric Arc Furnace (28.3 to 30.9 GJ/tonne). Such data, reflecting the difference between the energy requirements of primary and recy-cling production, will show similar decreas-es in energy consumption for other metals as well. Hence, considering Table 12 and Fig-ure 24 and the amount of valuable elements that could be recovered through recycling, it is self-evident that substantial lowering of the footprint is possible. In addition, a more sophisticated approach to recycling can help reducing the energy use of existing recycling processes, for example for steel. Scrap with impurities increases the energy required for producing metal of a required purity. Inte-grating new technology into existing process-es may deal with some of these impurities; a metal-recycling system that capitalizes on this can maximize profits.
In addition, a more sophisticated approach to recycling can help reducing the energy use of existing recycling processes, for exam-ple for steel. Scrap with impurities increases the energy required for producing metal of a required purity. Integrating new technology into existing processes may deal with some of these impurities; a metal-recycling system that capitalizes on this can maximize profits.
2.4.3 Reducing the risk of metal scarcity, particularly of metals needed for transition to a green economyRecently, the EU, Japan and the USA pro-duced documents discussing scarce mate-rials (Figure 23), classifying some metals as “critical” because their future supply may be compromised. This can be due to resource depletion, poor design, a 'throw-away' socie-ty, cheap landfill costs, insufficient policy, in-security of supply through geopolitical risks, insufficient development of current and fu-ture technologies, etc. The EU's list of critical metals includes antimony, beryllium, cobalt, fluorspar, gallium, germanium, graphite, in-dium, magnesium, niobium, PGMs (platinum group metals), rare earth minerals, tantalum and tungsten (EU, 2010).
Figure 23:
Critical levels of some elements
(U.S. Department of Energy, 2010).
4(heigh)
3
Importance to clean energy
Supply risk
Importance to clean energy
Supply risk
2
1(low)
4(heigh)
3
2
1(low)
1 (low) 2 3 4 (high) 1 (low) 2 3 4 (high)
Dy
El
Dy
Nd TeTe
Nd
Yt
Eu Eu
YtIn
Ce
Ce
PrPrCo Co
Li
Li
Ga Ga
Sa Sa
La
La
TeTe
In
Medium Term (5 –15 years)Short Term (0 –5 years)
Critical
El Near Critical
El Not Critical
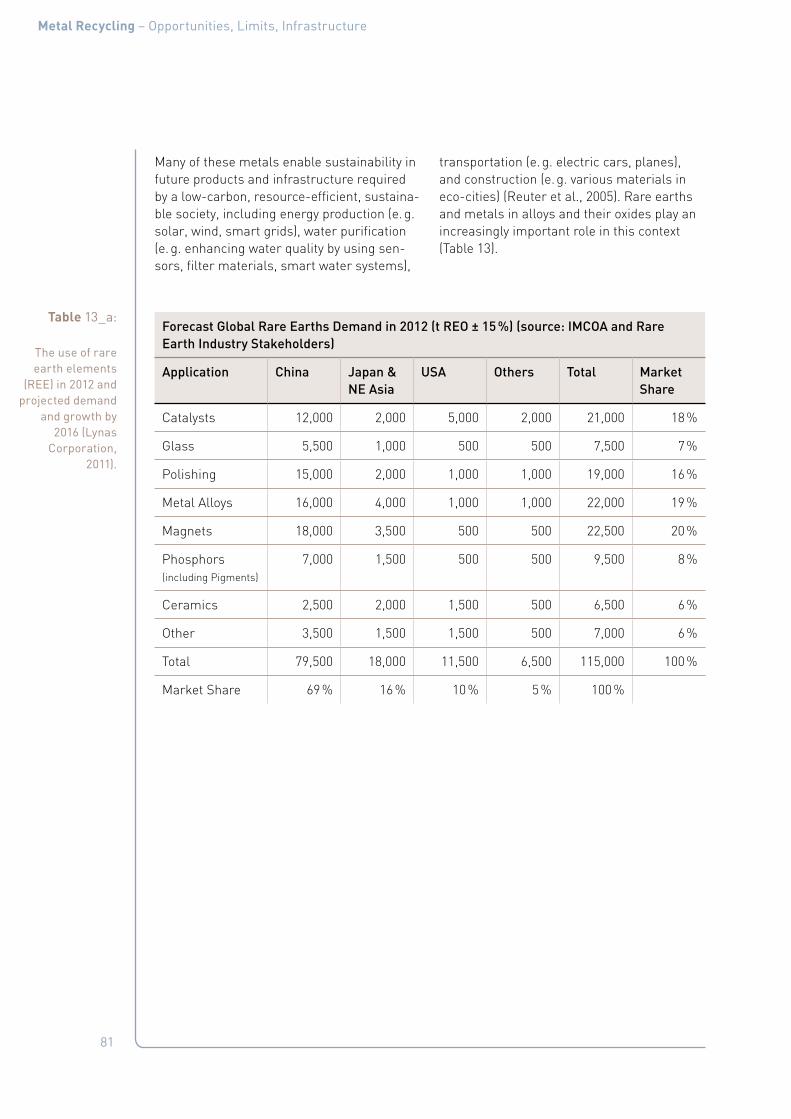
81
Metal Recycling – Opportunities, Limits, Infrastructure
Many of these metals enable sustainability in future products and infrastructure required by a low-carbon, resource-efficient, sustaina-ble society, including energy production (e. g. solar, wind, smart grids), water purification (e. g. enhancing water quality by using sen-sors, filter materials, smart water systems),
transportation (e. g. electric cars, planes), and construction (e. g. various materials in eco-cities) (Reuter et al., 2005). Rare earths and metals in alloys and their oxides play an increasingly important role in this context (Table 13).
Table 13_a:
The use of rare earth elements
(REE) in 2012 and projected demand
and growth by 2016 (Lynas
Corporation, 2011).
Forecast Global Rare Earths Demand in 2012 (t REO ± 15 %) (source: IMCOA and Rare Earth Industry Stakeholders)
Application China Japan & NE Asia
USA Others Total Market Share
Catalysts 12,000 2,000 5,000 2,000 21,000 18 %
Glass 5,500 1,000 500 500 7,500 7 %
Polishing 15,000 2,000 1,000 1,000 19,000 16 %
Metal Alloys 16,000 4,000 1,000 1,000 22,000 19 %
Magnets 18,000 3,500 500 500 22,500 20 %
Phosphors
(including Pigments)
7,000 1,500 500 500 9,500 8 %
Ceramics 2,500 2,000 1,500 500 6,500 6 %
Other 3,500 1,500 1,500 500 7,000 6 %
Total 79,500 18,000 11,500 6,500 115,000 100 %
Market Share 69 % 16 % 10 % 5 % 100 %
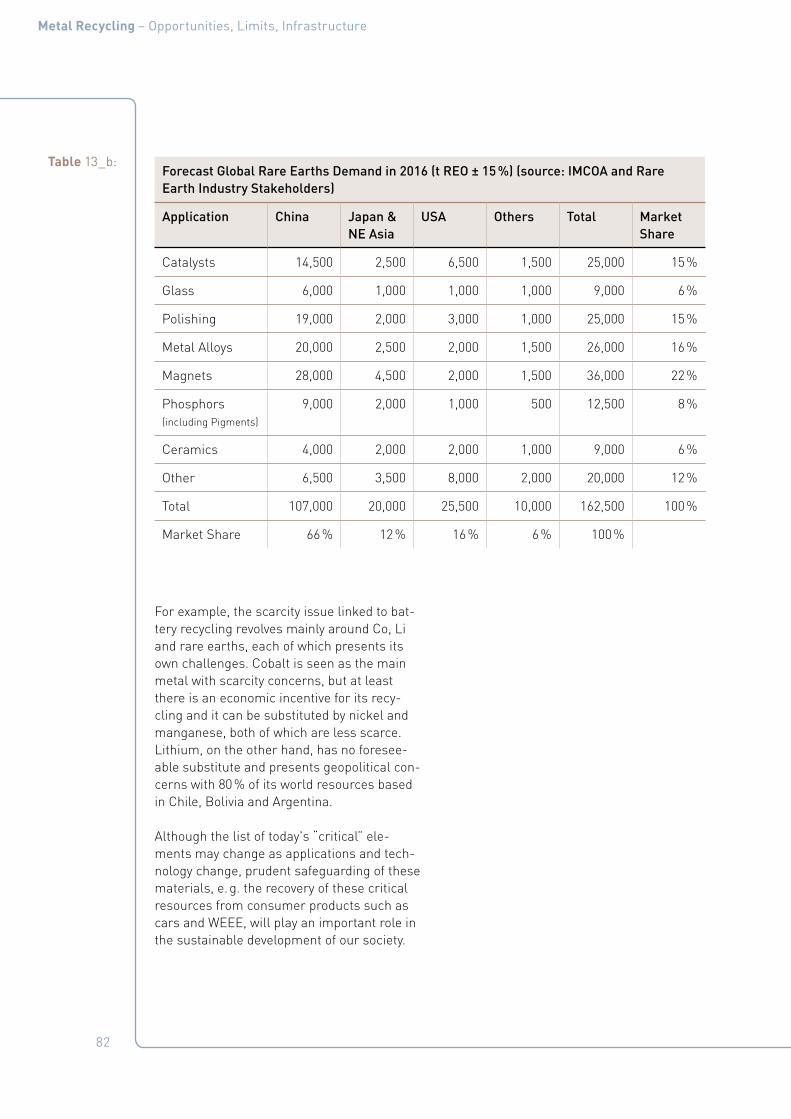
82
Metal Recycling – Opportunities, Limits, Infrastructure
For example, the scarcity issue linked to bat-tery recycling revolves mainly around Co, Li and rare earths, each of which presents its own challenges. Cobalt is seen as the main metal with scarcity concerns, but at least there is an economic incentive for its recy-cling and it can be substituted by nickel and manganese, both of which are less scarce. Lithium, on the other hand, has no foresee-able substitute and presents geopolitical con-cerns with 80 % of its world resources based in Chile, Bolivia and Argentina.
Although the list of today's “critical” ele-ments may change as applications and tech-nology change, prudent safeguarding of these materials, e. g. the recovery of these critical resources from consumer products such as cars and WEEE, will play an important role in the sustainable development of our society.
Table 13_b:Forecast Global Rare Earths Demand in 2016 (t REO ± 15 %) (source: IMCOA and Rare Earth Industry Stakeholders)
Application China Japan & NE Asia
USA Others Total Market Share
Catalysts 14,500 2,500 6,500 1,500 25,000 15 %
Glass 6,000 1,000 1,000 1,000 9,000 6 %
Polishing 19,000 2,000 3,000 1,000 25,000 15 %
Metal Alloys 20,000 2,500 2,000 1,500 26,000 16 %
Magnets 28,000 4,500 2,000 1,500 36,000 22 %
Phosphors
(including Pigments)
9,000 2,000 1,000 500 12,500 8 %
Ceramics 4,000 2,000 2,000 1,000 9,000 6 %
Other 6,500 3,500 8,000 2,000 20,000 12 %
Total 107,000 20,000 25,500 10,000 162,500 100 %
Market Share 66 % 12 % 16 % 6 % 100 %
83
Metal Recycling – Opportunities, Limits, Infrastructure
2.4.4 Job creationThe complexity of EoL scrap and materials makes dismantling and hand-sorting impor-tant activities within the materials-flow chain. If well controlled with suitable health and safety guarantees, this has a large potential for job creation. A recent report concluded: "Recycling creates more jobs at higher in-come levels than landfilling or incinerating waste. The overall employment related to the recycling of materials in European countries has increased steadily from 422 per million inhabitants in 2000 to 611 in 2007. This repre-sents an increase of 45 % between 2000 and 2007, corresponding to an annual increase of 7 %" (http://www.eea.europa.eu/publications/earnings-jobs-and-innovation-the).
2.5 The contribution to sustainable development
2.5.1 Reduction of greenhouse-gas emissionsThe production of metals from primary ores is energy intensive and a significant source of greenhouse-gas emissions. When recycling metals, energy use is minimized as scrap metals usually require less energy to convert back into high-grade materials, than pro-cesses of mining and refining. Hence carbon emissions from recycling are substantially in-ferior to those from mining, which are like-ly to increase due to the rising use of lower-grade ores. The decrease of such emissions largely depends on the thermodynamic sta-bility of the primary minerals and on the way they are distributed in the ores, as well as on the suitability of input from recycling sources.
Recycling of purer metals often “simply” con-sists of remelting, generating a small frac-tion of the emissions shown in Figure 24. To remelt pure copper using methane gas and air creates ca. 0.1 t of CO2 per tonne of Cu, compared to around 3 t of CO2 per tonne of Cu from ore. Recycling of platinum group metals and many of the scarce/critical/valu-able metals found in WEEE can lead to par-ticularly large CO2 savings, because initial CO2 emissions per tonne of these metals can be very high. Figure 24 shows the average CO2 tonnage that results from the prima-ry production of metals (NB: in 2010, global GHG emissions were 33.6 Gt CO2).
Considering the 33.58 Mtpa of CO2 emit-ted during production of the base- and pre-cious metals shown in Figure 24, 0.1 % of the world's CO2 emissions can be attributed to these important metals in WEEE products. It is clear from the above example for pure cop-per that significant emissions savings are possible. However, the more important con-sideration is that these metals are all part of a future sustainability-enabling infrastructure and, through their high-tech use, will indi-rectly help decreasing society’s carbon foot-print.

84
Metal Recycling – Opportunities, Limits, Infrastructure
Figure 24:
Primary carbon footprint
of selected elements in
WEEE goods (EU, 2010)
(Appendix F: "Physics of Extractive
Metallurgy").
0
10
200
10,000
t CO2/t primary metal
Pt
Au
Pd
Co
Ru
Cu
InSn
Ag
Metals used in EEE Primary produc-tion in-tensity t CO2/t metal
Demand for EEE t/a
CO2 emis-sions Mt/a
Au – Gold 16,991 327 5.56
Pt – Platinum 13,954 8 0.11
Ru – Ruthenium 13,954 16 0.22
Pd – Palladium 9,380 30 0.28
Au – Silver 144 4,917 0.71
In – Indium 142 717 0.10
Sn – Tin 16 129,708 2.09
Co – Cobalt 8 16,470 0.13
Cu – Copper 3 7,174,000 24.39
CO2 total [Mt/a] 33.58
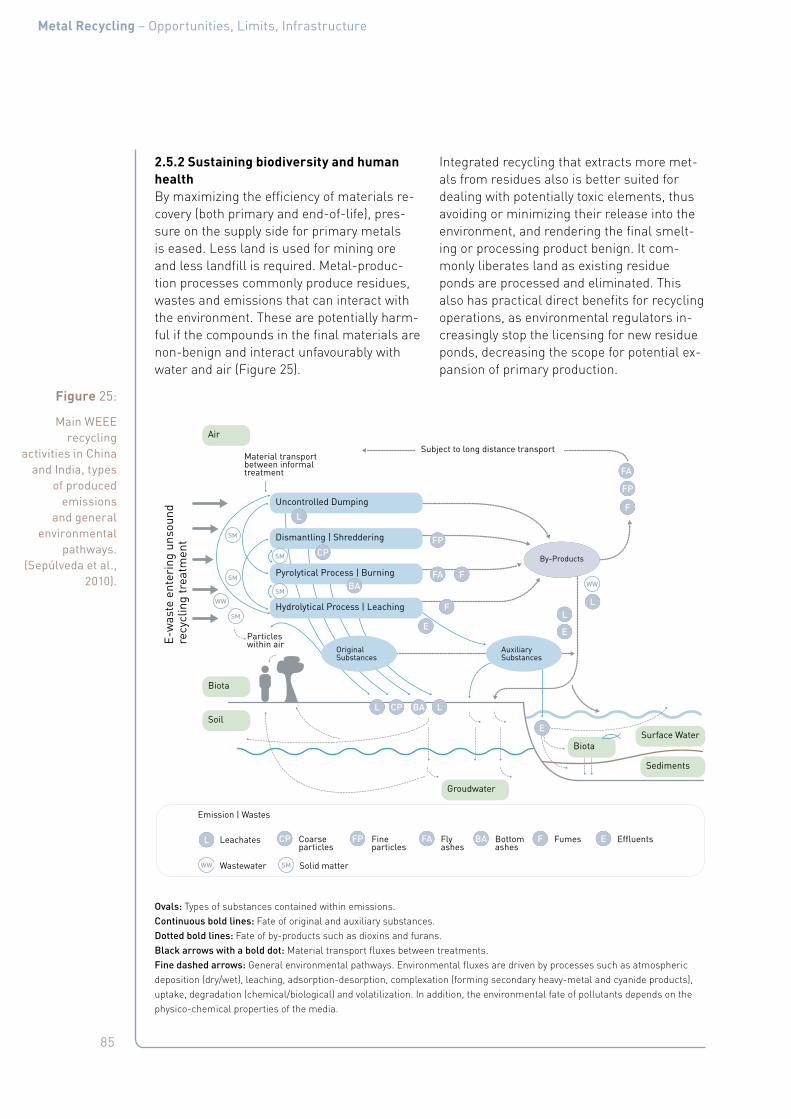
85
Metal Recycling – Opportunities, Limits, Infrastructure
2.5.2 Sustaining biodiversity and human healthBy maximizing the efficiency of materials re-covery (both primary and end-of-life), pres-sure on the supply side for primary metals is eased. Less land is used for mining ore and less landfill is required. Metal-produc-tion processes commonly produce residues, wastes and emissions that can interact with the environment. These are potentially harm-ful if the compounds in the final materials are non-benign and interact unfavourably with water and air (Figure 25).
Integrated recycling that extracts more met-als from residues also is better suited for dealing with potentially toxic elements, thus avoiding or minimizing their release into the environment, and rendering the final smelt-ing or processing product benign. It com-monly liberates land as existing residue ponds are processed and eliminated. This also has practical direct benefits for recycling operations, as environmental regulators in-creasingly stop the licensing for new residue ponds, decreasing the scope for potential ex-pansion of primary production.
Figure 25:
Main WEEE recycling
activities in China and India, types
of produced emissions
and general environmental
pathways. (Sepúlveda et al.,
2010).
L CP FP FA BA F E
FA
FP
F
E
WW SM
L CP BA L
LL
WW
Uncontrolled Dumping
Air
Biota
Biota
Soil
Surface Water
Sediments
Groudwater
Subject to long distance transportMaterial transport between informal treatment
Particles within air
Leachates
Wastewater Solid matter
Coarse particles
Fineparticles
Flyashes
Bottomashes
Fumes Effluents
Emission | Wastes
E-w
aste
ent
erin
g un
soun
d re
cycl
ing
trea
tmen
t Dismantling | Shreddering
Pyrolytical Process | Burning
Hydrolytical Process | Leaching
Auxiliary Substances
OriginalSubstances
By-Products
FA
FP
F
F
L
CP
E
BA
WW
SM
SM
SM
SM
SM
E
Ovals: Types of substances contained within emissions. Continuous bold lines: Fate of original and auxiliary substances. Dotted bold lines: Fate of by-products such as dioxins and furans. Black arrows with a bold dot: Material transport fluxes between treatments. Fine dashed arrows: General environmental pathways. Environmental fluxes are driven by processes such as atmospheric deposition (dry/wet), leaching, adsorption-desorption, complexation (forming secondary heavy-metal and cyanide products), uptake, degradation (chemical/biological) and volatilization. In addition, the environmental fate of pollutants depends on the physico-chemical properties of the media.
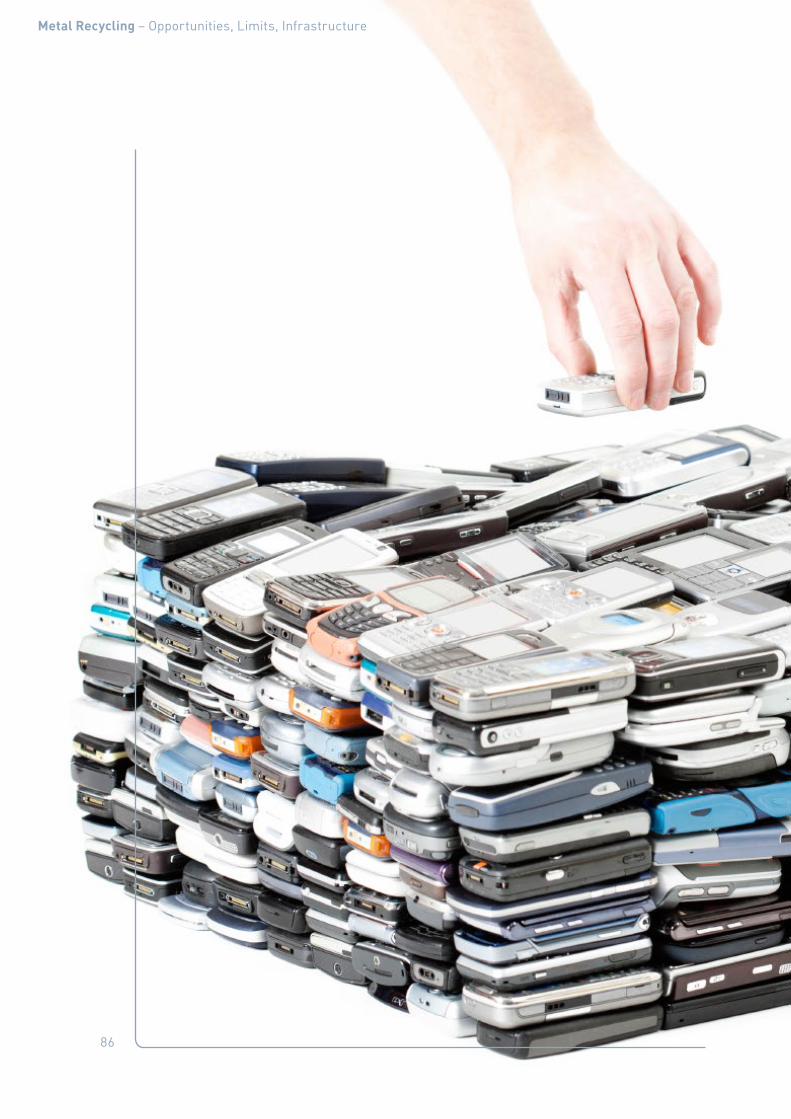
86
Metal Recycling – Opportunities, Limits, Infrastructure

87
Metal Recycling – Opportunities, Limits, Infrastructure
3. Limiting Factors in Recycling
This chapter looks at the factors that cur-rently, and for the near future, constrain our ability to achieve higher recycling rates of metals. At the base are the limitations set by nature, such as physics, chemistry, metal-lurgy and thermodynamics. These dictate the outcome of a given input into a recycling pro-cess, the constraints of nature tying together the use of energy, metal recovery, and qual-ity and quantity of the inevitable losses. The more complex a multi-material recyclate in-put is, the more metal will be lost in the met-allurgical system. Where recycling uses less sophisticated metallurgical technology, mixed waste will be even more of a limitation.
Different processing routes give different outcomes and thus different recycling rates. Pre-processing technology, using main-ly physical separation for preparing suitable fractions for further processing, influences the quality and quantity of the input streams. However, several thermodynamic, technical, economic and environmental issues must be considered as well. A limiting factor at this stage is the relationship between quality and recovery of a given metal or metals. Though their quantity depends upon the policies and actions governing materials collection, the is-sue becomes more complex when discuss-ing the quality of the streams to be pre-pro-cessed. A large variation in stream proper-ties will adversely affect product quality and recovery, thus increasing losses at this stage. The streams may even become economically unviable for processing.
Another major issue at this stage is the way (consumer) goods are produced. Products to be recycled must be separated into suitable streams as soon as possible, but will have optimal ranges depending on stream val-ues and collecting costs, which are affected by policies and collection schemes. Product design with recycling in mind will improve the recyclability of any product (consumer)
goods, especially at the pre-processing stage and also at the final processing stage.
3.1 Limits arising from the collection of recycled material streams
The main collection options for post-consum-er goods are collective municipal or commer-cial collection, individual producer and retail-er collection, and collection by the informal sector (waste pickers). The balance between these routes depends on the policies and economics of the different countries. In addi-tion, other initiatives like charity, small-scale pilot projects, or event-based collection con-tribute to the collection of small, high-value waste of electrical and electronic equipment (WEEE), also called e-waste. The main met-al containing resources for post-consumer waste are cars, electronic appliances, pack-ages and diverse small metal products like toys, bicycles etc.
Chartered recyclers, who can process the various liquids, batteries, tyres and produced metal fractions, as well as the difficult light fractions (rubber, textiles, various plastics), commonly treat end-of-life vehicles (ELV). In Europe, the ELV directive stipulates strict tar-gets for recycling. For electric and electron-ic appliances, the producers are increasingly responsible for recycling; consumers in many countries can return an old appliance to the seller, though detailed schemes vary from country to country. The European Union has also stipulated targets for recycling WEEE.
Collection of packaging is commonly struc-tured like the German 'Duales' system, where the consumers are encouraged to return packaging by recovering a small deposit. These systems are highly efficient for, e. g., aluminium beverage cans. However, pack-ages containing metal foil are not effectively collected but generally end up in Municipal Solid Waste.
The collection of post-consumer waste is very much a logistics challenge. There are typical-ly several stakeholders in the logistics chain

88
Metal Recycling – Opportunities, Limits, Infrastructure
with different aims and motivations, a major actuator often being the minimization of col-lection cost rather than the maximization of material efficiency. An obstacle to recycling consumer products often is neither techni-cal nor economic, but the lack of consumer awareness concerning collection and recy-
cling possibilities. Taking products to collec-tion sites or facilities is felt as an inconven-ience, leading to low collection volumes and mixed waste streams with different composi-tions. This is even seen for ELVs, but more for small electronic appliances, batteries, small toys, packaging, etc.
The technical recycling process obviously cannot exist without returning products for recycling. However, well-organized collection and pre-processing systems often are lack-ing, which makes it impossible to ensure that metals, alloys and other materials do not end up in waste streams where they are lost.
One of the problems with estimating future recycling streams comes from the delay be-tween the sale of products and the time that they become available for recycling at the end of their life. Even where the quantities of metals in the products are known, their avail-ability will be influenced by many factors – as the above example of phone recycling shows.
Box 6: Cell-phone recycling attitudesA survey on consumer-recycling behaviour and attitudes in 2007 found that, although households worldwide own five phones on average, very few of these were recycled. Near-ly half of the consumers were even unaware that a mobile phone can be recycled. Two-thirds said they did not know how to recycle an unwanted device and 71 % were unaware of where to do this. Only 3 % said they had recycled their old phone. The survey was based on interviews with 6,500 people in 13 countries, including Finland, Germany, Italy, Russia, Sweden, the UK, the United Arab Emirates, the USA, Nigeria, India, China, Indonesia and Brazil. Figure 26 shows what people did with their redundant phone according to a 2011 repeat of the study, now including Argentina, Spain and Nigeria, but not Sweden, Brazil, Italy and Russia. Most old phones are kept at home or given to somebody else for further use. Fortunately, the survey in 2007 showed that only 4 % of the old phones ended up in a landfill (Damanhuri, 2012).
According to the 2011 survey, 9 % of respondents claimed to have recycled their last cell phone, a 6 % increase over 2007. The developed market leads in this, although strong growth has been seen in India and China since 2007.
Figure 26:
Study of developing
and developed markets about
what people did with their
previous cell phone
(Damanhuri, 2012).
0 20 40 60 80 100
Other
Recycled
Lost/stolen/broken
Sold/traded for a new phone
Given to friend/family
Kept as spare
Developed
Developing

89
Metal Recycling – Opportunities, Limits, Infrastructure
An additional factor affecting the volume and availability of material for recycling is the leakage of waste into the ‘grey market’ of in-formal, or illegal, low-technology recyclers. This typically leads to losing the small quan-tities of hard-to-extract metals in the prod-ucts.
3.1.1 The case of E-wasteE-waste (of electrical and electronic equip-ment), or WEEE, constitutes about 8 % of mu-nicipal waste and is considered to be one of the fastest growing waste streams worldwide (Widmer et al., 2005). As shown in Figure 27, especially China and India, but also some Af-rican states, are important destinations for e-waste flows. These mostly derive from the US, which has not ratified the Basel Conven-tion, and to a lesser degree from the Europe-an Union (EU).
WEEE represents the fastest-growing waste stream in the EU, generating about 8.7 mil-lion tonnes in 2005. By 2020, this amount is estimated to reach 12.3 million tonnes, cor-
responding to an annual growth of about 2.6 % (European Commission, 2008; Hester and Harrison, 2008). The e-waste stream also contains substantial amounts of metals, such as rare earths, lithium (batteries), ruthenium, antimony and even tin. Most of the production of, for example, indium is used in electronic appliances.
In many cases, sometimes despite legisla-tion, small WEEE articles are not collected separately for recycling, but disposed of with mixed Municipal Solid Waste (MSW). For ex-ample, data on collection rates for WEEE in Europe for 2005 (United Nations Universi-ty, 2007) mention figures of 20 % for electri-cal and electronic tools to 60 % for monitor-ing and control instruments. Chancerel and Rotter (2009a&b) showed cell-phone collec-tion rates of 18 % in Germany and of 12 % in the United States. For larger WEEE items, the rates are higher: PC collection rates, for in-stance, are 76 % in Germany and 54 % in the United States.
Figure 27:
Asian e-waste traffic – who gets the waste? (Baker
et al., 2005).

90
Metal Recycling – Opportunities, Limits, Infrastructure
3.1.1.1 E-Waste policy in the European UnionEU directives 2002/96/EC and 2012/19/EU de-fine their objectives as: "The purpose of this Directive is, as a first priority, the prevention of waste electrical and electronic equipment (WEEE), and in addition, the reuse, recycling and other forms of recovery of such wastes so as to reduce the disposal of waste. It also seeks to improve the environmental perfor-mance of all operators involved in the life cy-cle of electrical and electronic equipment, e. g. producers, distributors and consumers and in particular those operators directly in-volved in the treatment of waste electrical and electronic equipment".
The directive also stipulates "target values for different classes of electronic appliances, and requires that producers are responsible of re-cycling their products and that producers de-sign their products for better recyclability …"
The target values are given as percentages of the total mass of appliances produced, but as most of the appliance weight does not consist of critical “high-tech” or valuable metals, but in lower value plastics and steel, the direc-tive does not encourage a better recycling of these materials. However, collecting many types of appliances together can fulfil the tar-gets. Such combined collection minimizes collection cost, but often reduces the con-centration of the valuable constituents below economically feasible limits.
Although the amount of separately collected WEEE is estimated to be much higher, only one-third of WEEE generated in the EU is of-ficially reported as being treated in line with the WEEE Directive. Part of the collected, but unreported, two-thirds is suspected of being treated in the EU without appropriate envi-ronmental care, or shipped illegally to treat-ment sites outside the EU that do not meet European environmental and health stand-ards. Various studies have shown that, de-spite a tightening of legislative measures, waste and especially e-waste is still likely to be exported illegally as long as an economic incentive exists (European Commission, 2008;
Skinner et al., 2010). In order to address some of these loopholes, the EU published a revision of its WEEE Directive (2012/19/EU, European Commission, 2012).
3.1.1.2 E-Waste policy in China and IndiaIn order to address – among other issues – the challenge of handling domestically pro-duced and imported e-waste, China intro-duced the ‘Circular Economy Promotion Law of the People’s Republic of China’ that was approved on August 29th, 2008, and came into force on January 1st, 2009 (see Box 7). Arti-cles 38 and 39 address the issue of e-waste directly and mandate that “recovered elec-trical and electronic products that have to be dismantled and recycled shall be sold to qualified dismantling enterprises.” (Minis-try of Commerce of the People’s Republic of China, 2009).
Today, however, only a few recycling facilities exist that are labelled “qualified”. These are often operated by governmental agencies, but have – as in India – significant problems for obtaining enough products to ensure an economically viable operation. Instead, much of the e-waste still flows into informal recy-cling channels, such as second-hand mar-kets and manual-recycling workshops. Waste is considered a valuable resource in China by a large group of low-income earners (mainly past and present migrant workers) and thus much of the e-waste is first re-circulated into the economy and reused, instead of being di-rectly recycled and broken down into compo-nents or raw materials (Veenstra et al., 2010; Chi et al., 2011).
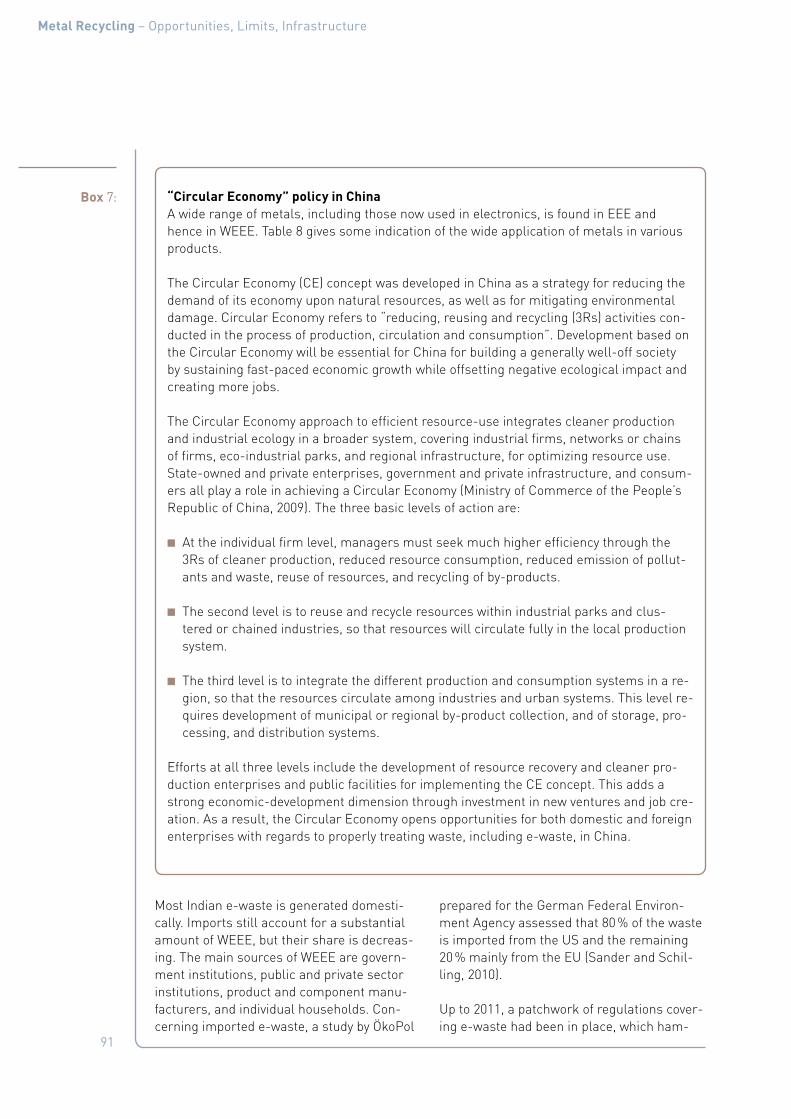
91
Metal Recycling – Opportunities, Limits, Infrastructure
Most Indian e-waste is generated domesti-cally. Imports still account for a substantial amount of WEEE, but their share is decreas-ing. The main sources of WEEE are govern-ment institutions, public and private sector institutions, product and component manu-facturers, and individual households. Con-cerning imported e-waste, a study by ÖkoPol
prepared for the German Federal Environ-ment Agency assessed that 80 % of the waste is imported from the US and the remaining 20 % mainly from the EU (Sander and Schil-ling, 2010).
Up to 2011, a patchwork of regulations cover-ing e-waste had been in place, which ham-
Box 7: “Circular Economy” policy in ChinaA wide range of metals, including those now used in electronics, is found in EEE and hence in WEEE. Table 8 gives some indication of the wide application of metals in various products.
The Circular Economy (CE) concept was developed in China as a strategy for reducing the demand of its economy upon natural resources, as well as for mitigating environmental damage. Circular Economy refers to “reducing, reusing and recycling (3Rs) activities con-ducted in the process of production, circulation and consumption”. Development based on the Circular Economy will be essential for China for building a generally well-off society by sustaining fast-paced economic growth while offsetting negative ecological impact and creating more jobs.
The Circular Economy approach to efficient resource-use integrates cleaner production and industrial ecology in a broader system, covering industrial firms, networks or chains of firms, eco-industrial parks, and regional infrastructure, for optimizing resource use. State-owned and private enterprises, government and private infrastructure, and consum-ers all play a role in achieving a Circular Economy (Ministry of Commerce of the People’s Republic of China, 2009). The three basic levels of action are:
■ At the individual firm level, managers must seek much higher efficiency through the 3Rs of cleaner production, reduced resource consumption, reduced emission of pollut-ants and waste, reuse of resources, and recycling of by-products.
■ The second level is to reuse and recycle resources within industrial parks and clus-tered or chained industries, so that resources will circulate fully in the local production system.
■ The third level is to integrate the different production and consumption systems in a re-gion, so that the resources circulate among industries and urban systems. This level re-quires development of municipal or regional by-product collection, and of storage, pro-cessing, and distribution systems.
Efforts at all three levels include the development of resource recovery and cleaner pro-duction enterprises and public facilities for implementing the CE concept. This adds a strong economic-development dimension through investment in new ventures and job cre-ation. As a result, the Circular Economy opens opportunities for both domestic and foreign enterprises with regards to properly treating waste, including e-waste, in China.

92
Metal Recycling – Opportunities, Limits, Infrastructure
pered effective WEEE regulation and enforce-ment (Sinha-Khetriwa et al., 2006). With the introduction of the new E-Waste (Manage-ment and Handling) Rules 2011 that en-tered into force on May 1st, 2012, India intro-duced comprehensive legislation addressing the issue of e-waste, which resembles the EU WEEE Directive and follows the principle of Extended Producer Responsibility (EPR) (Ministry of Environment and Forests, Gov-ernment of India, 2011). It remains to be seen whether the legislation will be effectively en-forced.
While some formal recycling facilities already exist in India, they have significant problems of receiving enough e-waste for operating at an economically viable level. So far, infor-mal recyclers handle up to 20 times as much e-waste as formal recyclers. The new rules intend to change this ratio in order to de-crease the environmental impact of e-waste recycling, which is significantly larger in the informal sector. In addition to environmental impact, the use of child labour and the expo-sure of workers to far higher toxin levels than in the formal sector, provide a further incen-tive of enforcing the new rules (Skinner et al., 2010).
3.1.2 Policy responses addressing waste flowMetal recycling is a highly complex process, relying on various steps that need to be fol-lowed in order to ensure an environmental-ly sound recycling process. One of the most challenging aspects concerning the recycling of consumer goods, is to ensure that end-of-life products end up in the right facilities. Un-fortunately, several studies have shown that waste is often, and mostly illegally, shipped to locations where this aspect is not ensured (e. g. Sander and Schilling, 2010). For metals, the problem of illegal waste-streams mostly concerns mobile goods, e. g. cars or waste of electrical and electronic equipment (WEEE).
The high value of some scrap also has a strong attraction for thieves, not only affect-ing material flow, but above all criminaliz-ing the image of recycling. The Association
of British Insurers says, for example, that scrap theft costs the UK economy £770 mil-lion per year. There are 1000 thefts per week, the payout is over £1 million per week and, for example, a Henry Moore statue-insurance payout is £3 million, while the scrap value is around £2,000 (Voss, 2012). A possible way of mitigating this problem is to enforce cashless payment for scrap; however, this must be adopted globally to close all leaks.
3.1.3 The Basel Convention: a policy response to uncontrolled and illegal waste flowIn the late 1980s, waste in general (e-waste was not much of an issue at the time) re-ceived much attention on the global political agenda. A tightening of environmental stand-ards and a resulting rise in disposal costs in industrialized countries led the latter to ship their hazardous waste to countries with lower environmental and health standards, where indiscriminate dumping and improper man-agement of hazardous wastes caused air, water, and soil pollution and sickness. When this uncontrolled dumping of waste – par-ticularly in developing countries – was re-vealed, international outrage led to the draft-ing and adoption of the ‘Basel Convention on the Control of Transboundary Movements of Hazardous Wastes and their Disposal’ in 1989 (UNEP, 2007b; Basel Secretariat, 2012). This Convention, which entered into force in 1992, is the United Nation’s primary instrument for dealing with international waste issues. Its key objectives are to diminish the genera-tion of hazardous waste, reduce transbound-ary movements of such waste by disposing of it as close to its source as possible, and en-sure its environmentally sound management (Basel Secretariat, 2012). To reach these ob-jectives, a system was set up of prior written notifications for transboundary movements of hazardous waste, which are only allowed when all participating states agree and are informed beforehand. According to Article 11 of the Convention, transboundary movements of hazardous waste to 'non-party states' are only permissible if bi- or multi-lateral agree-ments exist that are in line with the Basel Convention. The responsibility for comply-

93
Metal Recycling – Opportunities, Limits, Infrastructure
ing with the Convention lies with the export-er and requires the take-back of waste, for instance in cases of illegal transports (Ba-sel Convention, Article 9). According to List A of Annex VIII (A1180), WEEE is considered hazardous and thus generally covered by the Convention’s jurisdiction. However, the con-vention only addresses transboundary ship-ments between OECD and non-OECD states, and does not regulate waste shipments be-tween non-OECD states for example (Sinha-Khetriwa et al., 2006).
In 1997, the EU decided to implement the Basel Ban – a 1995 amendment to the Ba-sel Convention that has not yet been ratified – through an amendment to its Waste Ship-ment Regulation. Not only does the EU ban the export of hazardous (and e-waste) to non-OECD countries, but it has also introduced the WEEE- and RoHS Directives that, respec-tively, force producers and resellers to imple-ment take-back systems and to phase-out hazardous materials in electrical and elec-tronic equipment (EEE) (European Commis-sion, 2008).
The policies concerning e-waste earlier had a strong emphasis on hazardous environ-mental effects. However, as the volume of e-waste increases, the increased and effec-tive recovery of metals in sophisticated plants using BAT technology will have to be stressed as well.
3.2 The physical limits of "closed loop" recycling
Whilst great improvements are possible in the recycling of metals, a fully "closed" re-cycling system cannot exist due to physical laws, regardless of what Cradle-to-Cradle (C2C) claims (McDonough and Braungart, 2002). C2C concepts are useful psychological tools for drawing people's attention to recy-cling, but should not to be used as a basis for policies. There will always be a slight loss of metals due to imperfections in the systems and many other aspects, such as thermody-namics, technology, human error, politics,
theft and economics (Figure 3, Figure 15). A Product-Centric view and good understand-ing of recycling, dealing with the product as a whole rather than as separate contained metals, helps in pushing back the limits of "closing" the loop.
Figure 3 shows the flow of materials, harmo-nizing a primary and recycled metal produc-tion based on metallurgical recovery and re-fining of metals. Recovery is obviously based on physics, but may also reflect the econom-ics of metal recovery from multi-material re-cyclates, residues, sludges, drosses, slags, fumes, flue-dusts, etc. Losses from the sys-tem can be attributed to physical constraints (see below), but also to theft and collec-tion issues as mentioned before. Technically speaking, good recovery requires consider-able (often tacit) knowledge, not only for hand sorting of EoL material, but also for applying sophisticated metallurgical process technol-ogy. An understanding of unaccounted losses due to unregistered flows, take-back sys-tems not collecting all materials, theft, etc., is needed as well, to maximize resource ef-ficiency.
All products, simple to complex, require a minimum of primary metal flowing into the chain to compensate for losses over the whole cycle, and recycling output thus usual-ly needs mixing with primary metals to reach the level of purity required for new uses. Each step in the chain also requires a minimum of energy to complete. The recovery of materi-als and energy in metallurgical operations is largely dictated by the Second Law of Ther-modynamics: energy will be dissipated and so new energy will be needed. Technology can help us in getting as close as possible to the thermodynamic limit.
So even just to keep a constant stock of met-als in society, recycling of metals would re-quire replenishment through resource ex-traction and use of primary metals. Even though recycling can save great amounts of energy (and therefore minimize carbon emis-sions) compared to primary extraction, it will still require new energy input.
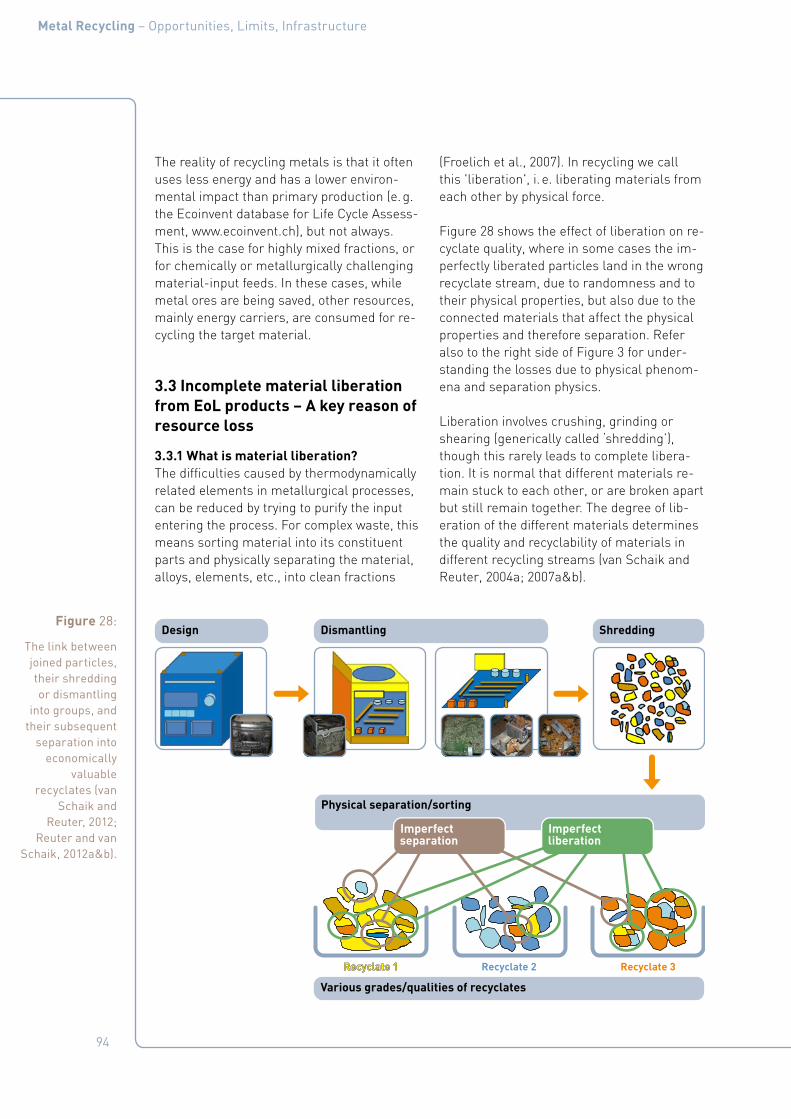
94
Metal Recycling – Opportunities, Limits, Infrastructure
The reality of recycling metals is that it often uses less energy and has a lower environ-mental impact than primary production (e. g. the Ecoinvent database for Life Cycle Assess-ment, www.ecoinvent.ch), but not always. This is the case for highly mixed fractions, or for chemically or metallurgically challenging material-input feeds. In these cases, while metal ores are being saved, other resources, mainly energy carriers, are consumed for re-cycling the target material.
3.3 Incomplete material liberation from EoL products – A key reason of resource loss
3.3.1 What is material liberation?The difficulties caused by thermodynamically related elements in metallurgical processes, can be reduced by trying to purify the input entering the process. For complex waste, this means sorting material into its constituent parts and physically separating the material, alloys, elements, etc., into clean fractions
(Froelich et al., 2007). In recycling we call this 'liberation', i. e. liberating materials from each other by physical force.
Figure 28 shows the effect of liberation on re-cyclate quality, where in some cases the im-perfectly liberated particles land in the wrong recyclate stream, due to randomness and to their physical properties, but also due to the connected materials that affect the physical properties and therefore separation. Refer also to the right side of Figure 3 for under-standing the losses due to physical phenom-ena and separation physics.
Liberation involves crushing, grinding or shearing (generically called ‘shredding’), though this rarely leads to complete libera-tion. It is normal that different materials re-main stuck to each other, or are broken apart but still remain together. The degree of lib-eration of the different materials determines the quality and recyclability of materials in different recycling streams (van Schaik and Reuter, 2004a; 2007a&b).
Figure 28:
The link between joined particles, their shredding or dismantling
into groups, and their subsequent
separation into economically
valuable recyclates (van
Schaik and Reuter, 2012;
Reuter and van Schaik, 2012a&b).
Physical separation/sorting
Design Dismantling
Various grades/qualities of recyclates
Shredding
Imperfectseparation
Imperfectliberation
Recyclate 1 Recyclate 2 Recyclate 3
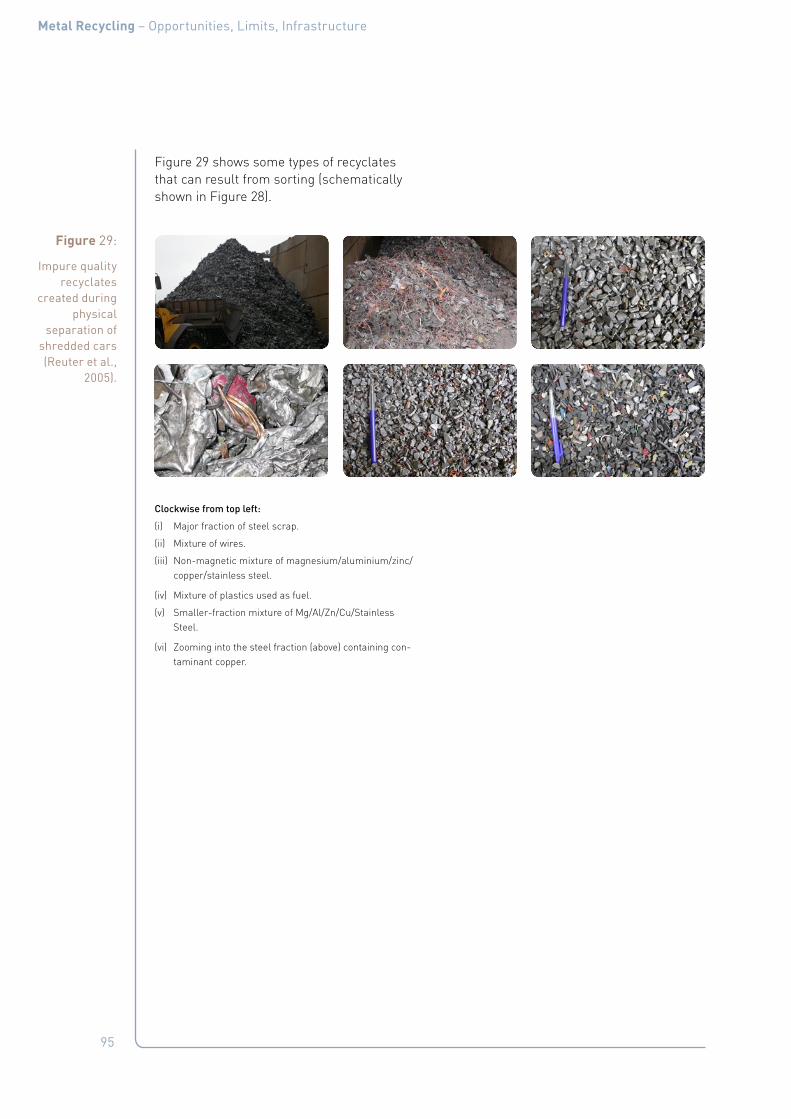
95
Metal Recycling – Opportunities, Limits, Infrastructure
Figure 29 shows some types of recyclates that can result from sorting (schematically shown in Figure 28).
Clockwise from top left:
(i) Major fraction of steel scrap.
(ii) Mixture of wires.
(iii) Non-magnetic mixture of magnesium/aluminium/zinc/copper/stainless steel.
(iv) Mixture of plastics used as fuel.
(v) Smaller-fraction mixture of Mg/Al/Zn/Cu/Stainless Steel.
(vi) Zooming into the steel fraction (above) containing con-taminant copper.
Figure 29:
Impure quality recyclates
created during physical
separation of shredded cars (Reuter et al.,
2005).

96
Metal Recycling – Opportunities, Limits, Infrastructure
Mechanical sorting commonly produces im-perfect recyclates (Figure 28) and society is probably best suited to discern between the vast combinations of materials, to produce the highest grade of recyclates possible. Typi-cal recyclates created through dismantling are shown in Figure 30.
Figure 30:
Groups of components best
sorted by hand for producing
the cleanest recyclates (van
Schaik and Reuter, 2010b).
CoilsCopper, Ceramics, Plastics, PVC, Copper wire
PWBsEpoxy, PMs, Solder, Aluminium, Steel, Stainless Steel, Cables (PVC+copper), Electronic Components
Cu, Fe3O4,
[-C3H6-]n, PbO,
SiO2
Au, Ag, Pb, Pd,
Sn, Ni, Sb, Al,
Fe, Al2O3, Epoxy,
Br etc.
WiresCopper, PVC
GettersGlass, W, Plastics
Cu, [-C2H6Cl-]n W, BaO, CaO,
Al2O3, SrO, PbO,
SiO2
Wood HousingSteel (staples), Plastics
CRTGlass (front and conus), Ceramics, Steel (mask etc.), Fluorescent powders
Fe, [-C3H6-]n PbO, BaO, SrO,
Fe3O4, Fe, Eu,
ZnS, SiO2, Y2O3,
etc.
Plastic HousingPlastics, Steel (bolts etc.)
MetalSteel
[-C3H6-]n,
[-C11H22H2O4-]n,
Cl, Br, Sb2O3
Fe

97
Metal Recycling – Opportunities, Limits, Infrastructure
Box 8: The effect of joints on liberationIn many products, such as cars, different components are joined by welding, bolting, rivet-ing, gluing, inserting contracted bushings, foaming connections, and chemically connect-ed materials/phases in compounds. Moreover, such components often are non-metallic, such as rubber, plastics, glass and ceramics, and the joints have different degrees of dif-ficulty for recycling.
Figure 31 shows a selection of some typical connection types and their liberation behav-iour if they pass through a shredder/cutter. It shows that joints, like many other product parts, generally do not break into pure materials. The figure also mentions ‘randomness of liberation’ that predicts the degree of randomness with which the materials in a joint will break up.
The degree to which the different connected materials are liberated to mono and multi-material particles during shredding and/or dismantling is determined by the following de-sign properties (van Schaik and Reuter, 2010a; van Schaik and Reuter, 2012):
■ The combined material properties (e. g. brittle, ductile) of the connection/product/component.
■ The type of the material joints and connections (e. g. bolted, rivet, shape, glue, surface coating).
■ Characteristics of the connection/joint, e. g. size of the connections in relation to parti-cle size distribution after shredding.
■ Complexity and homogeneity or heterogeneity of the product/component/connection (e. g. spatial distribution of the connections in the product, number of materials con-nected per connection).
■ The thermodynamic compatibility among metals, alloys and metal compounds.
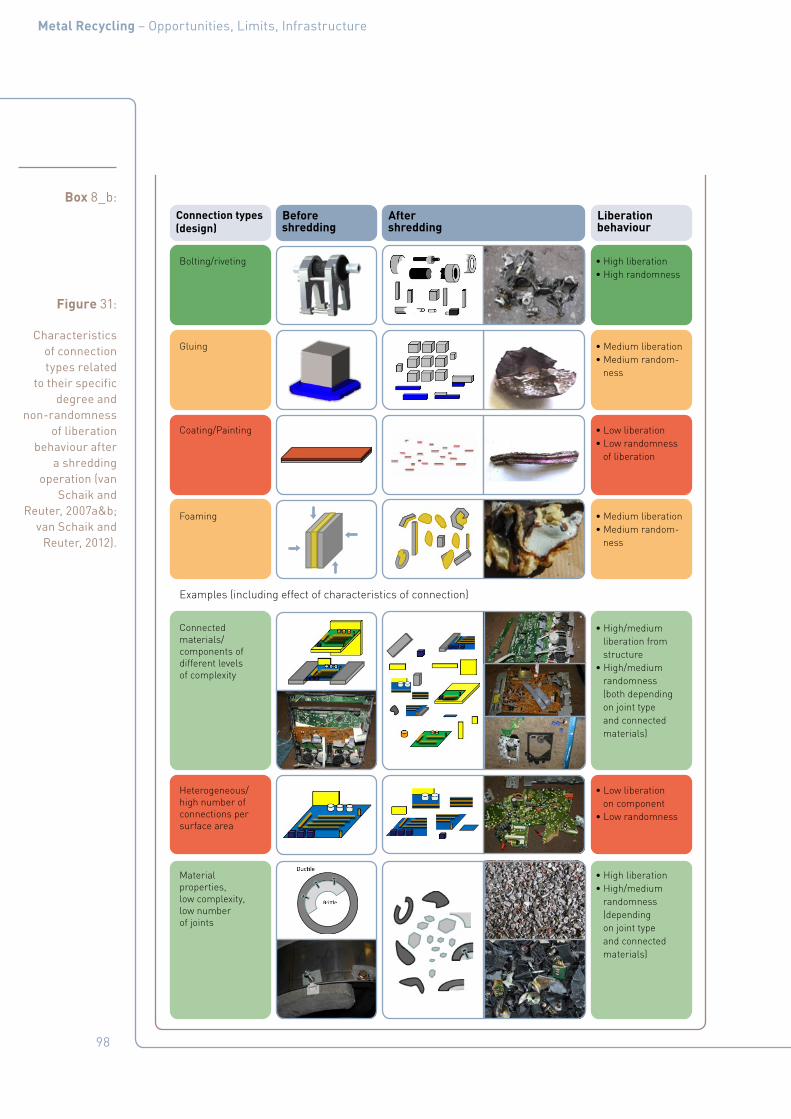
98
Metal Recycling – Opportunities, Limits, Infrastructure
Box 8_b:
Figure 31:
Characteristics of connection types related
to their specific degree and
non-randomness of liberation
behaviour after a shredding
operation (van Schaik and
Reuter, 2007a&b; van Schaik and
Reuter, 2012).
Before shredding
After shredding
Liberation behaviour
Connection types(design)
• High liberation• High randomness
• High/medium liberation from structure• High/medium randomness (both depending on joint type and connected materials)
Examples (including effect of characteristics of connection)
• Medium liberation• Medium random- ness
• Medium liberation• Medium random- ness
• Low liberation• Low randomness of liberation
Bolting/riveting
Connected materials/components of different levels of complexity
• High liberation • High/medium randomness (depending on joint type and connected materials)
• Low liberation on component• Low randomness
Heterogeneous/high number of connections per surface area
Material properties, low complexity, low number of joints
Gluing
Foaming
Coating/Painting

99
Metal Recycling – Opportunities, Limits, Infrastructure
3.3.2 Size reductionIn addition to the aims of liberation, the par-ticle size must suit the chosen processing method. The different material behaviours will dictate the method of size reduction. Metal alloys, for example, must be sheared in order to leave surface coatings almost in-tact. A common method of size reduction is shredding, which is used for end-of-life cars, but most electronic scrap has to be manually broken before shredding.
The resulting output from size reduction is a mix of broken pieces containing different combinations of materials and of different sizes, the latter expressed by a distribution curve.
3.3.3 Understanding the physics of separationThe performance of liberation and separation processes strongly influences the limits of recycling complex, multi-material consumer products, which often uses a network of dif-ferent processes. These liberate and sepa-rate the different interconnected materials into several recyclates (steel, copper, alu-minium, plastic, etc.), before taking them as input to final treatment processes, such as metallurgical processing (Figure 32).
A shredder or any other device for size reduc-tion produces a set of particles with a range of physical and/or chemical properties and a size distribution. The physical properties will dictate the separation methods, and the chemical properties will influence the re-sults of metallurgical processing. All of these properties have a (statistical) distribution. For instance, ordinary carbon steels are (ferro)magnetic, but copper alloys are not, which makes the first susceptible to magnetic sep-aration. A thumb-size electric motor of a car with a magnetic core and a copper coil, if not shredded, will be attracted by a magnetic separator, adding some copper to the mag-netic steel fraction. Such a combination of properties will thus affect the outcome of any separation step before metallurgical process-ing; in addition, particles with the same mag-
netic susceptibility will behave differently in separation depending on their size.
3.3.3.1 Physical sorting processesThe purity of recyclates a created by sorting is limited by the efficiency and thus the physics of the liberation and sorting process. Physical sorting processes can be used for separating materials from waste (e. g. metal cans from mixed waste) before it goes into a shredder, or after it is broken into pieces (so-called ‘post shredding technology’). Such sorting processes make use of the physical proper-ties of the inputs, such as magnetic proper-ties, conductivity and density (Figure 33), and can either be dry or in solution (‘wet’). Note that in wet processes the medium has to be cleaned, creating sludge, but that dry pro-cesses can produce dust –containing both metals and other possible hazardous com-pounds.
Dry separation methods include manual and ballistic sorting, and also: (i) magnetic sepa-ration; (ii) eddy-current separation; (iii) air separation/zigzag wind sifter; (iv) screen-ing; (v) fluidized-bed separation; (vi) sensor based sorting (by image analysis, colour, x-ray, spectroscopy); (vi) wire sorting; and (vii) electrostatic sorting. Wet separation methods include: (i) sink-float; (ii) heavy-medium cy-clones; (iii) jigging; (iv) shaking tables; and (v) flotation (Cui and Forssberg, 2003).
a Recyclates are inputs into recycling processes.

100
Metal Recycling – Opportunities, Limits, Infrastructure
Figure 32:
Example of recycling cars, a
complex network of processes and
interconnected material flows.
Separation processes are of
key importance in producing
suitable recyclates for
processing in a metallurgical
plant (van Schaik and Reuter,
2012, HSC Sim 1974 – 2013).
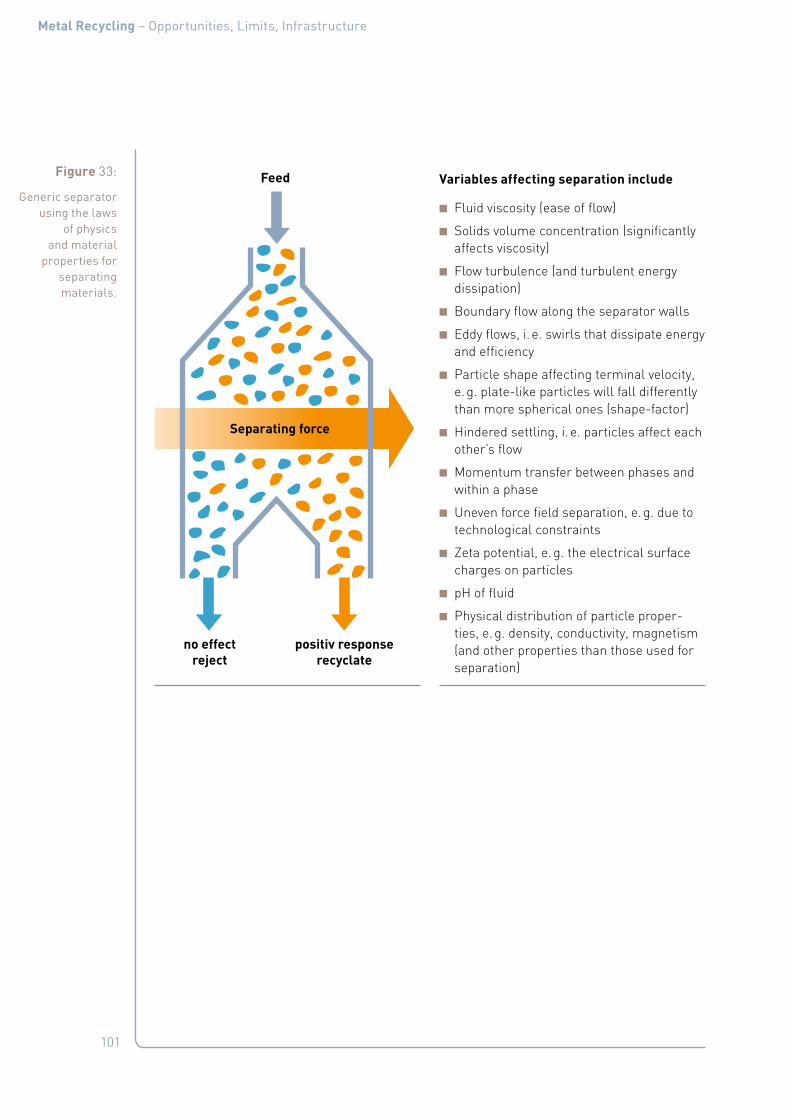
101
Metal Recycling – Opportunities, Limits, Infrastructure
Figure 33:
Generic separator using the laws
of physics and material
properties for separating materials.
Feed
Separating force
positiv responserecyclate
no effectreject
Variables affecting separation include
■ Fluid viscosity (ease of flow)
■ Solids volume concentration (significantly affects viscosity)
■ Flow turbulence (and turbulent energy dissipation)
■ Boundary flow along the separator walls
■ Eddy flows, i. e. swirls that dissipate energy and efficiency
■ Particle shape affecting terminal velocity, e. g. plate-like particles will fall differently than more spherical ones (shape-factor)
■ Hindered settling, i. e. particles affect each other’s flow
■ Momentum transfer between phases and within a phase
■ Uneven force field separation, e. g. due to technological constraints
■ Zeta potential, e. g. the electrical surface charges on particles
■ pH of fluid
■ Physical distribution of particle proper-ties, e. g. density, conductivity, magnetism (and other properties than those used for separation)

102
Metal Recycling – Opportunities, Limits, Infrastructure
3.3.3.2 Combined use of separation methodsNone of these separation methods creates pure streams of material, but only increases purity. Using the example of a density-based separator, Figure 34 illustrates that the fate of a particle in a separator is best predict-ed by a probability distribution. The red line shows what would happen in an ideal sepa-rator – which does not exist – that sends all particles to either a ‘heavy’ or a ‘light’ frac-tion, depending upon their density. The blue line shows the actual cumulative probability that a particle of the density on the x-axis will end up in the heavy fraction. Particles in the shaded areas are misplaced. Similar sepa-ration efficiency curves exist for separations based on any property.
When particles are mixes of material, such as pieces of Printed Wire Board, separation is problematic. The physical property distri-butions used in separation may not be com-patible with the chemical property distribu-tions, which are important for final process-ing. If, for example, density is the separation method, it is evident that particles consisting of three joined materials of different chemi-cal composition will separate on the average density of the three materials, thus creat-ing a recyclate fraction with an unsatisfac-tory composition. Recycling operations usu-ally have to combine separation methods for obtaining the required purity levels. Table 14 shows various combinations used for mixed metallic waste streams (mainly old cars, but also WEEE) by different operators.
Figure 34:
Separation-efficiency curve for an arbitrary
material during physical
separation (Heiskanen, 1993;
King, 2001).
0
50
100
32003000
p
2800
probability to sinks
density [kg/m3]
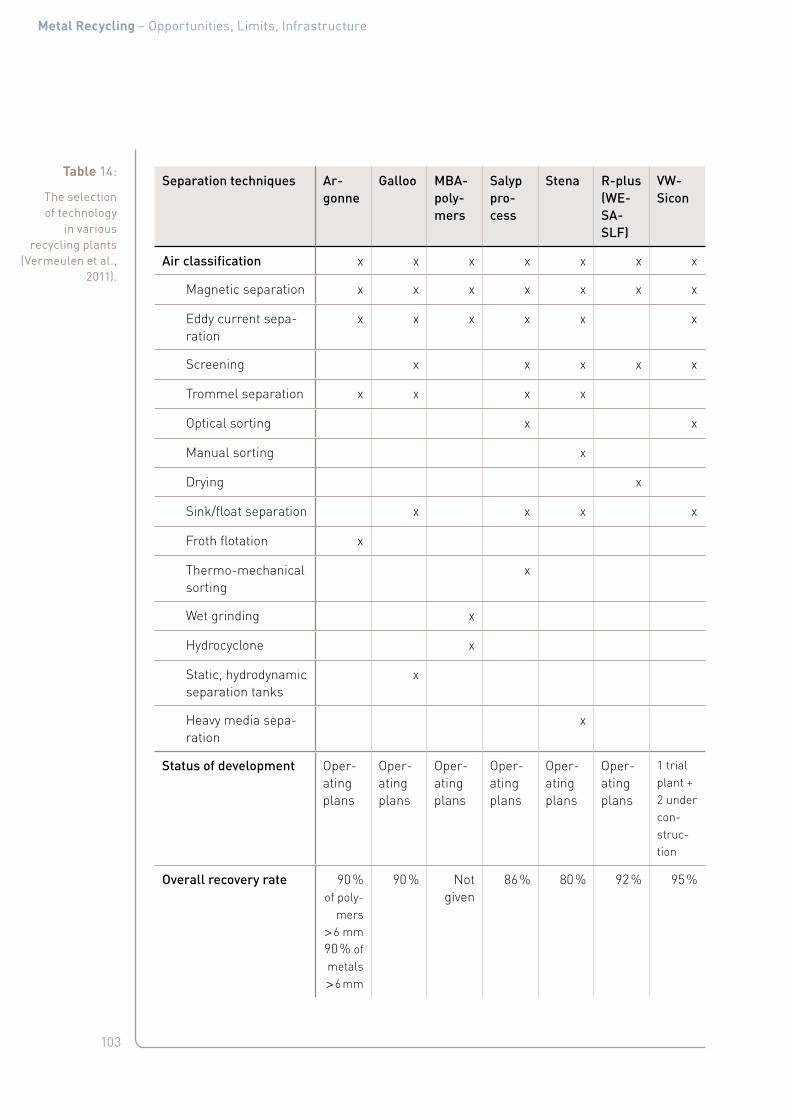
103
Metal Recycling – Opportunities, Limits, Infrastructure
Table 14:
The selection of technology
in various recycling plants
(Vermeulen et al., 2011).
Separation techniques Ar-gonne
Galloo MBA-poly-mers
Salyp pro-cess
Stena R-plus (WE-SA-SLF)
VW-Sicon
Air classification x x x x x x x
Magnetic separation x x x x x x x
Eddy current sepa-ration
x x x x x x
Screening x x x x x
Trommel separation x x x x
Optical sorting x x
Manual sorting x
Drying x
Sink/float separation x x x x
Froth flotation x
Thermo-mechanical sorting
x
Wet grinding x
Hydrocyclone x
Static, hydrodynamic separation tanks
x
Heavy media sepa-ration
x
Status of development Oper-ating plans
Oper-ating plans
Oper-ating plans
Oper-ating plans
Oper-ating plans
Oper-ating plans
1 trial plant + 2 under con-struc-tion
Overall recovery rate 90 % of poly-
mers > 6 mm 90 % of metals > 6 mm
90 % Not given
86 % 80 % 92 % 95 %

104
Metal Recycling – Opportunities, Limits, Infrastructure
Even in combination, liberation and sepa-ration methods do not create pure mate-rial streams. This is illustrated by two stud-ies on the recovery of precious metals from PCs with different pre-processing separation techniques. One study compared a fully man-ual sorting process with a combined disman-tling and shredding process using automat-ic sorting (Meskers et al., 2009). The other study investigated the precious metal flows in a state-of-the-art European facility pro-cessing a mixture of ICT and consumer elec-tronics. Both studies investigated precious metal recoveries from material streams after pre-processing.a Table 15 summarizes the results, showing that high recovery can be achieved, although the cost of manual dis-mantling must also be considered (see Ta-ble 4).
a Both investigations were a snapshot at a certain time for a certain input material and do not allow a direct com-parison and assessment of the used pre-processing technology.
3.3.4 Tradeoffs between recovery grade and recovery rateAs will be clear from the above, commercial recycling systems cannot create completely pure recyclate streams (van Schaik and Reu-ter, 2004a&b) and never achieve 100 % mate-rial recovery, there being a trade-off between these two goals. The recovery vs. grade curve in Figure 35 (left) shows how much recovery can occur, depending on the required grade (purity) of the output. If the grade has to be 100 %, a relatively small amount will be re-covered, as only a fraction of the input feed is pure and totally liberated. For instance, a grade of 50 % can be obtained with a recovery of 94 %, while a grade of 80 % will give a re-covery of only 75 %.
The liberation behaviour of the example is complex. It shows that, though a large per-centage of particles was liberated from the compound, liberation was insufficient for a large fraction of the particles (Figure 35, right). This form of curve is often seen in WEEE systems, where the housing does not contain the values sought after, and other parts of the device contain combinations that are difficult to liberate. If a large percent-age of material has low liberation, only poor grades will be obtained.
Table 15:
Comparison of precious metals
recovery rates from suitable
material streams after pre-
processing.
Reference Process description Silver Gold Palla- dium
Meskers et al. 2009
Manual dismantling (first dismantling) 1.4 tonne PC
49 % 80 % 66 %
Meskers et al. 2009
Manual dismantling (second dismantling) 1.4 tonne PC
92 % 97 % 99 %
Meskers et al. 2009
Manual depollution and smashing and hand picking, hammer mill and automat-ing sorting automatic sorting 1.4 tonne PC
75 % 70 % 41 %
Chancerel et al. 2008
Manual depollution and shredding and au-tomatic sorting 27 tonnes ICT and con-sumer electronics
11 % 26 % 26 %
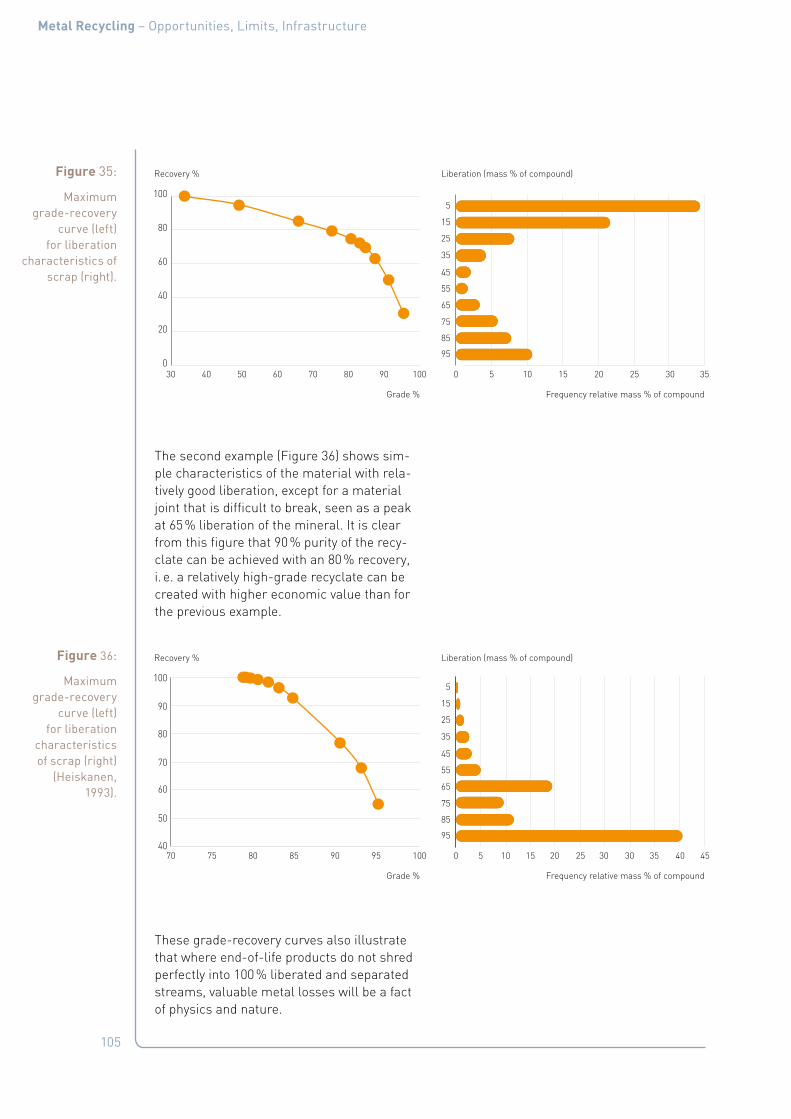
105
Metal Recycling – Opportunities, Limits, Infrastructure
The second example (Figure 36) shows sim-ple characteristics of the material with rela-tively good liberation, except for a material joint that is difficult to break, seen as a peak at 65 % liberation of the mineral. It is clear from this figure that 90 % purity of the recy-clate can be achieved with an 80 % recovery, i. e. a relatively high-grade recyclate can be created with higher economic value than for the previous example.
These grade-recovery curves also illustrate that where end-of-life products do not shred perfectly into 100 % liberated and separated streams, valuable metal losses will be a fact of physics and nature.
Figure 35:
Maximum grade-recovery
curve (left) for liberation
characteristics of scrap (right).
0
20
40
60
80
100
10090807060504030 35302520151050
Recovery %
Grade %
85
95
75
65
55
45
35
25
15
5
Frequency relative mass % of compound
Liberation (mass % of compound)
Figure 36:
Maximum grade-recovery
curve (left) for liberation
characteristics of scrap (right)
(Heiskanen, 1993).
40
50
60
70
90
80
100
100959085807570 353030 452520 40151050
Recovery %
Grade %
85
95
75
65
55
45
35
25
15
5
Frequency relative mass % of compound
Liberation (mass % of compound)
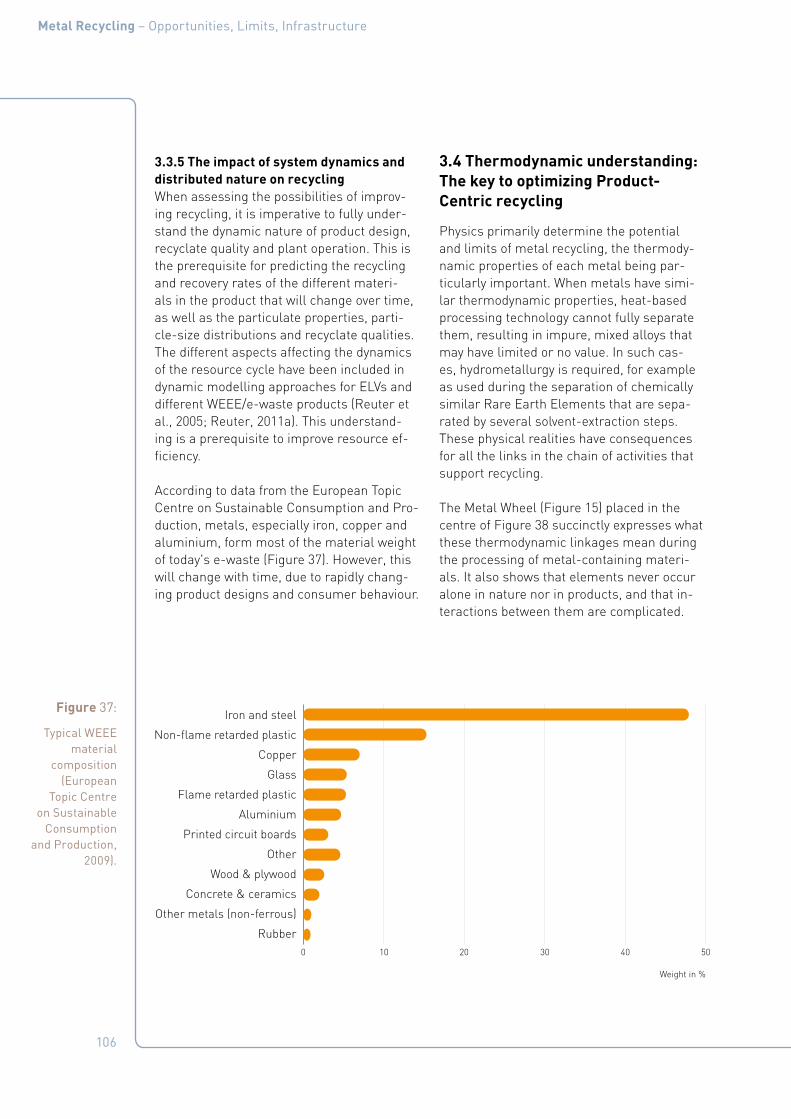
106
Metal Recycling – Opportunities, Limits, Infrastructure
3.3.5 The impact of system dynamics and distributed nature on recyclingWhen assessing the possibilities of improv-ing recycling, it is imperative to fully under-stand the dynamic nature of product design, recyclate quality and plant operation. This is the prerequisite for predicting the recycling and recovery rates of the different materi-als in the product that will change over time, as well as the particulate properties, parti-cle-size distributions and recyclate qualities. The different aspects affecting the dynamics of the resource cycle have been included in dynamic modelling approaches for ELVs and different WEEE/e-waste products (Reuter et al., 2005; Reuter, 2011a). This understand-ing is a prerequisite to improve resource ef-ficiency.
According to data from the European Topic Centre on Sustainable Consumption and Pro-duction, metals, especially iron, copper and aluminium, form most of the material weight of today's e-waste (Figure 37). However, this will change with time, due to rapidly chang-ing product designs and consumer behaviour.
3.4 Thermodynamic understanding: The key to optimizing Product-Centric recycling
Physics primarily determine the potential and limits of metal recycling, the thermody-namic properties of each metal being par-ticularly important. When metals have simi-lar thermodynamic properties, heat-based processing technology cannot fully separate them, resulting in impure, mixed alloys that may have limited or no value. In such cas-es, hydrometallurgy is required, for example as used during the separation of chemically similar Rare Earth Elements that are sepa-rated by several solvent-extraction steps. These physical realities have consequences for all the links in the chain of activities that support recycling.
The Metal Wheel (Figure 15) placed in the centre of Figure 38 succinctly expresses what these thermodynamic linkages mean during the processing of metal-containing materi-als. It also shows that elements never occur alone in nature nor in products, and that in-teractions between them are complicated.
Figure 37:
Typical WEEE material
composition (European
Topic Centre on Sustainable
Consumption and Production,
2009).
Weight in %
Wood & plywood
Concrete & ceramics
Other metals (non-ferrous)
Rubber
Iron and steel
Non-flame retarded plastic
Copper
Glass
Flame retarded plastic
Aluminium
Printed circuit boards
Other
0 10 20 30 40 50

107
Metal Recycling – Opportunities, Limits, Infrastructure
Understanding these physics and the eco-nomics for separating these elements lies at the core of maximizing resource efficiency and therefore of metals and materials recy-cling in general. The dark blue ring near the centre of the Metal Wheel in Figure 15 and Figure 38 shows metals currently used in significant quantities by society. These are so called 'Carrier Metals' because they are the backbone of recycling processes and thus 'carriers' (usually called commodity or base metals in industry jargon). Historically, they were the target of primary production pro-cesses using concentrates derived from ores, such as:
■ Haematite (Fe2O3) as the basis for iron (Fe) and steel.
■ Chalcopyrite (CuFeS2) concentrate as the basis for the primary copper (Cu).
■ Sphalerite (ZnS) as the basis for the zinc (Zn).
■ Galena (PbS) as the basis for lead (Pb).
Current metallurgical technology is gener-ally found in integrated processing plants of these Carrier Metals, whether from natural
ores or recycled raw materials, like residues, and end-of-life products. Each slice of the Metal Wheel shows the metals that can be processed with the technology at the tip of that slice, such as smelting, refining, etc. The light-blue ring shows other Carrier Metals that can be extracted with the same process-ing technology. The white ring shows other valuable metals that may be co-produced as part of the Carrier Metal’s processing infra-structure. The outer green ring shows the metals and other elements that cannot be economically recovered by the same process-ing technology, but can be safely dealt with. The diagram is based on the current best-available technique (BAT) used in extractive metallurgy for producing metals from resi-dues, sludges, slags, speiss, slimes, etc. (Ul-lmann's Encyclopedia, 2005).
Figure 38 also shows Design for Resource Efficiency, illustrating which metals can and cannot be recovered from complex recyclates and metal linkages by the main Carrier Metal processing technology. The metals and com-pounds whose recovery is currently impossi-ble are shown in red on a slice of the Metal-Wheel. This therefore shows where innovative metallurgy must be developed for recovering such elements.
Consult Appendix A: Details on Recovery of Metals from Re-cyclates, Appendix E: Models and Simulation in Recycling and Appendix F: Physics of Extractive Metallurgy for more details.
Box 9: Steel recyclingSteel recycling can cope only to a certain extent with copper, tin and antimony in the in-put streams. These elements, because of their chemical and thermodynamic properties, pose a formidable challenge for their removal during the production of high-quality steel. Commonly, the only way to cope is to dilute them into concentrations that are tolerated by alloy requirements. Sorting helps, but the steel scrap has to be de-tinned and de-galva-nized before being fed into the smelter. Plastics containing antimony flame retardant must also be removed to alleviate this problem. However, complex post-consumer scrap such as WEEE can contain 50+ elements at the same time, many of which cannot be dealt with during steel making and thus cannot be recycled. However, non-ferrous metallurgy can cope with these elements, but, as the name non-ferrous metallurgy suggests, the iron will then be lost as FeO in the slag.

108
Metal Recycling – Opportunities, Limits, Infrastructure
3.4.1 Process metallurgy: smelting (pyro-metallurgy), leaching (hydrometallurgy) and refining (hydro- and electrometallurgy)After separation, recycling inputs go to met-al-production processes. Pure scrap metal can be simply remelted – if in metal and alloy form, and not contaminated by other materi-als – for returning it to the cycle. Less pure waste streams (and metal ores) are pro-cessed either by pyrometallurgy (smelting), or by hydro- and electrometallurgy (Appen-dix F: Physics of Extractive Metallurgy).
■ Pyrometallurgy, also known as smelting, uses high temperatures (sometimes above 2000 °C) to drive chemical reactions as well as melting (just remelting metals) or smelting (chemical conversion from com-pound to metal) processes. The processes vary depending on the metal and materials being smelted. The advantage of smelting
is that it concentrates metals into met-al alloys or similar, therefore decreasing their entropy.
■ Hydrometallurgy, or leaching, puts met-als into a low-temperature aqueous solu-tion, reaching +90 °C under atmospheric conditions, and +200 °C when under pres-sure for separating different elements and compounds. Again, various processes ex-ist, based on either acid (low pH) or basic (high pH) aqueous solutions. Hydrometal-lurgy generally first increases the entro-py of metals, before recovering the ions in solution with a significant input of energy for lowering the entropy again (Tuncuk et al., 2012).
Pyro- and hydro-metallurgy are commonly used in tandem for obtaining valuable met-als, particularly non-Carrier Metals. Optimiz-
Figure 38:
Design for resource
efficiency showing the
destination of elements from an end-of-life material. If a
WEEE product falls in the copper and Zn/Pb slices, many metals can
be recovered, but if it falls in
the incorrect slice, e. g. the
steel cycle, the metals may be
lost, diminishing the resource
efficiency. Policy should thus
pay particular attention to
the complete infrastructure and systems.
Losses
Stocks
Losses & Stocks
Losses
Losses
Losses
Losses
Production
Infrastructure
Sampling, Data Integrety,Resolution, Detail, Statistics
Physics, Complex Linkages,Economics
TheftAirfillLandfill
Consumer, Collection
Thermodynamics, Technologies, Economics,Metal Price, Feed Morphology | Complexity
Linkages, Economics
Mainly Element Lost, not always compatible with Carrier Metal or Product Detrimental to properties and cannot be economically recovered from e.g. slag unless e.g. iron is a collector and goes to further processing.
Dissolves mainly in Carrier Metal if Metallic (Mainly to Pyrometallurgy) Valuable elements recovered from these or lost (metallic, speiss, compounds or alloy in EoL also determines destination as also the metallurgical conditions in reactor).
Compounds Mainly to Dust, Slime, Speiss, Slag (Mainly to Hydrometallurgy) Collector of valuable minor elements as oxides/sulphates etc. and mainly recovered in appropriate metallurgical infrastructure if economic (EoL material and reactor conditions also affect this).
Mainly to Benign Low Value Products Low value but inevitable part of society and materials processing. A sink for metals and loss from system as oxides and other compounds. Comply with strict environmental legislation.
Mainly Recovered Element Compatible with Carrier Metal as alloying Element or that can be recovered in subsequent Processing.
Mainly Element in Alloy or Compound in Oxidic Product, probably Lost With possible functionality, not detrimental to Carrier Metal or product (if refractory metals as oxidic in EoL product then to slag / slag also intermediate product for cement etc.).
Mainly Element Lost, not always compatible with Carrier Metal or Product Detrimental to properties and cannot be economically recovered from e.g. slag unless e.g. iron is a collector and goes to further processing.
RE
ThO2
Li2O
FeOx
FeOx
TiO2
TiO2
SiO2
SiO2
SiO2
SiO2
SiO2
SiO2
SiO2
AIXy
CaXy
SiXy
MgO MgO
MgO
MgO
MgO
MnO
MnO
MnO
CaO
CaO
CaO
CaO
CaO
CaO
CaO
SrO
SrO
MgO
TiO2
ThO2
ZrO2
ZrO2
ZrO2
FeOx
FeOx
V2O5
V2O5
V2O5
Al2O3
Nb2O5
Sb2O3
Ga2O3
Ta2O5Al2O3
Al2O3
Al2O3
Al2O3Al2O3
Al2O3
Ga/As
F/ClBr
InIn2O3
Ta2O5
Nb2O3
In2O3Ga2O3
Cu2ONiO
NiCo
TaNb V
WTiCr
Ta2O5
Nb2O3
InIn2O3
K/Na
Al2O3
FeOxCaF2
FeOx
FeOx
P2O5
WO3
WO3
BaO
RE(O)s
TiO2 ZrO2
CaF2
WO3
REOs
REs
REOs
REOs
REOs
CaO REOs BaOMgO
BaO
REs
REs
Hg
HgCl
Cl
El
Cl
Na
Na
K F
B
F
F
P
P
P
BiAg
Ag
Au
Au
Pt
Pt
Rh
MoCo
Co
Cd
Cd
Zn
Cu In
Sb
Fe
Ni
Cr
Te
PdAg
Al
AlZr
Th
As
AsAs
Cd
Cd
Pb
Mo Si
Pb
Pb
Pb
Pb
ZnFe
Ti
Mn Si MgNiSn Cu
AgAu
Sb
Tr
Cr
SnMo
Si
ZrNbV
Cr
Al
PtPd
In
Zn
ZnCl
Ge
GaGe
Se
Sn
Sn
Bi
Bi
Fe
BrHg
Zn
Zn
Sb
Sb
Si
Sb
Au Sn
Th
Br
PtRh
Pd
P K
K
P
K
Na
Cu
Cu
Cu
Ni
Co
Bi
SrOKCl
SrO
AlTi
Li
Zn
REPb
Sn
Fe
Cu/Ni
MgMn
Ni/Cr
El
El
RemeltRefine
Smelt/RefineSmelt/Refine
Stainless Steel
TRIP SteelAustenitic
RLE/Fume
SmeltRefine
PyroMetallurgyRemelt
Hydro MetallurgyRemelt
Hydro-Metallurgy
Special BatteryRecycling
Hydro&Pyrometallurgy
Steel (BOF&EAF)
ProductEoLAn
Market & StocksFunctional Element Combinations Collection &
Dismanteling
Metals back to consumer Production
Product Design
Multi-materialRecyclate Grades
Metal & EnergyRecovery
Physical Separation
UnaccountedLosses
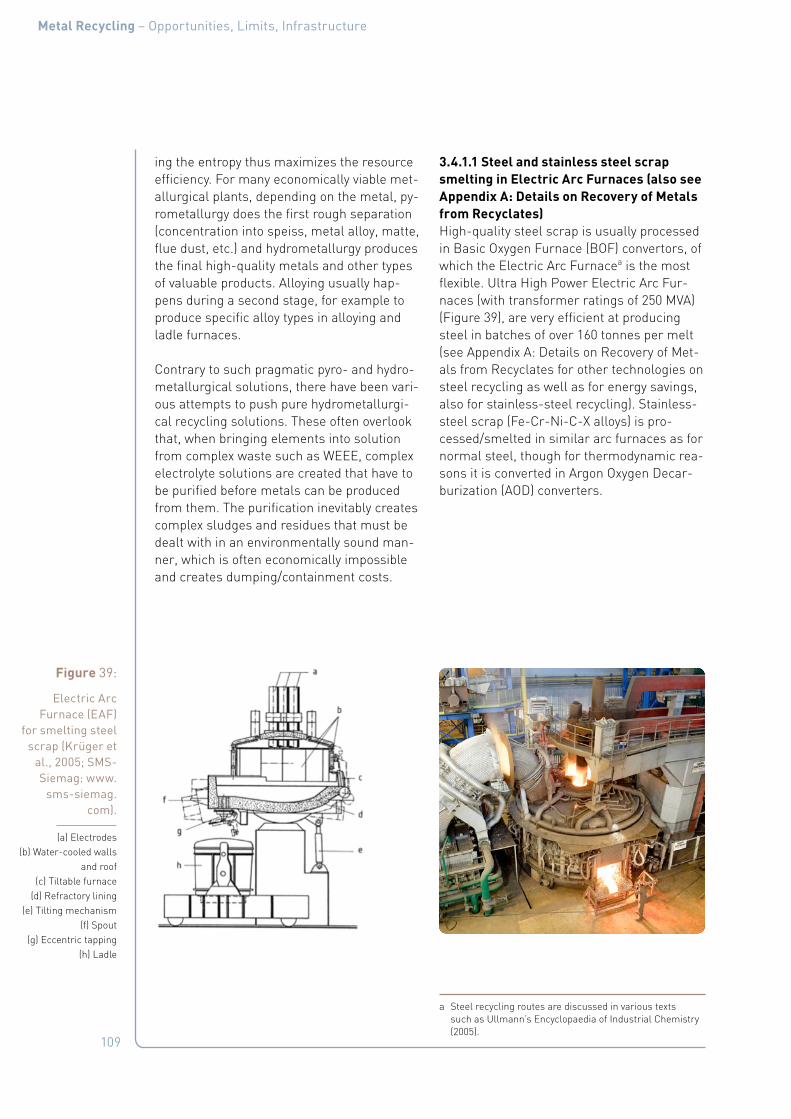
109
Metal Recycling – Opportunities, Limits, Infrastructure
ing the entropy thus maximizes the resource efficiency. For many economically viable met-allurgical plants, depending on the metal, py-rometallurgy does the first rough separation (concentration into speiss, metal alloy, matte, flue dust, etc.) and hydrometallurgy produces the final high-quality metals and other types of valuable products. Alloying usually hap-pens during a second stage, for example to produce specific alloy types in alloying and ladle furnaces.
Contrary to such pragmatic pyro- and hydro-metallurgical solutions, there have been vari-ous attempts to push pure hydrometallurgi-cal recycling solutions. These often overlook that, when bringing elements into solution from complex waste such as WEEE, complex electrolyte solutions are created that have to be purified before metals can be produced from them. The purification inevitably creates complex sludges and residues that must be dealt with in an environmentally sound man-ner, which is often economically impossible and creates dumping/containment costs.
3.4.1.1 Steel and stainless steel scrap smelting in Electric Arc Furnaces (also see Appendix A: Details on Recovery of Metals from Recyclates)High-quality steel scrap is usually processed in Basic Oxygen Furnace (BOF) convertors, of which the Electric Arc Furnacea is the most flexible. Ultra High Power Electric Arc Fur-naces (with transformer ratings of 250 MVA) (Figure 39), are very efficient at producing steel in batches of over 160 tonnes per melt (see Appendix A: Details on Recovery of Met-als from Recyclates for other technologies on steel recycling as well as for energy savings, also for stainless-steel recycling). Stainless-steel scrap (Fe-Cr-Ni-C-X alloys) is pro-cessed/smelted in similar arc furnaces as for normal steel, though for thermodynamic rea-sons it is converted in Argon Oxygen Decar-burization (AOD) converters.
a Steel recycling routes are discussed in various texts such as Ullmann’s Encyclopaedia of Industrial Chemistry (2005).
Figure 39:
Electric Arc Furnace (EAF)
for smelting steel scrap (Krüger et
al., 2005; SMS-Siemag: www.
sms-siemag.com).
(a) Electrodes (b) Water-cooled walls
and roof (c) Tiltable furnace
(d) Refractory lining (e) Tilting mechanism
(f) Spout (g) Eccentric tapping
(h) Ladle

110
Metal Recycling – Opportunities, Limits, Infrastructure
3.4.1.2 Non-ferrous smelting (see also Appendix A: Details on Recovery of Metals from Recyclates)Non-ferrous metallurgical smelting is well established. It uses scrap, residues and bat-teries from various sources, and can sepa-rate and recover the contained metals by concentrating them into metal/matte, speiss, slag, flue dust and offgas, which can be fur-ther processed. This mostly involves hydro-metallurgy, with numerous flowsheet possi-bilities and subsequent electrowinninga/re-fining.
3.4.1.3 Aluminium scrap smelting – wrought and castThe aluminium industry is doing much to maximize the recycling of the various alumin-ium-containing metal alloys and other mate-rials.
Different technologies used for processing different aluminium scrap types are shown in Figure 40. High-quality and pure scrap is re-melted to produce wrought aluminium quali-ties. Refining under a salt (NaCl-KCl) slag is used for poorer scrap qualities.
a Electrowinning separates metals from solutions by elec-trolysis – applying electricity to the solution.
Box 10: Aluminium recycling (European Aluminium Association, 2006) Aluminium can be recycled repeatedly without loss of properties, if scrap is pure and non-contaminated by product complexity. Otherwise dilution of dissolved contaminants by vir-gin aluminium is required. The high value of aluminium scrap is a key incentive for recy-cling. Such recycling benefits present and future generations by conserving energy and other natural resources. It saves about 95 % of the energy required for primary aluminium production, avoiding corresponding emissions including greenhouse gases. Industry con-tinues to recycle, without subsidy, all the aluminium collected as scrap, or from fabrica-tion and manufacturing processes. However, with the help of appropriate authorities, lo-cal communities and society as a whole, the amount of aluminium collected could be in-creased further. Global aluminium recycling rates are high, around 90 % for transport and construction applications and about 60 % for beverage cans.
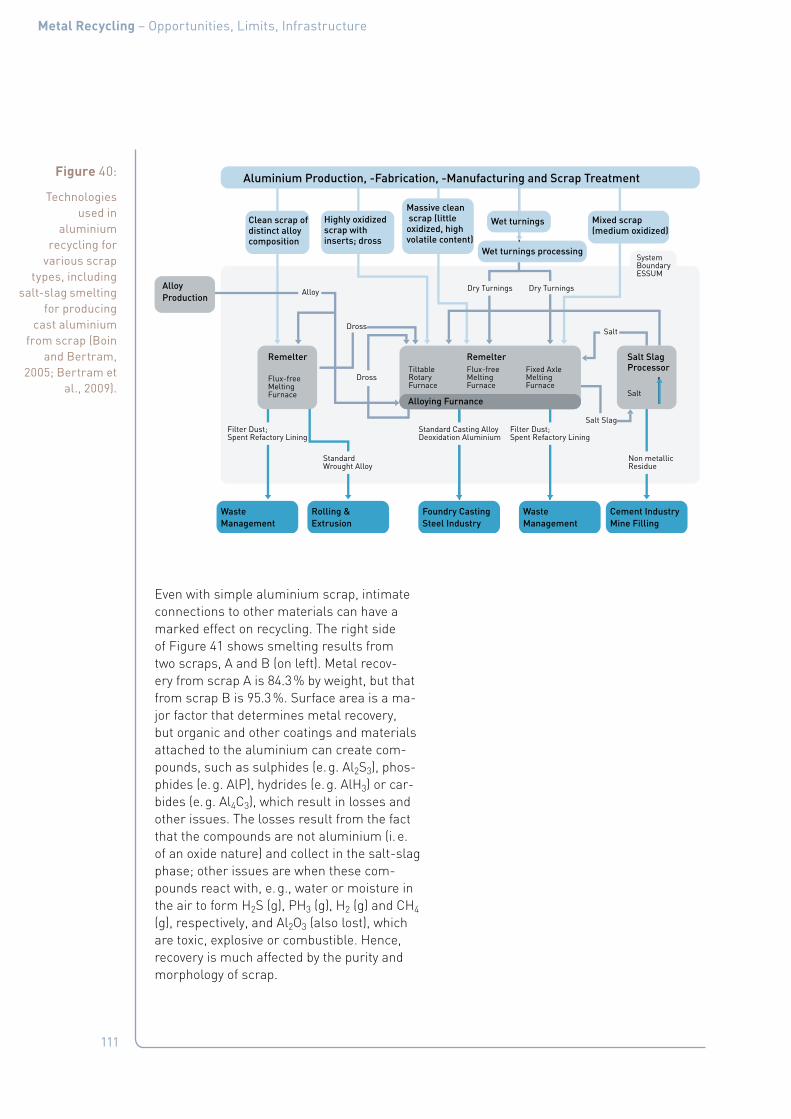
111
Metal Recycling – Opportunities, Limits, Infrastructure
Even with simple aluminium scrap, intimate connections to other materials can have a marked effect on recycling. The right side of Figure 41 shows smelting results from two scraps, A and B (on left). Metal recov-ery from scrap A is 84.3 % by weight, but that from scrap B is 95.3 %. Surface area is a ma-jor factor that determines metal recovery, but organic and other coatings and materials attached to the aluminium can create com-pounds, such as sulphides (e. g. Al2S3), phos-phides (e. g. AlP), hydrides (e. g. AlH3) or car-bides (e. g. Al4C3), which result in losses and other issues. The losses result from the fact that the compounds are not aluminium (i. e. of an oxide nature) and collect in the salt-slag phase; other issues are when these com-pounds react with, e. g., water or moisture in the air to form H2S (g), PH3 (g), H2 (g) and CH4 (g), respectively, and Al2O3 (also lost), which are toxic, explosive or combustible. Hence, recovery is much affected by the purity and morphology of scrap.
Figure 40:
Technologies used in
aluminium recycling for
various scrap types, including
salt-slag smelting for producing
cast aluminium from scrap (Boin
and Bertram, 2005; Bertram et
al., 2009).
Alloy
Aluminium Production, -Fabrication, -Manufacturing and Scrap Treatment
Clean scrap of distinct alloy composition
RemelterFlux-freeMeltingFurnace
Remelter
Flux-freeMeltingFurnace
AlloyProduction
Salt SlagProcessor
Salt
Fixed AxleMeltingFurnace
TiltableRotaryFurnace
Salt
Salt Slag
SystemBoundaryESSUM
Filter Dust;Spent Refactory Lining
Filter Dust;Spent Refactory Lining
Standard Casting AlloyDeoxidation Aluminium
Non metallicResidue
StandardWrought Alloy
Dross
Dry Turnings Dry Turnings
Highly oxidized scrap with inserts; dross
Massive clean scrap (little oxidized, high volatile content)
Mixed scrap (medium oxidized)
Wet turnings
WasteManagement
WasteManagement
Cement IndustryMine Filling
Rolling &Extrusion
Foundry CastingSteel Industry
Wet turnings processing
Alloying Furnance
Dross

112
Metal Recycling – Opportunities, Limits, Infrastructure
3.4.1.4 Copper and nickel scrap smelting as part of a primary copper smelter (a typical flowsheet in the Cu-segment of the Metal Wheel (Figure 15)As for aluminium recycling, an integrated copper smelter can accept a variety of cop-per-scrap types. A large fraction of relatively "pure" copper scrap can be accommodated in copper converters and anode furnaces, while WEEE and lower-grade scrap is processed in a 'Kaldo' or a 'TSL' furnace. Therefore, the schematic flowsheet shown in Figure 42 is well suited for recovering the many elements associated with copper-containing scrap and residue materials, and this in an economical-ly feasible and environmentally friendly way, while still recovering many of the minor ele-ments associated with copper-input materi-als.
A hydrometallurgical process can extract some valuable elements, such as bismuth, gold, silver, platinum group metals (iridium, rhodium, ruthenium, osmium, palladium and platinum) and others that occur in cop-per scrap, after electro-refining. Therefore, WEEE, PGM, metal-containing catalysts and other complex recycled materials are often recycled on the back of copper metallurgy. This example also nicely shows that a com-bination of pyro- and hydro-metallurgy can extend the limits of recycling, thus reflecting the concept of Carrier Metal metallurgy, i. e. a segment of the Metal Wheel (Figure 15).
Figure 41:
The effect of scrap surface area (left) on
recovery (right) of two scrap
types – recovery is held back by
inactive alumina coating scrap,
so scrap with a higher surface
area/volume ratio (upper picture) has
lower recovery rates than larger
pieces (bottom set) (Xiao and Reuter, 2002).

113
Metal Recycling – Opportunities, Limits, Infrastructure
3.4.1.5 Other recovery processes (see also Appendix A: Details on Recovery of Metals from Recyclates)Dedicated pyro- and hydro-metallurgical pro-cesses exist for the recovery and refining of materials rich in valuable elements and pre-cious metals coming from pre-processing fa-cilitiesa. In addition, precious metals can be recovered from other material flows related to WEEE. Several plastics-recycling compa-nies in Europe and the USA reported infor-mally that some of the precious metals con-tained in the material fractions that they re-ceive for recycling are recovered during the removal of impurities from the plastics (Bid-dle et al., 1998; Novak, 2001). Data on these processes are not available.
a Reviews on metallurgical processes for recovering and re-fining (precious) metals from printed circuit boards were issued by Cui and Zhang (2008), Goosey and Kellner (2003) and Huang et al. (2009). The European Commission (2008) provided an overview of “Best Available Techniques” to re-cover precious and other non-ferrous metals.
3.4.2 The limits of metallurgical process engineering
3.4.2.1 Thermodynamic limits when using BATThe thermodynamics of the furnace tech-nologies described in this document (Ap-pendix A: Details on Recovery of Metals from Recyclates) dictate a set of limits for recy-cling. They determine which combinations of materials can, or cannot, be recovered from shredded, dismantled and physically sorted consumer goods. See Appendix F: Physics of Extractive Metallurgy for more details on the thermodynamics and physics affecting these technologies.
3.4.2.2 The impact of the input streamThe purity of the input stream is affected by product design and the whole metals recy-cling chain. The limits of recycling are there-fore also influenced by the factors that affect each of the three main steps of that chain and by how well the interfaces between these interdependent steps are managed: i) Collec-tion; ii) Pre-processing, incl. sorting, disman-
Copper concentrateAg, As, Au, Bi, Co, Fe, Mo,Ni, Pb, PGM, Sb, Se, Te(Metal Wheel)
Copper scrapE-wasteMn, Mo, Ni,Sn, Zn, Pt, Pd,Au
Anode slimeAg, Au, Bi, Pb,PGMs, Sb, Se, Te
WasteCd, Pb, Zn
SlagCo, Fe, Mo, Zn
DustCd, Pb, Zn
Waste
Otherrefinery
Otherindustries
Hydro/pyro-process(extraction)
Humaneconomicactivities
Matte
SilicateFe
ElectrolyteAs, Ni
Electrolyticcopper
Copper alloysAl, Ag, Ni, Pb, Sn, Zn
MetalsAs, Cd, Ni, Pb, Zn
MetalsAg, Au, Bi, Pb,PGMs, Sb, Se, Te
Blister copper
Smeltingfurnace
Converter(refining)
Anode FurnaceElectrorefining
Figure 42:
The flow of elements
associated with copper production
(hydro- and pyro-metallurgy) showing the link
between primary production and
recycling. Gangue minerals are not included.
(Nakajima et al., 2008; 2009; 2011;
Nakamura and Nakajima, 2005;
Nakamura et al., 2007). This flowsheet fits
into the copper segment of the
Metal Wheel (Figure 15).

114
Metal Recycling – Opportunities, Limits, Infrastructure
tling, mechanical treatment; and iii) End-pro-cessing, incl. refining and disposal (UNEP, 2011a). Such input products cannot be con-sidered as bundles of separate metals, alloys, plastics, oxides, sulphides, etc., as these are invariably connected to each other and enter the recycling system together. Their recovery and recyclability depend upon the combina-tion of purity with which they enter the metal-lurgical stream and on the expertise applied to these metallurgical processes.
Box 11: SuperLightCarFigure 43 shows a multi-material super-light body-in-white for a car, combining various materials. The joints between the different materials must be strong enough to withstand collisions. Hence, they will also hold materials together during recycling, leading to mate-rial contamination. If these joined materials are not thermodynamically compatible, they will be lost into one of the recyclate streams. For example, if aluminium joined to steel goes to a steel-scrap smelter, the aluminium will be lost as alumina (Al2O3) to the slag after the deoxidation process during steel-making. If fibre-reinforced plastics go to any metal smelting operation, they will be lost after supplying energy and carbon and hydro-gen to the process. All the materials in Figure 43 therefore affect each others’ recovery/re-cyclability, and all somehow determine how much of the metals are lost during recycling. Only if the materials can be well sorted and separated into “pure” recyclates, as shown by the pie-chart, can the Carrier Metals in Figure 43 easily be processed back into metal with minimal losses. Note that a printed circuit board significantly increases complexity.
Figure 43:
Weight and material
composition of the
SuperLightCar light-weight BIW concept
(SuperLightCar, 2005 – 2009; Goede et al.,
2008; Krinke et al., 2009).
Aluminium extrusion
Aluminium cast
Aluminium Sheet
Magnesium
Fibre reinforced Plastic
Steel

115
Metal Recycling – Opportunities, Limits, Infrastructure
3.4.2.3 Technological limits for processing complex recyclatesThe other key aspect affecting the potential of recycling in any particular case is the techno-logical, economic and thermodynamic knowl-edge of the recycling operator. The further this is from current best practice, the less he will achieve. This is particularly an issue with complex inputs, like consumer waste. When using natural ores, the relationship between the desired metals and accessory elements is relatively clear. However, the combinations of elements in recycled resources, such as by-products and waste, are often different from those in natural ores. Conventional metallur-gical processes were optimized for the eco-nomical and efficient extraction of the desired metals from large amounts of natural ores of a constant grade. Using complex scrap and waste requires changing optimization, which needs specific expertise.
For most of the metals in consumer and in-dustrial waste, the combination of metals and compounds needs processing with technolo-gies for more than one Carrier Metal. To
extract small quantities of metals from com-plex products and alloys requires a deep un-derstanding of the metallurgy of more than one Carrier Metal, and an investment in larger, more complex systems and sophisti-cated non-ferrous metallurgy. This, in turn, requires a mix of metallurgical and thermo-dynamics knowledge to bring together the in-frastructure into a system that treats the res-idues/intermediate products from one Car-rier Metal process in another’s. For example, mixed lead- and copper-based metallurgy in an integrated copper smelter (Figure 44 and Figure 45) is an excellent basis for recovering a wide range of elements from the feed ma-terials. This also illustrates how the primary smelting of – in this case – copper and lead is used for the recycling of other metals found in electronic waste and scrap (Hagelüken, 2006; Cui and Zhang, 2008). Copper, lead and matte (molten metal sulphide) are a solvent for recovering precious metals. The prima-ry metallurgical processing of copper and lead is generally followed by electro-winning (electrolysis) and refining, which effectively removes and recovers elements from crude metals, such as the Kayser Recycling System (Figure 46).
Figure 44:
Metal-production flowsheet
integrating copper and
lead hydro- and pyro-metallurgy
for maximizing metal recovery from Boliden’s
operating facility (Outotec, 2012;
NewBoliden, 2012), fitting
into the Pb and Cu segment of
the Metal Wheel (Figure 15).
Secondary Raw Materials
Copper Conc.
Electronic Scrap
Lead Conc.
Dryer
Fluidized Bed Roaster
Electric Smelting Furnace
E-Kaldo Plant
Dryer
Dryer
Zinc Clinker Iron Sand
Flash Furnace
Converter Aisle
Kaldo Plant Lead Refinery
Lead
Sulphur Products Plant
Precious Metals Plant
Fuming Plant
Anode Casting Plant Electrolytic Refinery
Sulphuric Acid Sulphur Dioxide
Gold Silver Selenium Pt/Pd- sludge
Copper Copper Sulphate Crude Nickel Sulphate
Gas Flow
Copper Flow
Lead Flow
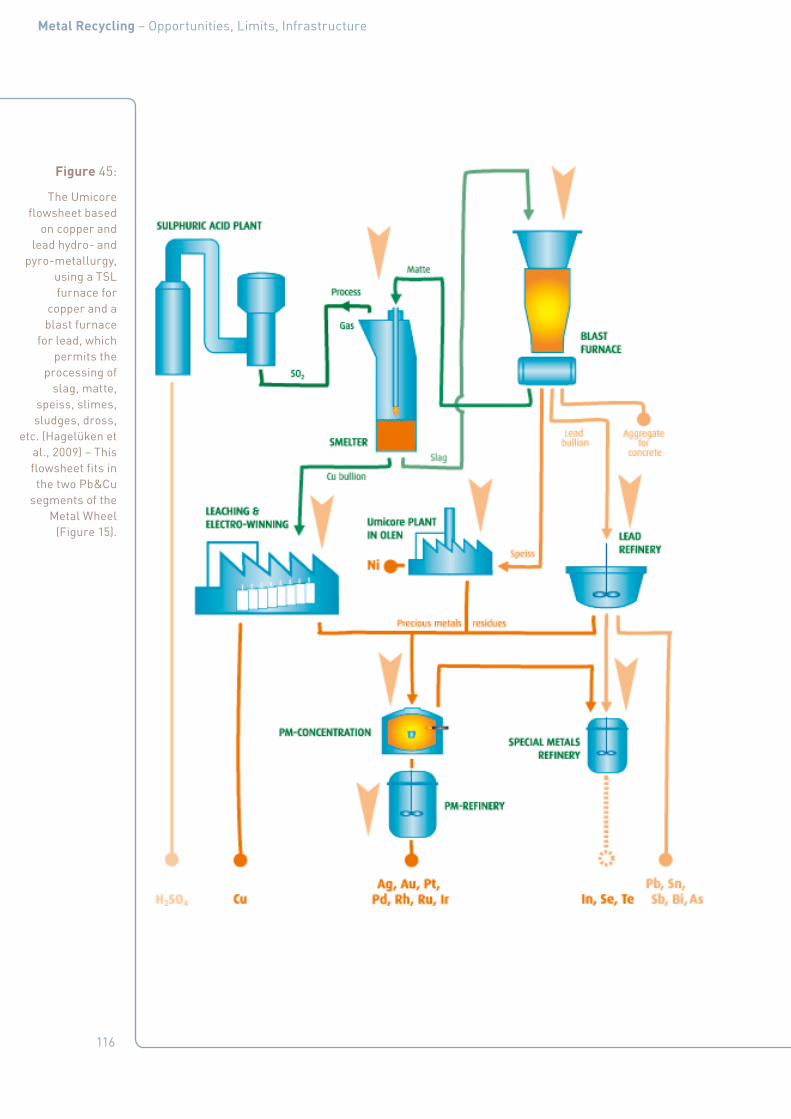
116
Metal Recycling – Opportunities, Limits, Infrastructure
Figure 45:
The Umicore flowsheet based
on copper and lead hydro- and
pyro-metallurgy, using a TSL furnace for
copper and a blast furnace
for lead, which permits the
processing of slag, matte,
speiss, slimes, sludges, dross,
etc. (Hagelüken et al., 2009) – This flowsheet fits in the two Pb&Cu
segments of the Metal Wheel
(Figure 15).

117
Metal Recycling – Opportunities, Limits, Infrastructure
Metal-processing operations that integrate different Carrier Metal technologies are al-ready operating successfully in many parts of the world, some examples of which are shown in Figure 47.
Figure 46:
The Kayser Recycling System
for recycling copper metal
and other copper containing
residues. This flowsheet fits into the Cu segment of
the Metal Wheel (Figure 15).
Raw materials
Copper products
By-products
Figure 47:
Various smelters for the recycling
of a wide range of materials
including copper, lead, zinc,
critical elements, e-waste, slimes, batteries, scrap, etc. All with high
environmental standards as they are all located in or next to towns.
Copper/e-waste (GRM, S Korea)
Copper/e-waste (Boliden, Sweden)
Copper/e-waste (Umicore, Belgium)
Lead Battery (Recylex, Germany)
Copper/e-waste (Dowa, Japan)
KRS (Aurubis, Germany)
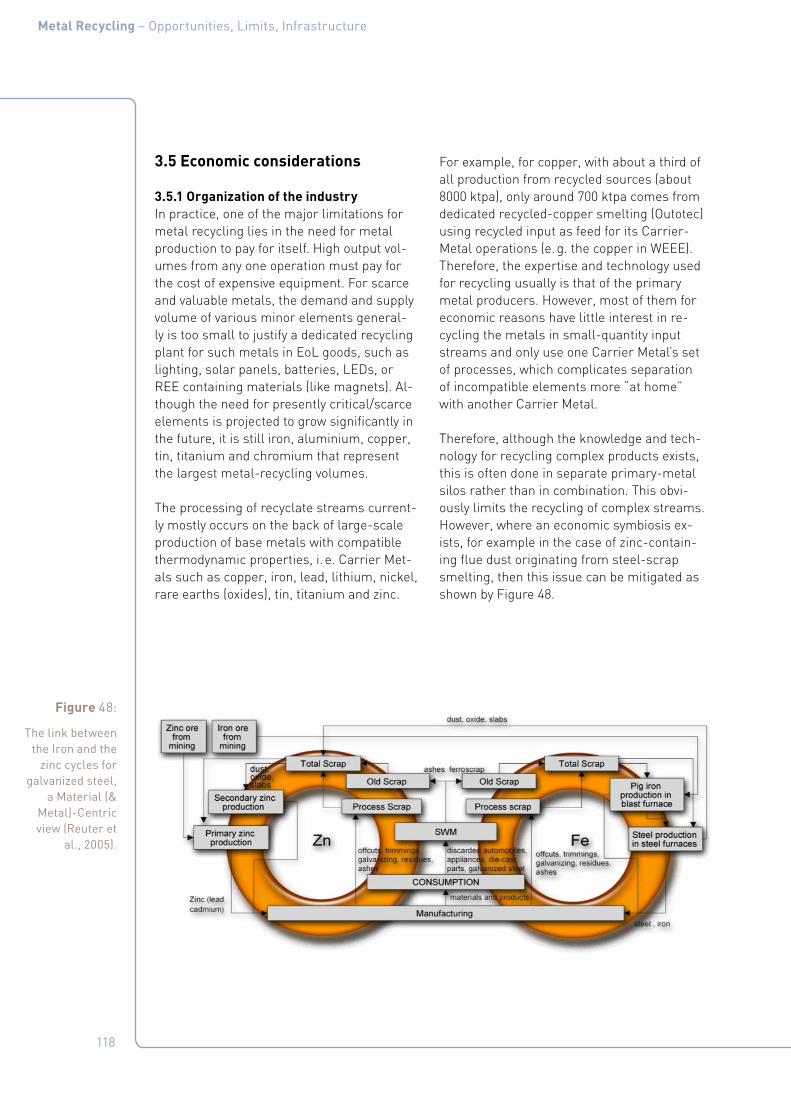
118
Metal Recycling – Opportunities, Limits, Infrastructure
3.5 Economic considerations
3.5.1 Organization of the industryIn practice, one of the major limitations for metal recycling lies in the need for metal production to pay for itself. High output vol-umes from any one operation must pay for the cost of expensive equipment. For scarce and valuable metals, the demand and supply volume of various minor elements general-ly is too small to justify a dedicated recycling plant for such metals in EoL goods, such as lighting, solar panels, batteries, LEDs, or REE containing materials (like magnets). Al-though the need for presently critical/scarce elements is projected to grow significantly in the future, it is still iron, aluminium, copper, tin, titanium and chromium that represent the largest metal-recycling volumes.
The processing of recyclate streams current-ly mostly occurs on the back of large-scale production of base metals with compatible thermodynamic properties, i. e. Carrier Met-als such as copper, iron, lead, lithium, nickel, rare earths (oxides), tin, titanium and zinc.
For example, for copper, with about a third of all production from recycled sources (about 8000 ktpa), only around 700 ktpa comes from dedicated recycled-copper smelting (Outotec) using recycled input as feed for its Carrier-Metal operations (e. g. the copper in WEEE). Therefore, the expertise and technology used for recycling usually is that of the primary metal producers. However, most of them for economic reasons have little interest in re-cycling the metals in small-quantity input streams and only use one Carrier Metal’s set of processes, which complicates separation of incompatible elements more “at home” with another Carrier Metal.
Therefore, although the knowledge and tech-nology for recycling complex products exists, this is often done in separate primary-metal silos rather than in combination. This obvi-ously limits the recycling of complex streams. However, where an economic symbiosis ex-ists, for example in the case of zinc-contain-ing flue dust originating from steel-scrap smelting, then this issue can be mitigated as shown by Figure 48.
Figure 48:
The link between the Iron and the
zinc cycles for galvanized steel,
a Material (& Metal)-Centric view (Reuter et
al., 2005).

119
Metal Recycling – Opportunities, Limits, Infrastructure
This situation with primary producers is un-likely to change by itself in the foreseeable future, as increased global demand for Car-rier Metals and incomplete information on metal recycling (UNEP, 2010) provide few in-centives for primary smelters to change their flowsheets. In addition, the organization of the industry tends to create inertia due to high capital investment, long plant life, etc., encouraging the continuation of single Car-rier Metal operations. The metal-production industry has formed representative organiza-tions based around the primary Carrier Met-al operators; these organizations obviously promote the common denominator between their members in a more material-centric environment, so will unlikely promote inno-vation or explore additional sources of rev-enue in a more product-centric environment of metal recycling. Collaboration of different metal associations would help much to in-crease resource efficiency.
However, parts of this industry already oper-ate in ways that show how the mainstream industry can change. Toll refineries (opera-tors that charge for refining other people’s ores) increasingly integrate different Car-rier Metal technologies. Worldwide, various operations, many of which are mentioned in this document, already operate commercially successful integrated production sites.
Metallurgical technology providers are well placed for turning this industry limitation into an opportunity. Improved treatment and re-covery of valuable metals in input streams generates additional revenue and hence prof-it or value-addition potential for metal pro-ducers. In addition, BAT usually is more re-source efficient, significantly lowering energy demand as well as emissions and environ-mental impact. This can be an opening and opportunity for a fundamental resource-ef-ficient-based change in the mainstream in-dustry.
There is another negative consequence of this reliance on primary-metal-production expertise for recycling: where such expertise is lost in a country or region, recycling is also blocked. A case in point is the REE industry, which, through poor foresight, has concen-trated metallurgical technology in one geo-graphical area (China), which now limits re-cycling of Rare Earths elsewhere.
It should also be noted that a globally levelled playing field of certified BAT operators could help much to bring the system up to the re-quired level of resource-efficient production, which in turn will maximize recycling rates.
3.5.2 Economic constraintsAny metallurgical plant will only process available metal scrap on the back of its nor-mal operation, when economically viable to do so (Figure 49). The economic viabil-ity of recycling is a key limiting factor in the amount of recycling taking place, but this viability is also dependent upon thermody-namics: where there are thermodynamic dif-ficulties, there will be corresponding eco-nomic costs or impossibilities that can hin-der recycling. Complex linkages of metals and their compounds in products, or in mixed waste streams (e. g. smartphones with other WEEE), create economic constraints. Consid-ering this, economic success is mainly deter-mined by:
■ The supply and demand of metals and their alloys/compounds, and the resulting monetary value, including the scrap price.
■ The technologies and processes used, in-cluding economies of scale.
■ The policy framework, not only for metal processing activities, but all policies that affect the activities for designing and op-erating a recycling chain, or its alternative (like landfill costs).
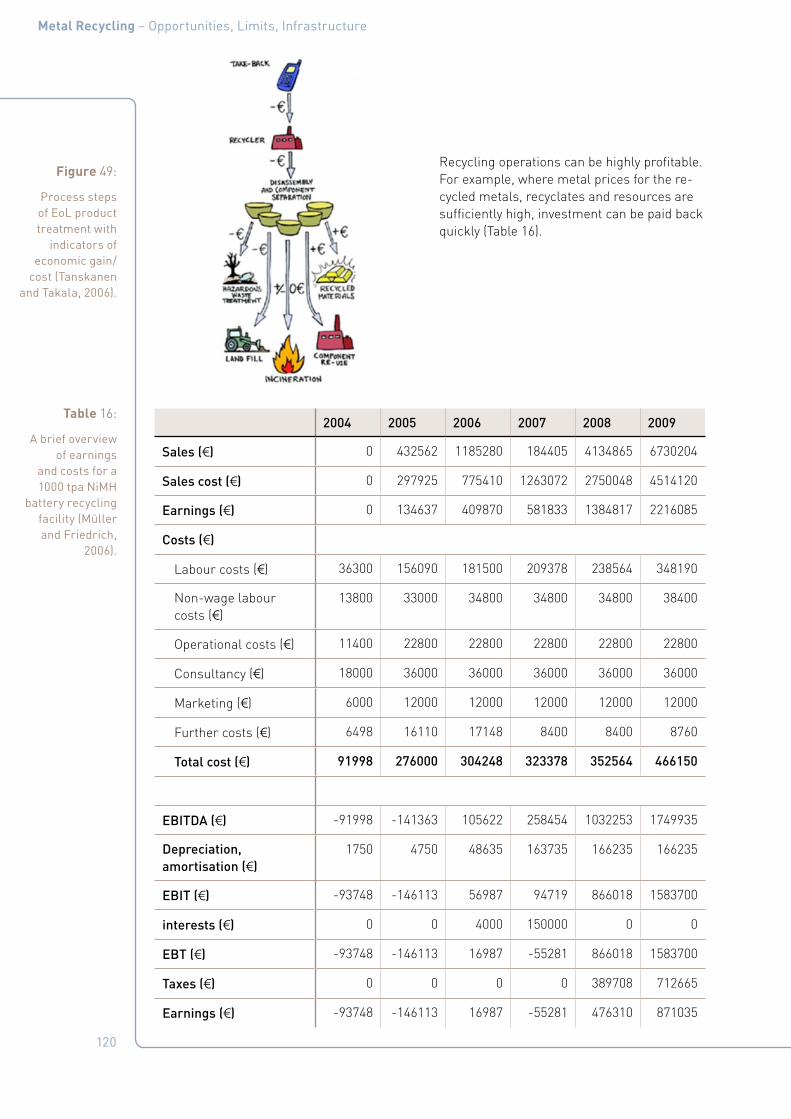
120
Metal Recycling – Opportunities, Limits, Infrastructure
Recycling operations can be highly profitable. For example, where metal prices for the re-cycled metals, recyclates and resources are sufficiently high, investment can be paid back quickly (Table 16).
Figure 49:
Process steps of EoL product treatment with
indicators of economic gain/
cost (Tanskanen and Takala, 2006).
Table 16:
A brief overview of earnings
and costs for a 1000 tpa NiMH
battery recycling facility (Müller and Friedrich,
2006).
2004 2005 2006 2007 2008 2009
Sales (1) 0 432562 1185280 184405 4134865 6730204
Sales cost (1) 0 297925 775410 1263072 2750048 4514120
Earnings (1) 0 134637 409870 581833 1384817 2216085
Costs (1)
Labour costs (1) 36300 156090 181500 209378 238564 348190
Non-wage labour costs (1)
13800 33000 34800 34800 34800 38400
Operational costs (1) 11400 22800 22800 22800 22800 22800
Consultancy (1) 18000 36000 36000 36000 36000 36000
Marketing (1) 6000 12000 12000 12000 12000 12000
Further costs (1) 6498 16110 17148 8400 8400 8760
Total cost (1) 91998 276000 304248 323378 352564 466150
EBITDA (1) -91998 -141363 105622 258454 1032253 1749935
Depreciation, amortisation (1)
1750 4750 48635 163735 166235 166235
EBIT (1) -93748 -146113 56987 94719 866018 1583700
interests (1) 0 0 4000 150000 0 0
EBT (1) -93748 -146113 16987 -55281 866018 1583700
Taxes (1) 0 0 0 0 389708 712665
Earnings (1) -93748 -146113 16987 -55281 476310 871035

121
Metal Recycling – Opportunities, Limits, Infrastructure
3.5.3 Metal, scrap and waste pricesMetal prices are set at the London Metal Ex-change (LME) in relation to supply and de-mand, and often fluctuate quite strongly. The metal price determines what the smelter can earn from the metal content in recyclates (i. e. potential inputs). The value of the metals coming out of recycling depends upon their purity, which in turn – for reasons described above – is determined by design, material combinations, liberation and sorting efficien-cy, and recycling routes.
These prices fluctuate, as shown in Fig-ure 50. If the value of the recycled metal is too low due to low metal prices, recycling cannot come to its full fruition. Ultimately, metal price drives recycling: the higher the value, the higher its recycling potential. Un-fortunately, commodity metal prices have de-creased in real terms over the years. How-ever, recent high prices of various metals – possibly indicating a paradigm shift towards higher metal prices – would generally have a positive effect on recycling.
Figure 50:
Steel scrap prices following iron
ore prices (USGS, 2011).
0
50
100
200
150
250
19601950 1970 1980 1990 2000 2010
300
350
400
0
20
40
60
80
100
120
0
50
100
200
150
250
19601950 1970 1980 1990 2000 2010
300
350
400
0
20
40
60
80
100
120
US$/t US$/tUS$/t
Iron oreIron and steel scrap
122
Metal Recycling – Opportunities, Limits, Infrastructure
LME prices also influence scrap prices, which are further determined by scrap type, complexity, grade (i. e. purity), and morphol-ogy (i. e. turning, sheet, slab, bulk, etc.). The cleaner and closer the scrap quality is to known metal alloys, the higher the pric-es and thus more scrap collection. Scrap/waste price is further influenced by the cost of alternative uses (or disposal) of the waste. Where the alternative disposal costs are high, more waste is likely to be available for recy-cling at lower cost. Rising metal prices thus are an incentive for developing BAT infra-structure and advanced recycling, but low LME (and other metal commodity) prices and a corresponding reduction in available input streams, will hold it back.
The variability in metal prices increases the advantages of integrated metal-production plants that can recover and refine many met-als at the same time. This helps riding the waves of cyclical metal prices, allowing out-of-sync price fluctuations to be managed by adjusting the balance of metal outputs in a manner that maximizes profit.
3.5.4 The cost of process technology and expertiseRecycling costs also depend on the technolo-gies used, and on the cost of the expertise to run them. Capital investment costs (CAPEX) of metallurgical production plants can be very high, and operating costs (OPEX) will vary. OPEX include labour costs (markedly differ-ent in different parts of the world), energy, waste management, water purification, emis-sions control, occupational health and safety, and consumables. Technological efficiency plays a key role, and is in turn determined by the level of available expertise, and by the de-gree of innovation in metallurgical and recy-cling technologies.
Because of CAPEX, smelters require a suffi-ciently large economy of scale for operating. Profitable recycling smelters run well over 100,000 tonnes/year of diverse feed. The feed can be limited by factors such as the energy balance of the process (certain scrap types may contain large percentages of plastics),
aluminium content, the morphology and size of the feed, the range of materials/alloys/compounds in the feed, etc. These affect the thermodynamics and operation of the plant, thus affecting the economics of its operation. The ability of operations to compete for scrap and waste input (where this is scarce) is re-lated to how cost-efficient and expert (BAT) they are compared to other recyclers, includ-ing those in other countries whose labour or regulatory costs may be very different.
3.5.5 The influence of the policy frameworkThe policy framework sets the playing field in which recycling activities compete with other uses of waste, or other potential investments or employment. Waste and recycling poli-cy is only one part of the policy framework, as those that affect innovation, labour cost, availability of trained expertise, transport costs, energy cost, for example, also affect recycling economics. Legislation that places constraints on recycling operations, or use of recycled material, will also affect profitability or feasibility. For instance:
■ Land-fill costs affect both scrap price (stockpiling costs money) and costs for eliminating the residues from recycling processes as special ponds and areas have to be constructed and managed.
■ Transport costs affect collection costs, whilst energy costs affect operating costs.
■ Import or export tariffs, or restrictions for waste, affect potential routes and costs for recycling or residue disposal.
■ Labour costs relative to energy costs af-fect technological choices and the balance of profitability between the use of new and recycled inputs.
■ Supporting innovation in technological de-velopment or commercial applications can help bringing new and more efficient tech-nology into use.
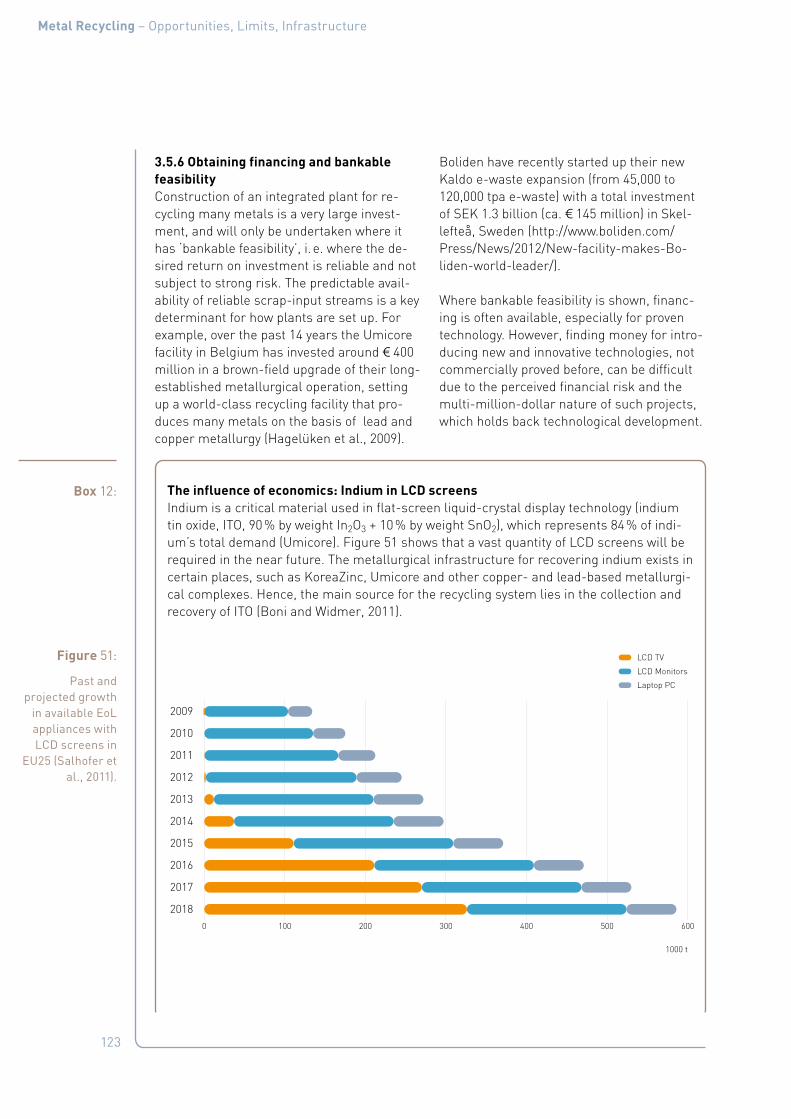
123
Metal Recycling – Opportunities, Limits, Infrastructure
3.5.6 Obtaining financing and bankable feasibilityConstruction of an integrated plant for re-cycling many metals is a very large invest-ment, and will only be undertaken where it has ‘bankable feasibility’, i. e. where the de-sired return on investment is reliable and not subject to strong risk. The predictable avail-ability of reliable scrap-input streams is a key determinant for how plants are set up. For example, over the past 14 years the Umicore facility in Belgium has invested around 1 400 million in a brown-field upgrade of their long-established metallurgical operation, setting up a world-class recycling facility that pro-duces many metals on the basis of lead and copper metallurgy (Hagelüken et al., 2009).
Boliden have recently started up their new Kaldo e-waste expansion (from 45,000 to 120,000 tpa e-waste) with a total investment of SEK 1.3 billion (ca. 1 145 million) in Skel-lefteå, Sweden (http://www.boliden.com/Press/News/2012/New-facility-makes-Bo-liden-world-leader/).
Where bankable feasibility is shown, financ-ing is often available, especially for proven technology. However, finding money for intro-ducing new and innovative technologies, not commercially proved before, can be difficult due to the perceived financial risk and the multi-million-dollar nature of such projects, which holds back technological development.
Box 12: The influence of economics: Indium in LCD screensIndium is a critical material used in flat-screen liquid-crystal display technology (indium tin oxide, ITO, 90 % by weight In2O3 + 10 % by weight SnO2), which represents 84 % of indi-um’s total demand (Umicore). Figure 51 shows that a vast quantity of LCD screens will be required in the near future. The metallurgical infrastructure for recovering indium exists in certain places, such as KoreaZinc, Umicore and other copper- and lead-based metallurgi-cal complexes. Hence, the main source for the recycling system lies in the collection and recovery of ITO (Boni and Widmer, 2011).
Figure 51:
Past and projected growth
in available EoL appliances with LCD screens in
EU25 (Salhofer et al., 2011).
0 100 200 300 400 500 600
Laptop PC
LCD Monitors
LCD TV
2018
2017
2016
2015
2014
2013
2012
2011
2010
2009
1000 t
124
Metal Recycling – Opportunities, Limits, Infrastructure
Box 12: b Today, indium extraction from EoL screens is economically unattractive, as treatment and refining costs are higher than the metal value. The indium concentration in screens is very small, as the ITO layer is very thin (125 nm), or about 234 mg indium/m2 (though a wide range in values is given in the literature). Organic LEDs have about half of this concentra-tion, so they are even less of an economic actuator for extracting indium.
However, extraction from EoL goods could become economically feasible in the future, if indium scarcity drives prices high enough or if new technology becomes available. New methods for recycling flat screens are currently under investigation; while the EU is stock-piling screens awaiting this appropriate technology. Here, the stockpiling cost is weighed against the alternative of incineration, to determine the real cost of intermediate storage.
Note that indium is connected to tin and possibly numerous other elements and com-pounds. For this reason and as discussed in this document, the recovery metallurgy of in-dium must be considered in connection with these other elements. These issues are dis-cussed and illustrated in more detail in Appendix F: Physics of Extractive Metallurgy. Also refer to Li et al. (2009) for further information on LCD recycling.

125
Metal Recycling – Opportunities, Limits, Infrastructure
4. Consequence of Limiting Factors
Recycling is a chain of activities. The volume, quality and value of the metals produced by recycling are determined by the combined stages in that chain. With each stage depend-ent for its success on the preceding ones, the final result is profoundly affected by the weakest link in the chain. Here, we illus-trate the cumulative effect of limiting factors, mainly by reference to one metal: gold.
Concepts and processes applied in the recy-cling chain can vary considerably in different regions and countries. Figure 52 indicates the differences in net yields of gold from printed wire boards that are dependent on efficiency levels in different stages of the chain. The main differences exist between OECD coun-tries, with a prevailing formal sector, and de-veloping countries with a dominant informal sector. The data would be very different for other metals and other input sources, howev-er still shows great variations.
4.1 Collection
In contrast to Europe, where consumers pay for collection and recycling, in develop-ing countries usually the waste collectors pay consumers for their obsolete applianc-es and metal scrap. Informal waste sectors are often organized in a network of individu-als and small businesses of collectors, trad-ers and recyclers, each adding value, and creating jobs, at every point in the recycling chain (Sinha-Khetriwa et al., 2005). As many poor people rely on small incomes gener-ated in this chain, this results in impressive collection rates of up to 95 % of total gener-ated waste. This shows how strong economic stimulus for collection is a key factor in suc-cessful collection, a point that occasionally may be missing in today’s formalized take-back schemes (United Nations University, 2007).
Figure 52:
Recycling efficiency
between a common formal
system in Europe and the informal
sector in India for the gold yield
from printed wire boards.
60 %formaltake-backsystem
System Collection Pre-processing Final processing Net yield
Formal(Europe, UNU 2008, Chancerel et al. 2009)
Informal(India, Keller 2006)
80 %individualcollectors
25 %mainlymechanicalprocesses
50 %manualsorting anddismantling
95 % 15 %integratedsmelter
50 % 20 %backyardleaching
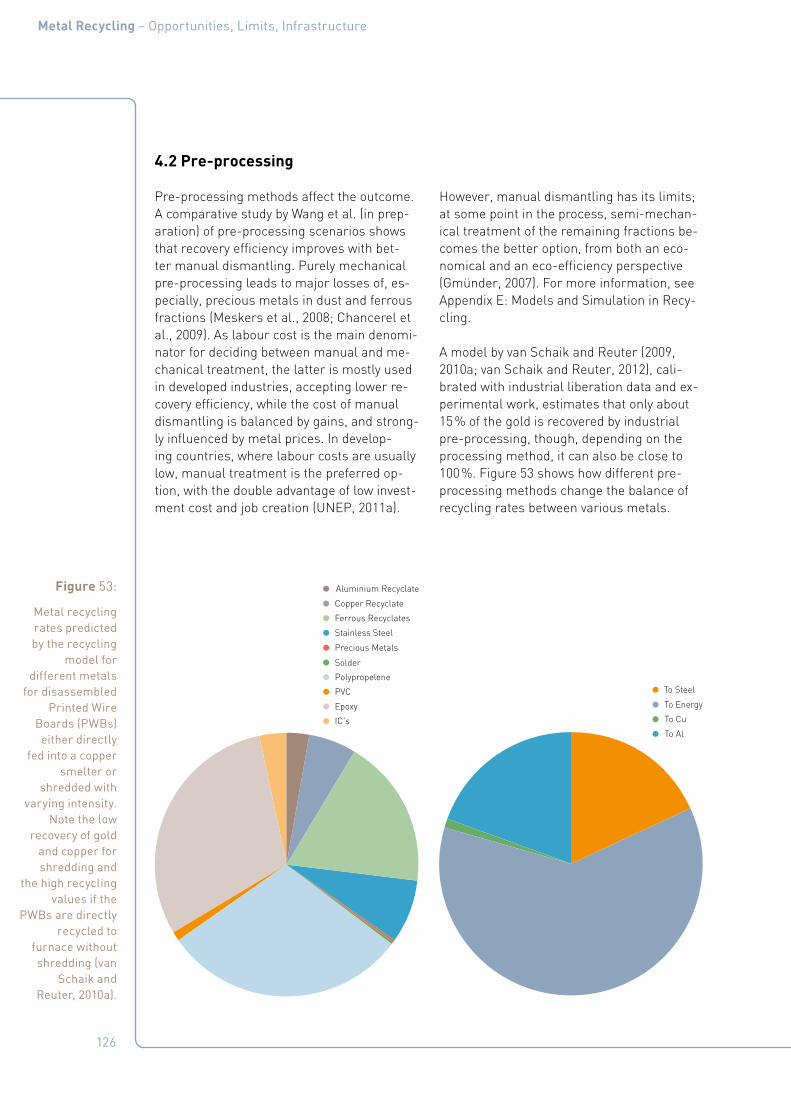
126
Metal Recycling – Opportunities, Limits, Infrastructure
4.2 Pre-processing
Pre-processing methods affect the outcome. A comparative study by Wang et al. (in prep-aration) of pre-processing scenarios shows that recovery efficiency improves with bet-ter manual dismantling. Purely mechanical pre-processing leads to major losses of, es-pecially, precious metals in dust and ferrous fractions (Meskers et al., 2008; Chancerel et al., 2009). As labour cost is the main denomi-nator for deciding between manual and me-chanical treatment, the latter is mostly used in developed industries, accepting lower re-covery efficiency, while the cost of manual dismantling is balanced by gains, and strong-ly influenced by metal prices. In develop-ing countries, where labour costs are usually low, manual treatment is the preferred op-tion, with the double advantage of low invest-ment cost and job creation (UNEP, 2011a).
However, manual dismantling has its limits; at some point in the process, semi-mechan-ical treatment of the remaining fractions be-comes the better option, from both an eco-nomical and an eco-efficiency perspective (Gmünder, 2007). For more information, see Appendix E: Models and Simulation in Recy-cling.
A model by van Schaik and Reuter (2009, 2010a; van Schaik and Reuter, 2012), cali-brated with industrial liberation data and ex-perimental work, estimates that only about 15 % of the gold is recovered by industrial pre-processing, though, depending on the processing method, it can also be close to 100 %. Figure 53 shows how different pre-processing methods change the balance of recycling rates between various metals.
Figure 53:
Metal recycling rates predicted by the recycling
model for different metals
for disassembled Printed Wire
Boards (PWBs) either directly
fed into a copper smelter or
shredded with varying intensity.
Note the low recovery of gold
and copper for shredding and
the high recycling values if the
PWBs are directly recycled to
furnace without shredding (van
Schaik and Reuter, 2010a).
IC's
Epoxy
PVC
Polypropelene
Solder
Precious Metals
Stainless Steel
Ferrous Recyclates
Copper Recyclate
Aluminium Recyclate
To Al
To Cu
To Energy
To Steel

127
Metal Recycling – Opportunities, Limits, Infrastructure
4.3 Final processing
The recovery efficiency of metals from recy-cled sources can vary hugely with the sophis-tication of the metallurgical processes used, being highest when using integrated BAT systems. Informal processes do not achieve this, and, importantly, typically lead to loss of valuable elements in the waste stream, often into the environment, where they can cause human and environmental health problems. Several authors (Table 17) estimated the pre-cious-metal recovery rates for WEEE enter-ing the formal sector largely to exceed 90 %.
Figure 53:_b
0 20 40 60 80 100
Direct to smelting
Strong shredding
Little shredding
Sn
Fe
Cu
Au
Al
Metal recovery as metal [%]
Table 17:
Recovery rates for gold and pal-ladium achieved
by recovery processes of the
formal sector (Chancerel, 2010).
a 5 % is lost in the copper smelter,
and 1 % during pal-ladium refining.
Reference Recovery rate for gold
Recovery rate for palladium
Huisman (United Nations University, 2007) > 99 % > 99 %
Deubzer (2007) 98 % 99 %
Hagelüken et al. (2009) > 95 % –
Hagelüken (2005) – 94 %a

128
Metal Recycling – Opportunities, Limits, Infrastructure
4.4 Net recovery rates
Figure 52 shows some estimates of net yields from different recycling systems. Other es-timates also illustrate the cumulative effect of limitations at different stages. According to Hagelüken (2005), in Germany only 37.6 % of the platinum-group metals contained in WEEE are recovered. The losses are due to insufficient collection (50 %), pre-processing (10 %), copper-smelting (2 %) and final refin-ing (0.4 %). Saurat and Bringezu (2008) re-ported that 13,945 kg of the 22,563 kg of plat-inum-group metals contained in electron-ics in Europe were recycled in 2004. Deubzer (2007) assumed the worldwide recycling rates for gold, palladium and silver to be 7 % for low- and medium-grade WEEE, and 9 % for high-grade WEEE.
In contrast, Keller (2006) carried out a sub-stance-flow analysis for investigating the pro-cesses of recovering gold from printed wire boards (PWBs) during informal precious-metal recovery in Bangalore, India. He com-pared two different processes, both starting with manual dismantling of PWBs to remove the parts containing apparent gold, which later was recovered by cyanide leaching and gold stripping. Between 40 % and 84 % of the contained gold was lost during pre-process-ing (dismantling), mainly because of poor vis-ual recognition of apparent gold. The recovery of gold through chemical processes caused further losses, so that, in all, only 8 % to 18 % of the gold was recovered. In both processes, palladium was not recovered.
4.5 Distributed recycling rates
Table 18 shows that, depending on economic and other boundary conditions, the total re-covery of materials and energy can change significantly. The various scenarios simulated by the multi-parameter optimization model included:
■ Scenario 1: Optimization of a flowsheet for end-of-life vehicle (ELV) processing with-out limitation of the thermal treatment stream.
■ Scenario 2: Optimization of an ELV-pro-cessing flowsheet with limitation of the thermal treatment stream restricted to 10 % of the input (as required in the Euro-pean ELV Directive).
■ Scenario 3: Maximum material- and met-al-recovery scenarios with limitation of the thermal treatment stream restricted to 10 % of the input (as required in the Euro-pean ELV Directive).
■ Scenario 4: Minimum waste scenario with-out limitations for thermal treatment.
■ Scenario 5: Maximum aluminium-recovery scenario, limiting the thermal processing input to 10 %.
It is obvious that there can be no single recy-cling rate, but only a distribution of recycling rates. Different car models, different recy-cling scenarios, different recycling infrastruc-ture and routes, etc., all create different re-cycling rates. It would be best, therefore, to focus on the economics of these processes to create a playing field in which recovery of materials and energy can be maximized.

129
Metal Recycling – Opportunities, Limits, Infrastructure
Recovery results for chosen scenarios
Table 18:
Various recovery rates for end-
of-life vehicles (ELVs) depending
on the objective function of the system
optimization model (Ignatenko
et al., 2008).
Scenario 1 2 3 4 5
Total recovery 0.95 0.91 0.91 0.97 0.88
Metal recovery 0.74 0.74 0.72 0.63 0.73
Physical separation 0.73 0.74 0.72 0.63 0.72
Thermal processing 0.003 0.001 0 0 0.01
Material recovery 0.11 0.11 0.14 0.24 0.12
Plastics 0.02 0.03 0.05 0.02 0.04
Silica 0.004 0.05 0.05 0.03 0.05
From thermal processing 0.05 0.03 0.05 0.19 0.03
Energy recovery 0.1 0.07 0.05 0.1 0.04
Zn-rich dust (from thermal treatment)
0.003 0.002 0.002 0.005 0.002
Waste 0.06 0.09 0.09 0.03 0.12
Physical processing 0.01 0.03 0.05 0.002 0.06
Metallurgy plant 0.05 0.05 0.05 0.03 0.05
Thermal processing 0.001 0.001 0 0 0.01

130
Metal Recycling – Opportunities, Limits, Infrastructure

131
Metal Recycling – Opportunities, Limits, Infrastructure
5. Infrastructure for Optimizing Recycling
5.1 Stakeholder infrastructure
A wide range of decision-makers influences the outcome of a recycling system and its in-frastructure. Those most strongly affecting the physical nature of global metal chains are shown in the top half of Figure 54:
■ Product designers decide which metals to incorporate into which products, and set in motion metal flow into plants and from there into society. They decide how acces-sible metal (sub)components are in their products for dismantling (design for disas-sembly). Manufacturers (OEMs) and retail-ers of consumer products determine how products are distributed in the market, what kind of business models they adopt (e. g. sale, deposit, lease, etc.), and what
kind of supported or offered take-back in-frastructure will affect the collection and recycling results.
■ Consumers use metal-containing products and can exercise choices in acquisition, maintenance or disposal of metal-contain-ing products, which then activate and di-rect metal flows.
■ Public infrastructure planners plan waste-management infrastructure and they play a key role in recovering and con-centrating goods that have too little value for motivating recycling by private enter-prise. They most often are affiliated with local government or public enterprises.
■ Industrial investors or plant operators de-cide where to build smelters or refineries, for which metals and at what size. They provide the physical structures in which metals are separated and refined, but need reasonable secure supply streams.
Figure 54:
The various stakeholders of
recycling in a two dimensional
simplified representation
of a multi-dimensional
complex product centric approach
(Harro von Blottnitz, 2011).
132
Metal Recycling – Opportunities, Limits, Infrastructure
In addition, there are three more classes of stakeholders, who can enable or regulate the decision-making of the above four classes of direct stakeholders. Indicated in the bottom half of Figure 54, they are:
■ Technology providers of metallurgical and related technical knowledge most often create and enable innovations in metals production or use.
■ Regulators and economic planners (at na-tional and international level) encourage, discourage or forbid forms of recycling, through industrial support, regulation of other forms of waste disposal, waste col-lection requirements, as well prohibiting pollution of the natural environment.
■ Sustainability analysts increasingly pro-vide vital knowledge of the complex sys-tem described thus far. As an example, economic and environmental regulatory concerns in the past were often in conflict, because of apparent trade-offs based on partial views of the economic system. In the transition to a “green economy”, such conflicts should disappear through sophis-ticated analysis that combines environ-mental, social and economic sustainabil-ity considerations with science-technical constraints.
Greater recycling will result when these classes of decision-makers will fully under-stand the framework of a sustainable use of materials and the role technology can and must play in closing metal cycles. Not eve-ry stakeholder needs the same information, but their decision-making can be facilitated by providing them with systemic and cross-discipline insights. After all, though they may have a broad understanding of the systems, they often lack a detailed knowledge of the underlying sciences. Where they take on work in a specialist area, such as the question of metals use and recycling, they must be aware that specialist knowledge is needed for en-suring they make realistic and reasonable as-sumptions and conclusions.
Not every stakeholder holds all the informa-tion he needs, but he must know where to find this information. Good decision-mak-ing comes from knowing which questions to ask from whom, as shown in Figure 54. No-body in the materials and recycling – or any other – field can work in ‘ivory tower’ isola-tion anymore. For example, industry, knowl-edge institutes and government consortia are starting to guide the regulation coming out of governmental waste agencies to provide the groundwork for enhanced metal recycling.
This schematic picture does not explicitly cover the small private enterprises that are crucial to the formal and informal economies of recycling. Recent Brazilian experience with the organizing of waste pickers into coopera-tives with government support suggests that the reach of micro-scale private enterprise in resource recovery can be significantly extend-ed through support from public infrastruc-ture planners (Ferrão and Amaral, 2006), and that this may become a major component of green-economy programmes. Such stake-holders respond primarily to the financial value of many metals in EoL products and, as such, can be seen as extensions of the “in-dustrial investors" grouping.
Better recycling will result from having an infrastructure that supports cooperation be-tween the different stakeholders in the recy-cling chain. Each of them has his own inter-ests and incentives; to improve the system, we need not only an effective route for infor-mation exchange, but also a set of incentives making it worthwhile for the stakeholders to cooperate.
Financial gain is the main way that stake-holders influence each other. This may be enough to induce informal collection, but when improvements rely on doing some-thing differently, such as an unusual collect-ing method, financial incitement may not be enough, and information is needed about po-tential benefits. The best improvements in re-cycling will come when more than one stake-holder changes his behaviour at the same

133
Metal Recycling – Opportunities, Limits, Infrastructure
time, so that each change is complemented and reinforced by the other.
These cooperative changes require a de-gree of trust that both (or all) stakeholders will "play the game". Time lags in the system increase this need for cooperation: a metal processor receiving EoL waste generally can do little to influence the design of the prod-ucts reaching him.
Improving the system more than incremen-tally also requires that all stakeholders un-derstand the recycling system as a whole, i. e. beyond their specific task, and that they can evaluate the importance of preceding and subsequent stakeholders for the overall re-cycling success. Performance jumps in the system need more than the optimization of single steps; focus has to be put on interfac-es and interdependence. It may be that more efforts in collection and pre-sorting, or less in-depth pre-processing treatment with ad-ditional efforts in subsequent metallurgy, will lead to overall better system performance. Obviously, the current recycling chains and stakeholder interactions are a result of his-toric development, where old-fashioned waste management with a focus on
mass products and flows, and on the elimina-tion of hazardous substances, has been the long-time driver. This approach no longer fits the new focus on recovery of critical metals from complex products, and the overall ap-proach needs re-inventing, best starting from a visionary brainstorming exercise among key stakeholders. Questions to answer could be:
■ What should a recycling system ideal-ly look like under the new conditions and objectives, regardless of where we stand today?
■ How far is society away from this target situation and what is needed to get there?
■ What are the opportunities and limits of recycling, as measured against the rig-orous limits based on and estimated by physics?
It is clear that this target cannot be reached "overnight", but, without a vision and "mental reset", it will be hard to make the quantum leaps needed to move towards a real circular economy.
134
Metal Recycling – Opportunities, Limits, Infrastructure
5.2 Cognitive infrastructure
The importance of a crosscutting education mirrors a more fundamental piece of the in-frastructure for greater recycling. This is a cognitive, rather than physical, infrastructure. The way in which people think has a signifi-cant positive or negative effect on recycling success. The more people know about the re-lationships and interconnections involved in the recycling of complex materials, the more successful it will be, as the recycling indus-try is often held back by outdated beliefs and mindsets of its stakeholders.
5.2.1 Product-Centric versus Material-Centric views of recyclingUntil now, a commonly held way of concep-tualizing recycling has been to focus on the recycling of a particular material (a Material (&Metal)-Centric view), which is suitable for the recycling of very simple products. It fo-
cuses on individual Carrier Metals, consid-ering all other elements as a “hindrance”. For example, iron (steel) recycling tradition-ally views copper, tin and antimony as well as zinc and lead as quality problems, as they af-fect steel quality and create residues of low economic value that must be dumped. In oth-er words, it tries to operate within the bounds of only one segment of the Metal Wheel.
A very different perspective on recycling lies in considering the requirements for optimal-ly recycling any particular complex product, called a Product-Centric view. This considers the complex metallurgy of all elements at the same time, optimizing both the metallurgy and recycling infrastructure in order to mini-mize losses, but also addressing the related issues, such as liberation, sorting and con-sumer recycling.
A Product-Centric perspective requires an ability to comprehend the interconnected sys-
Box 13: Predictability of input streamsInvestment in recycling is facilitated by more reliable prediction of recyclate input streams, based on (time-varying) product type and product design. This helps calculating statisti-cally and fundamentally reliable recycling rates as well as their economic rate of return. Consistent policy and modelling of the factors that can modify the streams will help, but both rely on accurate information from product manufacturers on the variables affecting these streams, such as:
■ Product composition, coming from consumer demand (e. g. functionality), policy change (e. g. banning CFC in refrigerators or lead-free soldering), product trends (e. g. SUV cars), changing technology (e. g. hybrid cars).
■ Monitoring of collected materials along the entire recycling chain.
■ Varying and changing product purchasing, affecting future waste streams.
■ Life time (usage) product distribution (determining the distribution of EoL products over time) driven by consumer behaviour (e. g. shifting trends from mobile phones to PDA/smart phones).
■ Disposal behaviour, including consumer hoarding of old unused products (e. g. mobile phones).
■ Collection schemes or informal collection activities.
135
Metal Recycling – Opportunities, Limits, Infrastructure
tem of design, collection, sorting, and pro-cessing that determines the performance of a product’s recycling. A Product-Centric view of recycling integrates all policy issues and leg-islation around products and their recycling. Very importantly, it optimizes recycling, con-sidering processes (and economics) for more than one Carrier Metal, thus optimizing the recovery of several metals (alloys and com-pounds) from complex products. To illustrate the nature of this view, Figure 48 shows the link between metals for a relatively simple product: galvanized steel (about 50 % of all zinc is used for galvanizing, where it protects steel from corrosion).
Taking a Product-Centric view of recycling in the way described above is a form of ‘sys-tems thinking’ – considering all factors that affect a system’s outcome, in an attempt to improve this outcome. Recycling is a system, or rather – for complex recycled sources – a mesh of related systems. Optimization of this system is best started from a Product-Cen-tric view as this links the product design’s complex “mineralogy” to the recycling out-come. The Material (& Metal)-Centric ther-modynamic and economic knowledge of the processes involved is also taken into account by this system.
Conceptualizing recycling in this way is help-ful for all decision-makers involved in recy-cling, in industry as well as in the public sec-tor. It helps them understand what actions will affect recycling, and that changes to one part of the recycling system (e. g. collection volumes or the mixing of different product categories) without consideration of the other parts of the cycle may not have the desired effect. Considering the full industrial system of which recycling is a part, also helps private and public decision-makers in understand-ing the important role of recycling for shaping a global “sustainable” future. A better appre-ciation of how recycling can provide some of the scarce materials needed for sustainabili-ty-enabling infrastructure and products, and of how it can significantly reduce fossil-fuel use, will provide the recycling and metallur-
gical industry with the economic and political visibility and attractiveness that it merits.
Appreciating the great benefits of systems-thinking for optimizing complex industrial and physical interactions, has grown into a body of expertise called ‘industrial ecology’. It is very helpful to see recycling operations as part of ‘ecology’, affected by many parts of a system. This is particularly valuable because most metal-value chains are internation-al, and metal-containing products are often marketed globally. Thinking this way trans-forms an over-simplified, linear, ‘extract-re-fine-manufacture-consume-dispose’ eco-nomic model into a circular one (Ayres, 1997; Allwood et al., 2011). Taking a perspective of metals as ‘stocks-and-flows’ within a sys-tem (Cowell et al., 1999; Graedel, 2003) helps to see recycling’s true nature: infrastructural nodes (mines, smelters, factories, our built environment, scrap yards) become apparent, and one can account for the flows of metals between these nodes.
5.2.2 Innovating recycling in a Product-Centric worldA clear understanding of the challenges of recycling complex metal streams will help in-novation. It clarifies the likely future demands placed on recycling, defines the appropri-ate characteristics of new technologies, and supports the economic case for innovation, intended to push back the boundaries of re-cycling. Just as important is that recycling and metal processing operations adopt new processes.
In developing countries, new technology by-passing OECD practices can be rapidly adopt-ed. Locally, highly adaptive manual sorting will further facilitate this. Without innova-tion, recycling metallurgy stagnates and can-not keep up with ever-changing product de-sign. Innovation provides the solution to the question: “Is the technological playing field sophisticated enough and ready for handling all the complex recyclates now coming on stream, and for producing high-grade met-al products?” Innovative technology can in-crease the overall recovery rate, including:
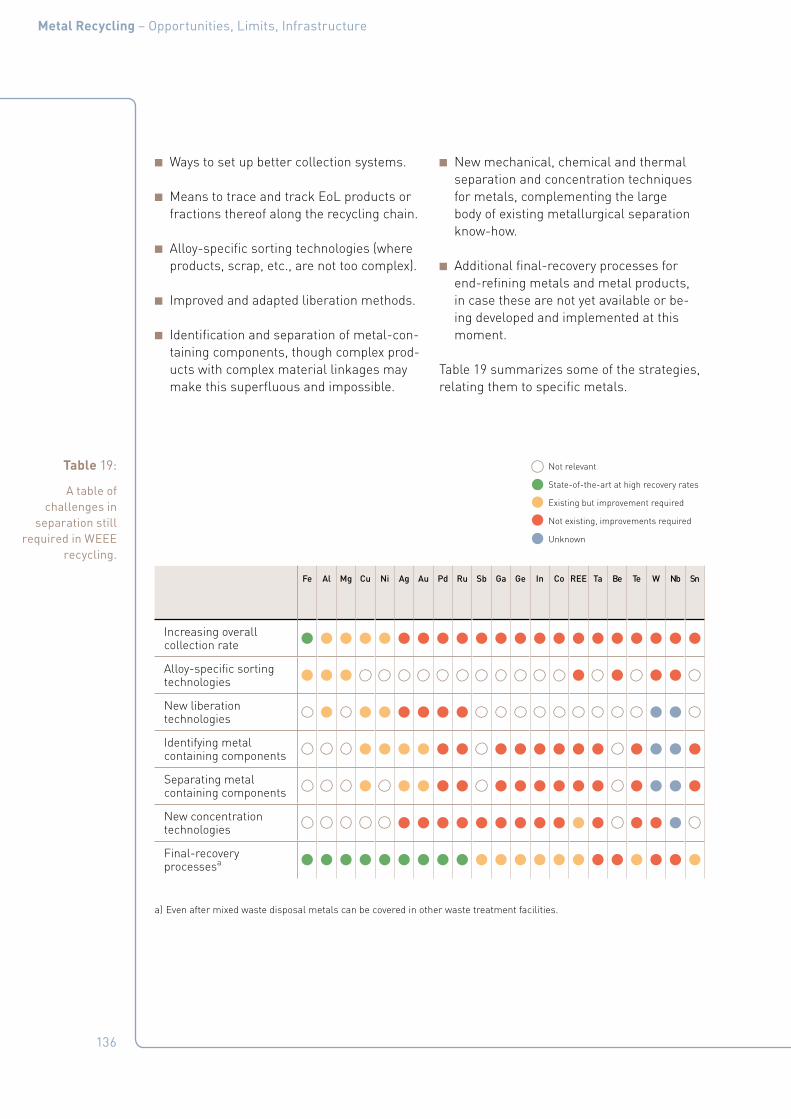
136
Metal Recycling – Opportunities, Limits, Infrastructure
■ Ways to set up better collection systems.
■ Means to trace and track EoL products or fractions thereof along the recycling chain.
■ Alloy-specific sorting technologies (where products, scrap, etc., are not too complex).
■ Improved and adapted liberation methods.
■ Identification and separation of metal-con-taining components, though complex prod-ucts with complex material linkages may make this superfluous and impossible.
■ New mechanical, chemical and thermal separation and concentration techniques for metals, complementing the large body of existing metallurgical separation know-how.
■ Additional final-recovery processes for end-refining metals and metal products, in case these are not yet available or be-ing developed and implemented at this moment.
Table 19 summarizes some of the strategies, relating them to specific metals.
Table 19:
A table of challenges in
separation still required in WEEE
recycling.
Not relevant
State-of-the-art at high recovery rates
Existing but improvement required
Not existing, improvements required
Unknown
Fe Al Mg Cu Ni Ag Au Pd Ru Sb Ga Ge In Co REE Ta Be Te W Nb Sn
Increasing overall collection rate
Alloy-specific sorting technologies
New liberation technologies
Identifying metal containing components
Separating metal containing components
New concentration technologies
Final-recovery processesa
a) Even after mixed waste disposal metals can be covered in other waste treatment facilities.
137
Metal Recycling – Opportunities, Limits, Infrastructure
Exciting innovation already takes place, such as:
■ Innovative smelters that have come up with ingenious ways for expanding their traditional core competence into a capabil-ity of processing complex scrap and a mul-titude of metals, alloys and compounds of modern products. For example, Umicore and Rhodia recently developed a process for recovering REE from NiMH batteries (Pietrelli et al., 2002; Bertuol et al., 2006; Umicore, 2011). Silmet (2012) is also a rare earth element producer.
■ The main separation tool for extracting al-uminium from Municipal Solid Waste, the Eddy Current machine, is increasingly (re-)designed for extracting non-ferrous met-als from specific-size grains in incinerator bottom ash. This should result in higher aluminium extraction levels within the fine fraction (< 5 mm). Further development of sensor-ejector sorting systems will also improve yield.
■ Several major adjustments in processing plants are being applied on an industri-al scale: strong magnets for removing all ferrous material (in addition to iron/steel) ahead of the Eddy Current machine; wash-ing of bottom ash during the classifica-tion process; and dry cooling of bottom ash instead of using a standard water box for cooling. This will lead to better quality and extraction of the non-ferrous metals.
5.3 Recycling infrastructure
Here we describe the physical and knowledge components of an efficient recycling infra-structure, performing according to sustaina-ble development principles.
5.3.1 CollectionIncreasing collection and pre-sorting of post-consumer and industrial waste is a key way of improving recycling. Collection that pro-duces technically and economically viable processing streams is a prerequisite for high returns from the rest of the process. Mixing
incompatible materials and compounds in a waste stream will have a negative effect on the recycling. Many collection systems there-fore aim for separate collection of different waste types (This is less of an issue for the recycling of industrial residues).
Increased collection of suitable input streams plays an important role. Because success-ful recycling plants often run on high vol-umes to offset high initial investment costs, the availability of high input volumes is im-portant. This is one reason why most recy-cling of scarce, valuable and precious metals takes place in primary-production plants. A new plant will only open where the volume of recycled products is of sufficiently high value to cover the costs. For example, the volume of REE production is rather low and only few plants will be built for their processing. The small amounts of REE in recycled waste will most likely have to be processed either in ex-isting facilities that are almost all in China, or in new centralized plants elsewhere (for ex-ample, one in Europe) where regional input can ensure the necessary economy of scale.
5.3.1.1 Collection infrastructure Recycling starts with a collection infrastruc-ture. This can be set up by the authorities (often as part of their waste collection), by product manufacturers and retailers (taking responsibility for the EoL stage of their prod-ucts), or by companies, individuals or chari-ties wishing to earn money from the value in waste or to reduce environmental impact. A crucial part of that infrastructure is the ca-pability of the people (or organization) col-lecting the waste. For newly started collec-tion schemes, the responsible people (for example local authorities) will be successful when they have sufficient support in setting up the knowledge base, motivation and physi-cal infrastructure for dealing with separate streams of collected waste.
Another part of the infrastructure is the in-centive structure for collection. Some collec-tors may act out of ethical or environmental considerations, but nearly all work because they earn money from collection, or face pen-

138
Metal Recycling – Opportunities, Limits, Infrastructure
alties for failing to collect. Creating the right incentives will boost recycling and thus can be closely connected to the business models under which (consumer) goods are distribut-ed on the market.
Box 14: Recycling of aluminium in Brazil - income generation as the main motivationIn contrast to other materials, aluminium can be recycled infinitely without losing its value in the process if pure aluminium is recycled. However, when contamination occurs it leads to downcycling. It can be recycled either from EoL scrap, or from remnants of the produc-tion process. Household items, beverage cans, window frames, automotive components, among others, can be melted and reused for making new products. This recyclability is one of the main attributes of aluminium and generates many benefits, as summarized in Table 20.
The world average of recycling aluminium is 27 %; with the highest figure for the United Kingdom (57.3 %) (Figure 55). However, when considering only aluminium beverage cans, Brazil has been the leader for ten consecutive years (Figure 56).
Table 20:
The benefits of recycling
(International Aluminium
Institute and Brazilian
Association of Aluminium www.
abal.org.br).
Social and Economic Environmental
Generates jobs and income for thousands of workers involved in the chain of recy-cling aluminium.
Provides significant savings in electricity and greenhouse gases emissions – only 5 % of the energy required and emis-sions of greenhouse gases when com-pared with the production of primary aluminium.
It is the main business for more than two thousand companies among cooperatives, retail centers, transporters and proces-sors.
Reduces the consumption of raw mate-rials such as bauxite and alloying ele-ments.
Funds injected on the local economies through job creation, tax collection and market development.
Decreases volume of materials discard-ed post-consumer and industrial waste, returning to the productive chain as raw material and saving space in landfills.
It is an activity that moves millions in the national economy, at all stages of the pro-cess.
Promotes development of environmental awareness in society.
Encourages other businesses, demand for new activities related to the recycling chain.
Encourages recycling of materials.

139
Metal Recycling – Opportunities, Limits, Infrastructure
Box 14:_b
Aluminium cans are important in recycling because they have a high volume and a much shorter life cycle than other aluminium products. In 2010, with a recycling rate of 97.6 %, Brazil again beat the world record with 239,100 tonnes of scrap cans (17.7 billion units, 48,500,000 cans/day, two million/hour). Currently, it takes about 30 days to buy, use, col-lect, recycle, remanufacture, refill and return an aluminium beverage can to the shelves. The efforts of the recycling chain – manufacturers, bottlers, cooperatives and recyclers – and the Government, and public awareness, have made the can recycling programme into a successful experience with great social, economic and environmental impact.
Figure 55:
Ratio of scrap recovered
and domestic consumption
(%) – 2009 (The Aluminium
Association www.abal.org.br).
[%]
Canada
France
China
UK
Italy
Spain
USA
Brazil
South Korea
Germany
Japan
0 10 20 30 40 50
World Average
Figure 56:
Recycling rates for beverage
cans (Sources: Brazilian
Aluminium Association,
ABAL, who collected data
from: Brazilian Association of
Highly Recyclable Cans, The Japan
Aluminium Can Recycling
Association, Camara
Argentina de la Industria
del Aluminio y Metales Afines, The Aluminium
Association, and European
Aluminium Association).
40
60
80
100
Japan
USA
EU
Brazil
Argentina
201120102009200820072006200520042003200220012000
Unit: %
Index of recycling aluminum cans (2000 – 2011)
140
Metal Recycling – Opportunities, Limits, Infrastructure
5.3.1.2 Collection of Consumer WasteManaging post-consumer waste faces dif-ferent kinds of challenges compared to the management of office or factory waste. Con-sumer behaviour plays a big part in collec-tion, for example, by separating waste into different streams, as long as they know the product differences. If, for instance, the con-sumer has no idea what is in different bat-teries and is not given clear guidance on the fact that there are different types, these can potentially all land in the same battery-re-cycling bin and create a metallurgical night-mare.
Educating and changing the behaviour of in-dividuals can thus lead to better recycling. One way is to encourage people to return their old products for recycling when they no longer need them. Currently, many consum-ers keep redundant products at home, or throw them into mixed waste. If more con-sumers would offer their mobile phones for recycling, the increase from the current 2000 tonnes/year towards the potential 80,000 tonnes/year (Hagelüken et al., 2009) would amply drive the recycling system.
Figure 57 summarizes the different features of consumer behaviour that affect recycling behaviour. The first ring around the consum-er describes the direct impact on the recy-cling decision, such as accessibility and atti-tude. The next layer shows ways for motivat-ing the recycling behaviour, like transparen-cy of the system or past experience, and the following ring presents the different ways of influencing recycling behaviour by market-ing and social media activities. The outer lay-er shows the future values and social trends that may affect the consumers' recycling be-haviour, communality and downshifting be-ing examples of those trends. As seen from the figure, many factors affect recycling be-haviour, from personal attitudes and experi-ences to the quality of the existing recycling systems.
The most important factors for enhanc-ing recycling behaviour are convenience and awareness of where and how to recycle. In-hibiting factors are an emotional attachment to the old products. Making the consumer aware of the opportunities of recycling, and changing his mindset and disposal habits are the true keys to any successful programme. Again, consumer education is of vital impor-tance.
Different cultures offer different opportuni-ties. Recycling is a global theme that needs local execution, appropriate to existing cul-tural norms. Different ways of communicat-ing, providing incentives and motivating con-sumers, are effective in different countries.

141
Metal Recycling – Opportunities, Limits, Infrastructure
Figure 57:
Features affecting
consumer recycling
behaviour (Mäkelä, 2011).
Box 15: Mobile-phone recycling in India and ChinaIn India, no recycling infrastructure (collection places or recycling companies) existed in 2008 for mobile phones. There was very low awareness of the benefits of phone recy-cling, the roles of the different stakeholders were not defined, and there was no regulatory framework.
Phone producer Nokia started a recycling programme, making it easy for consumers to recycle. The new phone collection infrastructure included recycling bins and information material for consumers, reverse logistics, an IT system, a recycling company that fulfilled corporate requirements, and training of employees. The programme was launched as a pilot in four cities, Bangalore, Delhi, Gurgaon and Ludhiana, for a 40-day period in 2009. A key challenge was overcoming the scepticism of trade partners and retailers, who believed that Indian consumers were not ready for recycling. A second phase expanded the pro-gramme to a further 28 cities. Marketing methods included billboards, radio and print me-dia, Bollywood celebrities, road shows and a commitment to plant a tree for every phone recycled.
During the first 2.5 years of the programme, more than 50 tonnes of old phones and ac-cessories were collected, with the collection increasing every year. Success depended on several factors, including the use of a very short and simple, emotional and social mes-sage to consumers about recycling, rather than a rational one (Singhal, 2010).
In China, operator China Mobile, Motorola and Nokia started a recycling programme in late 2005, with six other cell-phone manufactures joining the year after. The programme has grown every year, from 40 cities (1500 recycling points) to 300 cities. By late 2009, more than 150 tonnes of phones, batteries and chargers had been collected.

142
Metal Recycling – Opportunities, Limits, Infrastructure
5.3.1.3 Pre-processing expertiseRecycling operations are more effective where a good pre-sorting infrastructure ex-ists for scrap, with accurate scrap specifica-tions that are based on material composition. If some valuable metals slip into iron recy-cling, for example, they are lost in slag, flue dust and sludge. Such an infrastructure can be informal (Figure 58), or rely on technolo-gy. However, the separation will only optimize recycling of valuable metals when it takes the next stage of processing possibilities into ac-count.
5.3.2 Processing infrastructureNone of the processes used by industry for the primary production of Carrier (Base) Met-als can deal well with the many elements of man-made recyclates. Usually, the maximum that can be handled is around twenty met-als. The Metal Wheel illustrates how indus-try tends to operate on the basis of one Car-rier Metal process at a time, metallurgical infrastructure being built around the extrac-
tion of elements from geological minerals. It provides an overview of which elements each Carrier Metal process-and-infrastructure can deal with economically. Chapter 3 described how the recycling of complex waste streams requires integrated technologies for recover-ing a wide range of metals, especially where those metals are thermodynamically relat-ed. Those that are incompatible may go to streams where they are lost, mainly for eco-nomic reasons.
Figure 59 shows a complex flowsheet used for the optimized recycling of EoL products, illustrating that this requires an entire met-allurgical network. This must consider con-straints for technology, particle-size distribu-tion, breakage and connection, metals, alloys, compounds, and metallurgy (van Schaik and Reuter, 2004a; 2004b; 2007; 2010a; 2010b; van Schaik and Reuter, 2012; van Schaik, 2011). Therefore, a successful WEEE pro-cessing facility is based on technologies for two or more Carrier Metals, such as prac-ticed by the metallurgical recycling plants of Boliden, Umicore, DOWA, or Aurubis, all of which combine deep-rooted lead/zinc/copper primary-smelting expertise and the neces-sary infrastructure.
The ideal situation is a system that connects scrap to all Carrier (Base) Metal process-es, and that can be seen as the centre of the Metal Wheel. Scrap then flows, as deter-mined by thermodynamics and economics, into the appropriate Carrier Metal technolo-gies (Metal Wheel slices), with links between the technologies (or slices) for processing the residues from each technology. This ideal cannot be achieved with existing technology, but its conceptualization helps understanding the system required for recycling.
Figure 58:
Manual dismantling in the informal sector in
China.

143
Metal Recycling – Opportunities, Limits, Infrastructure
In addition, recycling operations of future products and material combinations will need the development of even more smelting competence in different Carrier Metals, mak-ing the right inter-linkages between process-es. This type of response to new products al-ready exists for some of the waste streams that recently have become valuable. For ex-ample, Umicore have developed a process for recycling rechargeable batteries, recovering nickel and cobalt. A rare earth oxides fraction can now be created and processed at Rhodia (Rhodia; Umicore, 2011; Eurometaux, 2010).
5.3.2.1 Depth of expertise in Carrier Metal processingDetailed techno-economic metallurgical know-how and recycling capability is most commonly found among primary-metals pro-ducers, partly because this is where they fo-cused efforts in the past, and partly because current economies of scale mean that much recycling occurs together with primary pro-duction. This means that one of the keys to successful recycling, anywhere, is access to and the maintaining of this core competence of primary metal production expertise.
By extrapolating past trends, we can pre-dict that future products will have a differ-ent composition from current products, and that new uses will be found for metals. This will lead to a surge in the use of certain valu-able elements that, with time, will arrive in the waste stream. However, it is hard to pre-dict which of these elements will arrive, and thus which types of metallurgical expertise will be most needed in future. Lessons might be learnt from the recent situation with REE, where much expertise was lost worldwide, holding back recycling. Once such metallur-gical know-how is lost within a sector or re-gion, it is usually very hard to recover it, so maintaining a broad infrastructure of exper-tise within industry may be prudent.
Figure 59:
Product-Centric recycling of
EoL goods with a networked structure of
technologies for dealing with the
various streams.This Figure shows
the complex network of
technologies that can be applied to
manage resource efficiency.
(van Schaik and Reuter, 2004a;
2004b; 2007; 2010a; 2010b;
van Schaik and Reuter, 2012;
van Schaik, 2011; Reuter et al., 2005; Reuter,
2009; Ignatenko et al., 2008).
Light
Heavy
Non-Chloride PlasticsNF Mix Plastics
Chloride Plastics
Ferrous Metals NF Metals Silica Fluff
Silica Ferrous MetalsPlastics
NF Mix Fluff
DustRubber Plastics Glass
NF Metals
Cars
Dismantled Cars
Non-Metals
Cu-RichNF Heavy NF Metals
LightZn-Rich
Heavy Light NF Metals
Non-MetalsWasteCu-Rich
NF Mix NF Metals Zn-RichMg-RichAl-Rich
Ferrous Metals
WasteHeavy NF Metals
Mg-RichLight NF Metals
Al-Rich
Mixer (Blending)
Shredding/ Air Suction
Magnetic Separation
Grinding/ Screening
Eddy Current/ Heavy Medium
Separation (HMS)
Air Separation
Eddy Current
Eddy Current
Density Separation
Color Sorting
Magnetic Separation
Eddy Current
China India
Others
Density Separation
HMS
Mixer (Blending)
Mixer (Blending)
Mixer (Blending)
Mixer (Blending)
Mixer (Blending)
Mixer (Blending)
Mixer (Blending)
Mixer (Blending)
Mixer (Blending)
Dismantling
Thermal Processing Cement Kiln
Plastics Concentrate
Waste to Landfill
Copper Production/ Recycling
Aluminium Recycling
Metallic Zinc Recycling
Waste to Incineration
Plant
Silica Concentrate
Steel Converting
Magnesium Recycling
EoL Goods e.g. Car, WEEE
Mechanical Sorting
Cast Aluminium
Alloy
Zinc Alloy
Magnesium Alloy
Copper Alloy
Steel Alloy
Flue Dust Slag
Building Material
Electrolytic Copper
Silicon Production
(Submerged arc)
Magnesium Electrolysis
Electrolytic Zinc
Aluminium Electrolysis
Pig Iron (Blast
Furnace)
HMS
Physical separation Blending Material Grade Calorific
value
Secondary metallurgy Thermal treatment (In-)organics processing
Landfill
Input
Primary Metallurgy
144
Metal Recycling – Opportunities, Limits, Infrastructure
5.3.2.2 Expertise in scarce/valuable/critical metals recycling A challenge for the recycling of complex mul-ti-material and simpler products is to ensure the existence of a Carrier Metallurgy infra-structure for separating the complex link-ages between commodity metals, valuable elements, plastics and other materials. This requires a keen understanding of the physics of separation and an ability to innovate and optimize. For example, indium and tin can appear as various different chemical species when processed from their oxides found in flat-panel TV screens, though the usual form is indium tin oxide, ITO. Their thermodynam-ic stability has a direct effect on their recov-ery and recycling rate. Understanding these thermodynamics within the technological and economic context determines how well indi-um and tin will be recovered in the appropri-ate phases for further processing.
To prepare the infrastructure for increased recycling means greater information ex-change within the metal industry, includ-ing the development of further Carrier Met-als knowledge. Usually, BAT operators do this very well, but the mainstream of indus-try still focuses its expertise on single Car-rier Metals. Such increased knowledge can come from process engineers (metallurgists, chemical engineers, etc.), who have sufficient understanding of different Carrier Metal pro-cesses to profit from each other’s more de-tailed expertise.
5.3.2.3 Increasing industrial expertise through educationThe expansion of recycling answers a chang-ing societal need, whereby the educational system can play an important role by adapt-ing to this need. Education is pivotal in pro-viding society with the skills and expertise to increase recycling. As an essential aspect of humankind's answer to the challenge of ma-terials and metals management, metal-recy-cling technology must be given greater prior-ity in the educational landscape. Engineering programmes in general and materials-engi-neering curricula in particular, may take the lead in addressing this challenge. Under the
umbrella of resource management, a cur-riculum of specialist courses can build the physics-based expertise that will drive in-novation in recycling. These efforts could be particularly successful where industry and government are involved as well.
Universities have the roles of being an educa-tor, knowledge keeper and knowledge seeker. In the area of sustainable metals manage-ment, a critical mass of universities has the opportunity of making the strategic choices for safeguarding knowledge and fostering in-novation in the field of process metallurgy. As an academic discipline, metallurgy has been in rapid decline in the OECD countries dur-ing the past decades, but is now in urgent demand for supporting the transition to sus-tainable metal production.
In addition, cooperation between metallurgy and other disciplines in science and tech-nology, including non-technical disciplines, would lead to an increase in the transverse skills needed for expanding recycling. Recy-cling multi-material recyclate sources is an area where the quintessential characteris-tics of the engineer as an innovative, ingen-ious thinker, who can conceptualize and op-timize a system as a whole, will be extremely valuable. Sustainable-metallurgy engineers of the 21st Century will use their knowledge of the importance of interconnections to help industry break out of its straightjacket. Today, talented students in OECD countries tend not to choose metallurgy, but they are needed for the challenges of recycling. Emphasizing the key role of recycling in the sustainability of our society, may be one way to attract young talent back into the field, which is pivotal to enabling sustainability. There are positive signs that this transition in education and re-search is happening. University programmes are embedding metallurgy in an industrial ecology framework. Intra- and inter-universi-ty consortia, some in cooperation with indus-try, are set up in the area of sustainable met-al production. Forward-thinking companies in the field of metal production invest in educa-tional programmes at all levels. These early signs of educational adaptation are promis-

145
Metal Recycling – Opportunities, Limits, Infrastructure
ing, but will need further amplification and acceleration.
5.4 The optimization toolbox
The potential recovery of materials from so-ciety is not fixed, but changes as a function of time, products, components, product mixture (input to recycling systems) and recycling routes. Wherever in the world recycling oc-curs, the infrastructures for all stages can be improved for achieving higher recycling rates.
Recycling takes place as a system. As each part of the system affects the success and vi-ability of the others, the limits of recycling performance depend on the optimization of each of these related factors, recycling being a truly complex multi-dimensional dynamic problem. Hereafter we discuss the physical and organizational infrastructure toolbox for optimizing recycling rates.
Maximizing resource efficiency requires a detailed understanding of the complete re-cycling chain, for recovering the maximum amount of metals in hydro- and pyro-metal-lurgical processing facilities. This is only pos-sible through a holistic systems approach, starting with product design and optimizing the technical and organizational set-up of dismantling, shredding and separation tech-nologies. Only then can the relevant material fractions be directed to the most appropriate metallurgical end-process. Figure 60 reflects this system, showing that any mismatch be-tween the different steps produces unwant-ed residues, losses and ultimately leads to a lower overall resource efficiency.
In summary, policy should stress the build-ing and maintenance of a suitable metallur-gical processing infrastructure and of well-channelled preliminary pathways, to ensure a maximum recovery of metals. See also Ap-pendix E: Models and Simulation in Recycling for more details on all of the above aspects.
Figure 60:
A key message concerning
Product-Centric recycling:
Product design must be linked
to liberation, separation
efficiency, and quality of both recyclate and of final output
streams, based on the
thermodynamic limits of recycling
(Reuter et al., 2005; Reuter
and van Schaik, 2008, 2012a&b; van Schaik and
Reuter, 2012).
Physical separation/sortingDismantling Shredding
Furnance smelting technology
Elements in WEEE recyclates
Various grades/qualities of recyclatesDesign determines connections
Imperfectseparation
Imperfectliberation
Recyclate 1 Recyclate 2 Recyclate 3
Mainly to offgas
Mainly to slag
Mainly to copper
Transition metals
Alkaline metals
Alkali metals
Basic metals
Rare earth metals
Mainly to slag
Mainly to gas phase/flue dust
Mainly to copper
Can report to metal, slag and flue dust as a function of operation

146
Metal Recycling – Opportunities, Limits, Infrastructure
5.4.1 Product design for resource efficiencyThe three steps of the recycling chain as shown in Figure 52 are a simplification. Re-cycling starts with collection, but product design determines the mineralogy of the re-cyclates and thus their economic value. The purity and constituency of the material enter-ing metallurgical processing determines re-cycling output. As sorting and pre-processing can only physically separate some elements and compounds, this purity depends on the design of waste products entering recycling. Figure 60 summarizes this for a Product-Centric recycling approach. Design for Re-source Efficiency refers to the design of the whole system linked to the product design ensuring that losses are minimized.
This means that designing products for bet-ter recycling can have a significantly posi-tive impact on recycling results. Designs can be improved when considering the complex physics of separating their metals and com-pounds, while recognizing that design for good functionality may still make liberation impossible. Where product design consid-ers this, it is called "Design for Recycling", or DfR.
If product design can keep thermodynami-cally compatible materials close together, then metallurgical technology can deal with them. For example, the recycling of printed circuit boards is often carried out with copper metallurgy. This means that silver and gold can be easily recycled, but aluminium will be lost. To reduce this loss, designers could avoid the presence of aluminium with cop-per, or could plan a design that facilitates the removal of aluminium during pre-processing. For example, heat dissipaters are often made of aluminium and could be designed for easy manual extraction. This is called "Design for Disassembly". For other parts containing precious materials, the recovery ratio during dismantling or sorting could be increased by visually identifying such components.
It is not easy to make a LED, fluorescent lamp, car, electronic product, etc., any sim-
pler, as the metals in close proximity create their functionality. This will always be at the heart of product design, but designers often have some leeway in the choice or arrange-ment of materials. Continuous innovation in materials can aim at delivering similar func-tionality with other, thermodynamically com-patible, materials. In short, it is a truly com-plex challenge to design products for opti-mal recycling. However, what is good for DfR could, and most likely will, defeat functional-ity, especially that of a complex product.
Design for Recycling thus needs a support-ive infrastructure. Fortunately, the tools now exist that provide designers with the infor-mation they need about recycling outcomes from different designs (see Chapter 6). These are based on the opportunities and limita-tions shown by the Metal Wheel, and allow the assessment of different designs. Where these are widely known and used, recycling outcomes can be improved. The other part of a supportive infrastructure for Design for Re-source Efficiency is the creation of an eco-nomic or policy framework that motivates de-signers to consider recycling. This might be the case where consumers reward good de-sign by preferring products they know to have high standards. More commonly, public pol-icy can require, or influence, product manu-facturers to take recycling into account, thus encouraging material innovation without con-straining functionality.
Another aspect of design for recycling re-lates to supporting markets for recycled met-al products. When recycling produces met-als, or other compounds, that have the same purity (or grade) as primary metal, they can easily be sold at equivalent prices. This ap-plies in most cases where state-of-the-art processes are used. Where recycling pro-duces metal with impurities, this might fail to find markets, even when it has the physical or chemical properties needed for use in spe-cific products. Manufacturers may not choose to use such recycled metals, either because they do not know the precise mix of elements and compounds on offer, or because they are unsure of the quality or consistency of the re-
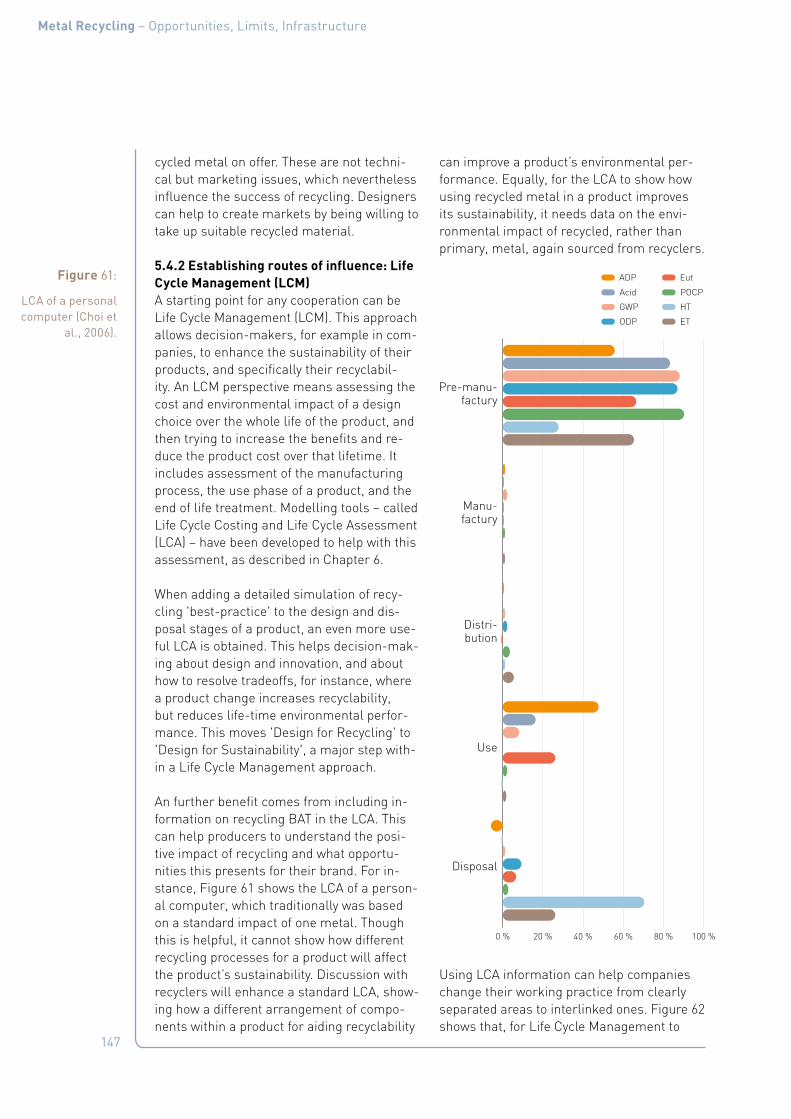
147
Metal Recycling – Opportunities, Limits, Infrastructure
cycled metal on offer. These are not techni-cal but marketing issues, which nevertheless influence the success of recycling. Designers can help to create markets by being willing to take up suitable recycled material.
5.4.2 Establishing routes of influence: Life Cycle Management (LCM)A starting point for any cooperation can be Life Cycle Management (LCM). This approach allows decision-makers, for example in com-panies, to enhance the sustainability of their products, and specifically their recyclabil-ity. An LCM perspective means assessing the cost and environmental impact of a design choice over the whole life of the product, and then trying to increase the benefits and re-duce the product cost over that lifetime. It includes assessment of the manufacturing process, the use phase of a product, and the end of life treatment. Modelling tools – called Life Cycle Costing and Life Cycle Assessment (LCA) – have been developed to help with this assessment, as described in Chapter 6.
When adding a detailed simulation of recy-cling 'best-practice' to the design and dis-posal stages of a product, an even more use-ful LCA is obtained. This helps decision-mak-ing about design and innovation, and about how to resolve tradeoffs, for instance, where a product change increases recyclability, but reduces life-time environmental perfor-mance. This moves 'Design for Recycling' to 'Design for Sustainability', a major step with-in a Life Cycle Management approach.
An further benefit comes from including in-formation on recycling BAT in the LCA. This can help producers to understand the posi-tive impact of recycling and what opportu-nities this presents for their brand. For in-stance, Figure 61 shows the LCA of a person-al computer, which traditionally was based on a standard impact of one metal. Though this is helpful, it cannot show how different recycling processes for a product will affect the product’s sustainability. Discussion with recyclers will enhance a standard LCA, show-ing how a different arrangement of compo-nents within a product for aiding recyclability
can improve a product’s environmental per-formance. Equally, for the LCA to show how using recycled metal in a product improves its sustainability, it needs data on the envi-ronmental impact of recycled, rather than primary, metal, again sourced from recyclers.
Using LCA information can help companies change their working practice from clearly separated areas to interlinked ones. Figure 62 shows that, for Life Cycle Management to
0 % 20 % 40 % 60 % 80 % 100 %
ODP
GWP
Acid
ADP
Pre-manu-factury
Manu-factury
Distri-bution
Use
Disposal
ET
HT
POCP
EutFigure 61:
LCA of a personal computer (Choi et
al., 2006).

148
Metal Recycling – Opportunities, Limits, Infrastructure
be successful for companies, different de-partments need to work closely together for considering the sustainability aspects (UNEP, 2007a). For example, product designers ben-efit from cooperating with engineers, to en-sure that the design is compatible with the metallurgy they seek to apply.
Figure 62:
All functions in a company play
an important role in Life Cycle
Management (adapted from UNEP, 2007a).
Management
Life-cycle-basedenvironmental policyand product strategy
Design for theenvironment
Greendistribution
Greenprocurement
Greenmarketing
Life-cyclemanagement
Cleaner production
Production
Distribution
Procurement Sales andmarketing
Product developement
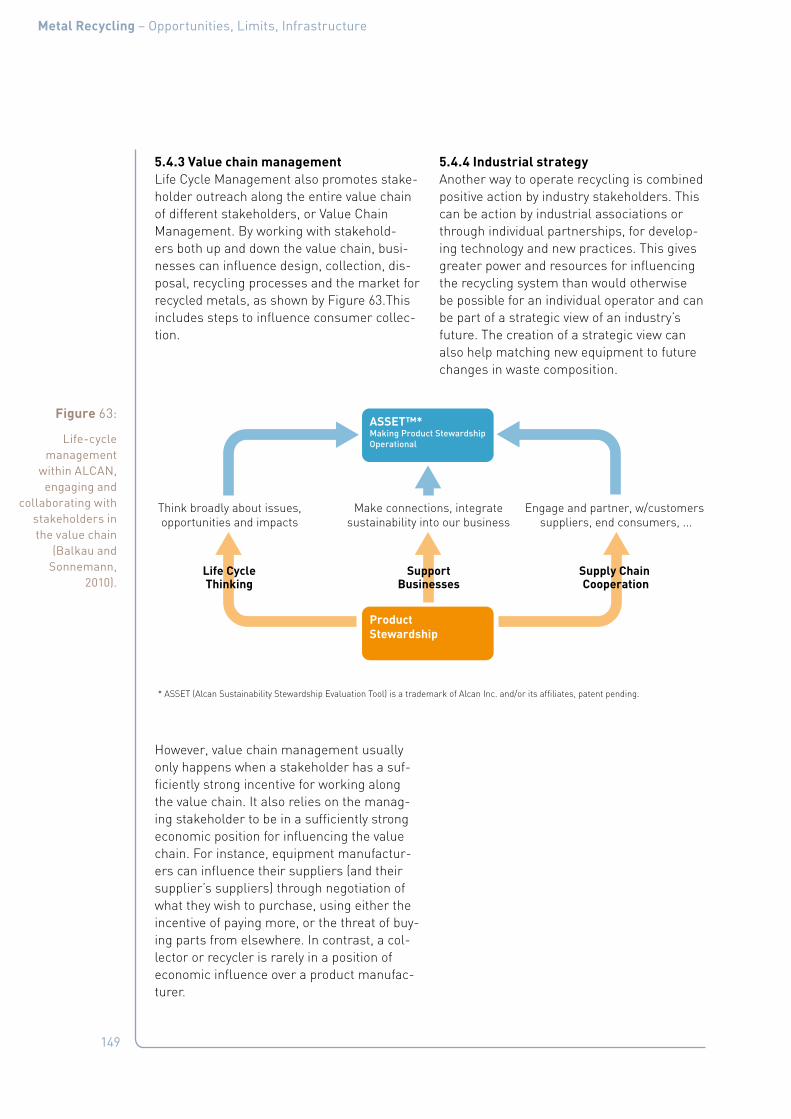
149
Metal Recycling – Opportunities, Limits, Infrastructure
5.4.3 Value chain managementLife Cycle Management also promotes stake-holder outreach along the entire value chain of different stakeholders, or Value Chain Management. By working with stakehold-ers both up and down the value chain, busi-nesses can influence design, collection, dis-posal, recycling processes and the market for recycled metals, as shown by Figure 63.This includes steps to influence consumer collec-tion.
However, value chain management usually only happens when a stakeholder has a suf-ficiently strong incentive for working along the value chain. It also relies on the manag-ing stakeholder to be in a sufficiently strong economic position for influencing the value chain. For instance, equipment manufactur-ers can influence their suppliers (and their supplier’s suppliers) through negotiation of what they wish to purchase, using either the incentive of paying more, or the threat of buy-ing parts from elsewhere. In contrast, a col-lector or recycler is rarely in a position of economic influence over a product manufac-turer.
5.4.4 Industrial strategyAnother way to operate recycling is combined positive action by industry stakeholders. This can be action by industrial associations or through individual partnerships, for develop-ing technology and new practices. This gives greater power and resources for influencing the recycling system than would otherwise be possible for an individual operator and can be part of a strategic view of an industry’s future. The creation of a strategic view can also help matching new equipment to future changes in waste composition.
Figure 63:
Life-cycle management
within ALCAN, engaging and
collaborating with stakeholders in the value chain
(Balkau and Sonnemann,
2010).
Think broadly about issues,opportunities and impacts
Make connections, integratesustainability into our business
Engage and partner, w/customers,suppliers, end consumers, ...
ProductStewardship
ASSET™*Making Product Stewardship Operational
* ASSET (Alcan Sustainability Stewardship Evaluation Tool) is a trademark of Alcan Inc. and/or its affiliates, patent pending.
SupportBusinesses
Supply Chain Cooperation
Life CycleThinking

150
Metal Recycling – Opportunities, Limits, Infrastructure
5.4.5 Summary: tools and modelsIn summary, a whole set of tools is available to help decision-makers understand the re-cycling system, assess how they can best in-crease recycling, and facilitate the informa-tion exchange between stakeholders. The Life Cycle Assessment tool is one example. Each of these tools provides an easy way for deci-sion-makers to access the detailed informa-tion usually held by industry-sector experts.
Such tools enable decision-makers in one part of the recycling system (for example, de-signers or metal processors) to arrive at a better prediction of the likely final results of
the system of any changes that they would make, such as investments in new technol-ogy.
A final observation: true Design for Recycling can only take place with tools that are based on a rigorous application of physics, thermo-dynamics and process technology, as reflect-ed by, for example, Figure 5.
Box 16: Steps by the aluminium industry for recycling non-ferrous materials from Municipal Solid Waste (MSW)The aluminium industry, acting together, could increase recycling from MSW through:
■ Disseminating technical information on improved technologies and process flow-charts within the industry sector, which, due to its fragmented nature, might not be fully aware of this potential.
■ Encouraging use of de-metallized recycled bottom ash as a raw material for road con-struction, cement making, etc. Today, standards and/or specifications differ strongly be-tween countries and even cities. One way to open up new markets is to achieve greater harmonization in these standards for creating larger international markets.
■ Developing and promoting sampling and testing methods for untreated bottom ash from Waste-to-Energy plants and bottom-ash processors. This will clarify the benefits of non-ferrous metals extraction and/or of optimizing the whole plant.
■ Contributing to a coherent development of the statistical data needed for monitoring progress in non-ferrous metals extraction.
■ Cooperating with incineration associations, sorting-equipment manufacturers, and Waste-to-Energy engineering companies, for developing and disseminating best-availa-ble technology and practice.
■ Contributing to reducing aluminium feed into MSW. Bottom-ash processing certainly can be improved, but should remain a "scavenger process". The primary target should be to keep aluminium out of MSW streams, and to separate these beforehand for direct treatment by Al smelters (optimization within a wider system boundary).
151
Metal Recycling – Opportunities, Limits, Infrastructure
6. Tools to Aid Decision Making
Chapter 6 provides an outline of some of the best tools for helping decision-making in the recycling field. These include the Met-al-Wheel, Grade Curves, Liberation Perfor-mance modelling, Systems Engineering mod-elling, Economic Outcomes modelling, De-sign for Resource Efficiency modelling, Life Cycle Assessment modelling, and Design for Sustainability modelling. These models con-dense and describe technical and scientific information, providing user-friendly predic-tions of results. This helps recycling stake-holders in visualizing the complex aspects of recycling on a technical and economic basis, and to translate the results into simple facts, as well as helping industry and policy-mak-ers to improve the recycling system.
Finding ways for optimizing recycling as a system is much easier with the develop-ment of several specific tools, as discussed in Chapter 5, some of which help in under-standing the thermodynamic drivers of recy-cling. Detailed models provide specific esti-mates of how changes in design, collection or processing, will alter economic and environ-mental recycling results.
6.1 Tools that help conceptualizing results on a physics basis
6.1.1 The Metal Wheel – An overview toolThe Metal Wheel (Figure 15) is based on the economic recovery and recycling capabil-ity of elements from hydro- and pyro-metal-lurgical processing. It visualizes current BAT for metallurgical processes (implicitly cover-ing thermodynamics and physics), showing how different metals can be dealt with within technologies that were developed for the pri-mary production of Carrier Metals, but which, when economically viable, can also separate complex modern waste materials into met-als, alloys and compounds.
It also shows where innovation can improve current technology, identifying which metals cannot be dealt with in a Carrier Metal pro-cess and will be lost to the environment (the green, outside, band of the Wheel). Innovation can lead to recycling more of the metals by minimizing such losses. The understanding reflected in the Metal Wheel forms the basis for all the tools described hereafter. However, there are also some very useful "niche" tech-nologies, e. g. for de-coating galvanized steel, producing high-grade zinc powder that can be directly reused for galvanizing.
6.1.2 The Element Radarchart – A reactor specific toolThermodynamics can assist in product de-sign, by showing which metals can be met-allurgically removed when found together in complex input or scrap. The "element radar chart" indicates how metals are separated in different Carrier Metal processes (Naka-jima et al., 2009; 2011; Hiraki et al., 2011). It shows how metals and their compounds split between metal, slag and flue dust, and thus whether they can be recovered by that pro-cess, or will serve as useful alloys of the Car-rier Metal. It also shows that removing impu-rities and extracting valuable metals is much more difficult for aluminium and magnesium than for the other metals on the chart, and can help decision makers in choosing the re-cycling products and identfying the probable outcome.
6.1.3 Grade curves – physics of separation toolThe use of grade curves is straightforward. They clearly show the tradeoffs between puri-ty of the metal obtained (‘Grade’) and its rate of recovery as a percentage of the maximum potential stream from a mixed metal input (Figure 35 and Figure 36). However, it is dif-ficult to obtain a grade curve of statistically acceptable quality, with the data coming from

152
Metal Recycling – Opportunities, Limits, Infrastructure
separation tests or sampling on mechanical separators. The curve represents the theo-retical value obtainable, but real mechanical separators are less efficient and efficiency further changes with time, feed grade, wear-and-tear of separators and with different plant settings.
Figure 64:
Element radar chart for
metallurgical processing of
selected metals, showing element
distribution in metal, slag,
and gas phases based on
thermodynamic analysis and
metallurgical data of specific
single reactors. (Nakajima et al.,
2008; 2009; 2011; Nakamura and
Nakajima, 2005; Nakamura et
al., 2007). The copper Peirce
Smith converter of Figure 44
represents the Cu (Converter) segment here.
Recoverable element(as pure metal)
Alloying element
Deoxidation agents
to Metal phase
to Slag phase
to Gas phase
Elements that have distributed among the metal phase as a solid or liquid metal
Elements that have distributed among the slag phase as oxide
Elements that have evaporated and distributed among the gas phase
Figure B3
Sr
Ta Nb
V
Ag
Sn
Cr Zr
B
U Mn
Cu
Si
Co Ni W Mo
Ti Fe
Pb
Zn
Mg Ca
La Ce Al
Fe (BOF,EAF)
Bi
Hg
Mg
Te Cd
Pb Zn
Au
Pt Rh Pd
Ag
Sn
Al Cr
Ga Ge In Mn
Se
Cu
Re
Ni
B
Sb
Fe
Sr
W
Cu (Converter)
Au
Pt Ir Ta
W Mo
Nb Zr Y U Ce V B
Co Ni
Pd Fe Ti
Gd Ho
Si Dy Cr Ge Cu
Sn Mn As
Ag Ga
Sb In
Bi Pb Li Sr
Hg Cd Zn
Mg
Ca Al
Be
Yb
La
Al (Remel5ng)
Au
Pt
Pd
Ag
Sn
Bi
Hg
Al
Cr
Ga In Mn Mg
Cu
Ni
W
Fe
Pb
Zn
Zn&Pb (ISP)
Au
Pt
Pd
Ag Sn Bi
Hg
Al
Cr Ga
In
Mn
Mg
Cu Ni W Fe
Pb
Zn
Pb (Blast furnace)
Ca Al
Zr
Mn
Bi
Si
Ni
Ge
La Ce
Zn Sr
Na Mg
Li
Fe
Sn
Cu
Sb
Ag
Y Gd
Yb
Hg
Tl
Pu to Metal phase
to Slag phase
to Gas phase
Elements that have distributed among the metal phase as a solid or liquid metal
Elements that have distributed among the slag phase as oxide
Elements that have evaporated and distributed among the gas phase .
Recoverable element (as pure metal) Alloying element
DeoxidaPon agents
Mg (Remel5ng)

153
Metal Recycling – Opportunities, Limits, Infrastructure
6.2 Advanced modelling and process simulation tools
Highly developed modelling tools provide detailed calculations based on BAT phys-ics and thermodynamics. These are used in flowsheet design and simulation software for determining the optimal combination and ar-rangement of recycling processes, and in-clude the following aspects:
■ Liberation designs of complex products.
■ Separation physics, including automated sorting technology.
■ Chemistry and thermodynamics of metal production and recycling systems.
■ Physical and chemical recyclate and re-cycling-product quality, as a function of product-design choices and the calorific values of (intermediate) recycling streams.
■ Losses and emissions to water, air, resi-dues, slags, etc.
■ Optimization and selection of plant- and flowsheet architecture with changing prod-uct design (see flowsheet for all processes in Figure 59).
■ Predictions of composition and volume of future recycling streams.
■ Economic Outcomes.
These engineering- and industry-friend-ly simulation models define and provide the essential metrics for measuring, control-ling and improving recycling. They also help determining recycling concepts as well as facilitating product design for high recy-cling and energy-recovery rates while advis-ing policy makers. The distinguishing factor of these ‘multi-level models’ is their basis on the physics behind recycling systems. Reuter (2011a) discussed several of these commer-cially available tools.
Box 17: Available tools for constructing multi-level recycling modelsReuter (2011a) listed several models that can be used for simulating recycling process-es and their outcomes, all of which are well known and freely available. They include AS-PEN (1994 – 2013), HSC Sim (HSC Chemistry 7, 1974 – 2011, Figure 5) and several others that can be found in the publications by Mellor et al. (2002), Geldermann et al. (2006), and Basson and Petrie (2007). In addition, we should note Green Chemistry and Engineering software (Anastas and Breen, 1997; García-Serna et al., 2007; Manley, 2008), while mul-ti-level simulation for industrial ecological systems was described for metal systems in 1999 (Reuter et al., 2011b). These software packages can also be linked to environmen-tal assessment work, as in LCA tools (HSC and GaBi 4&5, 1989 – 2009, Figure 5; IChemE, 2001; Dewulf et al. 2010; Jeswani, 2010; Reuter, 2011a). Nakamura and Kondo (2002, 2006) developed a hybrid type LCA tool called Waste Input–Output, WIO, that includes costs, for evaluating the environmental performance of systems.
154
Metal Recycling – Opportunities, Limits, Infrastructure
Such multi-level dynamic-simulation mod-els reproduce recycling rates quite accurate-ly as they consider all metallurgical interac-tions, as suggested by a Product-Centric view of recycling. Appendix E: Models and Simula-tion in Recycling provides a more in depth de-scription of the application of some of these models.
In addition, advanced tools such as com-putational fluid dynamics (Figure 138, Sec-tion 13.11, Appendix F: Physics of Extractive Mettallurgy) and similar tools help optimiz-ing processes within reactors to improve re-source efficiency.
6.2.1 Liberation performanceEven in the field of classic mineral process-ing, it is difficult to model the liberation of multi-component materials (WEEE prod-ucts). The breakage and liberation behaviour of consumer products fundamentally dif-fers from that of natural ores (Richard et al., 2005), indicating that a different approach is required for predicting the liberation behav-iour – and hence recyclate quality – of con-sumer products (van Schaik and Reuter, 2004a; 2007; van Schaik and Reuter, 2012). In addition, the dispersion of critical, scarce and/or toxic elements over the various out-put streams, caused by imperfect liberation, separation and design choices, drives the need for improvements in recycling-system performance and for closing material loops. The complex and unusual mix of material properties in many modern products requires some heuristic rules in support of the model-ling of liberation behaviour, and for predicting the particle and recyclate composition after shredding. Based on such derived heuristics, trained fuzzy sets can capture these aspects (van Schaik and Reuter, 2010a; 2007), linking product-design characteristics and liberation behaviour in terms of:
■ Design tables (input definitions for recy-cling) that define the mass and materi-al connections derived from the design in real-time.
■ Shredder-connection tables (Figure 31) that define the remaining connections of the design after shredding and modelling particle composition after shredding.
■ Shredder-liberation tables that define the degree of liberation for the different mate-rials and connections as a function of joint type and shredding intensity.
This can predict the distributed and time-changing recycling and recovery rates for the materials in the product, and the particulate properties, particle-size distributions and re-cyclate qualities.
In summary, complex particulate recycling systems, as governed by product design, are described on a physics basis that enables practical calibration of the parameters. This highlights the influence of design on recy-clate quality, and on recovery and/or loss of materials. This highly detailed approach is critical for pinpointing design deficiencies and possibilities related to recycling perfor-mance (both sorting and metallurgical recov-ery), to improve resource recovery from prod-ucts such as e-waste.
6.2.2 Modelling on based on the physics of processing systems – system engineeringLiberation models can be linked to modelling the thermodynamics of processing systems. For more precision, rigorous metallurgical-process flowsheeting can be linked to envi-ronmental software for producing a specific BAT for metal production, rather than relying on the usual averages from LCA software.
This enables calculating and predicting the dynamically changing recycling and recovery rates of complex waste streams or individual products. These can cover all individual ma-terials in such products for different recycling scenarios and objectives, such as maximum total recycling/recovery, maximum recycling of metals, minimum waste production, legis-lative constraints, etc., as a function of input. In turn, this allows:

155
Metal Recycling – Opportunities, Limits, Infrastructure
■ Predicting the grade of all (intermediate) recycling streams (e. g. iron recyclate, cop-per recyclate, plastic recyclate, etc.) and recycling products (metal, matte, speiss, slag, flue dust, off gas) (see Figure 60, 5.4).
■ Predicting the dispersion, occurrence and appearance (chemical phase) of possible toxic and harmful elements in recycling products.
■ Defining the best recycling concept for multi-material designs, such as the SLC concept (recycling plant and flowsheet configurations) for optimal recycling re-sults and/or minimal material losses.
6.3 Modelling of economic outcomes
Liberation modelling, when coupled with modelling of the thermodynamics of a specif-ic processing plant, allows defining recyclate grades and thus the resulting economic val-ue. This gives depth to feasibility studies for building multi-million-dollar plants and sys-tems, providing insight into their opportuni-ties and limits. It also shows when recyclates have sufficient quality to warrant economi-cally viable recycling, or which recyclates turn into waste because of insufficient eco-nomic value, and thus where legislation may have to step in. The models’ predictive nature also permits analysis of complete systems and products for establishing future systems requirements.
6.3.1 Prediction of valuable metals in scrap streamsModels of product sales, use characteristics, disposal, and collection behaviour can also estimate future composition (not grade!) and volumes of waste streams that will be avail-able for recycling, also known as “Mass Flow Analysis” models (MFA). For example, MFA models can reasonable reflect copper flow as discussed by Ruhrberg (2006), due the rela-tive large fraction of relatively pure scrap, but they cannot predict the complex grade of un-liberated and liberated scrap mixtures, the word “prediction” usually being reserved for models that are based on physics.
The "Lifetime Approach" predicts an in-use copper reservoir for Western Europe of about 78 million tonnes of metal and alloys. For 1999, the estimated copper scrap availabil-ity and old scrap recovery amounted to about 2.7 million tonnes and 1.6 million tonnes of copper and alloys, respectively. The corre-sponding recycling efficiency rate for end-of-life copper and alloys in 1999, excluding outflow to other metal loops, was estimated to be 63 % for the EoL approach, 64 % for the lifetime approach, 67 % for the scrap-balance approach, 69 %, 70 %, and 73 %, respectively, including all identified outflows to other met-al-recycling loops.
The recycled content of products and the quality-constrained availability of materials are subjects of great importance for sustain-able metal management. Nakamura and Na-kajima (2005) and Nakamura at al. (2007) de-veloped a novel MFA tool (WIO-MFA) that al-lows estimating the material composition of a product using information about the fabri-cation of materials and the inter-sector flow of goods and services provided by a high-res-olution input-output table. For instance, the WIO-MFA tool enables estimating the recy-cled content of final products such as cars, appliances, or buildings, for whatever materi-als are of interest.
6.3.2 Environmental performanceThe quality predictions from recycling-system models also provide the basis for:
■ Scientific estimates of the toxicity (and possibly related environmental costs) of each recyclate stream, based on the com-bination of materials in each particle.
■ Assessment of the potential use of slag and/or of the need for its further treatment.
■ Assessment of the toxicity of output streams, such as leaching behaviour and/or land-fill costs.
The amount of fossil fuels used also deter-mines the environmental impact of any recy-

156
Metal Recycling – Opportunities, Limits, Infrastructure
cling system. The same applies to any metal-production facility, as each has its own tech-nology. Where impact studies of metal use in many cases are based on average environ-mental data, a BAT life-cycle inventory (LCI) database of different technologies should be available. New technology increasingly re-places old one, as the metallurgical and recy-cling industry constantly reduces its footprint.
6.3.3 Integrating water and metals recyclingA very important environmental problem is the potential link between water pollu-tion and mineral/recyclate processing. Be-cause of poor water (quality) management, many metals and their compounds find their way into sludges, precipitates, etc. Figure 65 schematically shows this link between wa-
ter-treatment residues and the metallurgi-cal infrastructure, as a multi-level-system optimization model describing a particular area of water, here the water south of Rot-terdam harbour. By considering the metal/compound-processing and water-treatment/recycling infrastructures together, complex problems can be investigated. This provides sufficient technical detail for improving the system, as well as pinpointing which metals originate where, and what are the technologi-cal and policy solutions for maintaining water quality.
Understanding and predicting the recycling residues (the metals going to the green band of the Metal-Wheel) makes it possible to link them to water models, especially for predict-ing changes in water quality. Since physics-based models can predict the phases and compounds in the residues, leaching models can be calibrated for estimating how much of the metals will actually flow into the environ-ment.
Box 18: Physics-based simulatorsEnvironmental performance can be visualized with state-of-the-art process simulators, linking them in real-time to environmental impact software for flowsheeting, simulation and thermodynamic modelling, such as Linking HSC Sim (HSC Chemistry 7, 1974 – 2011), or Outotec with the GaBi LCA tool for benchmarking process designs (GaBi 4, 1989 – 2009; PE-International). Not only does this approach show the difference between BAT and non-BAT operators, but it also links GaBi to HSC Sim for 25,000 compounds in the database. This gives a more accurate view of which compounds occur in the system, and better eval-uates the quality and toxicology of most metal compounds in the system streams.
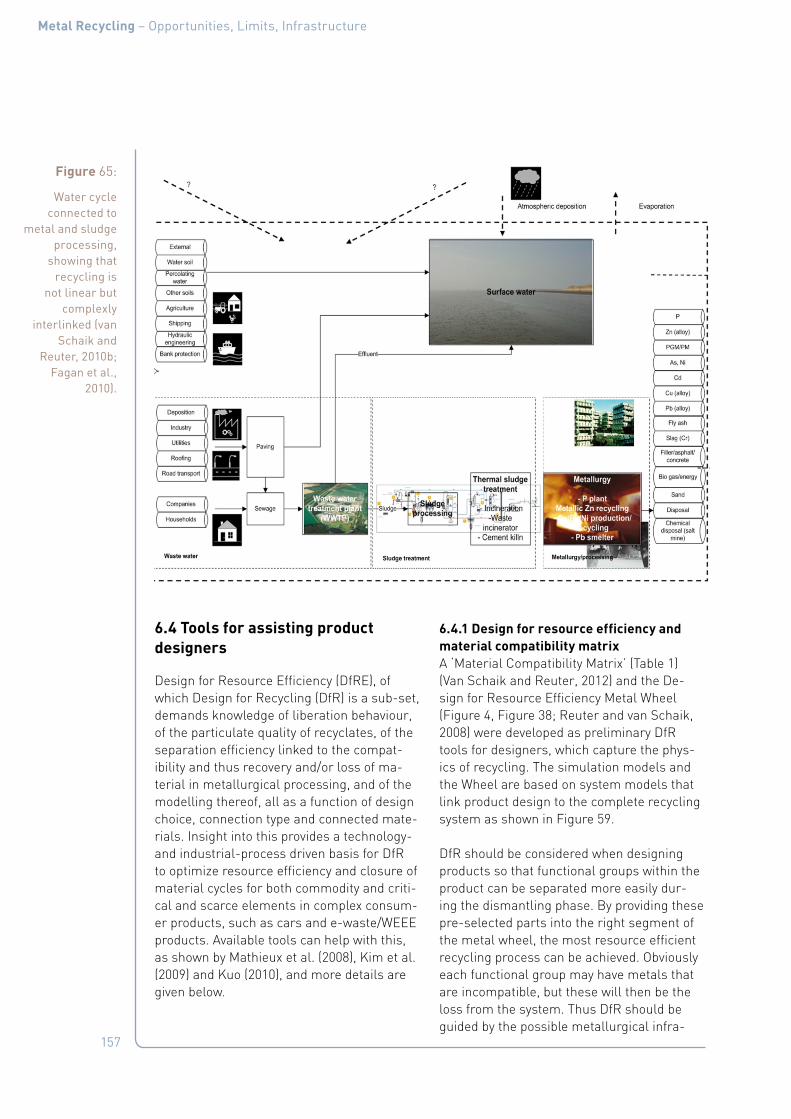
157
Metal Recycling – Opportunities, Limits, Infrastructure
6.4 Tools for assisting product designers
Design for Resource Efficiency (DfRE), of which Design for Recycling (DfR) is a sub-set, demands knowledge of liberation behaviour, of the particulate quality of recyclates, of the separation efficiency linked to the compat-ibility and thus recovery and/or loss of ma-terial in metallurgical processing, and of the modelling thereof, all as a function of design choice, connection type and connected mate-rials. Insight into this provides a technology- and industrial-process driven basis for DfR to optimize resource efficiency and closure of material cycles for both commodity and criti-cal and scarce elements in complex consum-er products, such as cars and e-waste/WEEE products. Available tools can help with this, as shown by Mathieux et al. (2008), Kim et al. (2009) and Kuo (2010), and more details are given below.
6.4.1 Design for resource efficiency and material compatibility matrixA ‘Material Compatibility Matrix’ (Table 1) (Van Schaik and Reuter, 2012) and the De-sign for Resource Efficiency Metal Wheel (Figure 4, Figure 38; Reuter and van Schaik, 2008) were developed as preliminary DfR tools for designers, which capture the phys-ics of recycling. The simulation models and the Wheel are based on system models that link product design to the complete recycling system as shown in Figure 59.
DfR should be considered when designing products so that functional groups within the product can be separated more easily dur-ing the dismantling phase. By providing these pre-selected parts into the right segment of the metal wheel, the most resource efficient recycling process can be achieved. Obviously each functional group may have metals that are incompatible, but these will then be the loss from the system. Thus DfR should be guided by the possible metallurgical infra-
Figure 65:
Water cycle connected to
metal and sludge processing,
showing that recycling is
not linear but complexly
interlinked (van Schaik and
Reuter, 2010b; Fagan et al.,
2010).
Web of Materials/Metals – Web of Water

158
Metal Recycling – Opportunities, Limits, Infrastructure
structure that can recover metals economi-cally.
Table 21 shows a DfR compatibility matrix for various materials in a car, including critical, scarce and valuable elements. This shows how recycling factors for various combined materials may be limited, based on libera-tion, sorting and thermodynamics. It indi-cates the possibilities and limits of the recov-ery of (critical) materials by pinpointing the (in)compatibility of different materials on the basis of metallurgical recovery.
6.4.2 Modelling the results of changes in product design The multi-level modelling of recycling out-comes described above can be linked to Computer Aided Design (CAD) packages, pro-viding designers with all the predictive power they need for designing products with optimal Life Cycle costs and minimal environmental impact. A collaborative-design platform us-ing CAD collects all data, enterprise resource planning, and product life-cycle management systems.
Table 21:
Compatibility matrix for
materials in a car, showing
compatible and incompatible
metals in terms of recovery
(Castro et al., 2004, 2005;
Reuter et al., 2005).
Car components (kg) Industrial streams (metals)
13 520 5.5 2 90 10 0.1 27 0.8 30 1.4 93 7.7 6.5 28 25 5 Input streams
Aluminium (cast)
Aluminium (wrought)
Copper alloys
Lead alloys
Magnesium alloys
Pt-family alloys
Stainless steels
Steel + Cast Iron
Zinc alloys
Glass
Elastomers
Natural Fibers
Natural Rubber
Porcelain
Thermosets
Thermoplastics
Minor component (kg)
Major component (kg)
0 – MUST separate, avoid mixing
1 – SHOULD separate, problems can occur
2 – DON’T separate, good combination
batt
ery
body
bum
per
elec
tron
ics
engi
ne
exha
ust
fuel
tank
gear
box
grill
e
whe
els
light
s
othe
rs
rubb
ers
seat
s
tires
win
dow
s
wir
ing
Alum
iniu
m (c
ast)
Alum
iniu
m (w
roug
ht)
Cop
per
Lead
Mag
nesi
um
Pt-
fam
ily a
lloys
Stai
nles
s st
eels
Stee
l + C
ast I
ron
Zinc
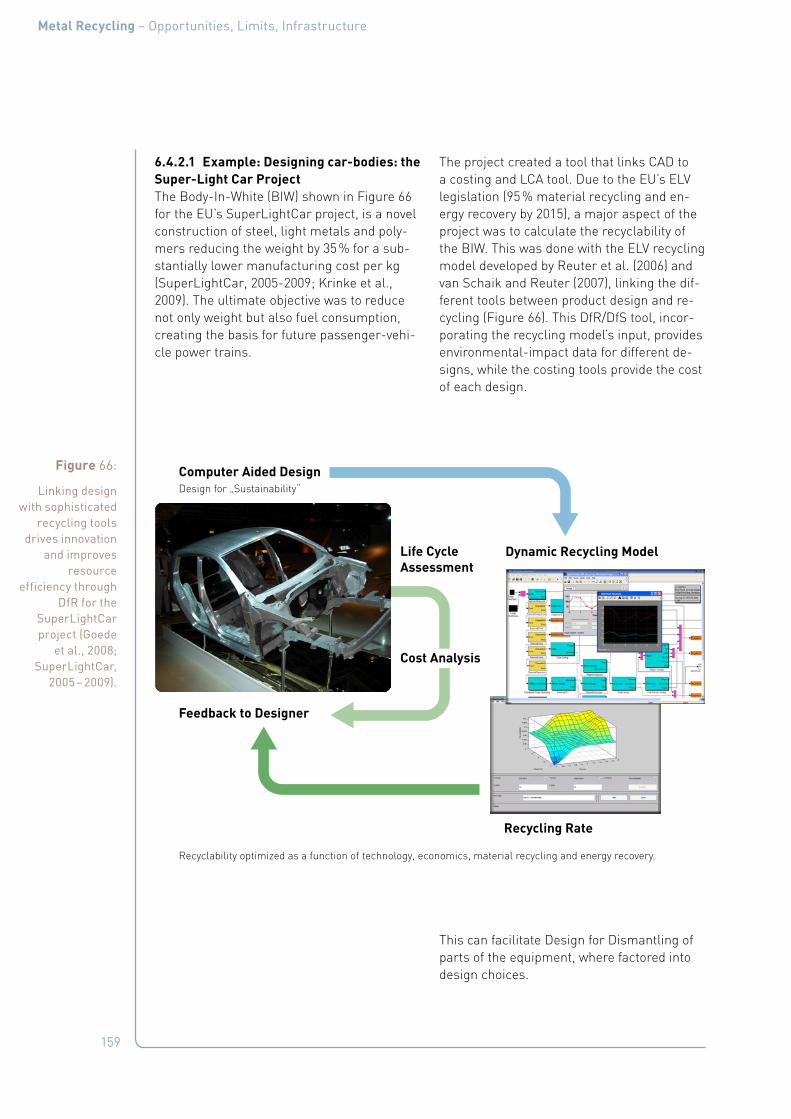
159
Metal Recycling – Opportunities, Limits, Infrastructure
6.4.2.1 Example: Designing car-bodies: the Super-Light Car ProjectThe Body-In-White (BIW) shown in Figure 66 for the EU’s SuperLightCar project, is a novel construction of steel, light metals and poly-mers reducing the weight by 35 % for a sub-stantially lower manufacturing cost per kg (SuperLightCar, 2005-2009; Krinke et al., 2009). The ultimate objective was to reduce not only weight but also fuel consumption, creating the basis for future passenger-vehi-cle power trains.
The project created a tool that links CAD to a costing and LCA tool. Due to the EU’s ELV legislation (95 % material recycling and en-ergy recovery by 2015), a major aspect of the project was to calculate the recyclability of the BIW. This was done with the ELV recycling model developed by Reuter et al. (2006) and van Schaik and Reuter (2007), linking the dif-ferent tools between product design and re-cycling (Figure 66). This DfR/DfS tool, incor-porating the recycling model’s input, provides environmental-impact data for different de-signs, while the costing tools provide the cost of each design.
This can facilitate Design for Dismantling of parts of the equipment, where factored into design choices.
Figure 66:
Linking design with sophisticated
recycling tools drives innovation
and improves resource
efficiency through DfR for the
SuperLightCar project (Goede
et al., 2008; SuperLightCar,
2005 – 2009).
Computer Aided DesignDesign for „Sustainability“
Recyclability optimized as a function of technology, economics, material recycling and energy recovery.
Feedback to Designer
Life CycleAssessment
Dynamic Recycling Model
Recycling Rate
Cost Analysis

160
Metal Recycling – Opportunities, Limits, Infrastructure
6.4.3 Life Cycle Assessment (LCA)Life Cycle Assessment or LCA (Rebitzer, 2004; UNEP, 2010) is a tool that facilitates understanding and quantification of the eco-logical and human-health impacts of a prod-uct or system over its complete life cycle. We identify the following steps:
■ Compilation of an inventory of relevant in-puts and outputs of a defined system.
■ Evaluation of the environmental impact as-sociated with these inputs and outputs.
■ Interpretation of the results of inventory analysis and impact assessment based on the set goals.
,
Box 19: The SuperLight CarThe SuperLight Car project provides an example of using LCA. Through application of the data shown in Figure 67, we can calculate the environmental footprint of the SuperLight Car design and the materials used in the concept body-in-white (BIW) as summarized by the right of Figure 67. The LCA modelling showed the SuperLight Car to have a substan-tially lower carbon footprint than a reference vehicle, although materials are used during production that require more energy. As it is also recyclable, it also brings a higher CO2 credit with it (the negative bar, see Box 19_b).
Figure 67:
LCA visualization of the
SuperLightCar concept (Goede et
al., 2008; Krinke et al., 2009).
-40 %
-60 %
-80 %
Production Costs [€]
Vehicle Weight [kg]
high
high
low
low
-20 %
0
20 %
€/kg
€/kg
Steel Body(today)
Advanced Steel
Multi-Material Design
Advanced Light
Advanced FRP FRP
Aluminium
Lightweight costs (today)Cut Lightweight costs (Vision)

161
Metal Recycling – Opportunities, Limits, Infrastructure
Within recycling systems, LCA can be applied to a comprehensive assessment of WEEE recovery systems, as was done for Swiss WEEE (Hischier et al., 2005; Wäger et al., 2011). It uses different environmental indi-cators whose selection is a factor for choos-ing methodology. For example, the follow-ing midpoint indicatorsa are used by Guinée et al. (2001): Acidification Potential, Global Warming Potential, Eutrophication Potential, Photochemical Oxidation Potential, (Strato-spheric) Ozone Depletion Potential, Abiotic Resource Depletion, Freshwater Aquatic Eco-toxicity Potential, Human Toxicity Potential, and Terrestrial Ecotoxicity Potential. Other potential endpoint indicatorsb according to the Eco-Indicator ’99 methodology (Goedkoop and Spriensma, 2000) are ecosystem quality, human health and resources.
a Midpoints in the cause–effect chain (environmental mech-anism) of a particular impact category lie somewhere be-tween stressor and endpoint.
b Endpoints are elements of an environmental mechanism that have a societal value, such as human damage to plant or animal species or natural resource depletion.
6.5 Design for Sustainability (DfS)
Design for Recycling, as outlined in the previ-ous section, focuses entirely on the recycla-bility of a product and disregards, for exam-ple, energy-efficiency considerations. These and others are crucial to the Design for Sus-tainability approach. This approach requires product designers to assess which mate-rial promises the best sustainability perfor-mance, for example with regard to energy ef-ficiency combined with other factors like re-cyclability, durability, etc., by taking a life-cy-cle perspective.
Any changes to a product generally lead to tradeoffs. A lower cost or environmental im-pact in one area may lead to a cost increase in another. The LCA helps revealing these tradeoffs, so that the different outcomes can be understood and compared. In some cas-es, Design for Recycling will not be appropri-ate, because of other impacts at other stages in the life cycle, for example, in energy effi-ciency. Such a tradeoff is shown in Figure 68, comparing a steel and a carbon-fibre-rein-forced-plastics (CFRP) basic car ‘body-in-white’. Carbon-fibre production has a high environmental footprint, but, because the car body will be lighter, the environmental footprint over the use phase will be small-er. Whether the CFRP or the steel car has a
Box 19: _b
-2000 -1000 0 1000 2000 3000 4000 5000 6000
SLC-BIW
Reference
Complete Life Cycle
End-of-Life
Use-Phase
Production
Greenhouse Gas Emissions (kg CO2e)
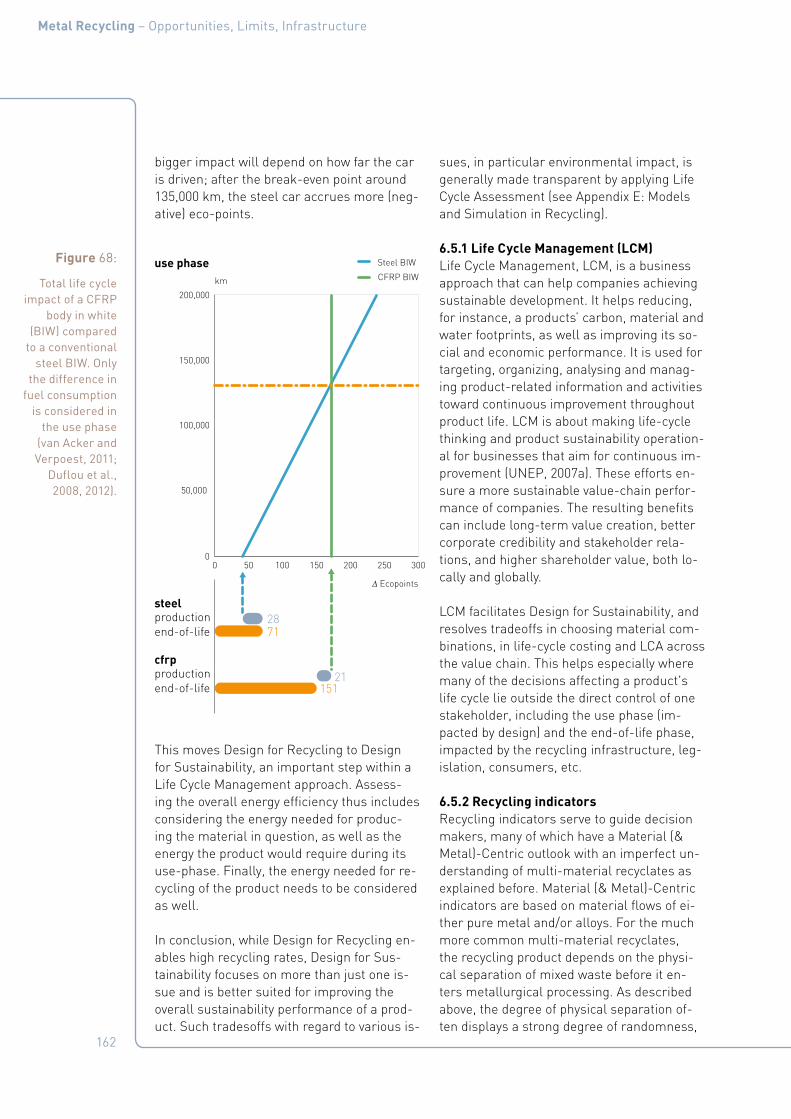
162
Metal Recycling – Opportunities, Limits, Infrastructure
bigger impact will depend on how far the car is driven; after the break-even point around 135,000 km, the steel car accrues more (neg-ative) eco-points.
This moves Design for Recycling to Design for Sustainability, an important step within a Life Cycle Management approach. Assess-ing the overall energy efficiency thus includes considering the energy needed for produc-ing the material in question, as well as the energy the product would require during its use-phase. Finally, the energy needed for re-cycling of the product needs to be considered as well.
In conclusion, while Design for Recycling en-ables high recycling rates, Design for Sus-tainability focuses on more than just one is-sue and is better suited for improving the overall sustainability performance of a prod-uct. Such tradesoffs with regard to various is-
sues, in particular environmental impact, is generally made transparent by applying Life Cycle Assessment (see Appendix E: Models and Simulation in Recycling).
6.5.1 Life Cycle Management (LCM)Life Cycle Management, LCM, is a business approach that can help companies achieving sustainable development. It helps reducing, for instance, a products’ carbon, material and water footprints, as well as improving its so-cial and economic performance. It is used for targeting, organizing, analysing and manag-ing product-related information and activities toward continuous improvement throughout product life. LCM is about making life-cycle thinking and product sustainability operation-al for businesses that aim for continuous im-provement (UNEP, 2007a). These efforts en-sure a more sustainable value-chain perfor-mance of companies. The resulting benefits can include long-term value creation, better corporate credibility and stakeholder rela-tions, and higher shareholder value, both lo-cally and globally.
LCM facilitates Design for Sustainability, and resolves tradeoffs in choosing material com-binations, in life-cycle costing and LCA across the value chain. This helps especially where many of the decisions affecting a product's life cycle lie outside the direct control of one stakeholder, including the use phase (im-pacted by design) and the end-of-life phase, impacted by the recycling infrastructure, leg-islation, consumers, etc.
6.5.2 Recycling indicatorsRecycling indicators serve to guide decision makers, many of which have a Material (& Metal)-Centric outlook with an imperfect un-derstanding of multi-material recyclates as explained before. Material (& Metal)-Centric indicators are based on material flows of ei-ther pure metal and/or alloys. For the much more common multi-material recyclates, the recycling product depends on the physi-cal separation of mixed waste before it en-ters metallurgical processing. As described above, the degree of physical separation of-ten displays a strong degree of randomness,
Figure 68:
Total life cycle impact of a CFRP
body in white (BIW) compared
to a conventional steel BIW. Only
the difference in fuel consumption
is considered in the use phase
(van Acker and Verpoest, 2011;
Duflou et al., 2008, 2012).
productionend-of-life
steel
use phase
2871
21151
productionend-of-life
cfrp
100,000
50,000
00 50 100 150 200 250 300
150,000
200,000
Δ Ecopoints
km CFRP BIW
Steel BIW

163
Metal Recycling – Opportunities, Limits, Infrastructure
which means that the recycling outcome will also have a degree of randomness, instead of being a set of predictably separated discrete metals.
Approaches based on an understanding of the physics of recycling are freely available. They can help in rendering the Material (& Metal)-Centric indicators more Product-Cen-tric, to reflect the complexity of products and their large diversity of rapidly changing com-positions.
6.5.3 A note on data, data structures and qualityWell-collected and formatted data, includ-ing information on their timelines as well as on standard deviation and average values, are important for evaluating recycling systems. Although some data are available, not many have a thermodynamic basis, and thus will be of little use for models based on that funda-mental starting point. Many data are meas-ured in such totally different ways that there is insufficient information for closing a mass balance, and certainly for producing statisti-cally sound recycling-rate calculations, pre-dictions, etc. While data compilations such as the Review of Directive 2002/96 (United Nations University, 2007) give a snapshot of the "now", they are of little use for calibrat-ing physics-based models that are needed for understanding and innovating recycling. Therefore, special attention should be paid in the future, that good data are collected for a meaningful contribution to better resource efficiency.
To perform dynamic modelling and simula-tion of recycling systems requires data sets with at least the following characteristics:
■ Metal, alloy and compound details.
■ Identified connections between materials.
■ Standard deviation values of the composi-tion of each metal, alloy, compound, and of total flow rates.
■ Thermodynamic and physical properties.
6.5.4 The future of design for recycling and recyclability indexesUseful Design for Recycling tools must be based on the rigorous methods discussed here. Simplistic linear methods without any physics basis will be of no use in guid-ing product design. The more complex the products are, the more rigorous the meth-ods must become for capturing all non-linear thermodynamic and physics interactions be-tween materials, for a clear prediction of re-cyclability and resource efficiency.
In summary, recyclability indicators will only be of use if they are based on rigorous phys-ics (Figure 5), as otherwise they can mislead decision makers and consumers.
164
Metal Recycling – Opportunities, Limits, Infrastructure
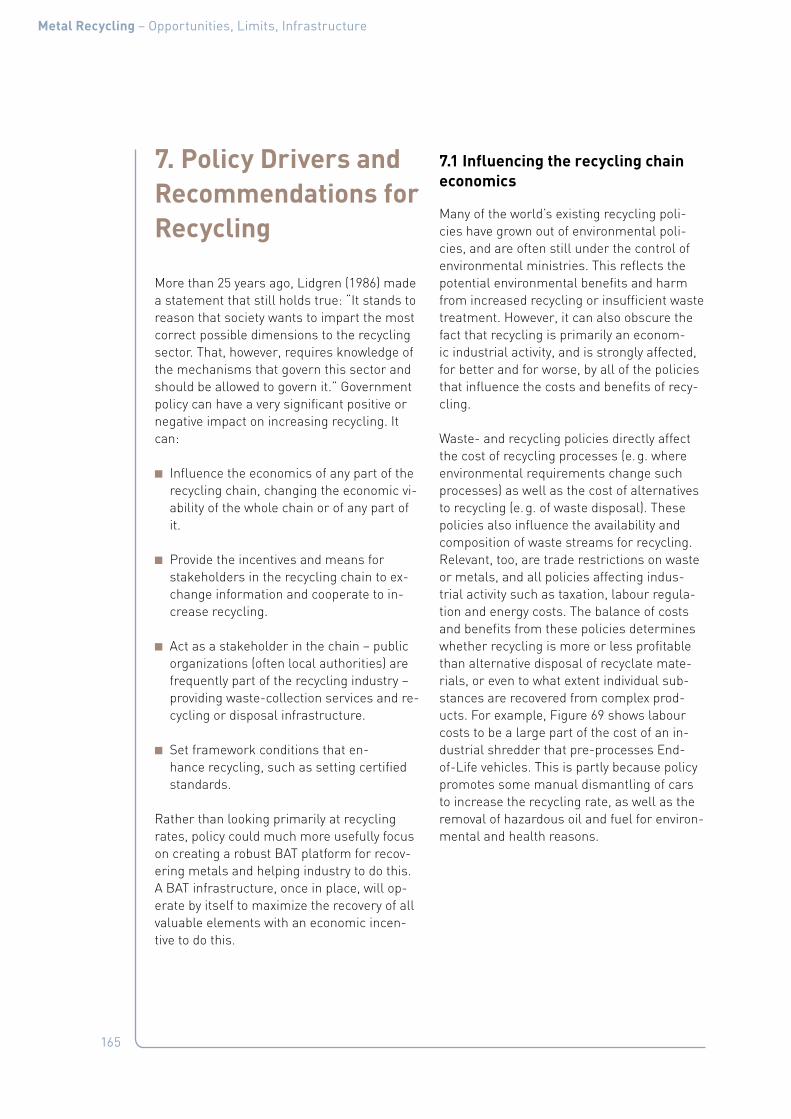
165
Metal Recycling – Opportunities, Limits, Infrastructure
7. Policy Drivers and Recommendations for Recycling
More than 25 years ago, Lidgren (1986) made a statement that still holds true: “It stands to reason that society wants to impart the most correct possible dimensions to the recycling sector. That, however, requires knowledge of the mechanisms that govern this sector and should be allowed to govern it.” Government policy can have a very significant positive or negative impact on increasing recycling. It can:
■ Influence the economics of any part of the recycling chain, changing the economic vi-ability of the whole chain or of any part of it.
■ Provide the incentives and means for stakeholders in the recycling chain to ex-change information and cooperate to in-crease recycling.
■ Act as a stakeholder in the chain – public organizations (often local authorities) are frequently part of the recycling industry – providing waste-collection services and re-cycling or disposal infrastructure.
■ Set framework conditions that en-hance recycling, such as setting certified standards.
Rather than looking primarily at recycling rates, policy could much more usefully focus on creating a robust BAT platform for recov-ering metals and helping industry to do this. A BAT infrastructure, once in place, will op-erate by itself to maximize the recovery of all valuable elements with an economic incen-tive to do this.
7.1 Influencing the recycling chain economics
Many of the world’s existing recycling poli-cies have grown out of environmental poli-cies, and are often still under the control of environmental ministries. This reflects the potential environmental benefits and harm from increased recycling or insufficient waste treatment. However, it can also obscure the fact that recycling is primarily an econom-ic industrial activity, and is strongly affected, for better and for worse, by all of the policies that influence the costs and benefits of recy-cling.
Waste- and recycling policies directly affect the cost of recycling processes (e. g. where environmental requirements change such processes) as well as the cost of alternatives to recycling (e. g. of waste disposal). These policies also influence the availability and composition of waste streams for recycling. Relevant, too, are trade restrictions on waste or metals, and all policies affecting indus-trial activity such as taxation, labour regula-tion and energy costs. The balance of costs and benefits from these policies determines whether recycling is more or less profitable than alternative disposal of recyclate mate-rials, or even to what extent individual sub-stances are recovered from complex prod-ucts. For example, Figure 69 shows labour costs to be a large part of the cost of an in-dustrial shredder that pre-processes End-of-Life vehicles. This is partly because policy promotes some manual dismantling of cars to increase the recycling rate, as well as the removal of hazardous oil and fuel for environ-mental and health reasons.

166
Metal Recycling – Opportunities, Limits, Infrastructure
Policy promoting the industry, for example through subsidies or a suitable tax regime, also changes the economics. Such policy tools can both target innovation and the recy-cling of particular strategic metals. Taxation policy, often seen as just a tool for raising revenue, has a major influence on investment and consumption decisions, and is probably the most important tool that a government has for aligning economic incentives with the transition to a more resource-efficient, low-carbon economy. In the context of recycling, differential taxation can play a role, either through energy-price controls or by favouring recycling processes or materials. The bal-ance of taxation between energy, materials and labour cost further affects the viability of the collection of EoL goods.
Due to the links between the metal-supply chain and recycling systems, public policy may inadvertently damage the infrastructure for recycling (Verhoef et al., 2004). Policies that affect one part of the industry may have knock-on effects elsewhere. Policy-makers can help by being cognizant of such pitfalls. One example comes from the EU policy for reducing the use of lead in products, so that
less toxic lead will escape into the environ-ment at the end of product life. One of the el-ements planned to be used as a substitute for lead was bismuth. The policy was effective at removing lead, but caused an inadvertent reduction (rather than increase) in bismuth production as bismuth and lead are mined and produced together, and lead production had decreased due to the lower demand.
Establishing weight-based product-recycling rates for all individual trace- and critical el-ements is impossible, hence policy should focus instead on well developed BAT Car-rier Metal-recovery systems. The critical el-ements will then be recovered if there is an economic reason for doing so.
A prime factor for investment is the security of its future economic rate of return, helped by knowledge of secure material streams of known composition. Stability in government policy affects the economics of recycling, and timely announcements of any future policy changes will help investment. Creating sup-ply security for investors also implies stimu-lating collection and preventing illegal out-flows such as theft.
Figure 69:
Rough cost-breakdown for a
typical shredder, where manual
dismantling contributes up to
80 % of the ELV recyclate (Ferrão
and Amaral, 2006).
Labor (€/y)
Building & Equipment (€/y)
Recycling dismantled materials (€/y)
Transport dismantled materials (€/y)
Maintenance & Energy (€/y)

167
Metal Recycling – Opportunities, Limits, Infrastructure
7.2 Providing the incentives and means for stakeholders to exchange and cooperate
The previous section described how coordi-nated change to different parts of the recy-cling system often is the best way for in-creasing recycling, and how this requires exchange and cooperation between the stakeholders who are the key players in the recycling system. The lessons from recycling policies used around the world suggest that the effectiveness with which policy promotes these interactions between stakeholders is one of the most important factors in increas-ing recycling rates.
For example, the continuous evolution of battery chemistry, the use of manufactur-er-specific formulations, and extremely high quality requirements, makes the recycling of rechargeable batteries very difficult, un-less one-to-one business-to-business (B2B) relationships between a manufacturer and a recycler are developed. Though critical to-day for geopolitical reasons, lithium and rare earths for example will require increased battery collection volumes for creating the economies of scale that render recovery of the contained metals economic. However, the wrong combination of rare earth waste streams, e. g. mixing batteries with other REE-containing recyclates to boost scale ef-fects, will greatly complicate the subsequent refining process, as different REEs are used in different batteries and some do not con-tain REEs at all. Partnerships in the recycling system can provide solutions to these issues, if all of these intricacies are to be understood and economically fully exploited.
Government policy can facilitate information exchange between stakeholders, either by providing the information itself, or by conven-ing meetings or increasing trust in informa-tion, for example by setting and monitoring standards for quality labels. Through educa-tion, it can influence the ability of different sectors to work effectively with each other. However, experience suggests that recycling stakeholders respond more strongly when
there are economic incentives for coopera-tion.
These incentives can come from allocating the responsibility for a product life cycle to the most influential stakeholder in this life cycle. For most products this is the producer, who can influence design and suppliers, and can raise any funds needed for recycling from consumers through increasing the product’s sale price. This is one of the primary ways in which existing Extended Producer Responsi-bility policies work. Yet, even where produc-ers directly feel the net benefits and costs of recycling, and thus have economic incentives for maximizing the value of the metals that result from the recycling process, they fre-quently do not focus on recycling. Just as pri-mary metal producers tend to focus on their core Carrier Metal business, product manu-facturers often do not have the expertise to start recycling and so choose not to engage.
Policy has to overcome this reticence by plac-ing quantifiable recycling obligations on pro-ducers, for example the weight percentage of the product that must be recycled to meet legal compliance. This provides a stronger motivation for producers to cooperate with recyclers than the prospect of economic gain. Section 7.5 below examines several examples of Extended Producer Responsibility world-wide.
Governments can also bring people together around innovation projects. Here, the incen-tive to participate comes either from subsi-dized innovation development, from the po-tential savings that innovation may have for future revenues, or from benefits of working together with other stakeholders on a joint solution.
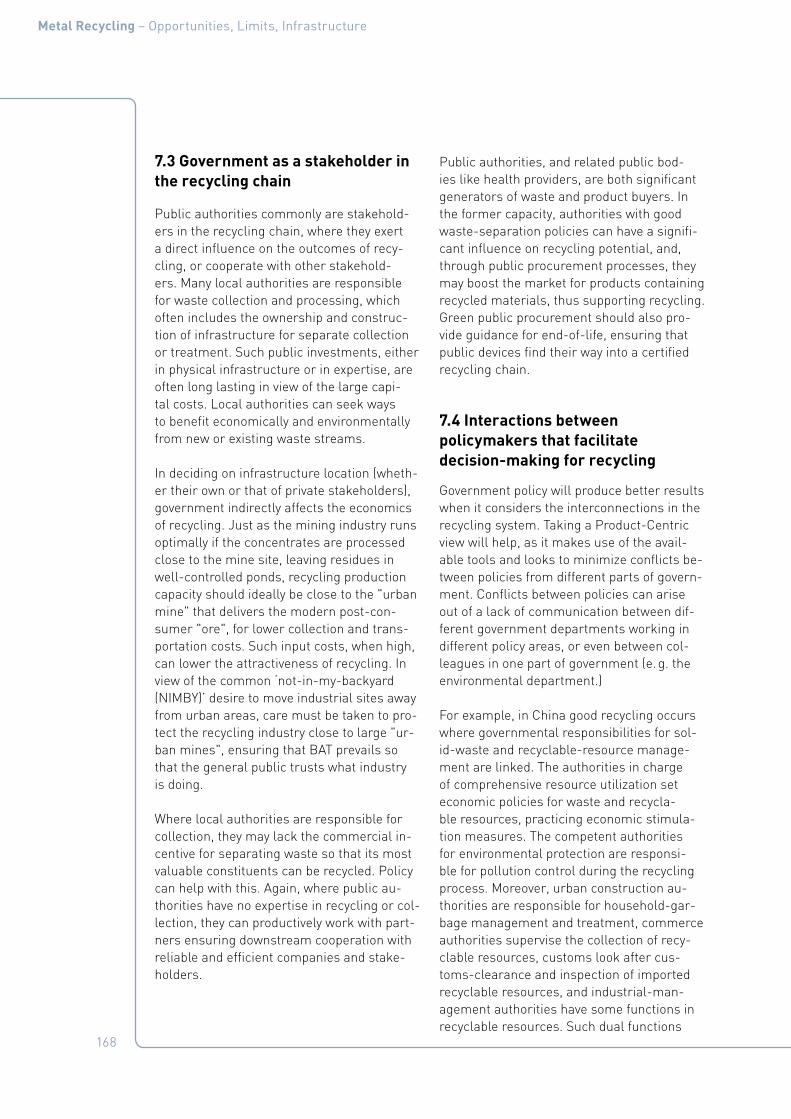
168
Metal Recycling – Opportunities, Limits, Infrastructure
7.3 Government as a stakeholder in the recycling chain
Public authorities commonly are stakehold-ers in the recycling chain, where they exert a direct influence on the outcomes of recy-cling, or cooperate with other stakehold-ers. Many local authorities are responsible for waste collection and processing, which often includes the ownership and construc-tion of infrastructure for separate collection or treatment. Such public investments, either in physical infrastructure or in expertise, are often long lasting in view of the large capi-tal costs. Local authorities can seek ways to benefit economically and environmentally from new or existing waste streams.
In deciding on infrastructure location (wheth-er their own or that of private stakeholders), government indirectly affects the economics of recycling. Just as the mining industry runs optimally if the concentrates are processed close to the mine site, leaving residues in well-controlled ponds, recycling production capacity should ideally be close to the "urban mine" that delivers the modern post-con-sumer "ore", for lower collection and trans-portation costs. Such input costs, when high, can lower the attractiveness of recycling. In view of the common ‘not-in-my-backyard (NIMBY)’ desire to move industrial sites away from urban areas, care must be taken to pro-tect the recycling industry close to large "ur-ban mines", ensuring that BAT prevails so that the general public trusts what industry is doing.
Where local authorities are responsible for collection, they may lack the commercial in-centive for separating waste so that its most valuable constituents can be recycled. Policy can help with this. Again, where public au-thorities have no expertise in recycling or col-lection, they can productively work with part-ners ensuring downstream cooperation with reliable and efficient companies and stake-holders.
Public authorities, and related public bod-ies like health providers, are both significant generators of waste and product buyers. In the former capacity, authorities with good waste-separation policies can have a signifi-cant influence on recycling potential, and, through public procurement processes, they may boost the market for products containing recycled materials, thus supporting recycling. Green public procurement should also pro-vide guidance for end-of-life, ensuring that public devices find their way into a certified recycling chain.
7.4 Interactions between policymakers that facilitate decision-making for recycling
Government policy will produce better results when it considers the interconnections in the recycling system. Taking a Product-Centric view will help, as it makes use of the avail-able tools and looks to minimize conflicts be-tween policies from different parts of govern-ment. Conflicts between policies can arise out of a lack of communication between dif-ferent government departments working in different policy areas, or even between col-leagues in one part of government (e. g. the environmental department.)
For example, in China good recycling occurs where governmental responsibilities for sol-id-waste and recyclable-resource manage-ment are linked. The authorities in charge of comprehensive resource utilization set economic policies for waste and recycla-ble resources, practicing economic stimula-tion measures. The competent authorities for environmental protection are responsi-ble for pollution control during the recycling process. Moreover, urban construction au-thorities are responsible for household-gar-bage management and treatment, commerce authorities supervise the collection of recy-clable resources, customs look after cus-toms-clearance and inspection of imported recyclable resources, and industrial-man-agement authorities have some functions in recyclable resources. Such dual functions

169
Metal Recycling – Opportunities, Limits, Infrastructure
improve recycling efficiency and productivity of solid waste and recyclable resources.
Although there is no perfect organizational structure for ensuring better cooperation be-tween government arms, policy making can be improved where specific responsibility is allocated for recycling capacity as a whole. This can shape policy to enhance the key ex-pertise of industry, making individual policies that take a narrower view into a success. One way is to create government structures that adopt a holistic approach and deal with inter-dependencies (recycling, energy efficiency, climate impact, emissions, etc.).
7.5 Common forms of policy designed for better recycling
7.5.1 Extended producer responsibility and take-back-systemsExtended Producer Responsibility (EPR) fa-cilitates recycling by creating partnerships along the recycling chain. It induces the producer to take part in waste-collection schemes, and engage in partnerships with recycling processors. Both can push back the boundaries of innovation, promoting infor-mation exchange (for example, on how de-sign facilitates or limits recycling.) EPR poli-cies have been adopted across the world and, in practice, can consist of different aspects, from voluntary to mandatory (OECD, 2001; Table 22).
The only formal WEEE take-back systems, based on sustainability and extended produc-er responsibility principles, are almost exclu-sively found in OECD countries (Sinha-Khetri-wa et al., 2006, 2009; Ongondo et al., 2011). The European WEEE Directive (European Un-ion, 2003), based on the EPR concept, sets the global pace in regulating WEEE man-agement. It has its origins in environmen-tal policy, so in addition to the extended pro-
Table 22:
Possible approaches to EPR and
examples (OECD, 2001).
Type of EPR approach Examples
Take-back programmes for products
Mandatory take-back Voluntary or negotiated take-back programmes
Regulatory approaches Minimum product standards Prohibitions of certain hazardous materials or products Disposal bans Mandated recycling
Voluntary industry practices Voluntary codes of practice Public/private partnerships Leasing and “servicing” Labelling
Economic instruments Deposit–refund schemes Advance recycling fees Fees on disposal Material taxes and subsidies

170
Metal Recycling – Opportunities, Limits, Infrastructure
ducer responsibility, it also sets some design standards and prescribes certain environ-mental standards for the recycling processes.
As the European WEEE Directive had to be implemented by national laws, it showed how different arrangements for implementing EPR could lead to different outcomes. It also showed how important it is that regulation gets all the economic incentives right, as well as relying on mandated action. The design and enforcement of the EU WEEE Directive led to insufficient collection rates in many EU
member countries, an issue now being tack-led by a legislative revision (European Com-mission – 2008 – Questions and answers on the revised directive on waste electrical and electronic equipment (WEEE) – Press re-lease MEMO/08/764 – http://europa.eu/rap-id/press-release_MEMO-08-764_en.htm). Only the best performing European countries, which had started to implement WEEE man-agement policies before the EU WEEE Direc-tive came into force, now achieve collection rates higher than 80 % of waste generated.
One of the oldest legislative frameworks is the Swiss “Ordinance on the return, taking back and disposal of electrical and electronic equipment” (ORDEE) of 1996 (Schweiz. Bun-desrat, 2004). Its principles of defining stake-holders’ obligations are presented in Fig-ure 70.
Box 20: EU WEEE and WEEE-2 DirectiveThe 2005 EU WEEE legislation required producers to ensure that all of their products were recycled to certain environmental standards when they became waste. Producer-funded collection schemes were set up to deliver on this goal. However, a review of the destina-tion of EU WEEE found that around 50 % of the WEEE available for collection still disap-peared into grey or illegal channels. Some was being processed in the EU, but much was illegally exported despite regulations banning its shipment.
The explanation was that illegal waste operations were informally out-bidding regu-lar recycling schemes for the valuable WEEE, ignoring recycling standards, causing cor-responding environmental harm and avoidable metal losses. The producer-collection schemes had the financial resources (from fees added to the purchase price of new goods) to out-bid the illegal sector, but chose not to because it did not align with their economic incentives. Instead, they mostly aimed at achieving the significantly lower collection esti-mates that were part of WEEE legislation. Enforcement had, in the absence of data on po-tential collection, focused on the achievement of these targets (EC9).
It appears likely that, if the legislation had instead created requirements or incentives for the collection schemes to bid sufficiently high prices for waste, this would have stayed with regular operators applying stricter monitoring and enforcement. The WEEE directive now has been revised and on June 11th, 2012, the WEEE-2 directive was published.
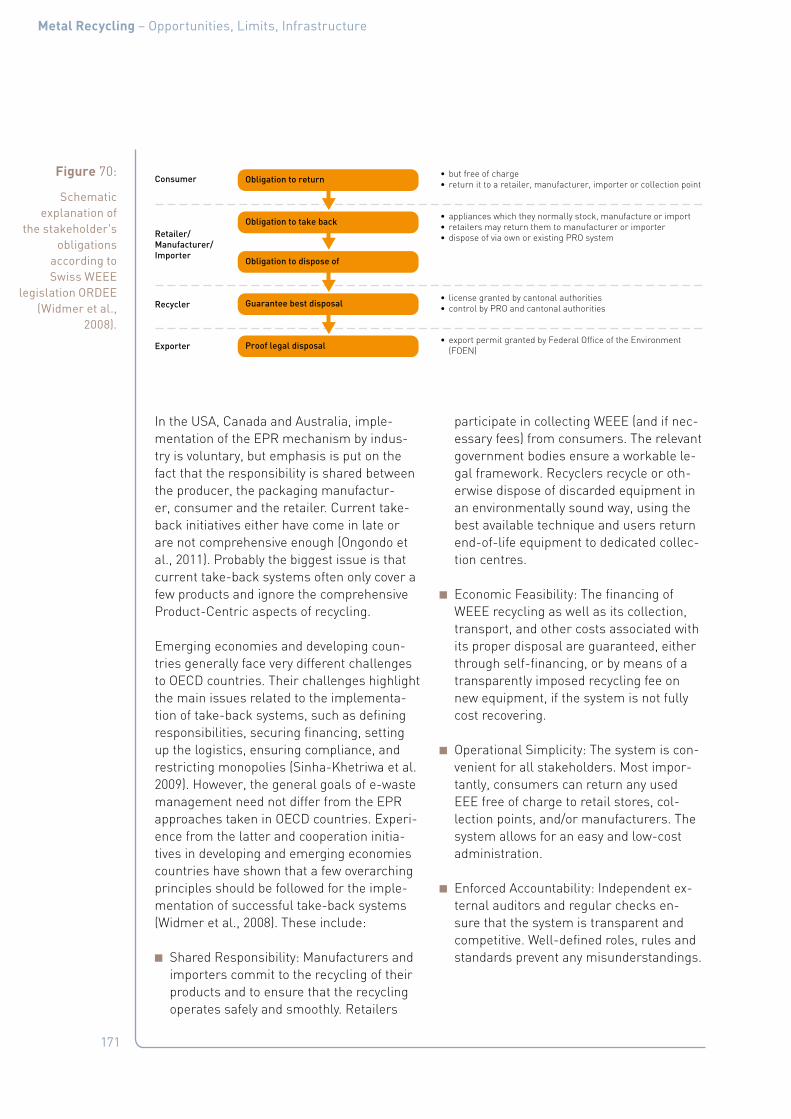
171
Metal Recycling – Opportunities, Limits, Infrastructure
In the USA, Canada and Australia, imple-mentation of the EPR mechanism by indus-try is voluntary, but emphasis is put on the fact that the responsibility is shared between the producer, the packaging manufactur-er, consumer and the retailer. Current take-back initiatives either have come in late or are not comprehensive enough (Ongondo et al., 2011). Probably the biggest issue is that current take-back systems often only cover a few products and ignore the comprehensive Product-Centric aspects of recycling.
Emerging economies and developing coun-tries generally face very different challenges to OECD countries. Their challenges highlight the main issues related to the implementa-tion of take-back systems, such as defining responsibilities, securing financing, setting up the logistics, ensuring compliance, and restricting monopolies (Sinha-Khetriwa et al. 2009). However, the general goals of e-waste management need not differ from the EPR approaches taken in OECD countries. Experi-ence from the latter and cooperation initia-tives in developing and emerging economies countries have shown that a few overarching principles should be followed for the imple-mentation of successful take-back systems (Widmer et al., 2008). These include:
■ Shared Responsibility: Manufacturers and importers commit to the recycling of their products and to ensure that the recycling operates safely and smoothly. Retailers
participate in collecting WEEE (and if nec-essary fees) from consumers. The relevant government bodies ensure a workable le-gal framework. Recyclers recycle or oth-erwise dispose of discarded equipment in an environmentally sound way, using the best available technique and users return end-of-life equipment to dedicated collec-tion centres.
■ Economic Feasibility: The financing of WEEE recycling as well as its collection, transport, and other costs associated with its proper disposal are guaranteed, either through self-financing, or by means of a transparently imposed recycling fee on new equipment, if the system is not fully cost recovering.
■ Operational Simplicity: The system is con-venient for all stakeholders. Most impor-tantly, consumers can return any used EEE free of charge to retail stores, col-lection points, and/or manufacturers. The system allows for an easy and low-cost administration.
■ Enforced Accountability: Independent ex-ternal auditors and regular checks en-sure that the system is transparent and competitive. Well-defined roles, rules and standards prevent any misunderstandings.
Figure 70:
Schematic explanation of
the stakeholder's obligations
according to Swiss WEEE
legislation ORDEE (Widmer et al.,
2008).
Obligation to return
Obligation to take back
Obligation to dispose of
Guarantee best disposal
Proof legal disposal
• but free of charge• return it to a retailer, manufacturer, importer or collection point
Consumer
Retailer/Manufacturer/Importer
Recycler
Exporter
• appliances which they normally stock, manufacture or import• retailers may return them to manufacturer or importer• dispose of via own or existing PRO system
• license granted by cantonal authorities• control by PRO and cantonal authorities
• export permit granted by Federal Office of the Environment (FOEN)

172
Metal Recycling – Opportunities, Limits, Infrastructure
7.5.2 Recycling rates, targets and their physics-based rigourLegislative requirements for the size of waste streams to be recycled have been used in combination with EPR policies to promote in-creases in collection and recycling. At best, these will stimulate innovation and partner-ships within the recycling system, increas-ing the possibilities of recycling beyond what stakeholders can do individually. To do this, testing targets have to be set for a date sev-eral years in the future, so that partners have time to work out solutions. This is particu-larly important where products have long use periods, as any design changes to help recy-cling will take years to affect the EoL product.
The EU’s ELV legislation successfully stimu-lated several partnerships. In order to meet recycling targets, car maker VW formed a partnership with metal-processing special-ists Si-Con, and French manufacturer Re-nault set up a joint venture with waste spe-cialist SITA and the car recycling specialist INDRA Investissement.
Defining the system boundaries for which targets are stipulated is of critical impor-tance. Furthermore, weight-based targets hinder rather than promote recycling of the many critical elements in complex products, usually present in very low concentrations. In addition, priorities have to be set between dif-ferent metals, such as base metals, special metals, critical-technology metals, etc. This further highlights the dilemma of defining re-cycling targets for metals that are present in small quantities in products.
However, targets that go beyond what is ther-modynamically possible for recycling will fail and lead to excessive energy consumption caused by efforts to meet the recycling tar-get. Policy makers can set appropriate tar-gets by drawing on the expertise and tools available within the recycling industry.
The empirical one-dimensional recycling rates for metals given in UNEP’s previous report on Metal Recycling Rates provided useful indica-tions of the overall recycling rates for various metals, based on available data and a line-ar and sequential Material (& Metal)-Centric perspective, shown in Figure 71.Figure 71:
A Material (&Metal)-
Centric view of recycling: Linear
and sequential representation of recycling for non-
complex metal applications
such as in construction,
packaging etc. (UNEP, 2011b). This recycling-
rate definition is one-dimensional
and lacks the required non-
linear predictive qualities for successfully
driving a recycling system.
Prod FabProd Mfg Use
Stock
Rec
Coll
Rec
WM&R
Metal A
Metal B
Scrapmarket
Prod Fab Mfg Use
Stock
Coll
Rec
WM&R
Scrapmarket
a: primary metal inputb: refined metalc: intermediate products (e.g. alloys,
semis)d: end-of-life (EOL) products (metal
content)e: EOL metal collected for recyclingf: EOL metal separated for non-functional
recycling
(a)
(m)(n) (j)
(h)
(g) (o)
(e)
(f)
(b) (c) (d)
g: recycled EOL metal (old scrap)h: scrap from Manufacturing (new scrap)j: scrap used in Fabrication (new &old)m: scrap used in Production (new & old)n: tailings and slago: in-use dissipation
173
Metal Recycling – Opportunities, Limits, Infrastructure
To generate appropriate recycling rates for multi-material products with large amounts of different elements in functional proximity, a Product-Centric view is more appropriate (Reuter et al., 2005; Reuter and van Schaik, 2012a&b). The models they developed (e. g. for ELV recycling) provide a clear insight into the critical parameters of a recycling system, and can be used for setting recycling and re-covery targets.
A Product-Centric view helps understand-ing the tradeoffs between achieving very high recycling targets of a particular product (and its contained metals) and natural-resource depletion, in this case the energy needed for running the recycling process. A wider con-sideration of recycling systems, including such natural resource impact, can help veri-fying that the recycling/recovery targets im-posed by legislation support the preservation of natural resources, in technical terms, that they make thermodynamic sense.
If this complexity of products is understood to its fullest, not only will the recycling of valua-ble critical and scarce elements improve, but the recycling rates of the commodity met-als as well. The right indicators help with this understanding, and focus.
Above all, rather than focusing primar-ily on recycling rates and their measure-ment, much better metrics for success are found in ensuring that sufficient collection and good pre-processing efforts exist close to the “Urban Mine”. This should provide suf-ficient high-quality recyclates for optimal and economic BAT recovery of the multitude of metals in complex EoL products. Phys-ics- and economics-based legislation would help much in creating a resource-efficient re-cycling system and infrastructure that must be measured on performance rather than on achieving recycling-rate quotas.
However, for the strategic elements in com-plex product mixtures, the thermodynamics and physics of separation often are so com-plex – due to complex linkages and interac-tions – that it is almost impossible to define
realistic recycling rates. Also, the dynami-cally changing use of individual elements in specific applications (such as Ga, REE and W needed to provide lighting) may complicate things even further.
In summary, economic targets for the BAT chain as a whole should focus on maximiz-ing resource efficiency, and should be based on understanding the physical properties and destination of all materials.
7.5.3 Information tools and eco-labellingConsumers can affect recycling rates through their choice of products and disposal behav-iour. This works well when they have effec-tive information tools that provide them with facts they can act on, such as labelling, which is one of the simplest tools though making it truly effective requires expertise. By label-ling a product as recyclable, or as containing recycled materials, consumers can choose products that promote recycling. The produc-ers must be careful not to create a recycling expectance, as the absence of a recycling in-frastructure for capturing EoL goods might be perceived by consumers as “green wash-ing”. However, when product manufactur-ers can source their materials from BAT re-cycling with its environmental benefits, they may well be rewarded by higher profits from consumers. Eco-Labelling is also useful for separating goods for recycling, for example, advising consumers not to discard WEEE in domestic waste.
Eco-Labelling is most effective when used in connection with other information tools, rais-ing awareness about recycling benefits and opportunities. The example of recycling mo-bile phones illustrates that, the more conven-ient such opportunities are, the more likely people are to recycle them.
Many labelling schemes were set up by non-governmental organizations. Policy is not necessarily required for a successful label, but it can be helpful for creating trust in a label. Government can play a useful role in bringing stakeholders together to agree on design and meaning of the label. Government

174
Metal Recycling – Opportunities, Limits, Infrastructure
information on labels can also have positive effects and provide guidance when too many labels could confuse consumers.
7.6 National examples of government policy
7.6.1 Japanese mineral resource policy, recycling and research and developmentThe Japanese approach demonstrates will-ingness to secure a metallurgical infrastruc-ture for safeguarding metal availability, no-tably those used in high-tech applications. Japanese mineral-resource policy defines ‘critical’ metals for society in a similar way to the US and the EU. In the Japanese con-text, these are base metals and precious and platinum group metals that are either “geo-logically rare” or ”technically and economi-cally difficult to recover”, and/or have a pre-dicted “strong demand in industry today and in the future.” Japan stockpiles the following metals:
■ Co, W, V, Mo, Ni, Cr and, Mn (steelmaking alloys) since 1983.
■ In and Ga since 2009, due to their use in various modern technologies.
■ It carefully monitors Pt, REE, Nb, Ta and Sr.
Where an urgent risk exists of mineral-supply shortages, the government uses subsidies for promoting investment in industries and R&D projects. The following are examples of sub-sidized R&D projects:
■ Recovery of critical metals such as indi-um from small home appliances (mobile phones, digital cameras, portable gaming machines, MP3s, pads, etc.).
■ Recovery of cerium and other rare earths from glass polishing processes.
■ Recovery of rare earth elements from used motors in EoL goods.
■ Recovery of rare metals from EoL batteries (Li-ion), mainly Li and Co.
Japan has started to explore a systems ap-proach for “Rare-Metals” recycling. Though difficult to collect, small home appliances (SHA) are known to contain high concentra-tions of critical metals. The relevant Japa-nese ministries jointly carried out a pilot pro-ject for SHA collection and technology R&D for metal recovery from SHAs. The project showed that the whole system of collection, dismantling/separation, and material recov-ery, is financially feasible as a whole, but that the “collection” stage was not financially vi-able by itself. Considering this, the Japanese government started discussions for imple-menting a recycling scheme for these SHAs in a working group under the central environ-mental council.
7.6.2 ChinaIn China, a set of policies supporting the whole system is being established for recy-clable resources. This includes a tax prefer-ence for the recycling of waste materials to reduce the operating costs of recycling. China has promulgated “The Circular Economy Pro-motion Law” to promote the resource recy-cling; see also section 3.1.1.1 of this report.
Policy steps have included the creation of suitable government units and, in recent years, the central government also promoted “City Mineral Pilot Units”. China has prom-ulgated “Regulations for the Administration of recycling and Treatment of Waste Electri-cal and Electronic Equipment” that govern the whole cycle of product design, materials use, collection, dismantling and treatment. The Regulations also set up a recycling fund for subsidizing the processing cost of WEEE, funded by manufacturers and importers, and thus, indirectly, by consumers.
This fund is used for steering WEEE flow to regular enterprises rather than illegal recy-clers, thus improving human safety and en-vironmental protection. From June 2009 to June 2010, China built more than one hun-dred regulated enterprises pre-processing
175
Metal Recycling – Opportunities, Limits, Infrastructure
WEEE. Since then, over 600 million com-puters, refrigerators, TVs, air conditioners, washing machines and other waste were col-lected and treated mechanically. However, the informal sector still manually dismantles WEEE in parts of China, such as Guiyu Town, Shantou City and Taizhou City. Often, such waste is illegally imported into China, where these informal processes cause serious health problems and environmental pollution. Local governments find it hard to close this illegal dismantling, particularly as part of this activity is moving to more remote areas.
7.6.3 European Union (EC1 to EC9 and European Commission)The European Union has several policies that relate to raw materials and recycling. The Waste Framework Directive includes, among others, the Battery Directive, End of Life Vehi-cle Directive and the WEEE Directive. It is im-plemented and relates to specific legislation concerning waste handling and treatment. Recently, the European Union developed the Raw Materials Initiative, a long-term strate-gy based on three pillars: 1) Ensuring a level playing field in access to resources in third countries, 2) Fostering a sustainable sup-ply of raw materials from European sources, and 3) Boosting resource efficiency and pro-moting recycling. Fourteen critical (groups of) materials are identified: antimony, beryl-lium, cobalt, fluorspar, gallium, germanium, graphite, indium, magnesium, niobium, plati-num group metals, rare earths, tantalum and tungsten. The Directive also includes actions in the areas of diplomacy, trade and develop-ment, and R&D, among others, via the Euro-pean Innovation Partnership on Raw Materi-als, Resource Efficiency and Recycling. The EU Strategic Energy Technologies plan is also relevant, as it includes materials for ener-gy technologies. In addition, many European countries also have their own policies on re-sources and recycling.
7.7 Policy recommendations
Three major factors determine the recycling results: 1) The processes used in recycling operations and the two other major influ-ences on the mix of metals and other mate-rials going into processing; 2) The way waste streams are mixed during collection; and 3) The physical properties and consequences of design and material linkages of the EoL products in such waste streams. These three factors interrelate in ways that make it im-possible to optimize one without considering the others. To get the best results out of recy-cling, the participants in the recycling system need to know what is happening in the other parts of the system. This suggests that, for optimizing recycling, the following conditions must be fulfilled:
■ Waste streams for recycling must go to operations that use certified Best Availa-ble Techniques (BAT) throughout the com-plete recycling chain. These techniques differ between regions, and need not be high technology, but include well-regulat-ed hand sorting. When they go elsewhere, value will be lost.
■ Policy goals for the recycling system must dovetail with the economic drivers. With so many operators in the collection and re-cycling industry, regulation enforcement is unlikely to be sufficient by itself for deter-mining the destination of metal-containing waste-streams. Policy is essential for cre-ating the economic conditions for sending waste to BAT operations, rather than into illegal or ‘grey’ recycling.
■ The metals recycling industry must have the human talent and metallurgical knowledge needed for linking up differ-ent BAT processes, for recovering large proportions of valuable metals. Producers benefit from producing a range of valuable and critical metals, rather than focusing on one or two.
176
Metal Recycling – Opportunities, Limits, Infrastructure
■ Rapid innovation in process technologies motivates and supports new solutions for sorting and separating metals in mixed waste streams. This must be promoted by Policy.
■ Incentives must exist for all participants in recycling to cooperate with the other participants for improving the system’s recycling performance. Practical ways must be promoted for transmitting the data between the different stakeholders. For example, a Producer Responsibility law will motivate a manufacturer to inno-vate in recycling-process technology so as to meet recycling targets. Such incentives can be purely legislative or purely econom-ic, but work best as a combination of policy and profit.
■ Policy targets set for recycling must be set in ways that account for the loss of metals due to mixing, must not exceed physical, technological and thermody-namical limits, and should not prioritize one or two metals at the inadvertent ex-pense of other metals found in the input stream.
■ Computer-based-modelling of the recy-cling performance of products helps guid-ing product design that facilitates more recycling. It should be based on the reali-ties of how products and their constituents break up and separate in BAT recycling processes.
7.7.1 Creating the right conditions for optimal recyclingSeveral actions can help creating the right conditions, with policy playing a key role. They depend on participants and policy mak-ers taking a wider, systemic view of recycling, one that looks at the industrial and econom-ic factors driving recycling and can cope with complexity. Simplified approaches to recy-cling will not adequately support the drive to resource efficiency. Policy that only specifies desired recycling outputs will not be suffi-cient for attaining that result. Linear, one-dimensional, approaches cannot deal with
complex interactions between metals, mixing of waste streams, and the economics behind processes.
A Product-Centric approach to recycling is based on a good understanding of the phys-ics of materials in products. This allows si-multaneous consideration of the interactions of such materials, how and when they dy-namically vary, and the resulting economic value of recycled materials. This leads to the points enumerated in the following sections.
7.7.2 Industrial infrastructure and technology are essential
■ The use of certified BAT for the complete recycling chain is a key factor for positive results. The physics and economics deter-mining what is achievable with combina-tions of BAT, create the limits of what pol-icy can aim to achieve. Quantitative com-puter models, based on the physics and economics of BAT recycling, can serve for resolving complexity and guiding policy, superseding more simplistic material-flow-analysis approaches.
■ The infrastructure and expertise for pro-cessing waste into recycled metal is often the same as that for primary metal pro-duction. Therefore, the health of primary production in a mining region is of vital im-portance for recycling goals, fostering the required metallurgical systems knowledge. This balance will also help mitigating any cyclical disturbances affecting the prima-ry-metals industry.
■ The strength of the basic industries – the fabric of our society – is the foundation for maximizing resource efficiency as it contains the expertise that can provide solutions. To attract expertise and invest-ment, the significance of these industries for sustainability must be explained with a suitably inspiring narrative, supporting the sometimes dry and difficult physics under-pinning recycling. Public policies, whose cumulative effect makes any part of the basic industries uneconomic, will block the
177
Metal Recycling – Opportunities, Limits, Infrastructure
achievement of recycling and resource ef-ficiency goals.
■ Technology and know-how should be adaptive for dealing with the changing complexity of society. For instance, cur-rent pre-processing technology is often in-appropriate for increasingly miniaturized technology. The recycling system constant-ly needs new dismantling, cutting, sorting, and whole-product smelting technologies. As the change in products is much fast-er than the change in process equipment, processing must use much more adapt-able technology (which includes highly adaptive manual sorting). The modularity of recycling systems and product design can help here, as some pre-processing equipment could be moved to where scrap is being generated.
7.7.3 Economics of recycling ■ As recycling is an industrial activity, eco-
nomics are the main determinant for results. Policy plays a key role in shap-ing the economic incentives. Experience shows that where the economic incentives for collection by private (or public) opera-tors do not align with policy goals, signifi-cant resource volumes can be lost to ille-gal or informal recycling, such as ‘cherry picking’. Generally, this causes environ-mental problems – damage to health, wa-ter or climate – as regulatory standards are ignored.
■ A certified BAT recycling processing infra-structure, supported by metallurgical ex-pertise, will operate by itself for maximiz-ing the recovery of all valuable elements it receives, optimizing tradeoffs between quality and volume of metals in the output. Though the economic incentives usually already exist to do this, BAT is frequent-ly not in place, thus harming resource efficiency.
■ Policy can improve results if it focuses on promoting the adoption of BAT along the material and metal chain. It can provide the framework and innovative business
models that lead to adopting BAT in recy-cling systems, which can include help for offsetting losses from parts of the treat-ment process for EoL products.
■ Increasing the willingness of product manufacturers and their customers to use BAT recycled materials boosts the re-cycling market. It has the added advan-tage of consuming the least resources in their production.
■ For various minor elements, cross-boundary transport for processing at a “central” plant of sufficient size may be the answer when, at home, the economies of scale for recycling are not fulfilled.
7.7.4 Collection as part of the recycling system
■ Optimizing recycling requires secure and large volumes of waste, collected (or sorted) in ways that facilitate its metal-lurgical processing. Experience points to two factors as essential for better and sorted waste collection: 1) A capable col-lection infrastructure, and 2) Economic incentives for delivering waste to BAT op-erators, rather than to informal or illegal operators.
■ Where economic incentives exist, private operators often form collection infra-structures. In some cases, public-policy intervention may be needed to assist the creation or capacity building of such infra-structure, for example when setting up re-cycling systems for cell phones.
■ When waste ends up in areas where no or poor quality recycling takes place, the resources are often lost. It is thus very important to enlarge the scope of collec-tion and recycling infrastructure to areas where products have their final use, not only those of their first use. Responsibility for collection can then be shared between all stakeholders in the system in ways that best finance and increase the capabilities of collection systems in these areas.

178
Metal Recycling – Opportunities, Limits, Infrastructure
7.7.5 Design for resource efficiency ■ For optimal recycling, the industrial
wastes and End-of-Life product streams that enter processing should ideally be economically compatible with the met-al-production system. Their material and physical properties should allow the avail-able recycling infrastructure to separate out different valuable metals into high-pu-rity recycled metals.
■ Product design strongly affects the physi-cal properties of the waste stream, as do collection methods. Optimal recycling can therefore only succeed through increased physics-based Design for Recycling (DfR) or Design for Sustainability (DfS), which is better covered by the term Design for Re-source Efficiency that is more economics based with links to Product-Centric recy-cling. Here, product design is based on, or at least cognisant of, the limitations of the recycling BAT (as concisely reflected by the Metal Wheel). To achieve optimal de-signs for recycling and recycling systems demands good understanding of the limits imposed by physics, chemistry, thermody-namics and kinetics, as well as the tech-nological, economic and social barriers and inefficiencies encountered. However, functionality demands mean that this may not be possible, dictating that certain met-als and materials must be combined, ren-dering Design for Recycling inefficient and pushing Design for Resource Efficiency into the place of systemic driving force.
■ Computer models facilitate Design for Resource Efficiency. Like any engineering-process design model, they need a detailed basis in thermodynamics and the specific recycling techniques likely to be used. They should show sufficient detail and they are best based on predictions of how recycling techniques will separate metals in prod-ucts, for in turn predicting the quality and economic value of the output.
■ Data structures for the whole system must contain sufficient information to al-low calibration of detailed simulation and
Design for Resource Efficiency models. Only then is it possible to estimate grades of materials across the whole recycling chain.
■ Currently possible design changes can do much to improve recycling as many “criti-cal” elements are often intertwined in products to ensure complex product func-tionality. Optimizing recycling thus re-quires radical innovation in IT systems, maintaining functionality while maximizing recyclability.
■ If functionality demands of the product do not permit optimal design for recycling, such constraints should be recognized. In that case, policy should not set recycling rates that cannot be achieved.
■ Design for Recycling comes out of a de-sign perspective that looks at the im-pact of products over their life cycle, (LCM), and policy has a key role in as-sisting in the adoption of LCM by product manufacturers.

179
Metal Recycling – Opportunities, Limits, Infrastructure
7.7.6 Because of complexity no single recycling-rate values for metals
■ Due to product complexity and the in-herent randomness of metals separa-tion in recycling processes, no single op-timal recycling rate exists for metals in End-of-Life products. The same product, put through BAT, can produce different amounts of recycled metal (with differing quality) when driven by economics. Such results often show a statistical spread that is influenced by a host of different effects.
■ Picking an optimal recycling rate is, at best, specifying an average recycling rate that might be complemented by a stand-ard deviation defining the distribution of expected recycling rates. However, the shape of the distribution curve may be un-known due to this complexity. The distri-bution can even be multi-modal, question-ing whether a standard deviation describes the distributed recycling rates that will, in practice, result.
■ The use of material-based recycling-per-formance output metrics (mass, or a per-centage of a single metal within a waste stream) can be counterproductive, as it may ignore the complexity of recycling and its inherent tradeoffs between the different recycled-metal outputs from mixed waste streams. If used, they may cause the wastage of valuable metals; for example, a system focused on increas-ing recycled iron output is likely to lose the valuable and scarce metals shown in red in the Metal Wheel. This is particularly the case for more complex waste streams that have a large diversity of rapidly chang-ing compositions, as either product mix or product composition changes.
■ We must reconsider the current practice of using recycling rates of single metals, or of a percentage of product mass, as the Key Performance Indicator (KPI) of the re-cycling system. Approaches based on an understanding of the physics of recycling already exist, and can help refine and build on the Material (& Metal)-Centric indica-
tors for rendering them more Product-Centric (with an economic basis). Better results are achieved where this practice is complemented by indicators that better il-lustrate quality and range of metals result-ing from recycling.
■ Performance metrics can be based on the use of BAT and the economic value of BAT outputs. Economic output value is the in-dicator that best reflects whether the physical realities of the recycling process have been optimized. Although not a per-fect match for social goals, the summed value of recycled metal outputs from a process allows for whether the valuable metals were successfully recycled and for the quality (i. e. purity) of the metals. It complements a Product-Centric approach.
■ The economic value produced by BAT pro-cesses should be considered as a perfor-mance indicator. This would be the op-posite of a mandated performance tar-get to be achieved by industry. It would on the contrary be an indication whether the policy and industry have successfully cre-ated the conditions and incentive struc-tures that facilitate high performance. This would require policy actions across the system to overcome the bottlenecks that currently hold back optimized recycling.

180
Metal Recycling – Opportunities, Limits, Infrastructure
7.7.7 Education and information – high quality people and training
■ Research and educational infrastructure is critically important. It must be nurtured to preserve know-how, especially of the pro-cessing of the key metals, and ultimately drives innovation for maximizing resource efficiency. A large body of knowledge also exists in tacit form, as the accumulated ex-perience of knowledgeable people. This cannot be traded like a commodity, and is lost when industry sectors become too cyclical and unwisely shed knowledge for profit.
■ There is a need for extending the systems based approach to recycling knowledge, described in this document, and for capac-ity building in the use of BAT combinations for optimizing recycling output.
■ Market operations would be significantly helped when recycling operators can esti-mate future needs for recycling infrastruc-ture, by quantifying the "urban orebody", and defining its location and future waste flows. Policy can stimulate or assist work towards estimating the metals in market-ed products. The detailed composition of these products is also needed for use in physics-based process simulation tools that help choosing the best processing route for waste.
7.7.8 Policy processes should match the challenge
■ We indicate how the outcome of metals re-cycling is the result of a system of inter-actions, with upstream (e. g. design and collection) choices affecting the value of output, and the value of output influencing upstream behaviour. None of the recycling stages can be optimized in isolation. Op-timization of the system requires partici-pants to take a wider view of the system, and be motivated and able to communicate and work with other participants in other parts of the system.
■ Policy needs to create the conditions that facilitate and motivate this cooperation and communication, for instance between the product manufacturer and the recy-cling operator. Policy can remove the bot-tlenecks in a successful recycling system, such as a lack of capability in collection or in recycling.
■ This may be a change for some policy re-gimes. It certainly has implications for how policy is set. Policy makers will have to take into account the economics of the system, the motivations of designers, in-novators and collectors, forging a set of policies that deliver the above mentioned conditions.
■ This will only be possible where policy sets itself the goal to optimize the system as a whole rather than parts of it, and is formed through cooperation between policy mak-ers with expertise in industrial, environ-mental, innovation and local-government policy. Within policy circles, working struc-tures would need to be created that bring together such policy makers with common goals.

181
Metal Recycling – Opportunities, Limits, Infrastructure
8. Appendix A: Details on Recovery of Metals from Recyclates
This appendix provides an overview of the technologies used in metallurgical recovery of metals from recyclates and residues, rang-ing from steel to PWBs as well as TVs and other WEEE.
8.1 Separation methods
8.1.1 Manual sortingPeople are probably the best sorters due to the learning capability of the brain fed by all human senses and experience. This is true where there are visual differences be-tween materials and whilst their concentra-tion lasts. However, there are limits, i. e. an eye cannot read an RFID tag or bar code, but a machine can. Product design can prohibit manual sorting, by designing in components that cannot be separated by hand.
8.1.2 Automatic sensor-based sorting Automatic sorting with different detection systems can substitute for manual sorting. For example, a camera, used as a detector in combination with a computer (Figure 72), scans a product on a belt conveyor before
processing each frame by the computer. Af-ter processing and identification, for instance based on colour, the computer can activate air valves that shoot identified particles into collection bins.
Alternatively, a detector can consist of a transmitting coil, a U-shaped copper rod with pairs of receiving coils in the middle of a transmitter, or an XRT/XRF-device (Owada et al., 2011; Titech, 2012). This type of machine can detect over 99 % of all metal particles larger than 4 mm in an input stream and, de-pending on the settings, 95 % to 98 % of the metal will be removed. An electrical signal produced by receiver coils can also be pro-cessed in different ways to determine metals from non-metallic materials. The difference between stainless steel and non-ferrous met-als can also be determined.
8.1.3 Eddy Current separators Another form of sorting uses a magnetic field for separating materials that move off a con-veyor into a magnetic field. In these ‘Eddy Current' separators (Figure 73), particles P1 and P2 have different trajectories because of different rates of acceleration in the magnet-ic field. This variation is caused by the dif-ference in conductivity of the metals, hence creating stronger magnetic fields, or, more precisely, conductivity divided by density separates conductive lighter alloys (Al) from heavier alloys (Cu).
Figure 72:
Sensor based automatic
sorting for metal particles from a
mixture of glass, polymer, stone, etc. (from HSC
Sim 1974 – 2013).

182
Metal Recycling – Opportunities, Limits, Infrastructure
For example, at low frequencies of a chang-ing magnetic field, the acceleration of an alu-minium particle will be twice as much as that of a copper particle with the same dimen-sions. Poorly conducting materials, such as lead and stainless steel, will respond with a low acceleration to a changing magnetic field, whereas non-conductors, such as glass and plastics, will be accelerated at all by the magnetic field. Both permanent magnets or an electromagnet can generate the magnet-ic field.
8.1.4 Rising-current and hydrocyclone methodsIn the rising-current method, a continuous rising water column is projected through a pipe that receives the feed material. Mate-rial that sinks faster than the water column is rising falls to the bottom of the separa-tor. The material carried up by the column of water can be separated from the water by a screen or a sieve (Figure 74). A complication is that the water must be constantly cleaned from dissolved compounds.
Figure 73:
Eddy Current physics: light grey highly conductive
and light, white non-conductive,
and black slightly magnetic.
Magnetic field strength, rotation
speed, and positioning of
the two splitters, among others,
determine recyclate purity (from HSC Sim
1974 – 2013).
Figure 74:
Rising-current separator using
a rising water flow in a column to recover a light floating fraction
from a feed also containing heavy material
that drops to the bottom of the
water column.

183
Metal Recycling – Opportunities, Limits, Infrastructure
In hydrocyclone-separation, water or a heavy media suspension is made to rotate. As a re-sult, the larger and heavier particles move to the wall of the cyclone and then sink to the bottom (Figure 75). Lighter, or smaller, ma-terial will remain suspended and leaves the cyclone via the overflow or a vortex at the top of the cyclone. This method is widely used for cleaning coal and has also been adapted for separating metals.
Figure 75:
A hydrocyclone separating feed into light and a
heavy fractions.

184
Metal Recycling – Opportunities, Limits, Infrastructure
8.1.5 Sink-float methodsSink-float methods separate materials based on whether or not they float in liquid. For ex-ample, wood, insulation (paper, PUR foam, board, etc.) will float on water, and can be re-moved from the surface. The method is used in plastics separation, making use of the fact that PVC has a specific weight of > 1 g/cm3
(heavier than water) whilst other plastic types, such as PE, PUR, PP and PS, usually are < 1 g/cm3 (depending on whether or not they are in foam form) (Figure 76).
Sink-float methods can use water or another liquid, or a suspension of water and a solid material (e. g. FeSi) to vary the density of the liquid and adapting to which materials will float and sink. This variation is used particu-larly for the separation of shredded alumini-um and magnesium from a non-ferrous mix. Sufficient ferro-silicon (FeSi) or magnetite (Fe3O4) is added to water for making a con-stantly agitated suspension with a specific density of anywhere between 1.8 and 3.3 g/cm3. This enables, for instance, aluminium with a density of 2.7 g/cm3 to sink and mag-nesium with a density of 1.74 g/cm3 to float.
8.1.6 JiggingJigging is one of the oldest methods of sink-float separation. In a piece of equipment called a jig, input material is formed into a thick layer (or ‘bed’). This is fluidized by pul-sating a water current through it. On pul-sation the bed of input material is lifted as a mass; then, as the velocity of the water-stream decreases, the particles fall with dif-ferent speeds to the bottom, depending on their density. When this process is repeated, the different materials will stratify in relation to their density, and can be recovered accord-ingly.
This method is very similar to the rising-cur-rent separation process, but here the water jet is projected through the screen in puls-es. Jigging is used for separating shredded metals and particularly plastics from metals. The magnitude and direction of the water-jet force can be varied to change the separation result. A jig is generally used for concentrat-ing relatively coarse materials down to 3 mm. When the feed is fairly similar in size, it is not difficult to achieve a good separation at low cost.
Figure 76:
The heavy-medium
separator separates feed
into a heavy fraction that sinks
to the bottom of a rotating drum
that lifts it to the top where it discharges
onto a conveyor belt. The light
fraction floats on the separating
medium (water, FeSi slurry, etc.) and is collected and discharged
via the floats conveyor belt.
Cleaning of the float medium
creates a sludge that has to be
processed.

185
Metal Recycling – Opportunities, Limits, Infrastructure
8.1.7 Shaking tablesShaking tables use a controlled vibration and the property of particle density to separate materials.
8.2 Steel (Fe-C-X), high-Mn steel (austenitic Fe-Mn-X) and stainless steel (Fe-Cr-Ni-C-X) recycling (X are minor alloying elements for different steel types)Figure 77 shows the different routes for steel production and recycling. When smelting steel scrap in an Electric Arc Furnace, the energy intensity is reduced significantly. Kep-plinger (2009) gave an overview of the pre-sent status of bath smelting, such as COREX and other similar technologies that require no coke, while further alternatives that lower the carbon footprint are discussed by Orth et al. (2007).
Figure 78 makes clear that recycling and pri-mary production go hand-in-hand. In some cases, such as Tornio, the BAT ferro-chrome smelter is next to the stainless steel smelter and mill, producing high-grade products. The same situation is found next to the stainless steel smelter in Middelburg (RSA), where a 40 MW plasma ferro-chrome furnace produc-es liquid-charge chrome for use in the stain-less-steel plant, while the AOD converter also accepts stainless steel scrap. See also Nickel (2012) and ICDA (2012).
Figure 77:
Different process routes for
steelmaking. A comparison of the energy
requirements (GJ/t) of the
different routes are given on p. 80
(World Steel, 2011a).
LUMP ORE FINE ORE LUMP ORE FINE ORE
recycledsteel
rotary kilnfurnace
fluidizedbed
shaftfurnace
natural gas,oil natural gas
DRI
recycled steel recycled
steel
coal DR
pellets
EAF EAF
pellets
sinter coal
blast
O2
natural gas, oil or coal
recycledsteel
oxygen
BOF
hot metal
air
OHF
BF
Raw material preparation
Ironmaking
Steelmaking
Crude steel
coke
Alternative input
Source: worldsteel

186
Metal Recycling – Opportunities, Limits, Infrastructure
8.3 Copper-scrap recycling
An example that clarifies the concept of the Metal-Wheel is copper, the infrastructure of which is crucial for recycling many of the el-ements associated with copper, and which also appear in WEEE. Figure 42 and Figure 79 show that copper recycling takes place in ex-isting primary smelters, while Figure 80
shows some dedicated smelting facilities for recycling copper. The latter are, howev-er, always linked or associated with further refining capability that is based on the core competence of copper smelting and refining knowledge. See Copper (2012) for more infor-mation.
Figure 78:
The technology of stainless-
steel production (Johnson et al.,
2008).
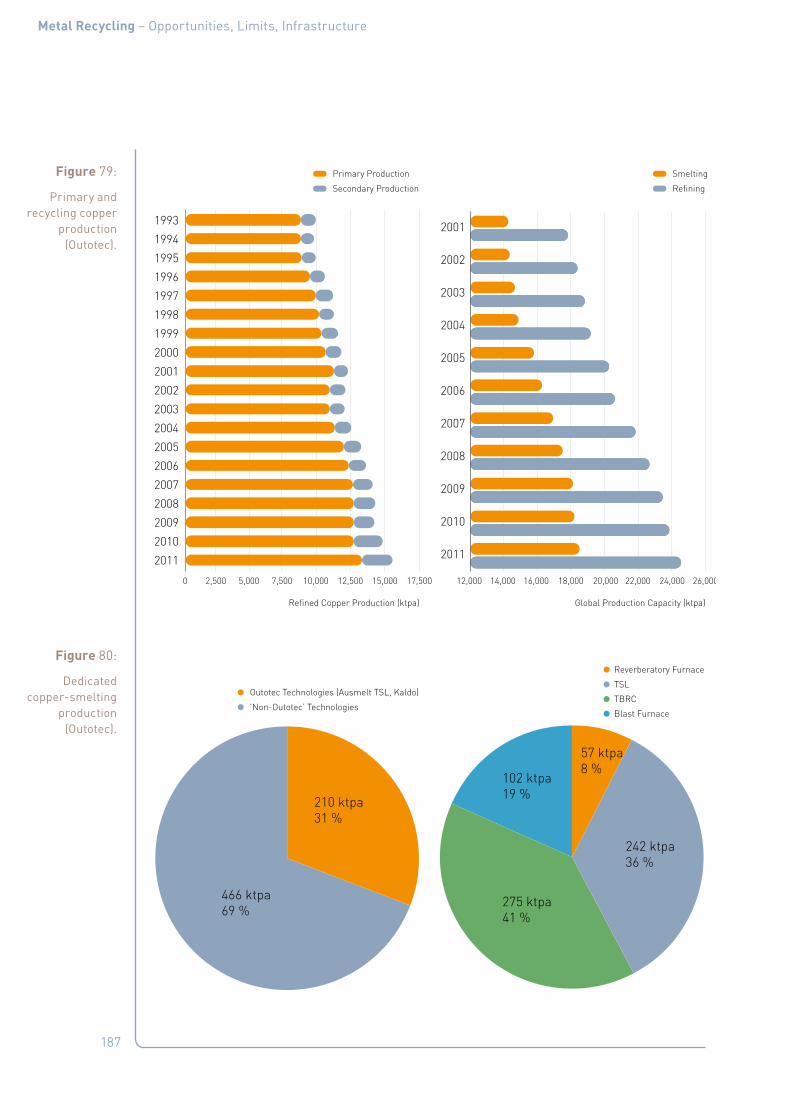
187
Metal Recycling – Opportunities, Limits, Infrastructure
Figure 79:
Primary and recycling copper
production (Outotec).
0 2,500 5,000 7,500 10,000 12,500 12,000 14,000 16,000 18,000 20,000 22,000 24,000 26,00015,000 17,500
Secondary Production
Primary Production
Refining
Smelting
Refined Copper Production (ktpa) Global Production Capacity (ktpa)
1993
1994
1995
1996
1997
1998
1999
2000
2001
2002
2003
2004
2005
2006
2007
2008
2009
2010
2011
2001
2002
2003
2004
2005
2006
2007
2008
2009
2010
2011
Figure 80:
Dedicated copper-smelting
production (Outotec).
’Non-Outotec’ Technologies
Outotec Technologies (Ausmelt TSL, Kaldo)
210 ktpa31 %
466 ktpa69 %
Blast Furnace
TBRC
TSL
Reverberatory Furnace
242 ktpa36 %
102 ktpa19 %
57 ktpa8 %
275 ktpa41 %

188
Metal Recycling – Opportunities, Limits, Infrastructure
8.4 Zinc-containing residues
When zinc metal is produced from primary sources, residues are created that still con-tain zinc and other valuable metals. Process residues that cannot be treated economi-cally are often dumped or stockpiled, but, as shown in section 2.2 there is a significant monetary value locked up in these interme-diate products. Table 23 summarizes the main components of a range of residues. To achieve a maximum recovery of these valu-able metals and to achieve a zero discharge of hazardous waste, some of these residues can be regarded as recycled sources of zinc, for example the neutral leach residue and the goethite precipitate.
It is obvious from Table 24 that all the metals and compounds in the zinc concentrate (as also shown on the Metal-Wheel) are recov-ered in the plant shown in Figure 21. Valua-ble elements, such as Ag, Co, In, Ge, Sb, etc., find their way among others into intermediate products such as jarosite and goethite. With the technology shown in Figure 21, these can be recovered. Such valuable contents are an incentive to treat old stockpiles and ponds, especially as environmental licenses often are not extended.
Table 23:
Typical analyses of zinc residues
(International Zinc Association,
2001 – 2002).
Material Neutral leach residue
Jarosite Goethite ISF slag Vertical re-tort residue
Zn % 16.9 5 10 6 3.6
Pb % 9.9 5.2 2 0.5 4.9
Fe % 28.9 25 40 35.4 11.2
S % 12.5 13 4 0.3 2.2
SiO2 % 6.1 3 2.5 17.8 18.3
Cu % 1.1 0.2 1.5 0.1 0.8
Cd ppm 8100 200 500 – –
As ppm 1800 600 2000 1000 6000
Ag ppm 1800 80 80 5 100
Sb ppm 1700 100 10 10 500
C % 0 0 0 0 32.2
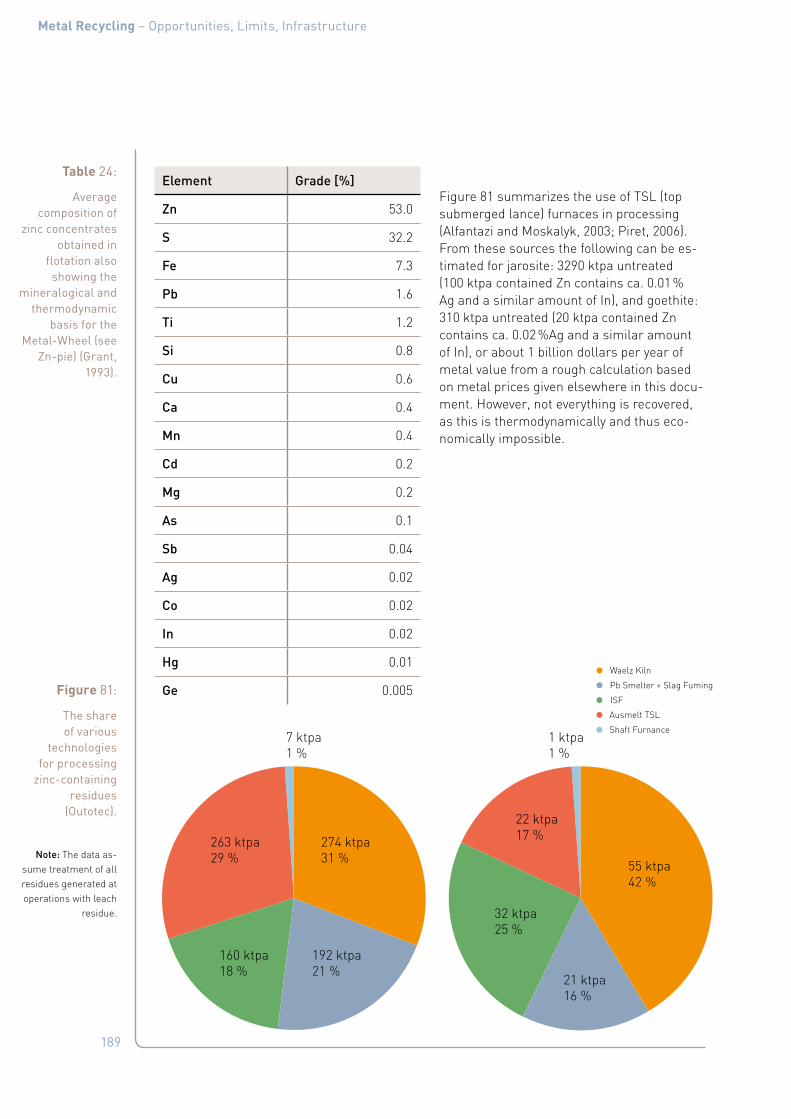
189
Metal Recycling – Opportunities, Limits, Infrastructure
Figure 81 summarizes the use of TSL (top submerged lance) furnaces in processing (Alfantazi and Moskalyk, 2003; Piret, 2006). From these sources the following can be es-timated for jarosite: 3290 ktpa untreated (100 ktpa contained Zn contains ca. 0.01 % Ag and a similar amount of In), and goethite: 310 ktpa untreated (20 ktpa contained Zn contains ca. 0.02 %Ag and a similar amount of In), or about 1 billion dollars per year of metal value from a rough calculation based on metal prices given elsewhere in this docu-ment. However, not everything is recovered, as this is thermodynamically and thus eco-nomically impossible.
Table 24:
Average composition of
zinc concentrates obtained in
flotation also showing the
mineralogical and thermodynamic
basis for the Metal-Wheel (see
Zn-pie) (Grant, 1993).
Element Grade [%]
Zn 53.0
S 32.2
Fe 7.3
Pb 1.6
Ti 1.2
Si 0.8
Cu 0.6
Ca 0.4
Mn 0.4
Cd 0.2
Mg 0.2
As 0.1
Sb 0.04
Ag 0.02
Co 0.02
In 0.02
Hg 0.01
Ge 0.005Figure 81:
The share of various
technologies for processing
zinc-containing residues
(Outotec).
Note: The data as-sume treatment of all residues generated at operations with leach
residue.
Shaft Furnance
Ausmelt TSL
ISF
Pb Smelter + Slag Fuming
Waelz Kiln
274 ktpa31 %
7 ktpa1 %
1 ktpa1 %
192 ktpa21 %
160 ktpa18 %
263 ktpa29 % 55 ktpa
42 %
22 ktpa17 %
21 ktpa16 %
32 ktpa25 %

190
Metal Recycling – Opportunities, Limits, Infrastructure
Of special interest here is the recovery and recycling of indium in the residues as shown in the flowsheet of Figure 21. The economic value of indium (ca. $ 500/kg av 2012 peaking above $ 800/kg mid 2011) renders the recov-ering indium from such residues a lucrative affair.
8.5 EAF dust and other Pb, Zn, Cu containing residues
When steel scrap is processed in an Elec-tric Arc Furnace, about 15 – 20 kg of dust is formed per tonne of steel, which for the 2010
steel production translates to 5.2 to 7 million tpa EAF dust being produced. Table 25 and Table 26 summarize the composition of EAF dust and other zinc and lead containing resi-dues. Due to economic reasons, relatively low landfill costs of Waelz-kiln slags, and rela-tively low zinc and lead metal prices, the Wa-elz kiln (Figure 82) is still the preferred route for processing EAF dust into a Waelz-oxide and other products as shown in Table 26. The produced Waelz-oxide is processed in a zinc plant (e. g. Figure 21) to LME grade zinc. This underlines the fact that metal recycling is op-timal if a primary metallurgical infrastructure is available.
Table 25:
Typical Zn and Pb containing recycled raw
materials (Schneider et al.,
2000).
Filter cake Cupola furnace
Dust from copper and brass industry
Dust Cupola furnace
EAF dust Lead dust
Zinc-lead oxide
Neutral leach residue
Zn 31 43 31 23 2 44 18
Pb 3 20 0.1 1.3 68 15 7
Cu 0.2 3 – 0.1 – 0.4 1.6
C 11 0.6 5 2 2 0.6 0.2
FeO 10 0.6 23 35 5 4 33
SiO2 15 1 1.3 1 – 1 3
Cl 0.4 5 0.5 0.6 0.2 4 –
H2O 45 0.3 0.4 10.6 10.4 1.8 30Figure 82:
Waelz kiln for the processing of EAF
dust (Ullmanns, 2005).
(a/b) Zn containing feed (c) Waelz rotary kiln
(picture) (d) Burner
(e to i) Slag processing (k to n) Oxide processing
(o) Electrofilter (p) Waelz-oxide
transport (r to s) Blower/Stack

191
Metal Recycling – Opportunities, Limits, Infrastructure
Figure 83 shows the main reactions that take place in the slowly rotating Waelz kiln, which can be over 100m long. The reduced Zn, due to its high vapour pressure, is volatilized as Zn-gas and then burned, forming ZnO pow-der that is collected in a filter as shown in Figure 82. The burning zinc liberates heat that is a major part of the heat balance of the kiln. Similarly, other metals such as Pb, Cd and Ag (if present in other residues also fed into the furnace) are volatilized as well and collected in the flue dust.
Figure 83:
The main reactions in a Waelz kiln
(International Zinc Association,
2001 – 2002).ZnO + CO2
Zn + CO
Reactions in the gas phase
Zn + ½ O2 > ZnOCO + ½ O2 > CO2
ZnO + CO + O2 > ZnO + CO2
Escaping CO gas and Zn vapour
Reactions in the charge (Reducing)
ZnO + CO > Zn + CO2 FeO + C > Fe + COCO2 + C > 2CO CO2 + C > 2CO
ZnO + CO > Zn + CO2 FeO + CO > Fe + CO2
ZnO + FeO + C
Table 26:
Typical analyses of the raw
materials and products of
a Waelz kiln (Meurer, 2010).
EAF dust Slag Waelz oxide Leached Waelz oxide
Zn 18 – 35 0.2 – 2.0 55 – 58 60 – 68
Pb 2 – 7 0.5 – 2 7 – 10 9 – 11
Cd 0.03 – 0.1 < 0.01 0.1 – 0.2 0.1 – 0.3
F 0.2 – 0.5 0.1 – 0.2 0.4 – 0.7 0.08 – 0.15
C 1 – 5 3 – 8 0.5 – 1 1 – 1.5
FeO 20 – 38 30 – 50 3 – 5 4 – 7
Fe(metallic)/Fe 80 – 90
Basicity basic 1.5 – 4.0 acid 0.2 – 0.5

192
Metal Recycling – Opportunities, Limits, Infrastructure
Table 27 gives some additional zinc resi-dues and materials that can be processed to produce metals. High-grade materials can be remelted directly to produce brass and bronze products.
While the above represents the processing of most EAF dust and other zinc-containing ma-terials, other processes such as the Meretech also are available. This process recovers for example 99 % pure zinc powder that can be remelted for galvanization.
8.6 Red-mud from alumina production
Similar to the zinc industry, which has to cope with jarosite, goethite and even a plant with haematite residue, the aluminium in-dustry has to deal with its red-mud prob-lem. Worldwide bauxite residue disposal ar-eas contain an estimated 2.7 billion tonnes of residue (Figure 84), increasing by approxi-mately 120 million tonnes each year (Klau-ber et al., 2011a, b). The world resources of gallium contained in bauxite are estimated in excess of 1 billion kga, or around 0.03 % on average.
a This equates to US $ 300 billion @ ca. US $ 300/kg (end of 2012), if recovered fully (but this obviously economically, technologically and thermodynamically not possible).
Table 27:
Composition of major zinc drosses and
ashes (James, 2000).
% Zn % Pb % Fe % Cl % Al
Galvanizing dross 92 – 94 1.0 – 1.6 1 – 3 – –
HD galvanizing ash 60 – 75 0.5 – 2.0 0.2 – 0.8 2 – 5 –
Cont. galvanizing ash 65 – 75 0.1 – 0.5 0.2 – 0.8 0.5 – 2 0.1 – 0.5
Die-casting dross 90 – 94 0.1 – 0.2 low – 1 – 7
Sal skimmings 45 – 70 0.5 – 2.0 0.2 – 0.8 15 – 20 –
Brass fume 40 – 65 0.5 – 7.0 1 – 2 2 – 7 –
Die-casting ash 55 – 60 0.1 – 0.2 low low 3 – 10
Ball mill ash 55 – 65 0.1 – 1.0 0.2 – 0.8 2 – 5 –
Zinc dust/Overspray 92 – 95 1 – 2 0.1 – 0.5 – –

193
Metal Recycling – Opportunities, Limits, Infrastructure
This residue affects its image and limits its processing possibilities as environmental li-cences are increasingly difficult to obtain, ei-ther for expanding existing red-mud ponds or for creating new ones. As long as landfill costs remain low and the aluminium indus-try does not collectively tackle the problem, processing of this material will remain a po-litical issue and nothing will be done. The reasons for treating these materials will be: (i) If politics forces it; (ii) If landfill costs in-crease to a point where they financially hurt alumina-plant operators; or (iii) If plants are threatened with closure or if elements such as the contained gallium become worthwhile. Furthermore, another catastrophic and much published failure of ponds may further tar-nish the industry; and could catalyse a global action to clean up the image of the alumini-um industry.
0
20
40
80
60
100
19921990 1994 1996 1998 2000
120
140
0
500
1000
1500
2000
2500
3000
0
20
40
80
60
100
19921990 1994 1996 1998 2000
120
140
0
500
1000
1500
2000
2500
3000
residue Production rate (Mtpa) culmulative residue (Mt)culmulative residue (Mt)
cumulative inventoryannual residue production
Figure 84:
Red mud production
and inventory (Klauber et al.,
2011a, b).
sodalite, cancrinite, dawsonite, tricalcium aluminate, hydrocalumite, boohmite, Al-sub. FeOx, gibbsite (minor), diaspore (minor)
sodalite, cancranite, quartz
rutile, anatase, perovskite, ilmenite
calcite, perovskite, whewelite, tricalcium aluminate, hydrocalumite
sodalite, cancranite, dawsonite
water, oxalate, flocculants & other organics
hematite, goethite, magnetite
Al2O3
α-Fe2O3
α-FeOOH
Fe3O4
SiO2
TiO2
CaO
Na2OLOl
Figure 85:
Various patents for the processing
of red mud (Klauber et al., 2011a; 2011b).
other
recovery of minor elements
gas scrubbing agent
soil amendment or production
steel making & slag additive
recoveryof major metals (Fe, Ti, Al, Na)
waste & water treatment
ceramics, plastics, coatings or pigments
catalyst support or adsorbent
civil & building construction
minor additive in various processes
194
Metal Recycling – Opportunities, Limits, Infrastructure
Several attempts were made in the past to recycle and process red mud as shown in Figure 85. Many of the investigations aimed at extracting the iron, titanium or aluminium, but several attempts were also made to re-cover scarce/critical/valuable elements, such as rare earths (Luidold and Antrekowitsch, 2011). For example, the lowermost parts of some bauxite deposits of the third horizon of the Parnassos-Ghiona area in Greece showed an outstanding total lanthanide concentration of up to 1 % (Ochsenkühn-Petropulu et al., 1996). However, no information is available on the general content of elements in small-er quantities in red mud and, even today, the dumping of red mud is cheaper than its pro-cessing. Due to the currently very high prices of rare earth elements, the combined recov-ery of iron, titanium and REEs might drive an economic process. Basically, the technology exists for the recycling of metals from resi-dues, but efforts must be made for a better cross-linking between the individual pro-cesses. For example, the exclusive recovery of tungsten from Tu-containing residues may not be economic, like the extraction of tita-nium from red mud or the exclusive recycling of indium from flat screens.
In addition, red mud can contain up to 10 % by weight TiO2 as well as chromium, vana-dium and zirconium, each over 1000 ppm, as well as traces of scandium, yttrium, gallium and other rare earth elements. Recently, re-search was done to use strongly alkaline red mud as an adsorbent for acid wastewaters to minimize their heavy-metal content. This can lead to higher chromium contents of the material, if it is used for neutralizing acidic-chromium-containing effluents from electro-plating shops. Reprocessing of such charged red mud is thus potentially economic due to its solving problems with contaminated ef-fluents, after which it can be used as an inert additive for cement, concrete or other build-ing materials, thus saving large landfill vol-umes.
Red mud can for example be melted in a TSL Furnace (Figure 60) to produce a benign slag or pig iron, as well as fuming off the Ga, which might favourably change the econom-ics. But even then, the low landfill costs are a redoubtable adversary of applying such tech-nically feasible and environmentall desirable processes.
8.7 Residues from oil shale processing
Depending on the carbon content of the resi-dues from oil shale, these could be very well smelted in a TSL furnace. Crucial is the ener-gy balance, however. Power generation by the high-pressure steam from offgas could use-fully offset the smelting costs that will pro-duce a benign slag and possibly also pig-iron.
8.8 Sludges from water processing
Figure 60 shows the link between product re-cycling and water processing. Some inter-esting elements such as phosphorus can be recovered from water-treatment sludge. Es-pecially in view of the severe problems that phosphorus (eutrophication – kg-PO4 equiva-lent) can cause to nature, it is imperative that these sludges, animal materials, etc., are re-cycled for recovering the phosphorus. About 2 g P/person/day is emitted through sewage, which amounts to around 328,500 tpa. This in itself is a significant resource!

195
Metal Recycling – Opportunities, Limits, Infrastructure
8.9 Slag cleaning
Slag cleaning is general practice and various technologies such as TSL and electric fur-naces can be used for this. However, this is once again totally dependent on the econom-ics surrounding the slag to be treated. Smelt-ing technology, such as for recovering cobalt and copper from granulated slag with subse-quent processing of the copper-cobalt matte, is general practice and hence a good exam-ple of dealing with pyro- and hydro-metal-lurgy at the same time for optimizing Re-source Efficiency. Figure 21 shows that slags can also be cleaned with TSL technology, the advantage being that it can also recover in-dium, silver, germanium, etc., rendering the slag benign for use as building material as has been done for many years by Korea Zinc (South Korea). In addition, interesting new developments recover heat from slag (Fig-ure 86).
8.10 Shredder fluff (floc/residue) treatment
This fraction, shown in Figure 87 as well as in Table 28, is an extremely dangerous recy-cling issue due to its complexity. TSL technol-ogy is well suited to handle this, using it as a secondary or refuse-derived fuel for lowering the TSL carbon footprint. However, such resi-dues have a large compositional range that is a function of the shredder-feed type, of how the plant is run, what are the products, etc. It succinctly shows how diverse the EoL goods are that are fed into the plant, as well as the different operation modes of plants produc-ing this diverse range of materials called au-tomotive shredder residue (ASR).
Figure 86:
Dry granulation of slag with heat recovery shown
here for blast-furnace slags
(Jahanshahi et al., 2011).

196
Metal Recycling – Opportunities, Limits, Infrastructure
a) Composition, as w % of ASR, according to the origin: light fluff.
Figure 87:
Simplified view of a recycling
plant (including extensive PST
processing) where 1153 cars
were recycled, showing a
generalized composition
of a fluff after extensive
treatment (Reuter et al., 2005;
Reuter and van Schaik, 2012a&b).
Table 28:
Composition of ASR light
and heavy fluff for different
operators (Numbers in
brackets refer to references in
Vermeulen et al. 2011).
Light fluff a
[26] [27] [30] [47] [158] [159] [165]
Metals 1 – 1.7 21 8.8 2.5 3.7 0.3
Wire 2.9 – 3 4.7 1 2.2 0.5
Rubber 3.8 – 4 3.1 2.6 3 8.8 10.3 4.1
Textile 27.5 – 29.5 36.1 32.5 26.2 8.3 7.9
PUR foam 6.6. – 20.6 35.3 8 3.8
Plastic 16.1 – 24.1 31.8 11.7 9 46.1 11.0 8.7
Wood 0.03 – 0.4 1 2.7 0.6
Paper 0.8 – 1.0 0.8
Soil/sand 6.4 – 21.6 4.3
Glass 0 2.3 43 (minerals)
Others 2.7 – 6.2 0.8 5.2 69.5 (< 10 mm)
75 (fines)

197
Metal Recycling – Opportunities, Limits, Infrastructure
a) Composition, as w % of ASR, according to the origin: heavy fluff.
Table 28_b:Heavy fluff a
[26] (stainless steel + heavy)
[27] [47] [159] [165]
Metals 0.2 – 1.4 1.6 5 0.7
Wire 7.0 – 12.7 3 0.7
Rubber 14.1 – 17.3 9.3 55 43.7 44.8
Textile 7.7 – 11.6 3 10.5 10.5
PUR foam 0.9 – 2.8 3.3
Plastic 23.8 – 30.9 8 19 32.6 29
Wood 0.06 – 0.7 7 4.7 5.6
Paper 1 – 2.5
Soil/sand 7.6 – 12.3 8 (minerals)
Glass 8.3 – 11.0 9.4
Others 4.6 – 14.0 7.8 6.1 (fines)

198
Metal Recycling – Opportunities, Limits, Infrastructure
Table 29 gives a typical breakdown of costs around an ELV shredder, albeit for ca. 2006 data. It gives a feel for what affects the profit-ability of such a physical recycling facility.
Table 29:
A typical cost breakdown of an
ELV dismantler (Ferrão and
Amaral, 2006).
Shredder
Working time (h/year) 2317
Total shredded scrap (t/year) 69,500
ELV (%) 44 %
Light industrial scrap and appliances (%) 56 %
Building costs (1/year) 113,446
Equipment costs – shredder mill, non ferrous separator, cranes, other (1/year) 374,299
Labor – workers, maintenance technicians and manager (1/year)
Workers (7 in shredder A and 6 in shredder B) 110,880
Maintenance technicians (2 for both shredders) 39,600
Manager (1 for both shredders) 39,600
Maintenance, insurances and electricity (1/t) 7,7
SR landfill cost (1/t) 44,5
Cost of hulk acquisition (1/t) 46
Revenues from sale of shredded metallic scrap (1/t)
Ferrous 120
Mix of non ferrous metals (Al, Cu, Zn) 250
Cost of transporting materials (1/t)
Compacted hulks from dismantler to shredder 4,1
Ferrous metals for recycling 4,1
Mix of non ferrous metals for recycling 25
ASR to landfill 4,1
Shredder metallic scrap separation efficiencies
Ferrous 0,96
Non ferrous metals (Al, Cu, Zn) 0,25

199
Metal Recycling – Opportunities, Limits, Infrastructure
8.11 Incinerator bottom ash – aluminium recycling
In 2009, IAI and EAA presented a study by Pruvost (2011) about “The European Potential for the Collection and Recycling of Used Alu-minium from Bottom Ashes” (European Alu-minium Association, 2006).
8.11.1 Municipal solid waste contains around 1 % aluminiumBased on MSW sample analyses, CEWEP (Coalition of European Waste to Energy Plants) estimates an average metallic and non-metallic aluminium (Al) content in MSW sent to WtoE plants of 1 % or a bit more, which is therefore the maximum amount that can be transferred to bottom ash as metallic aluminium. It is estimated that between 50 to 75 % of this comes from aluminium packag-ing, though this number varies from country to country. This depends on the aluminium packaging mix (high per capita usage, large market share of aluminium cans) and the ef-ficiency and/or structure of the local col-lection schemes. For example, in countries with dedicated can collection schemes (e. g. deposits) the share of aluminium packag-ing probably is lower, while non-packaging sources (e. g. kitchen utensils, doorknobs, etc.) become more dominant. MSW also in-cludes aluminium from non-household sources, such as small- and medium-sized businesses, shops, restaurants, etc. Finally, aluminium appears as a chemical element in waste as part of chemical compounds in other materials, in dust, demolition debris, or street waste.
8.11.2 Waste treatment in WtoE plants will increase by 60 % or more within the next 15 yearsFor both practical as well as methodologi-cal reasons (a full mass balance creates too many uncertainties), the study focuses on the actual extraction of non-ferrous metals from bottom ashes, and the potential growth of this sector, assuming three key parameters:
■ Non-ferrous metals extraction from all bottom ashes (which is not the case today!).
■ A significant increase of WtoE during the next 10 – 15 years.
■ An increasing use of improved sorting techniques and new processing methods.
Based on these assumptions, waste treat-ment in WtoE plants of the EU-27 should at least increase by 62 % (from 60 to 97 million tonnes) between 2006 and 2020, and even by 100 % in a more ambitious scenario, assum-ing that the remaining landfill of residual MSW will be fully replaced by recycling and WtoE in a ratio of 60 to 40.
8.11.3 Technological innovation will generate higher extraction yieldsThe main separation tool, the Eddy Current (EC) machine is increasingly (re-)designed so as to extract metals from specific bottom-ash grain sizes. This should result in higher aluminium extraction levels within the fine grainsize fraction (below 5 mm). New con-cepts of EC machines and of alternative sort-ing systems (sensor-ejectors) further stimu-late the race for improved yields.
In addition, major adjustments in the flowsheets of processing plants are being ap-plied on an industrial scale. This includes the removal by strong magnets of all ferrous ma-terial (in addition to iron and steel) ahead of the EC machine, segregation in two or three grain sizes, washing of bottom ash during classification and, last but not least, dry cool-ing of bottom ash instead of using a water box. This will lead to higher extraction levels and a higher quality of the non-ferrous met-als extracted.
200
Metal Recycling – Opportunities, Limits, Infrastructure
8.11.4 Potential increase of aluminium metal extraction of 80 kt (present) to 250 kt in 2020Based on field research, interviews and sta-tistical data, it is estimated that in 2006 about 130 kt of non-ferrous (NF) metals (gross weight) were extracted from bottom ashes in the EU-27 (+EFTA countries). The aluminium content of this NF metals fraction is relative-ly stable and ranges between 50 % and 75 %, 60 – 65 % being the most likely figure. Other NF metals, such as copper, zinc, brass and some stainless steel represent a small per-centage, while stones, dust, slags, etc., could mount up to 25 %, depending on the treat-ment process. Therefore, the aluminium metal extracted in 2006 was estimated to be about 80 kt.
If all bottom ash had been processed with the basic technology available in 2006, the to-tal tonnage of the NF metals fraction would have been around 175 kt. The combined re-sult for 2020 of the three parameters of sec-tion 8.11.2 should be double or triple these figures:
■ 280 kt of NF fraction within a modest of WtoE development scenario with standard technology, assuming that all bottom ash will be processed for NF metals extraction.
■ 420 kt if we assume that the improved sorting equipments and optimized flowsheets will be in place in most pro-cessing plants and certainly all new ones, for an overall 50 % increase in extraction levels.
■ 510 kt, within the ambitious forecast for WtoE with improved sorting.
This would lead to a potential aluminium-metal extraction of 170 to 300 kt, probably close to 250 kt.
Extraction of aluminium (and other NF met-als) can be highly profitable. With price rang-es from 300 1/t to 1000 1/t or more, the value of NF metals fraction per tonne of bottom ash is significantly higher than the ferrous metal value (whose prices strongly varied in recent times, from a high at 278 1/t to a low of 8 1/t).
It is difficult to indicate a profitability for the EC machine alone as its efficiency depends on the preliminary treatment of the bottom ash, the ferrous-metal extraction, the grain-sizes treated or not treated, etc., as well as on the whole set-up of the bottom-ash treat-ment plant. However, most operators men-tion a payback period of maximum two years and some refer to a “break-even price” of 400 – 500 1/t for the NF metals fraction.
Box 21: AEB AmsterdamWaste-to-Energy plants (Stehlik, 2009; Münster and Lund, 2010) do not incinerate every-thing. Citing from AEB Amsterdam (AEB Amsterdam, 2012) 1000 kg of waste yields ap-proximately:
■ 850 kWh electricity
■ 5 kg aluminium, stainless steel, zinc, lead, copper, silver and gold
■ 25 kg iron
■ 120 kg clean sand and silt (from the pilot plant)
■ 100 kg pottery, glass and granulate
■ 7 kg salt, 5 kg gypsum and 5 kg non-reusable material from flue gas

201
Metal Recycling – Opportunities, Limits, Infrastructure
8.12 Recovery of recycled phosphorus
Phosphorus (P) management poses signifi-cant sustainability challenges (Abelson, 1999; Christen, 2007). P is supplied to arable land in both mineral and organic forms for food and biomass production, but is taken up by animals and plants with limited degrees of efficiency. At the global level, non-agricultur-al use of P represents less than 10 % of total P demand (Food and Agriculture Organiza-tion, 2011). It is important to note that a sub-stantial dissipation of P occurs in metal pro-duction as well. In the steel making process, P occurring in iron ore is removed from the melted metal as dephosphorization slag. In Japan, for instance, the amount of P ending up in dephosphorization slag is equal to the total phosphate ore import (Figure 88).
The main components of dephosphorization slag are CaO, FeO, SiO2, and P2O5. Figure 88, obtained by an energy-dispersion-type elec-tron-probe micro-analyzer (EPMA), shows
the structure and phosphorus distribution among the phases precipitated in a sam-ple of dephosphorization slag (Yokoyama et al., 2007). The white parts in the upper right-hand picture show high phosphorus concen-trations, but no FeO. Depending on the total slag composition, phosphorus in slag can be segregated as solid solutions of calcium phosphate and dicalcium silicate (Futatsu-ka et al., 2004). This phosphorus-enriched crystal phase generally contains about 3 to 10 mass percent P, depending on operating conditions. The black parts in Figure 89 con-sist mainly of FeO-CaO-SiO2, almost without phosphorus. Because these two phases have different magnetic properties, they can be separated by a strong magnetic field (Yokoy-ama et al., 2007). The proposed P-recovery technology from steel-making slag would result in significant recovery of this valuable resource (Figure 22). Furthermore, by re-
turning the iron-rich residues to the sinter-ing, hot-metal desiliconization, and hot-met-al dephosphorization processes, the input of raw materials such as CaO and the genera-
Figure 88:
Economy-wide flow of
phosphorus in Japan for the
year 2000 (kt-P) (Matsubae-
Yokoyama et al., 2009&2010).
173.52 103.21
151.32 151.32
400.52
375.71
155.92 155.92
110.56
218.84
22.85
110.56
156.50 112.54
88.16
23.89
24.36
145.20
53.81
16.12
14.87
39.58
43.33
91.57
17.48
42.51
93.07
4.70
Food & Feed
Fertilizer
Chemical substance
Phosphate ore
Domesticproducts
Otherindustry
Other mineral resources
Iron and steelindustry
Slag
Steel
Products/byproducts
Fertilizer Farm/Ranch
Chemicalindustry
Human
Sludge
Landfill
Livestock Miscellancous drainage
River/Coast area
Soilaccumulation
Trade/Fishery

202
Metal Recycling – Opportunities, Limits, Infrastructure
tion of slag can also be reduced (Kubo et al. 2010; Matsubae-Yokoyama et al., 2009&2010).
Figure 89:
EPMA image of dephosphorization
slag (FetO = 19 %, CaO/SiO2 = 4.4 %,
P2O5 = 2.8 %) (Mat-subae-Yokoyama
et al., 2009&2010).
Fe
Solid solution of 3CaO・P2O5 - 2CaO・SiO2
Other phases (mainly FeO-CaO-SiO2 )
(mass%)
80µm
P
Si Ca
(mass%)
(mass%) (mass%)
96
0
48
6
0
3
16
0
8
76
0
38
Figure P3. EPMA mapping image of a dephosphoriza8on slag (FetO = 19%, CaO/SiO2 = 4.4, P2O5 = 2.8%) supplied by a Japanese steelmaking company.
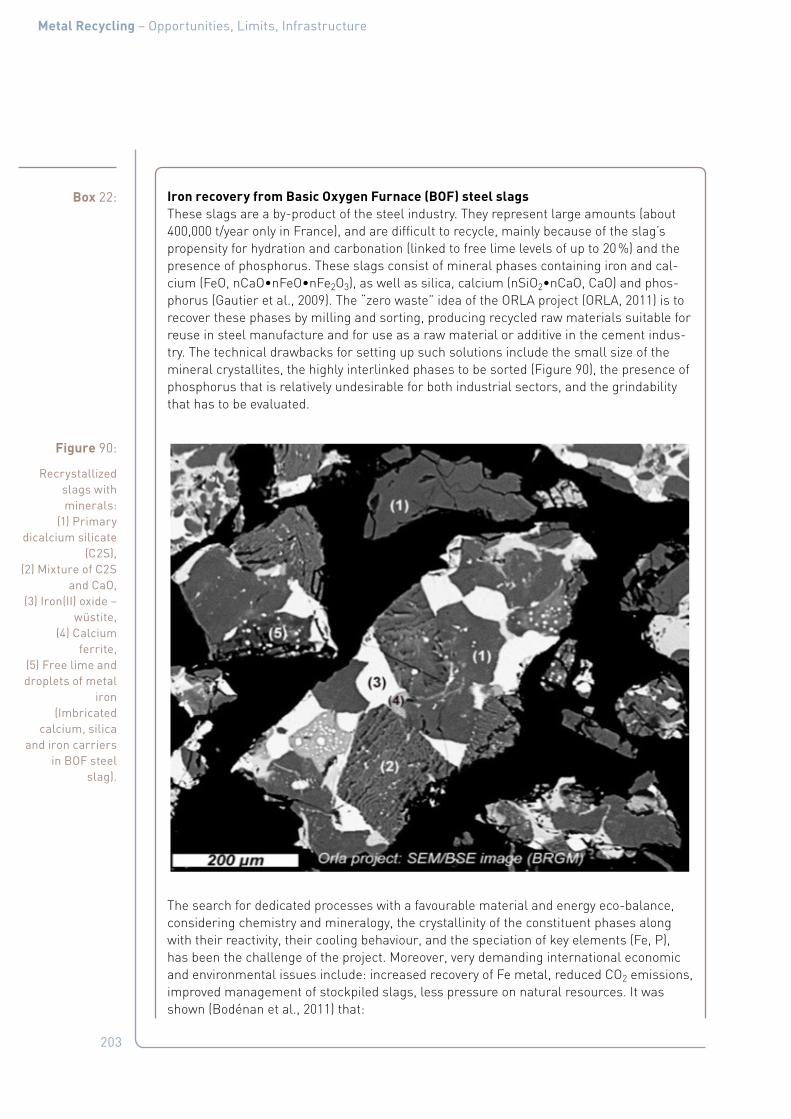
203
Metal Recycling – Opportunities, Limits, Infrastructure
Box 22: Iron recovery from Basic Oxygen Furnace (BOF) steel slagsThese slags are a by-product of the steel industry. They represent large amounts (about 400,000 t/year only in France), and are difficult to recycle, mainly because of the slag’s propensity for hydration and carbonation (linked to free lime levels of up to 20 %) and the presence of phosphorus. These slags consist of mineral phases containing iron and cal-cium (FeO, nCaO•nFeO•nFe2O3), as well as silica, calcium (nSiO2•nCaO, CaO) and phos-phorus (Gautier et al., 2009). The “zero waste” idea of the ORLA project (ORLA, 2011) is to recover these phases by milling and sorting, producing recycled raw materials suitable for reuse in steel manufacture and for use as a raw material or additive in the cement indus-try. The technical drawbacks for setting up such solutions include the small size of the mineral crystallites, the highly interlinked phases to be sorted (Figure 90), the presence of phosphorus that is relatively undesirable for both industrial sectors, and the grindability that has to be evaluated.
The search for dedicated processes with a favourable material and energy eco-balance, considering chemistry and mineralogy, the crystallinity of the constituent phases along with their reactivity, their cooling behaviour, and the speciation of key elements (Fe, P), has been the challenge of the project. Moreover, very demanding international economic and environmental issues include: increased recovery of Fe metal, reduced CO2 emissions, improved management of stockpiled slags, less pressure on natural resources. It was shown (Bodénan et al., 2011) that:
Figure 90:
Recrystallized slags with minerals:
(1) Primary dicalcium silicate
(C2S), (2) Mixture of C2S
and CaO, (3) Iron(II) oxide –
wüstite, (4) Calcium
ferrite, (5) Free lime and droplets of metal
iron (Imbricated
calcium, silica and iron carriers
in BOF steel slag).
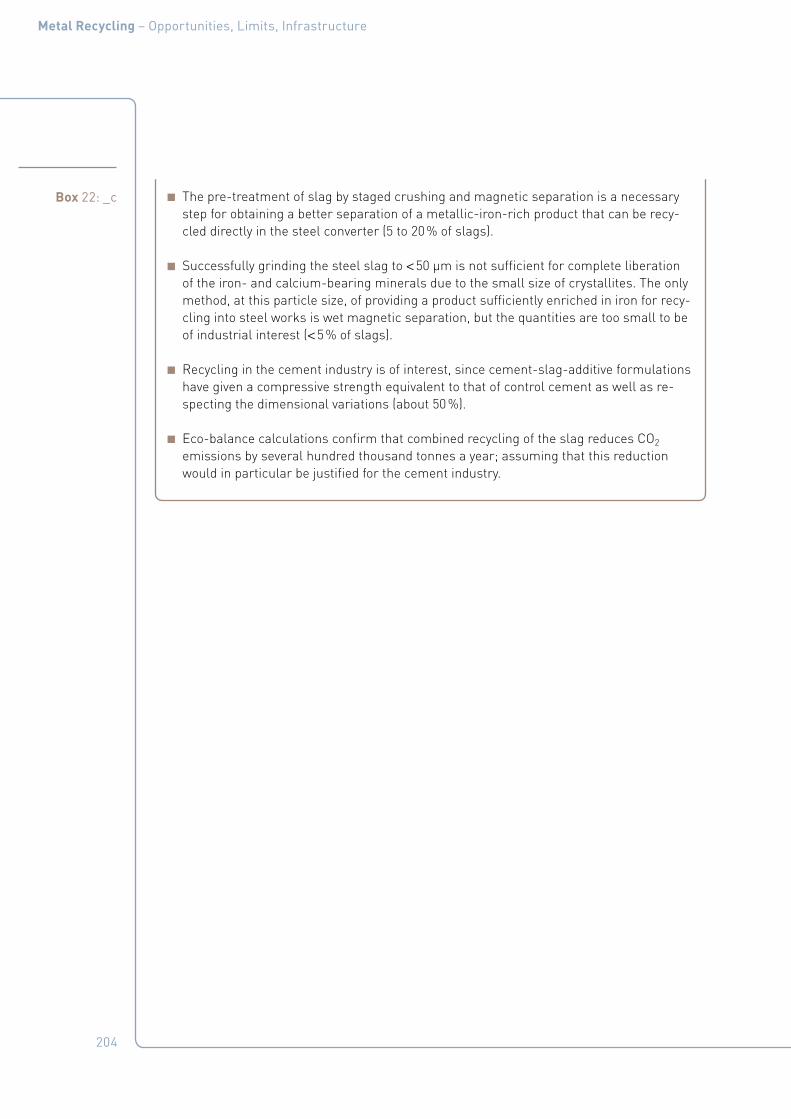
204
Metal Recycling – Opportunities, Limits, Infrastructure
Box 22: _c ■ The pre-treatment of slag by staged crushing and magnetic separation is a necessary step for obtaining a better separation of a metallic-iron-rich product that can be recy-cled directly in the steel converter (5 to 20 % of slags).
■ Successfully grinding the steel slag to < 50 µm is not sufficient for complete liberation of the iron- and calcium-bearing minerals due to the small size of crystallites. The only method, at this particle size, of providing a product sufficiently enriched in iron for recy-cling into steel works is wet magnetic separation, but the quantities are too small to be of industrial interest (< 5 % of slags).
■ Recycling in the cement industry is of interest, since cement-slag-additive formulations have given a compressive strength equivalent to that of control cement as well as re-specting the dimensional variations (about 50 %).
■ Eco-balance calculations confirm that combined recycling of the slag reduces CO2 emissions by several hundred thousand tonnes a year; assuming that this reduction would in particular be justified for the cement industry.
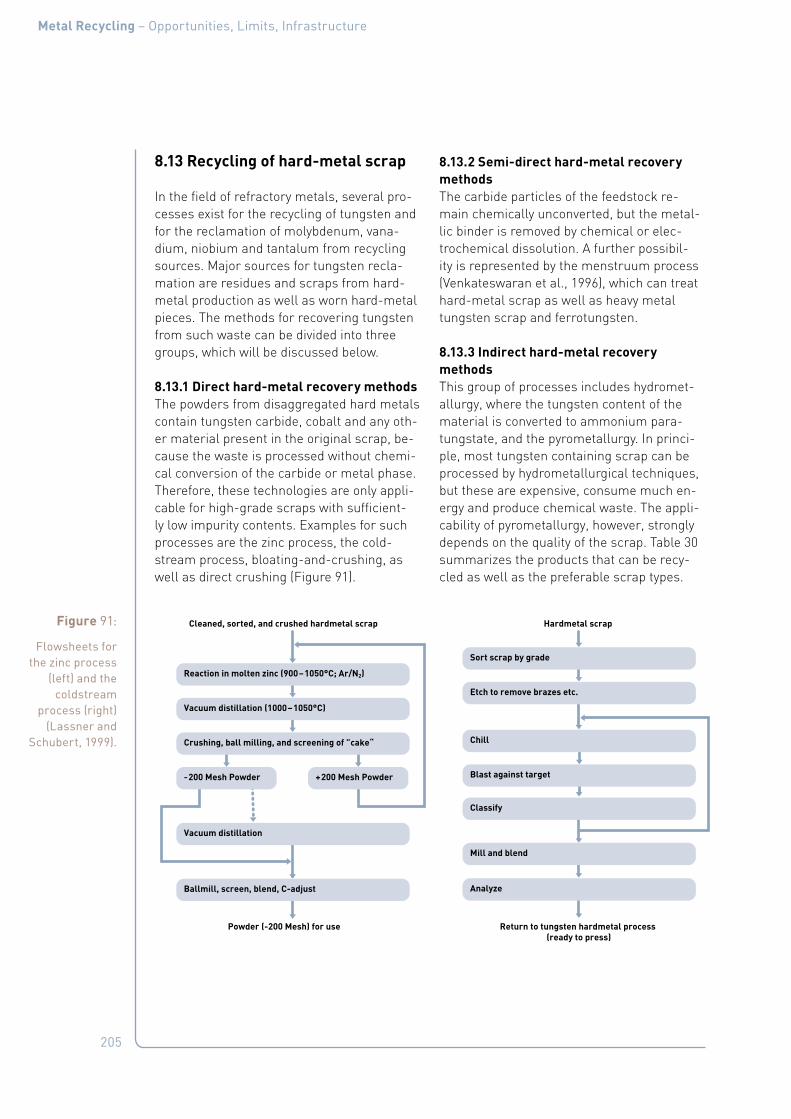
205
Metal Recycling – Opportunities, Limits, Infrastructure
8.13 Recycling of hard-metal scrap
In the field of refractory metals, several pro-cesses exist for the recycling of tungsten and for the reclamation of molybdenum, vana-dium, niobium and tantalum from recycling sources. Major sources for tungsten recla-mation are residues and scraps from hard-metal production as well as worn hard-metal pieces. The methods for recovering tungsten from such waste can be divided into three groups, which will be discussed below.
8.13.1 Direct hard-metal recovery methodsThe powders from disaggregated hard metals contain tungsten carbide, cobalt and any oth-er material present in the original scrap, be-cause the waste is processed without chemi-cal conversion of the carbide or metal phase. Therefore, these technologies are only appli-cable for high-grade scraps with sufficient-ly low impurity contents. Examples for such processes are the zinc process, the cold-stream process, bloating-and-crushing, as well as direct crushing (Figure 91).
8.13.2 Semi-direct hard-metal recovery methodsThe carbide particles of the feedstock re-main chemically unconverted, but the metal-lic binder is removed by chemical or elec-trochemical dissolution. A further possibil-ity is represented by the menstruum process (Venkateswaran et al., 1996), which can treat hard-metal scrap as well as heavy metal tungsten scrap and ferrotungsten.
8.13.3 Indirect hard-metal recovery methodsThis group of processes includes hydromet-allurgy, where the tungsten content of the material is converted to ammonium para-tungstate, and the pyrometallurgy. In princi-ple, most tungsten containing scrap can be processed by hydrometallurgical techniques, but these are expensive, consume much en-ergy and produce chemical waste. The appli-cability of pyrometallurgy, however, strongly depends on the quality of the scrap. Table 30 summarizes the products that can be recy-cled as well as the preferable scrap types.
Figure 91:
Flowsheets for the zinc process
(left) and the coldstream
process (right) (Lassner and
Schubert, 1999).
Reaction in molten zinc (900 – 1050°C; Ar/N2)
Vacuum distillation (1000 – 1050°C)
Crushing, ball milling, and screening of ”cake“
- 200 Mesh Powder + 200 Mesh Powder
Vacuum distillation
Ballmill, screen, blend, C-adjust
Cleaned, sorted, and crushed hardmetal scrap
Powder (-200 Mesh) for use
Sort scrap by grade
Etch to remove brazes etc.
Chill
Blast against target
Classify
Mill and blend
Analyze
Hardmetal scrap
Return to tungsten hardmetal process (ready to press)

206
Metal Recycling – Opportunities, Limits, Infrastructure
8.13.4 Hard-metal recycling for catalystsRecycling also plays an important role in the production of molybdenum and vanadium as individual metals or as the corresponding ferroalloys. A possible feedstock for this pur-pose are catalysts from the petroleum indus-try for hydro-treatment (HDT), which among others eliminate N, S and O and even metals
(Ni, V, etc.) from the treated hydrocarbons. The spent catalysts contain in general about 2–10 % molybdenum, 0–12 % vanadium, 0.5–4 % cobalt, 0.5–10 % nickel, up to 10 % sul-phur and 10 % carbon, and are therefore an interesting recycling resource for molybde-num and other metals. An alternative for the recycling of these catalysts is pyrometallurgi-
Table 30:
Tungsten scrap in pyrometallurgy
(Lassner and Schubert, 1999).
Product Most preferable scrap type
Superalloys 1
Stellites 1, 3, 6, 9
Cast eutectic carbide 1, 6
Menstruum WC 4, 6, 9, 11, 12
Tool steel 1, 2, 4, 7, 11, 12
Ferrotungsten 1, 2, 4, 6, 7, 11, 12
Melting base 1, 2, 3, 4, 6, 7, 8, 9, 10, 11, 12
No. Scrap type % W Group
1 High-purity W ≥ 99 Hard scrap (solid pieces)
2 Oxide dispersed W alloys
(ThO2, ZrO2, CeO2, La2O3)96 – 98
3 Hard metal pieces (also containing Co, Ta) 60 – 97
4 Heavy metal W alloys 92 – 94
5 Tungsten – copper 60 – 90
6 Pure tungsten powder 98 – ≥ 99 Soft Scarp (fine particles, powder, dust, timings, sludges)7 W grinding sludge 30 – 60
8 W cutting sludge 70 – 80
9 Hard metal powder 60 – 95
10 Hard metal grinding sludge 15 – 60
11 Heavy metal powder 92 – 97
12 Heavy metal turnings 92 – 97
13 W – Cu powder and green compacts 50 – 90
14 Floor sweepings (different sources) 40 – 60
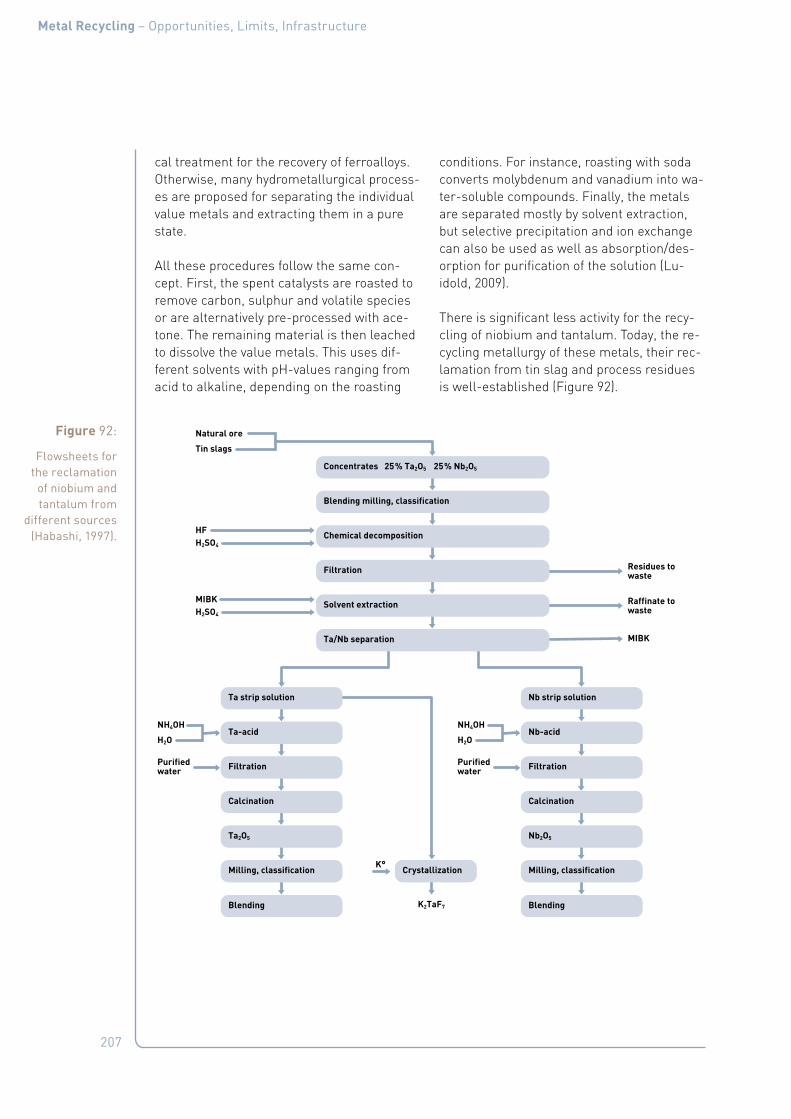
207
Metal Recycling – Opportunities, Limits, Infrastructure
cal treatment for the recovery of ferroalloys. Otherwise, many hydrometallurgical process-es are proposed for separating the individual value metals and extracting them in a pure state.
All these procedures follow the same con-cept. First, the spent catalysts are roasted to remove carbon, sulphur and volatile species or are alternatively pre-processed with ace-tone. The remaining material is then leached to dissolve the value metals. This uses dif-ferent solvents with pH-values ranging from acid to alkaline, depending on the roasting
conditions. For instance, roasting with soda converts molybdenum and vanadium into wa-ter-soluble compounds. Finally, the metals are separated mostly by solvent extraction, but selective precipitation and ion exchange can also be used as well as absorption/des-orption for purification of the solution (Lu-idold, 2009).
There is significant less activity for the recy-cling of niobium and tantalum. Today, the re-cycling metallurgy of these metals, their rec-lamation from tin slag and process residues is well-established (Figure 92).
Figure 92:
Flowsheets for the reclamation
of niobium and tantalum from
different sources (Habashi, 1997).
Concentrates 25 % Ta2O5 25 % Nb2O5
Blending milling, classification
Chemical decomposition
Filtration
Solvent extraction
Ta/Nb separation
Nb strip solution
Nb-acid
Filtration
Calcination
Nb2O5
Milling, classification
Blending
Natural ore
Tin slags
NH4OH
Purifiedwater
H2O
NH4OH
H2O
Ta strip solution
Ta-acid
Filtration
Calcination
Ta2O5
Milling, classification Crystallization
Blending
Purifiedwater
K°
K2TaF7
Residues towaste
Raffinate towaste
MIBK
HFH2SO4
MIBKH2SO4

208
Metal Recycling – Opportunities, Limits, Infrastructure
8.14 Titanium recycling
The special value of titanium helps closing its material cycle. The source of scrap is highly diverse, originating from high-tech aerospace applications and hip-and-joint replacements. High temperature oxygen free melting is re-quired (Krüger et al., 2005) and, depending on the melting route, it can either form part of a consumable electrode—if it is well sorted to produce a high-quality product—or it can be directly added to the melt in small pieces. Untreated titanium scrap of known compo-sition can be added as alloying element to various metals, or can be used for producing master alloys such as ferrotitanium.
8.15 Technology for the recycling of lamps
The decontamination of fluorescent lamps can be done by three different methods: ther-mal processes, chemical processes involving leaching with aqueous solutions, or stabili-zation (Durao et al., 2008). The last method, stabilization, does not recover REEs from the treated material. In the thermal processes, which are more efficient than the chemical ones, the material is heated to a sufficient-ly high temperature to evaporate mercury. However, earlier studies showed that most of the mercury in spent lamps remains in the phosphor-powder matrix, because mer-cury exists in the phosphor-powder residue of spent fluorescent lamps as Hg0, Hg+ and Hg2+. Especially the very strong interaction of Hg2+ with the glass present in the phosphor powders, makes mercury decontamination of
Ta-containing process residues
Liquid –liquid extraction
Synthetic oresTa2O5 > 20 %
Recycling
Electron beammelting
Sintering
K2TaF7 Ta2O5
TaCl5
Mill products
Ta powder
TaC
Carborizing
Special alloys Chemical industry
Electronics Optics Hard metals
Chlorination
Secondary raw materials(e.g. Ta-containing electronic devices)
Ta2O5-containing oresTa2O5 > 25 %
High-gradetin slagsTa2O5 > 8 %
Low-gradetin slagsTa2O5 > 1–4 %

209
Metal Recycling – Opportunities, Limits, Infrastructure
the powder more difficult, so that the thermal removal of this toxic metal requires high tem-peratures. Figure 93 provides a brief overview of the technology of the recycling of lamps. Note the attention to mercury removal.
Figure 93:
A schematic overview of the cutting
and physical sorting of lamps (European Lamp
Companies Federation, 2012).
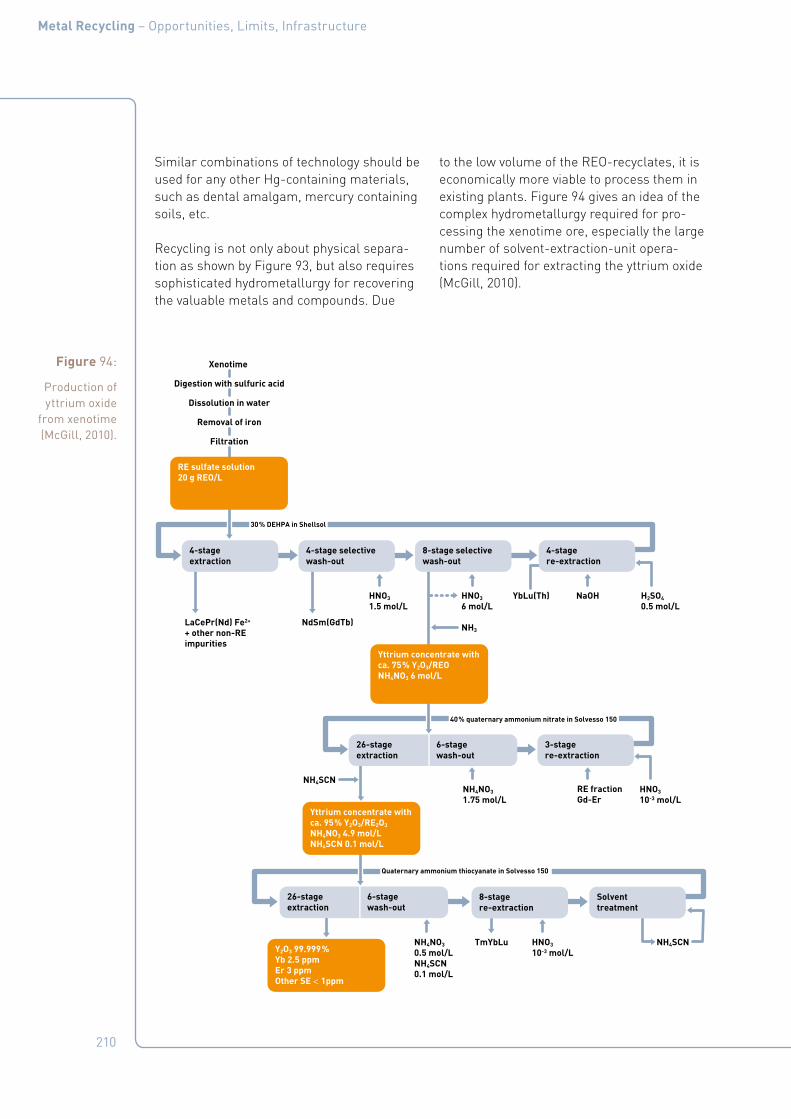
210
Metal Recycling – Opportunities, Limits, Infrastructure
Similar combinations of technology should be used for any other Hg-containing materials, such as dental amalgam, mercury containing soils, etc.
Recycling is not only about physical separa-tion as shown by Figure 93, but also requires sophisticated hydrometallurgy for recovering the valuable metals and compounds. Due
to the low volume of the REO-recyclates, it is economically more viable to process them in existing plants. Figure 94 gives an idea of the complex hydrometallurgy required for pro-cessing the xenotime ore, especially the large number of solvent-extraction-unit opera-tions required for extracting the yttrium oxide (McGill, 2010).
Figure 94:
Production of yttrium oxide
from xenotime (McGill, 2010).
Xenotime
Digestion with sulfuric acid
Dissolution in water
Removal of iron
Filtration
LaCePr(Nd) Fe2+ + other non-RE impurities
NdSm(GdTb)
HNO3
1.5 mol/LHNO3
6 mol/L
NH3
H2SO4
0.5 mol/L
HNO3
10-3 mol/LNH4NO3
1.75 mol/L
NaOH
RE fractionGd-Er
YbLu(Th)
30 % DEHPA in Shellsol
40 % quaternary ammonium nitrate in Solvesso 150
NH4SCN
NH4NO3
0.5 mol/LNH4SCN0.1 mol/L
HNO3
10-3 mol/LTmYbLu NH4SCN
Quaternary ammonium thiocyanate in Solvesso 150
4-stage selective wash-out
4-stage extraction
RE sulfate solution 20 g REO/L
Yttrium concentrate with ca. 75 % Y2O3/REONH4NO3 6 mol/L
8-stage selective wash-out
4-stage re-extraction
Yttrium concentrate with ca. 95 % Y2O3/RE2O3
NH4NO3 4.9 mol/LNH4SCN 0.1 mol/L
Y2O3 99.999 %Yb 2.5 ppmEr 3 ppmOther SE < 1ppm
8-stage re-extraction
Solventtreatment
6-stagewash-out
26-stage extraction
6-stagewash-out
26-stage extraction
3-stagere-extraction
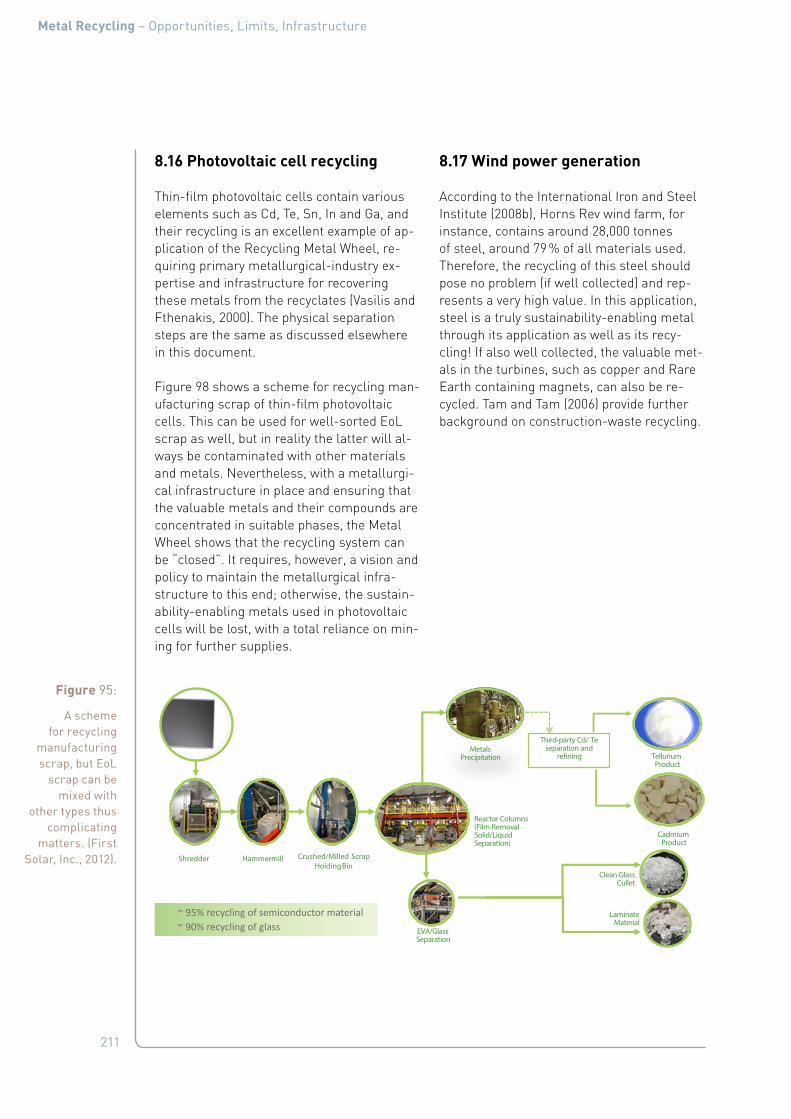
211
Metal Recycling – Opportunities, Limits, Infrastructure
8.16 Photovoltaic cell recycling
Thin-film photovoltaic cells contain various elements such as Cd, Te, Sn, In and Ga, and their recycling is an excellent example of ap-plication of the Recycling Metal Wheel, re-quiring primary metallurgical-industry ex-pertise and infrastructure for recovering these metals from the recyclates (Vasilis and Fthenakis, 2000). The physical separation steps are the same as discussed elsewhere in this document.
Figure 98 shows a scheme for recycling man-ufacturing scrap of thin-film photovoltaic cells. This can be used for well-sorted EoL scrap as well, but in reality the latter will al-ways be contaminated with other materials and metals. Nevertheless, with a metallurgi-cal infrastructure in place and ensuring that the valuable metals and their compounds are concentrated in suitable phases, the Metal Wheel shows that the recycling system can be “closed”. It requires, however, a vision and policy to maintain the metallurgical infra-structure to this end; otherwise, the sustain-ability-enabling metals used in photovoltaic cells will be lost, with a total reliance on min-ing for further supplies.
8.17 Wind power generation
According to the International Iron and Steel Institute (2008b), Horns Rev wind farm, for instance, contains around 28,000 tonnes of steel, around 79 % of all materials used. Therefore, the recycling of this steel should pose no problem (if well collected) and rep-resents a very high value. In this application, steel is a truly sustainability-enabling metal through its application as well as its recy-cling! If also well collected, the valuable met-als in the turbines, such as copper and Rare Earth containing magnets, can also be re-cycled. Tam and Tam (2006) provide further background on construction-waste recycling.
Figure 95:
A scheme for recycling
manufacturing scrap, but EoL
scrap can be mixed with
other types thus complicating
matters. (First Solar, Inc., 2012).
Tellurium Product
Shredder Hammermill Crushed/Milled Scrap Holding Bin
Laminate Material
Clean Glass Cullet
EVA/Glass Separation
Cadmium Product
Reactor Columns (Film Removal Solid/Liquid Separation)
~ 95% recycling of semiconductor material ~ 90% recycling of glass
Metals Precipitation
Third-party Cd/ Te separation and
re�ning

212
Metal Recycling – Opportunities, Limits, Infrastructure
9. Appendix B: Details on Metals found in WEEE
This Appendix provides compositional and other data for various WEEE goods.
9.1 Metal contents of some EEE categories
Table 31 gives an overview of the metal con-tents of various EEE categories and their de-mand.
Table 31:
World reserves, demand for EEE, mine production and the amount
by weight (g) of metals in
different WEEE categories
(Ongondo et al., 2011).
Symbol Silver Ag
Gold Au
Bis-muth Bi
Cobalt Co
Copper Cu
Palla-dium Pd
Anti-mony Sb
Tin Sn
World mine production (t/a)
20000 2500 5600 58000 15000000 230 130000 275000
Demand for EEE (t/a)
6000 300 900 11000 4500000 33 65000 90000
Demand as % of production
30 12 16 19 30 14 50 33
World reserves (kt)
400 47 320 6600 540000 - 2100 5600
WEEE categories and sub-catagories as per EU Directive. Amount in EEE by weight (g).
1A, 10 0.008 0.0019 - - 1736 0.001 0.045 25.5
1B - - - - 958 - - -
1C 0.0023 0.00068 0.23 956 0.0014 0.029 -
2, 5A, 8 0.00033 0.0001 - 0.18 484 0.0002 0.0041 -
3A 0.48 0.079 0.048 0.27 159 0.03 0.19 -
4A 0.12 0.016 0.06 0.14 423 0.0029 0.24 -
6 0.001 0.00028 - 1.29 1075 0.00058 0.012 -
7 0.072 0.008 - 0.29 25.58 0.00059 - -
3B 0.21 0.013 0.95 0.18 723 0.0048 3.02 0.81
4B 2.65 0.17 0.66 0.21 971 0.067 5.75 13
3C 0.52 0.2 - - 310 0.041 0.16 0.53
4C 0.45 0.11 - - 824 0.034 0.71 18.3
5B 0.00027 0.000025 - - 2.76 0.000015 0.00074 0.11
1A: large domestic appliances excluding cooling and freezing equipment and ‘‘smaller’’ LDA items (e. g., cookers, washing machines); 1B: cooling and freezing appliances (e. g., refrigerators, air conditioning units); 1C: ‘‘Smaller items within the large domestic appliances (e. g., microwaves); 2: Small domestic appliances (e.g., toasters, vacuum cleaners); 3A: IT and Telecom excluding CRTs (e. g., computers, telephones); 3B: CRT Monitors; 3C: LCD Monitors; 4A: Consumer electronics excluding CRTs (e. g., DVD players, audio amplifiers); 4B: CRT TVs; 4C: flat panel TVs; 5A: lighting equipment – luminaries; 5B: lighting equip-ment – lamps; 6: electrical and electronic tools (e. g., drills, lawn mowers); 7: toys, leisure and sports equipment (e. g., game consoles); 8: small domestic medical devices; 9: monitoring and control instruments (e. g., smoke detectors, thermostats) – there was no data for this category; 10: automatic dispensers.
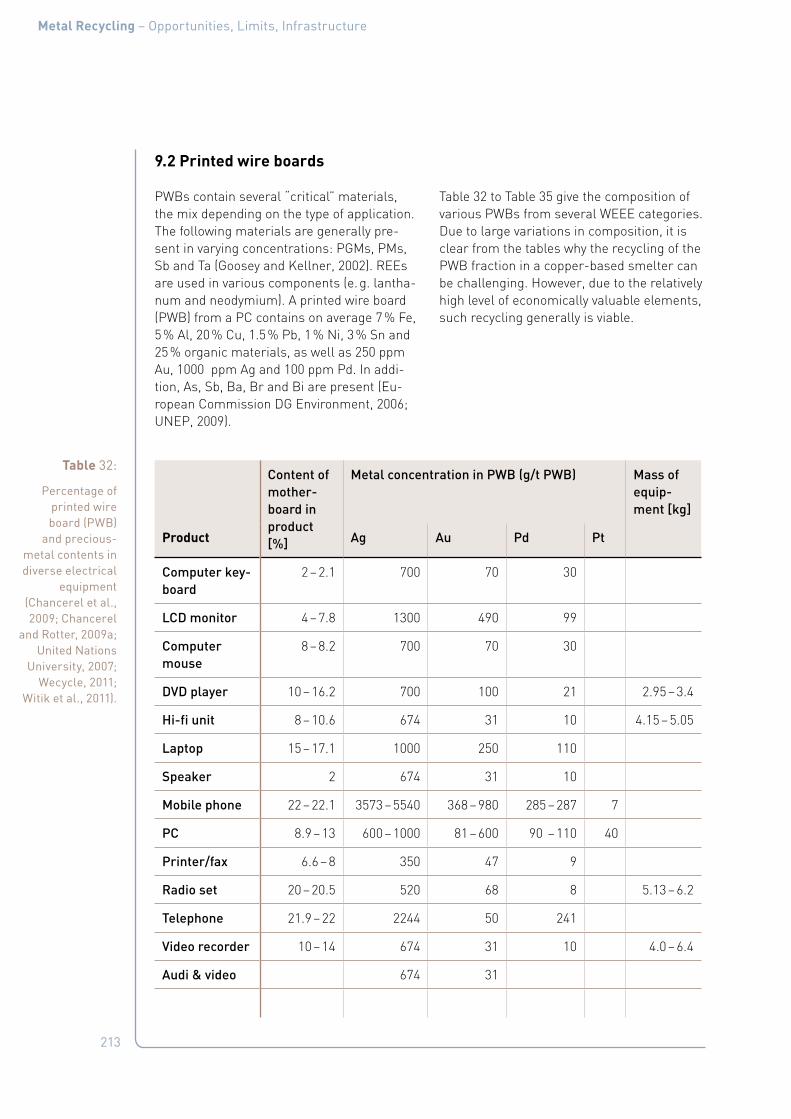
213
Metal Recycling – Opportunities, Limits, Infrastructure
9.2 Printed wire boards
PWBs contain several “critical” materials, the mix depending on the type of application. The following materials are generally pre-sent in varying concentrations: PGMs, PMs, Sb and Ta (Goosey and Kellner, 2002). REEs are used in various components (e. g. lantha-num and neodymium). A printed wire board (PWB) from a PC contains on average 7 % Fe, 5 % Al, 20 % Cu, 1.5 % Pb, 1 % Ni, 3 % Sn and 25 % organic materials, as well as 250 ppm Au, 1000 ppm Ag and 100 ppm Pd. In addi-tion, As, Sb, Ba, Br and Bi are present (Eu-ropean Commission DG Environment, 2006; UNEP, 2009).
Table 32 to Table 35 give the composition of various PWBs from several WEEE categories. Due to large variations in composition, it is clear from the tables why the recycling of the PWB fraction in a copper-based smelter can be challenging. However, due to the relatively high level of economically valuable elements, such recycling generally is viable.
Table 32:
Percentage of printed wire board (PWB)
and precious-metal contents in diverse electrical
equipment (Chancerel et al., 2009; Chancerel
and Rotter, 2009a; United Nations
University, 2007; Wecycle, 2011;
Witik et al., 2011).
Content of mother- board in product [%]
Metal concentration in PWB (g/t PWB) Mass of equip-ment [kg]
Product Ag Au Pd Pt
Computer key-board
2 – 2.1 700 70 30
LCD monitor 4 – 7.8 1300 490 99
Computer mouse
8 – 8.2 700 70 30
DVD player 10 – 16.2 700 100 21 2.95 – 3.4
Hi-fi unit 8 – 10.6 674 31 10 4.15 – 5.05
Laptop 15 – 17.1 1000 250 110
Speaker 2 674 31 10
Mobile phone 22 – 22.1 3573 – 5540 368 – 980 285 – 287 7
PC 8.9 – 13 600 – 1000 81 – 600 90 – 110 40
Printer/fax 6.6 – 8 350 47 9
Radio set 20 – 20.5 520 68 8 5.13 – 6.2
Telephone 21.9 – 22 2244 50 241
Video recorder 10 – 14 674 31 10 4.0 – 6.4
Audi & video 674 31
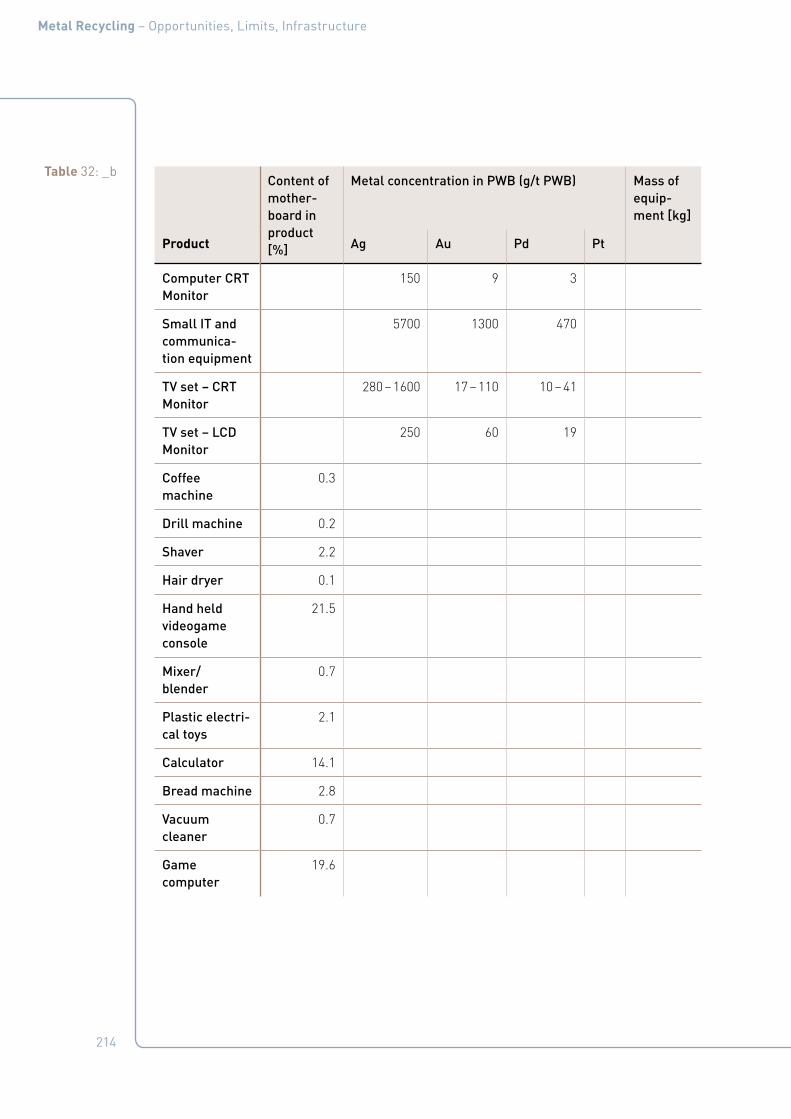
214
Metal Recycling – Opportunities, Limits, Infrastructure
Table 32: _bContent of mother- board in product [%]
Metal concentration in PWB (g/t PWB) Mass of equip-ment [kg]
Product Ag Au Pd Pt
Computer CRT Monitor
150 9 3
Small IT and communica-tion equipment
5700 1300 470
TV set – CRT Monitor
280 – 1600 17 – 110 10 – 41
TV set – LCD Monitor
250 60 19
Coffee machine
0.3
Drill machine 0.2
Shaver 2.2
Hair dryer 0.1
Hand held videogame console
21.5
Mixer/ blender
0.7
Plastic electri-cal toys
2.1
Calculator 14.1
Bread machine 2.8
Vacuum cleaner
0.7
Game computer
19.6

215
Metal Recycling – Opportunities, Limits, Infrastructure
Table 33:
The average composition of PWBs in fractions (total=1) of the various WEEE categories (United Nations University, 2007).
Component
Materials
1A
LHHA
1CL
HHA-
small
2
SHHA
3A1 IT
ex CRT
PC’s
3A2 IT
ex CRT
print-
ing
devic-
es
3A3 IT
ex CRT
Small
IT
3B IT
CRT
3C IT
FDP*
4A1 CE
ex
CRT
Large
Audio
4A2 CE
ex CRT
VCRs
DVD
etc
4B CE
CRT
4C CE
FDP
5B
Lamps
6 Tools 7,1
Toys
Game
cons.
Power
b.
7,2
Toys
Game
cons.
Power
b.
Fe 9,9E-02 2,1E-01 1,2E-01 1,3E-01 3,9E-01 8,0E-02 1,0E-01 5,2E-03 9,3E-02 5,3E-02 1,1E-02 1,2E-01 1,2E-01 4,1E-02 2,7E-02 8,3E-02
Cu 1,3E-01 1,3E-01 1,1E-01 1,8E-01 1,4E-01 1,0E-01 1,8E-01 4,0E-01 1,9E-01 1,6E-01 1,2E-01 2,2E-01 1,1E-01 1,6E-01 2,0E-01 2,0E-01
Ag 1,6E-04 4,8E-05 2,2E-04 1,0E-03 3,5E-04 5,7E-03 1,5E-04 1,3E-03 5,2E-04 7,0E-04 1,6E-03 2,5E-04 2,2E-04 1,1E-03 4,3E-04 3,0E-04
Au 3,8E-05 1,4E-05 2,0E-05 2,3E-04 4,7E-05 1,3E-03 9,2E-06 4,9E-04 6,8E-05 1,0E-04 1,1E-04 6,0E-05 2,0E-05 1,8E-05 1,6E-04 1,8E-05
Pd 2,0E-05 2,9E-05 1,2E-05 9,0E-05 9,0E-06 4,7E-04 3,4E-06 9,9E-05 8,0E-06 2,1E-05 4,1E-05 1,9E-05 1,2E-05 4,8E-05 1,8E-05
Al (general)
7,7E-02 7,6E-02 8,6E-02 4,0E-02 4,4E-02 2,0E-02 4,6E-02 1,9E-02 1,3E-01 5,9E-02 6,3E-02 1,5E-01 8,6E-02 5,8E-02 6,1E-02 1,8E-01
As 2,7E-05
Be 8,8E-05
Bi 2,0E-04 6,9E-04 6,0E-04 4,0E-04
Cd 1,4E-06
Cr 1,0E-04 2,9E-04 2,1E-04 5,5E-04 7,5E-04 2,5E-02 6,9E-04 2,0E-04 0.0E-00 4,0E-04 2,1E-04 3,5E-04 2,1E-04 2,1E-04
Ni 5,0E-04 9,0E-04 1,1E-03 9,0E-03 1,2E-03 3,5E-02 2,5E-03 9,0E-03 2,8E-03 2,8E-03 3,0E-03 1,8E-03 1,1E-03 1,1E-03 3,5E-03 1,0E-03
Pb 1,5E-02 1,0E-02 3,0E-02 3,3E-03 5,4E-03 1,4E-02 1,1E-02 5,7E-03 5,6E-03 1,6E-02 1,5E-02 6,8E-03 3,0E-02 3,0E-02 4,5E-03 5,8E-03
Sb 9,0E-04 6,0E-04 6,0E-04 4,5E-04 4,0E-04 3,1E-03 2,2E-03 4,0E-04 1,2E-03 1,3E-03 3,5E-03 4,0E-04 6,0E-04 6,0E-04
Sn 2,4E-02 5,8E-03 2,7E-02 4,8E-03 6,9E-03 2,1E-02 5,7E-04 1,3E-03 4,5E-03 6,6E-03 7,9E-03 1,0E-02 2,7E-02 2,7E-02 3,0E-03 3,2E-03
Zn 3,2E-02 6,8E-03 1,4E-02 1,6E-02 1,6E-02 1,4E-02 1,9E-02 2,5E-03 1,3E-02 1,7E-02 3,9E-03 1,3E-02 1,4E-02 1,4E-02
Plastics (general)
4,4E-01 3,9E-01 4,6E-01 2,5E-01 2,3E-01 5,3E-01 3,9E-01 1,1E-01 1,6E-01 3,7E-01 2,7E-01 2,0E-01 4,6E-01 4,8E-01 2,8E-01 2,0E-01
Epoxy 1,7E-01 1,6E-01 4,6E-02 2,0E-01 3,9E-01 1,6E-01 1,5E-01
Ceramics 1,4E-01 1,9E-01 6,9E-02 5,2E-02 4,4E-01 2,0E-01 6,4E-02 1,0E-01 1,8E-01 4,2E-01 3,3E-01
Glass LCD 1,0E-01
Other (average)
4,4E-02 0.0E-00 0.0E-00 1,7E-01 9,9E-02 1,5E-01 2,3E-01 1,1E-01 3,0E-02
Liquid Crystals
8,0E-03
Br 3,2E-03 1,0E-04 3,8E-02 2,9E-03 1,2E-03 2,5E-03 1,2E-02 1,0E-04 1,2E-02
Cl 3,9E-03 4,3E-03 5,0E-04 1,0E-02 2,3E-03 4,3E-03 2,7E-03

216
Metal Recycling – Opportunities, Limits, Infrastructure
Table 34:
Various elements in e-waste, and
their application, typical
concentration and emission
(Williams et al., 2008).
a(Morf et al., 2007).
bAssuming a global e-waste production of 20 million tonnes
per year.
Contaminant Relationship with E-waste
Typical E-waste concentration (mg/kg)a
Annual global emission in E-waste (tons)b
Polybrominated diphenyl ethers (PBDEs) polybrominated biphenyls (PBBs) tetra-bromobisphenol (TBBPA)
Flame retardants
Polychlorinated biphenyls (PCB) Condensors, transformers 14 280
Chlorofuorocarbon (CFC) Cooling units, insulation foams
Polycyclic aromatic hydrocarbons (PACs) Product of combustion
Polyhalogenated aromatic hydrocarbons (PHAHs)
Product of low-temperature com-bustion
Polychloronated dibenzo-p-dioxins (PCDDs) polychlorinated dibezofurans (PCDFs)
Product of low-temperature combus-tion of PVCs and other plastics
Americium (Am) Smoke detectors
Antimony (Sb) Flame retardants 1700 34000
Arsenic (As) Doping material for Si
Barium (Ba) Getters in cathode ray tubes (CRTs), in glass
Beryllium (Be) Silicon-controlled rectifiers
Cadmium (Cd) Batteries, toners, plastics 180 3600
Chromium (Cr) Data tapes and floppy disks 9900 198000
Copper (Cu) Wiring, conductors 41000 820000
Gallium (Ga) Semiconductors
Indium (In) LCD Displays (ITO – Indium Tin Oxide)
Lead (Pb) Solder, batteries 2900 58000
Lithium (Li) Batteries
Mercury (Hg) Fluorescent lamps, batteries, switch-es
0,68 13,6
Nickel (Ni) Batteries 10300 206000
Selenium (Se) Rectifiers
Silver (Ag) Wiring, switches
Tin (Sn) Solder, LCD screens (ITO) 2400 48000
Zinc (Zn) Die castings 5100 102000
Rare Earth elements CRT Screen, Lamps

217
Metal Recycling – Opportunities, Limits, Infrastructure
Table 35:
Average composition of
a PC (European Commission DG
Environment, 2006).
Name Content (% of total weight)
Recycling Efficiency (current re-cyclability)
Weight of Material (Ibs.)
Use/Location
Plastics 22,9907 20 % 13,8 Includes organics, oxides other than silica
Lead 6,2988 5 % 3,8 Metal joining, radiation shield/CRT, PWB
Aluminium 14,1723 80 % 8,5 Structural, conductivity housing, CRT, PWB, con-nectors
Germanium 0,0016 0 % < 0.1 Semiconductor/PWB
Gallium 0,0013 0 % < 0.1 Semiconductor/PWB
Iron 20,4712 80 % 12,3 Structural, magnetivity/(steel) housing, CRT, PWB
Tin 1,0078 70 % 0,6 Metal joining/PWB, CRT
Copper 6,9287 90 % 4,2 Conductivity/CRT, PWB, connectors
Barium 0,0315 0 % < 0.1 Vacuum tube/CRT
Nickel 0,8503 80 % 0,51 Structural, magnetivity/(steel) housing, CRT, PWB
Zinc 2,2046 60 % 1,32 Battery, phosphor emitter/PWB, CRT
Tantalum 0,0157 0 % < 0.1 Capacitors/PWB, power supply
Indium 0,0016 60 % < 0.1 Transistor, rectifiers/PWB
Vanadium 0,0002 0 % < 0.1 Red phosphor emitter/CRT
Terbium < 0 0 % < 0 Green phosphor activator, dopart/CRT, PWB
Beryllium 0,0157 0 % < 0.1 Thermal conductivity/PWB, connectors
Gold 0,0016 99 % < 0.1 Connectivity, conductivity/PWB, connectors
Europium 0,0002 0 % < 0.1 Phosphor activator/PWB
Titanium 0,0157 0 % < 0.1 Pigment, alloying agent/(Aluminum) housing

218
Metal Recycling – Opportunities, Limits, Infrastructure
Table 35_b:
Average composition of
a PC (European Commission DG
Environment, 2006).
Name Content (% of total weight)
Recycling Efficiency (current re-cyclability)
Weight of Material (Ibs.)
Use/Location
Ruthenium 0,0016 80 % < 0.1 Resistive circuit/PWB
Cobalt 0,0157 85 % < 0.1 Structural, magnetivity/(steel) housing, CRT, PWB
Palladium 0,0003 95 % < 0.1 Connectivity, conductivity/PWB, connectors
Manganese 0,0315 0 % < 0.1 Structural, magnetivity (steel) hoursing, CRT, PWB
Silver 0,0189 98 % < 0.1 Conductivity/PWB, connec-tors
Antinomy 0,0094 0 % < 0.1 Diodes/housing, PWB, CRT
Bismuth 0,0063 0 % < 0.1 Wetting agent in thick film/PWB
Chromium 0,0063 0 % < 0.1 Decorative, hardener/(steel) housing
Cadmium 0,0094 0 % < 0.1 Battery, blue-green phos-phor emitter/housing/PWB, CRT
Selenium 0,0016 70 % 0,00096 Rectifiers/PWB
Niobium 0,0002 0 % < 0.1 Welding alloy/housing
Yttrium 0,0002 0 % < 0.1 Red phosphor emitter/CRT
Rhodium < 0 50 % < 0 Thick film conductor/PWB
Platinum < 0 95 % < 0.1 Thick film conductor/PWB
Mercury 0,0022 0 % < 0.1 Batteries, switches/hous-ing, PWB
Arsenic 0,0013 0 % < 0.1 Doping agents in transis-tors/PWB
Silica 24,8803 0 % 15 Glass, solid state devices/CRT, PWB

219
Metal Recycling – Opportunities, Limits, Infrastructure
9.3 Materials in CRT TVs
Table 36 shows that CRT TVs contain various “critical” materials, including REEs and REOs in the phosphor powders, as well as PGMs and other precious metals in the PWBs. The getter/electron gun of a CRT TV uses tung-sten. From the given data, an estimate can be made of the amount of “critical” elements.
Table 36:
Composition of CRT TVs based
on different literature sources.
Material [%] (Matusewicz
and Reuter,
2008)
(Dodbiba et
al., 2006)
(DEFRA,
2007)
(United Na-
tions Uni-
versity,
2007)
(Wecycle,
2011)
(Witik et al.,
2011)
Iron/steel 17.8 12.0 15.1 4.5
Copper 1.8 8.0 1.2
Aluminium 7.0 2.0 0.2
Other metal 0.1
Glass 58.0 51.0 65.3
Plastics 8.2 10.5 16.7 17.0
Printed Wire Board (PWB)
5.0 3.0 9.7 6.2 6.1
Fluorescent powder
0.0131 – 0.0136
Wood 3.8 2.0
Rubber 0.1
Other 2.1 13.5 58.5 3.4
Total 100.0 100.0 100.0 100.0
[kg] [kg] [kg] [kg]
Mass 26.7 24.4 – 25.6
24.1

220
Metal Recycling – Opportunities, Limits, Infrastructure
Rare earths are used in CRT TVs, primar-ily for the red-phosphor powder: YVO4: Eu3+ (4.5 %), Y2O3: Eu3+ (3.5 %) and/or Y2O2S: Eu3+ (3.65 %) (Franz et al., 2010 and McGill, 2010). In the calculation, it is assumed that the green, blue and red phosphors are used in equal ratio.
Table 37 gives the average amounts of PGM, precious metals and REEs in CRT TVs. As CRT TVs are being replaced by flat panels, this source of “critical” metals will soon dry up; nevertheless, these figures are given here for information, as recycling organizations still have to deal with these products.
Table 37:
Calculated “critical”
materials in CRT TVs (Van Schaik,
2011).
Data per CRT TV (literature and calculated)
Min Max
Average mass CRT TV 24.1 26.7 [kg]
% PWB in CRT TV 3.0 9.7 [%]
Mass Ag in CRT (calculated) 0.20 4.14 [gram]
Mass Au in CRT TV (calculated) 0.01 0.28 [gram]
Mass Pd in CRT TV (calculated) 0.01 0.11 [gram]
Mass Co in CRT TV (calculated) 0.19 0.21 [gram]
Mass Sb in CRT TV (calculated) 5.20 5.75 [gram]
% fluorescent powder in CRT TV 0.0131 0.0136 [%]
Mass Yttrium in CRT TV (calculated) 0.37 0.50 [gram]
Mass Europium in CRT TV (calculated) 0.03 0.05 [gram]

221
Metal Recycling – Opportunities, Limits, Infrastructure
9.4 Metals and materials in mobile phones
Figure 96 shows that a mobile phone con-tains more than 40 elements, including base metals such as copper (Cu) and tin (Sn), special/”critical” metals such as cobalt (Co), indium (In) and antimony (Sb), and precious and platinum-group metals including silver (Ag), gold (Au), palladium (Pd), tungsten, yt-trium, etc. (UNEP, 2009) (see Table 38).
• mobile phone substance (source Nokia)
Figure 96:
Materials in a mobile phone (UNEP, 2009).
1H
2He
3Li
4Be
5B
6C
7N
8O
9F
10Ne
11Na
12Mg
13Al
14Si
15P
16S
17Cl
18Ar
19K
20Ca
21Sc
22Ti
23V
24Cr
25Mn
26Fe
27Co
28Ni
29Cu
30Zn
31Ga
32Ge
33As
34Se
35Br
36Kr
37Rb
38Sr
39Y
40Zr
41Nb
42Mo
43Tc
44Ru
45Rh
46Pd
47Ag
48Cd
49In
50Sn
51Sb
52Te
53I
54Xe
55Cs
56Ba
* 72Hf
73Ta
74W
75Re
76Os
77Ir
78Pt
79Au
80Hg
81Tl
82Pb
83Bi
84Po
85At
86Rn
87Fr
88Ra
** 104Rf
105Db
106Sg
107Sg
108Hs
109Mt
110Ds
111Rg
112Uub
113Uut
114Uug
115Uup
116Uuh
117Uus
118Uuo
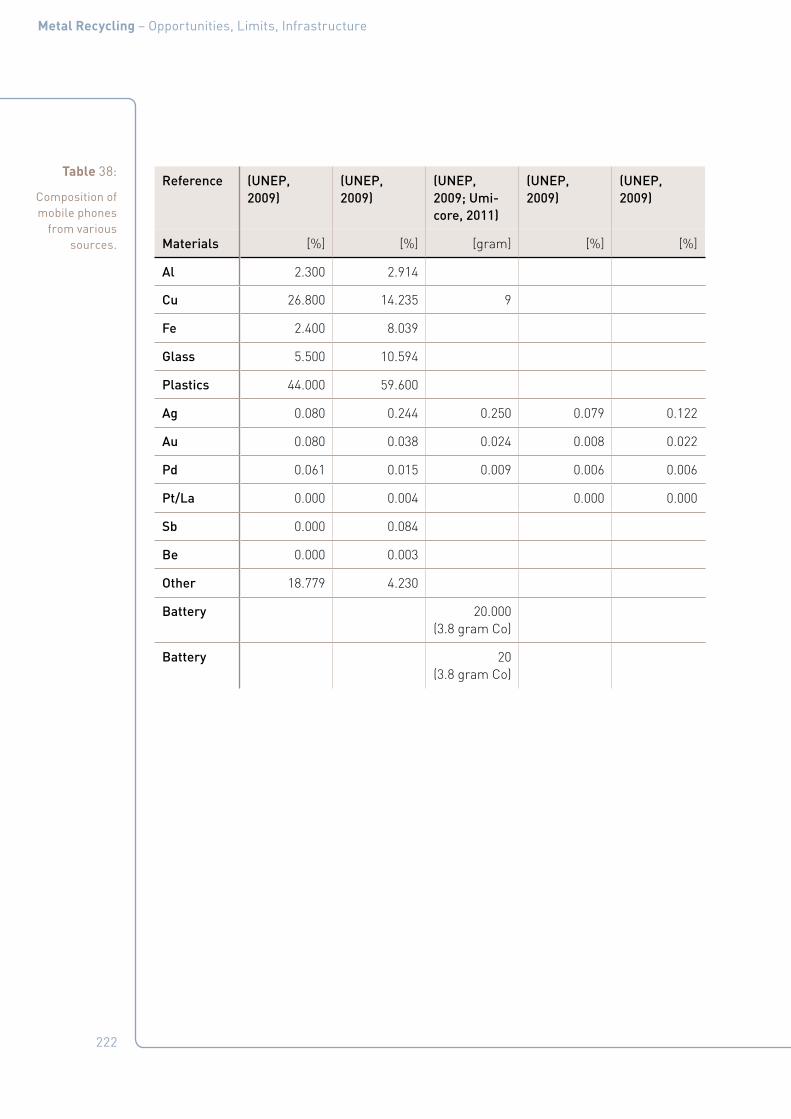
222
Metal Recycling – Opportunities, Limits, Infrastructure
Table 38:
Composition of mobile phones
from various sources.
Reference (UNEP, 2009)
(UNEP, 2009)
(UNEP, 2009; Umi-core, 2011)
(UNEP, 2009)
(UNEP, 2009)
Materials [%] [%] [gram] [%] [%]
Al 2.300 2.914
Cu 26.800 14.235 9
Fe 2.400 8.039
Glass 5.500 10.594
Plastics 44.000 59.600
Ag 0.080 0.244 0.250 0.079 0.122
Au 0.080 0.038 0.024 0.008 0.022
Pd 0.061 0.015 0.009 0.006 0.006
Pt/La 0.000 0.004 0.000 0.000
Sb 0.000 0.084
Be 0.000 0.003
Other 18.779 4.230
Battery 20.000 (3.8 gram Co)
Battery 20 (3.8 gram Co)
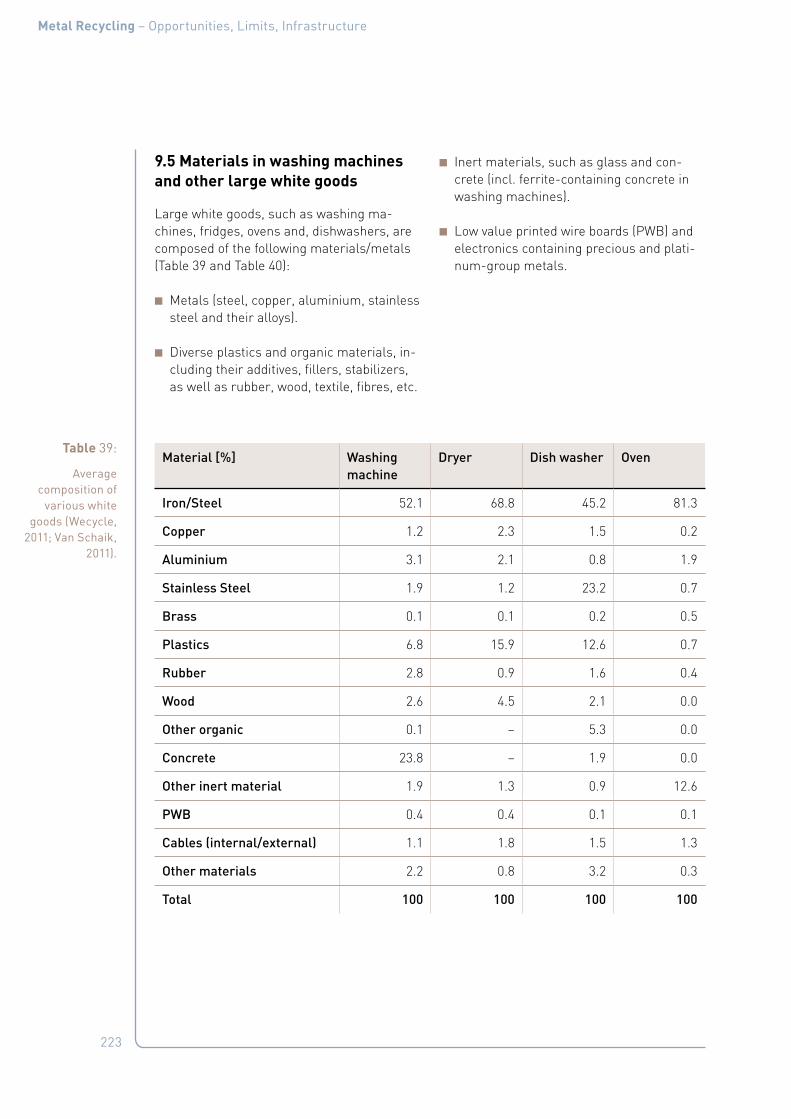
223
Metal Recycling – Opportunities, Limits, Infrastructure
9.5 Materials in washing machines and other large white goods
Large white goods, such as washing ma-chines, fridges, ovens and, dishwashers, are composed of the following materials/metals (Table 39 and Table 40):
■ Metals (steel, copper, aluminium, stainless steel and their alloys).
■ Diverse plastics and organic materials, in-cluding their additives, fillers, stabilizers, as well as rubber, wood, textile, fibres, etc.
■ Inert materials, such as glass and con-crete (incl. ferrite-containing concrete in washing machines).
■ Low value printed wire boards (PWB) and electronics containing precious and plati-num-group metals.
Table 39:
Average composition of
various white goods (Wecycle,
2011; Van Schaik, 2011).
Material [%] Washing machine
Dryer Dish washer Oven
Iron/Steel 52.1 68.8 45.2 81.3
Copper 1.2 2.3 1.5 0.2
Aluminium 3.1 2.1 0.8 1.9
Stainless Steel 1.9 1.2 23.2 0.7
Brass 0.1 0.1 0.2 0.5
Plastics 6.8 15.9 12.6 0.7
Rubber 2.8 0.9 1.6 0.4
Wood 2.6 4.5 2.1 0.0
Other organic 0.1 – 5.3 0.0
Concrete 23.8 – 1.9 0.0
Other inert material 1.9 1.3 0.9 12.6
PWB 0.4 0.4 0.1 0.1
Cables (internal/external) 1.1 1.8 1.5 1.3
Other materials 2.2 0.8 3.2 0.3
Total 100 100 100 100
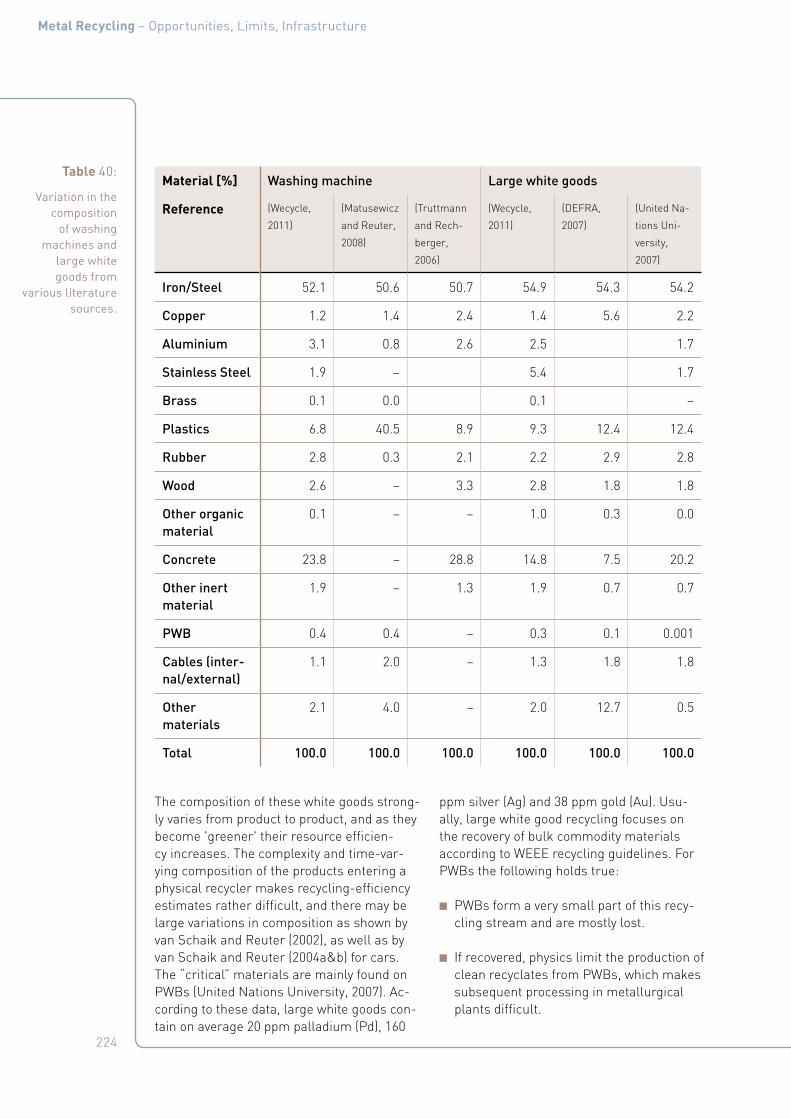
224
Metal Recycling – Opportunities, Limits, Infrastructure
The composition of these white goods strong-ly varies from product to product, and as they become 'greener' their resource efficien-cy increases. The complexity and time-var-ying composition of the products entering a physical recycler makes recycling-efficiency estimates rather difficult, and there may be large variations in composition as shown by van Schaik and Reuter (2002), as well as by van Schaik and Reuter (2004a&b) for cars. The “critical” materials are mainly found on PWBs (United Nations University, 2007). Ac-cording to these data, large white goods con-tain on average 20 ppm palladium (Pd), 160
ppm silver (Ag) and 38 ppm gold (Au). Usu-ally, large white good recycling focuses on the recovery of bulk commodity materials according to WEEE recycling guidelines. For PWBs the following holds true:
■ PWBs form a very small part of this recy-cling stream and are mostly lost.
■ If recovered, physics limit the production of clean recyclates from PWBs, which makes subsequent processing in metallurgical plants difficult.
Table 40:
Variation in the composition
of washing machines and
large white goods from
various literature sources.
Material [%] Washing machine Large white goods
Reference (Wecycle,
2011)
(Matusewicz
and Reuter,
2008)
(Truttmann
and Rech-
berger,
2006)
(Wecycle,
2011)
(DEFRA,
2007)
(United Na-
tions Uni-
versity,
2007)
Iron/Steel 52.1 50.6 50.7 54.9 54.3 54.2
Copper 1.2 1.4 2.4 1.4 5.6 2.2
Aluminium 3.1 0.8 2.6 2.5 1.7
Stainless Steel 1.9 – 5.4 1.7
Brass 0.1 0.0 0.1 –
Plastics 6.8 40.5 8.9 9.3 12.4 12.4
Rubber 2.8 0.3 2.1 2.2 2.9 2.8
Wood 2.6 – 3.3 2.8 1.8 1.8
Other organic material
0.1 – – 1.0 0.3 0.0
Concrete 23.8 – 28.8 14.8 7.5 20.2
Other inert material
1.9 – 1.3 1.9 0.7 0.7
PWB 0.4 0.4 – 0.3 0.1 0.001
Cables (inter-nal/external)
1.1 2.0 – 1.3 1.8 1.8
Other materials
2.1 4.0 – 2.0 12.7 0.5
Total 100.0 100.0 100.0 100.0 100.0 100.0

225
Metal Recycling – Opportunities, Limits, Infrastructure
■ PWBs will, because of the nature of me-chanical separation plants, be spread throughout the recyclates of commod-ity materials (steel, aluminium, etc.). After that, they get lost during the metallurgi-cal processes for these commodity metals, which do not cater for the thermodynam-ics that maximize recovery of “critical” ele-ments as shown by Reuter et al. (2005) and van Schaik and Reuter (2010a).
9.6 Materials in lighting
Fluorescent lamps contain various materials and elements, which include a range of Rare Earth elements e. g. yttrium, lanthanum, ce-rium, europium, terbium and gadolinium (USGS, 2002; 2010a; 2010b; 2010c) in the phosphorescent and fluorescent powders. LEDs also contain an interesting suite of ma-terials. Other “critical” resources, such as in-dium, gallium and tungsten (Hoek van den et al. 2010), are also present, while germanium is found in the fluorescent powder of high-pressure mercury lamps. In summary, lamps contain the following materials (Hoek van den et al. 2010; Franz et al., 2010; McGill, 2010):
■ Metals (W including K, ThO2, Re, Mo, Fe, Ni, Cr, Cu, Nb, Na, Hg, Zr, Al, Ba, Ni, Ta, Al and Zn).
■ Glass and others, including SiO2, Na2O, K2O, B2O3, Al2O3, MgO, CaO, BaO, PbO and SrO.
■ Fluorescent powders contain, among oth-ers, Ca5(PO4)3(Cl,F), BaMgAl10O17, Y2O5, LaPO4, Y3Al5O12, YVO5, etc., with metal ions (e. g. Pb2+/Mn2+/Sb3+) of rare earths (e. g. Eu2+/Tb3+/Ce3+) as activator; LEDs contain: AlGaOInP, InGaN, InGaN + (YAG:Ce) and InGaN+phosphor.
■ Special materials such as getters (W), amalgams, emitters, paint, cements, etc.
The average composition of REOs in phos-phor powders of lamps is estimated from di-verse literature sources (Rabah, 2004; United Nations University, 2007; Rabah 2008; Eu-ropean Lamp Companies Federation, 2009; Wecycle, 2011; Eurometaux, 2010; Welz et al., 2011; Schüler et al., 2011; Hoek van den et al. 2010) and summarized in Table 41.
Table 42 reflects the total mass of EoL in EU27 and the corresponding spread of REOs, while Table 43 compares this with the world production. From these tables it is clear that this is a relatively small amount.
Table 41:
Summary of data and calculated
amount of REOs per lamp (Van Schaik, 2011).
REO amounts calculated per lamp
Average mass of lamp 0.07 – 0.2 kg
Percentage of fluorescent powders in lamps
0.3 – 2.9 %
Calculated average quan-tity of REOs/lamp
0.2 – 2.3 gram
Table 42:
Calculated mass of REOs in EU27
(Van Schaik, 2011 based on data by Chemconserve,
2011; United Nations
University, 2007).
Quantity of REOs in EoL lighting in Europe (2010) (Cat. 5 Lighting with fluorescent powders)
EoL mass of lamps EU27 2010
44,489 (Chemconserve, 2011) – 77,000 (United Nations University, 2007) [tonne]
Total REOs EU27 2010 (calculated)a
67 – 1,250 [kg]
a Calculated on the basis of average mass REO/collected kg lighting Cat. 5; further assumed that the End-of-Life population in the EU is similar to that in the Netherlands (real values can therefore differ due to errors in these assumptions).
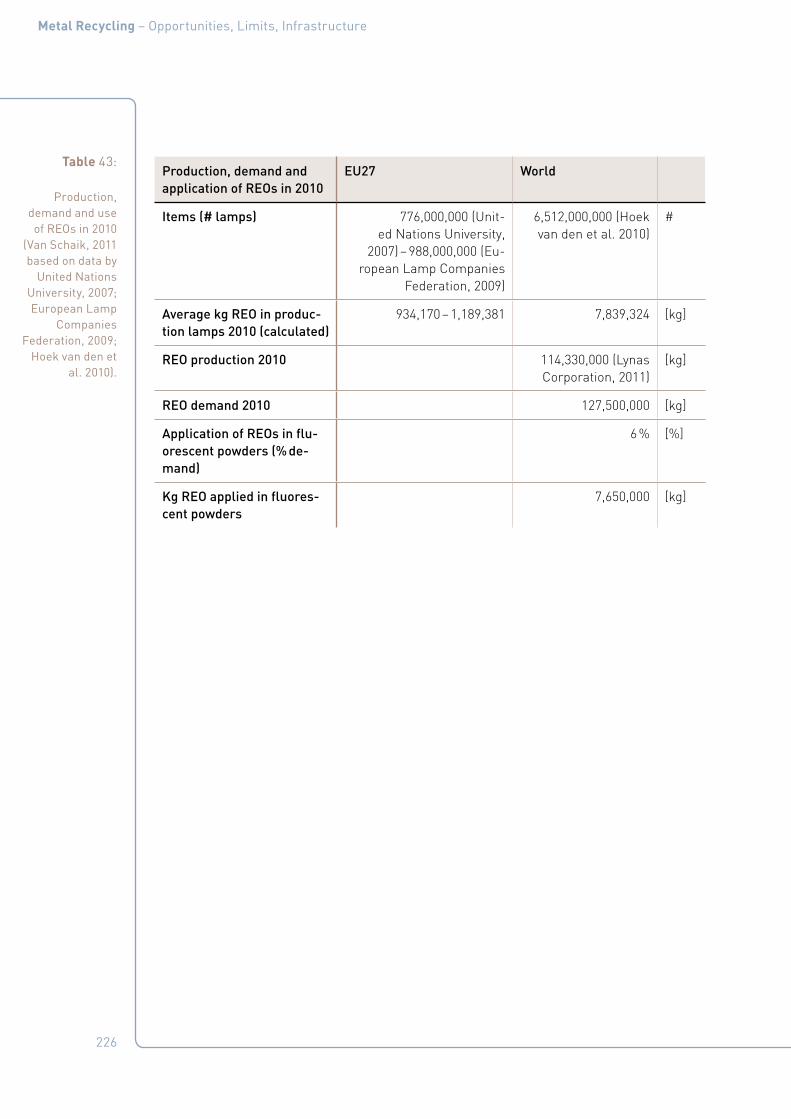
226
Metal Recycling – Opportunities, Limits, Infrastructure
Table 43:
Production, demand and use of REOs in 2010
(Van Schaik, 2011 based on data by
United Nations University, 2007; European Lamp
Companies Federation, 2009;
Hoek van den et al. 2010).
Production, demand and application of REOs in 2010
EU27 World
Items (# lamps) 776,000,000 (Unit-ed Nations University,
2007) – 988,000,000 (Eu-ropean Lamp Companies
Federation, 2009)
6,512,000,000 (Hoek van den et al. 2010)
#
Average kg REO in produc-tion lamps 2010 (calculated)
934,170 – 1,189,381 7,839,324 [kg]
REO production 2010 114,330,000 (Lynas Corporation, 2011)
[kg]
REO demand 2010 127,500,000 [kg]
Application of REOs in flu-orescent powders (% de-mand)
6 % [%]
Kg REO applied in fluores-cent powders
7,650,000 [kg]

227
Metal Recycling – Opportunities, Limits, Infrastructure
10. Appendix C: Details on Battery Recycling
Batteries convert chemical energy to elec-trical energy for powering a wide variety of cordless electrical products. The high vari-ety of applications, from flashlights to ve-hicles, demands different battery chemis-tries and materials to be able to meet a wide range of power, energy, size, weight, safety and cost requirements. The 2010 global bat-tery market size was reported at $ 60 billion with a breakdown of 70 % secondary batter-ies (rechargeable) and 30 % primary batteries (non-rechargeable), as seen in Figure 97. The dominant primary battery types are alkaline and zinc, while lead/acid dominate secondary batteries. Other secondary batteries include portable batteries – dominated by Li-ion and NiMH, while HEV batteries (mostly NiMH) compose a small but growing share of the market at 3 %.
Inside a metal or plastic case, a battery con-sists of a positively charged cathode and a negatively charged anode, which are kept from touching by an inert separator mem-brane that allows ions to pass (Figure 98). The electrolyte is a liquid, gel or powder that conducts ions from anode to cathode produc-ing an electric current. The metal fraction of batteries is dominant, but varies greatly both in amount and in elements, with met-als potentially contained in the anode, cath-ode, electrolyte and case/can, and being both valuable (Co, REE, etc.) and hazardous (Pb, Cd, etc.). Material compositions by weight of some batteries are shown in Table 44. The reaction equations occurring in each battery type is given by Table 45.
Figure 97:
Worldwide battery market
in 2010 HEV is mostly Ni/
MH, while large rechargeable
includes Ni/Cd and Ni/MH,
created with data from May (2011).
Large rechargeable
HEV
Ni/Cd
Ni/MH
Li-ion
Lead/acid
Other Secondary
Primary Figure 98:
General composition of a
battery (Umicore).

228
Metal Recycling – Opportunities, Limits, Infrastructure
Table 44:
Material compositions
of some battery types by weighta.
a Various data can also be found in: Bernardes et al.,
2004; Briffaerts et al., 2009; Sayil-gan et al., 2009; Rombach et al., 2008; Umicore,
2010; 2011; Xu et al., 2008; Dewulf et al. 2010; Xua et al.,
2008.
Pri-mary
Secondary
Zinc/Alka-line
Ni/Cd Ni/MH Li-ion Li- poly-merButton Cylin-
dricalPris-matic
Toyota Prius II
Fe 5 – 30 % 40 – 45 % 31 – 47 % 22 – 25 % 6 – 9 % 36 % 24.5 % 1 %
Ni 18 – 22 % 29 – 39 % 36 – 42 % 38 – 40 % 23 % 2 %
Zn 15 – 30 %
Mn 10 – 25 %
Cd 16 – 18 %
Co 2 – 3 % 3 – 4 % 2 – 3 % 4 % 27.5 %
(LiCoO2)
35 %
(LiCoO2)Li
REE 6 – 8 % 8 – 10 % 7 – 8 % 7 %
Cu 14.5 % 16 %
Al 15 %
K 1 – 2 % 1 – 2 % 3 – 4 %
Metals, un-specified
2 %
Graphite/Carbon
2 – 3 % < 1 % < 1 % 16 % 15 %
Plastics/Polymer
1 – 2 % 3 – 4 % 16 – 19 % 18 % 14 % 3 %
H,O 8 – 10 % 15 – 17 % 16 – 18 %
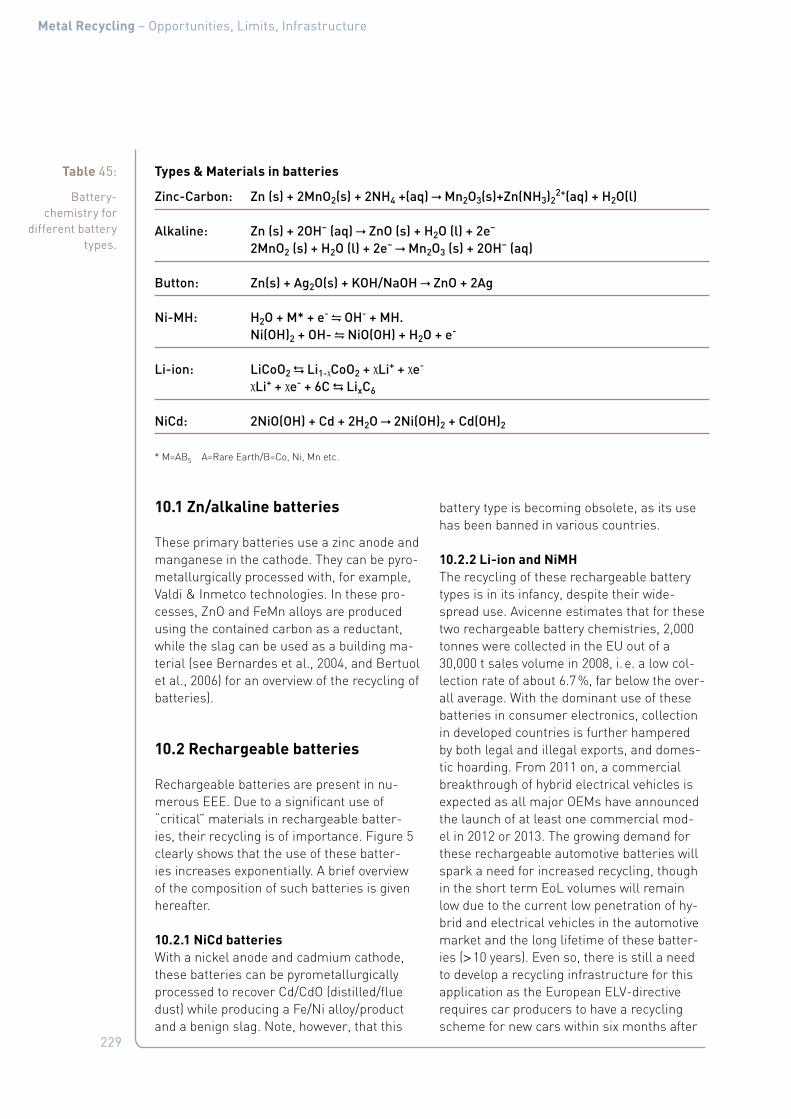
229
Metal Recycling – Opportunities, Limits, Infrastructure
10.1 Zn/alkaline batteries
These primary batteries use a zinc anode and manganese in the cathode. They can be pyro-metallurgically processed with, for example, Valdi & Inmetco technologies. In these pro-cesses, ZnO and FeMn alloys are produced using the contained carbon as a reductant, while the slag can be used as a building ma-terial (see Bernardes et al., 2004, and Bertuol et al., 2006) for an overview of the recycling of batteries).
10.2 Rechargeable batteries
Rechargeable batteries are present in nu-merous EEE. Due to a significant use of “critical” materials in rechargeable batter-ies, their recycling is of importance. Figure 5 clearly shows that the use of these batter-ies increases exponentially. A brief overview of the composition of such batteries is given hereafter.
10.2.1 NiCd batteriesWith a nickel anode and cadmium cathode, these batteries can be pyrometallurgically processed to recover Cd/CdO (distilled/flue dust) while producing a Fe/Ni alloy/product and a benign slag. Note, however, that this
battery type is becoming obsolete, as its use has been banned in various countries.
10.2.2 Li-ion and NiMHThe recycling of these rechargeable battery types is in its infancy, despite their wide-spread use. Avicenne estimates that for these two rechargeable battery chemistries, 2,000 tonnes were collected in the EU out of a 30,000 t sales volume in 2008, i. e. a low col-lection rate of about 6.7 %, far below the over-all average. With the dominant use of these batteries in consumer electronics, collection in developed countries is further hampered by both legal and illegal exports, and domes-tic hoarding. From 2011 on, a commercial breakthrough of hybrid electrical vehicles is expected as all major OEMs have announced the launch of at least one commercial mod-el in 2012 or 2013. The growing demand for these rechargeable automotive batteries will spark a need for increased recycling, though in the short term EoL volumes will remain low due to the current low penetration of hy-brid and electrical vehicles in the automotive market and the long lifetime of these batter-ies (> 10 years). Even so, there is still a need to develop a recycling infrastructure for this application as the European ELV-directive requires car producers to have a recycling scheme for new cars within six months after
Table 45:
Battery-chemistry for
different battery types.
Types & Materials in batteries
Zinc-Carbon: Zn (s) + 2MnO2(s) + 2NH4 +(aq) Mn2O3(s)+Zn(NH3)22+(aq) + H2O(l)
Alkaline: Zn (s) + 2OH− (aq) ZnO (s) + H2O (l) + 2e−
2MnO2 (s) + H2O (l) + 2e− Mn2O3 (s) + 2OH− (aq)
Button: Zn(s) + Ag2O(s) + KOH/NaOH ZnO + 2Ag
Ni-MH: H2O + M* + e- OH- + MH. Ni(OH)2 + OH- NiO(OH) + H2O + e-
Li-ion: LiCoO2 Li1-χCoO2 + χLi+ + χe- χLi+ + χe- + 6C LixC6
NiCd: 2NiO(OH) + Cd + 2H2O 2Ni(OH)2 + Cd(OH)2
* M=AB5 A=Rare Earth/B=Co, Ni, Mn etc.

230
Metal Recycling – Opportunities, Limits, Infrastructure
a vehicle is put on the market, and increasing amounts of production scrap will have to be dealt with. Collection rates for portable bat-teries are also expected to improve in Europe because of the new WEEE directive, which sets a higher collection target on electrical appliances, as these will largely be collected with the batteries attached.
The recycling chain must begin with safe handling of both small and large Li-ion and NiMH batteries, as remaining charges rep-resent a fire risk from short-circuiting, and, in the case of large batteries, an addition-al electrocution risk. The two main recycling routes available for Li-ion are a combined mechanical and hydrometallurgical process, and a combined pyro- and hydrometallurgical process (Figure 99). These options are com-patible with NiMH compounds, in addition to
pyrolysis. In the mechanical-hydrometallur-gical process, batteries dismantled to cell size are fed into a shredder to produce three fractions: fluff (plastic and paper), metals (Cu, Al, Fe) and black mass (mostly anode graphite and cathode (Co-, Ni-, Al-, Mn-, Li-oxides) materials). Battery shredding can be dangerous due to risks of explosion, fire and the releasing of hazardous volatile organic compounds (VOCs). Toxco (Canada) applies a cryogenic process to freeze the VOCs, though this is energy-intensive (Toxco, 2003), while Recupyl (France) uses inert gases (CO2 and Ar) to flush the shredder and prevent fire (IP, 2007). The fractions are then sent to different processes: fluff to landfill, metals to sorting and remelting, and for black mass the graph-ite is removed by incineration while hydro-metallurgy is used to extract the metals as salts.
Combined Mechanical+Hydro
Modules
Optional:Incinerator
Refining(Hydro)
Smelter
SlagAlloy
Landfill(Optional:RecoveryHalogensor Li)
Flue Dust
Cu Fe Co Ni
ConstructionorLi/REE valorizationorLandfill
Plastics
Al, Steel
Cu, BMS
Modules
Dismantling
Metal/Compounds
Cells
Optional:Inertization
HydroProcess
Shredder
Metals
Sorting
Remelting
Black Mass
Metal SaltsGraphite
Landfill
Landfill
Fluff
Cu Fe Al
CombinedPyro+Hydro
Figure 99:
Schematic overview of Li-ion battery recycling
processes.
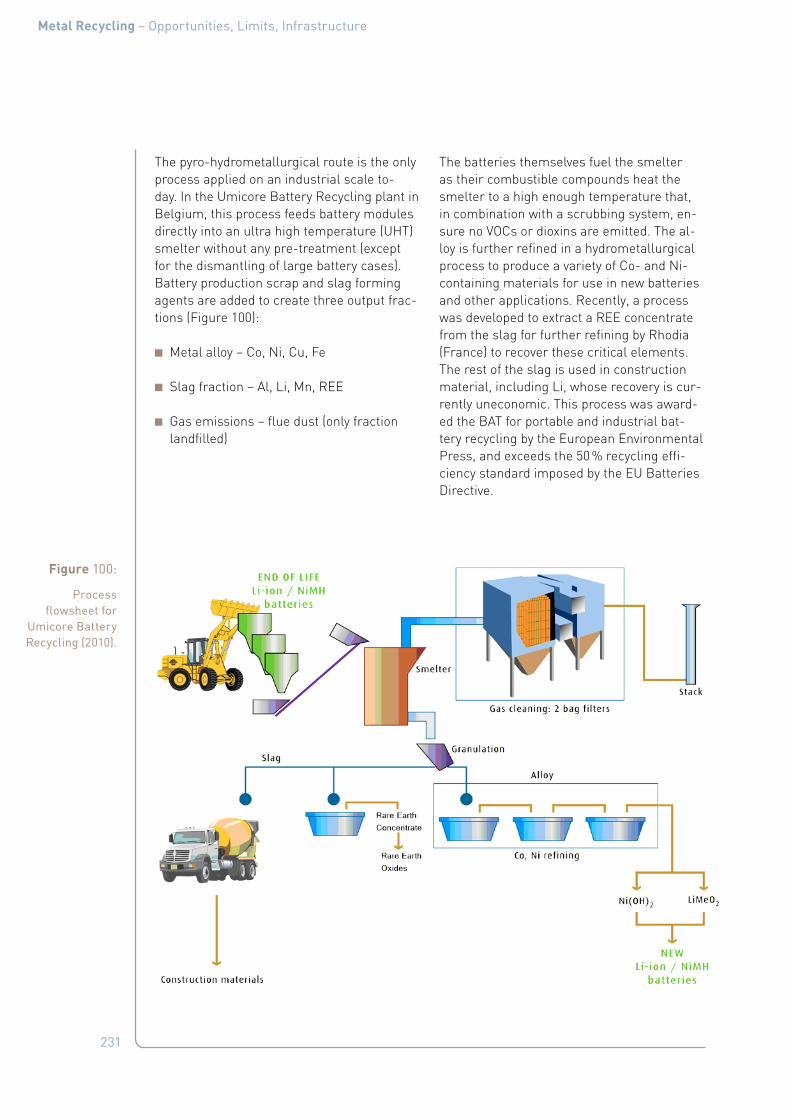
231
Metal Recycling – Opportunities, Limits, Infrastructure
The pyro-hydrometallurgical route is the only process applied on an industrial scale to-day. In the Umicore Battery Recycling plant in Belgium, this process feeds battery modules directly into an ultra high temperature (UHT) smelter without any pre-treatment (except for the dismantling of large battery cases). Battery production scrap and slag forming agents are added to create three output frac-tions (Figure 100):
■ Metal alloy – Co, Ni, Cu, Fe
■ Slag fraction – Al, Li, Mn, REE
■ Gas emissions – flue dust (only fraction landfilled)
The batteries themselves fuel the smelter as their combustible compounds heat the smelter to a high enough temperature that, in combination with a scrubbing system, en-sure no VOCs or dioxins are emitted. The al-loy is further refined in a hydrometallurgical process to produce a variety of Co- and Ni-containing materials for use in new batteries and other applications. Recently, a process was developed to extract a REE concentrate from the slag for further refining by Rhodia (France) to recover these critical elements. The rest of the slag is used in construction material, including Li, whose recovery is cur-rently uneconomic. This process was award-ed the BAT for portable and industrial bat-tery recycling by the European Environmental Press, and exceeds the 50 % recycling effi-ciency standard imposed by the EU Batteries Directive.
Figure 100:
Process flowsheet for
Umicore Battery Recycling (2010).

232
Metal Recycling – Opportunities, Limits, Infrastructure
The multiple chemical compounds in Li-ion batteries highlight the need for robustness in the recycling system. Most portable Li-ion batteries use lithium cobalt oxide (LCO) compounds for the cathode, but the share of manganese oxide (LMO) and iron phosphate (LFP) compounds is increasing, particularly in cordless power tools. Anode materials are evolving as well, with C, Si, Sn and Ti com-pounds expected in the future. Currently, bat-tery labels mention only “Li-ion” and not a specific chemistry. Unless sophisticated la-belling and sorting methods are instituted for Li-ion, recyclers will have to cope with this diversity in materials, which will pose a ma-jor challenge. Starting the recovery process with a pyrometallurgical step has an advan-tage in this regard, as it allows more valua-ble metals to be easily separated into an alloy from those that are less valuable, which are slagged.
10.3 Drivers
Battery recycling is driven by metal value and legislation. The metal value of used re-chargeable batteries is significant, driven mainly by Co and Ni, which in 2010 had aver-age prices of $45 and $21 per kg (Metal Bul-letin, 2010), respectively. The nickel in one tonne of NiMH batteries represents a value of about $6,000. Even greater value can be extracted from recycled batteries if the bat-tery materials are recovered as compounds instead of breaking them down to elemen-tal state. The continuous evolution of battery compounds, use of manufacturer-specific formulations, and extremely high quality re-quirements make this approach very difficult, though, unless one-to-one relationships be-tween manufacturers and recyclers are de-veloped. Though critical today for geopolitical reasons, Li and REE will require increased battery collection volumes to leverage scale effects and make their recovery economic. It is important to note from a recycling per-spective that REEs are not the same in dif-ferent applications. Combining REE waste streams to leverage scale effects would not
be wise as it would greatly complicate the subsequent refining process.
Legislation encourages battery recycling mainly because of environmental and health risks from hazardous battery materials and concerns over the scarcity of raw materials. The scarcity issue revolves mainly around Co, Li and REE, each of which presents its own challenges. Co is seen as the main metal with scarcity concerns, but at least there is an economic incentive for its recycling, and it can be substituted by Ni and Mn, both of which are less scarce. Li, on the other hand, has no foreseeable substitute and presents geopolitical concerns with 80 % of its world resources based in Chile, Bolivia and Argenti-na. Though resources are significant, current production is relatively small-scale and in-creasing it in the short term will be challeng-ing, as it relies on the evaporation of brines by sunlight.
Finally, in the case of REEs there are many competing applications as these unique met-als are used in the miniaturization of many technologies. In addition, production today is highly concentrated in China. One response to this is from Toyota Tsusho, which an-nounced its intention to cooperate with Indian Rare Earth Ltd. in 2010 to build a REE recov-ery plant for processing by-products from uranium and thorium mining in India, reduc-ing Toyota’s reliance on Chinese REEs (Toyota Tsusho Corporation, 2010).
The environmental benefits from appropri-ate battery recycling go beyond the preven-tion of hazardous material emissions to re-ducing primary metal production, though the magnitude of this benefit varies depending on the metals contained and processes used. The recycling of batteries that only contain abundant metals (Fe, Mn, etc.) could actu-ally be more damaging than making the bat-teries from primary metal. In these cases, a critical evaluation from a life cycle perspec-tive is essential for determining if other dis-posal methods are more favourable than re-cycling. In areas where battery landfilling is forbidden, such as the EU, downcycling these

233
Metal Recycling – Opportunities, Limits, Infrastructure
materials to construction slag may be prefer-able. In general, though, LCA has shown the positive impact of recycling batteries with ap-propriate technology, including CO2 reduction benefits from using recycled Co and Ni rather than primary resources. Resource use, quan-tified as cumulative exergy extracted from the natural environment (CEENE), was shown to be 51 % lower for recycled cathode Co and Ni for a Li-ion battery, than primary mate-rial. The exergy savings arise mainly in fos-sil resources, nuclear energy and water re-sources (Figure 101). In response to an LCA study, which concluded that an HEV with a NiMH battery has greater acidification poten-tial than a conventional vehicle, it was shown that HEV acidification potential can be large-ly neutralized if the batteries are efficiently collected and recycled. This is a result of the large benefit from replacing virgin nickel with recycled Ni.
In response to these concerns, the EU has in-stituted the most advanced battery recycling legislation in the world through the European Batteries Directive (BD). This has clear col-lection and recycling targets, though as these are for all batteries combined, the already high recycling rates of primary batteries al-low some countries to meet the target with-out significantly increasing secondary bat-
tery recycling. The BD targets a 25 % collec-tion rate by 2012 and a 45 % collection rate by 2016. The 2012 target has not yet been reached in all member states. Other rele-vant EU legislation includes the WEEE and ELV directives, which encourage battery re-cycling by targeting the main applications of rechargeable batteries, EEE products and ve-hicles, by setting collection and recycling tar-gets as well. As the batteries remain in these products at the end-of-life, they are easily re-moved from the product as long as the prod-uct is collected.
In the US and Canada, battery recycling is based on domestic recycling competency. As no environmentally-friendly recycling of Li-ion batteries is available, only low or volun-tary targets have been set on the State and Provincial levels. Regulation may become more severe if appropriate technology be-
comes available. In addition, Japan regulates the recycling of portable rechargeable bat-teries and several South American countries have begun regulations on battery recycling. In light of the quickly growing global market for rechargeable batteries, it seems reason-able to expect recycling efforts to be encour-aged and even regulated by law worldwide.
Figure 101:
Dependency on natural resource
categories for recycled (A) and primary
material (B) to fill the Co and Ni
requirement of a Li-ion cathode (Dewulf and van
Langenhove, 2005).
0 100 200 300 400 500
Land
Water res.
Minerals
Metal ores
Nuclear en.
Fossil res.
Renewable res.
MJ CEENE
Scenario B
Scenario A

234
Metal Recycling – Opportunities, Limits, Infrastructure
10.4 Additional data from academic research into battery recycling
Figure 102 reviews the recycling of NiMH bat-teries. Umicore and Rhodia recently devel-oped a process for recovering REEs from NiMH batteries (Umicore, 2011; Bertuol et al., 2006; Pietrelli et al., 2002).
Figure 102:
Processing of NiMH batteries
(Müller and Friedrich, 2006;
Pietrelli et al., 2002).
T. Muller, B. Friedrich / Journal of Power Sources 158 (2006) 1498–1509 1501
Fig. 3. Flow sheet of an alternative recycling process.
Fig. 4. Phase diagram CaO–CaF2 [15].
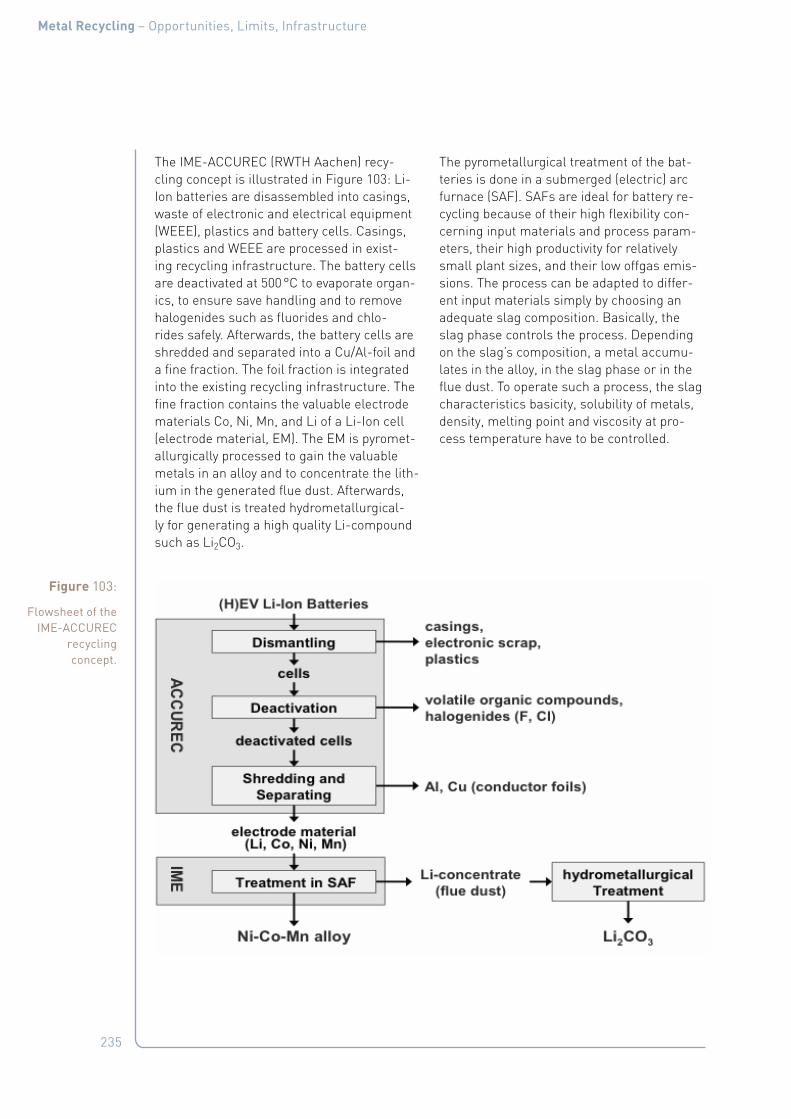
235
Metal Recycling – Opportunities, Limits, Infrastructure
The IME-ACCUREC (RWTH Aachen) recy-cling concept is illustrated in Figure 103: Li-Ion batteries are disassembled into casings, waste of electronic and electrical equipment (WEEE), plastics and battery cells. Casings, plastics and WEEE are processed in exist-ing recycling infrastructure. The battery cells are deactivated at 500 °C to evaporate organ-ics, to ensure save handling and to remove halogenides such as fluorides and chlo-rides safely. Afterwards, the battery cells are shredded and separated into a Cu/Al-foil and a fine fraction. The foil fraction is integrated into the existing recycling infrastructure. The fine fraction contains the valuable electrode materials Co, Ni, Mn, and Li of a Li-Ion cell (electrode material, EM). The EM is pyromet-allurgically processed to gain the valuable metals in an alloy and to concentrate the lith-ium in the generated flue dust. Afterwards, the flue dust is treated hydrometallurgical-ly for generating a high quality Li-compound such as Li2CO3.
The pyrometallurgical treatment of the bat-teries is done in a submerged (electric) arc furnace (SAF). SAFs are ideal for battery re-cycling because of their high flexibility con-cerning input materials and process param-eters, their high productivity for relatively small plant sizes, and their low offgas emis-sions. The process can be adapted to differ-ent input materials simply by choosing an adequate slag composition. Basically, the slag phase controls the process. Depending on the slag’s composition, a metal accumu-lates in the alloy, in the slag phase or in the flue dust. To operate such a process, the slag characteristics basicity, solubility of metals, density, melting point and viscosity at pro-cess temperature have to be controlled.
Figure 103:
Flowsheet of the IME-ACCUREC
recycling concept.

236
Metal Recycling – Opportunities, Limits, Infrastructure
10.5 Lead batteries
Used predominately for conventional car bat-teries, such batteries have lead electrodes and a sulphuric acid electrolyte solution. Collection rates are typically high (> 90 % in many developed countries, though signifi-cantly lower globally) due to lead´s charac-terization as a hazardous substance and the existence of well-established recycling sys-tems. Processing begins by breaking the bat-teries open, crushing and mechanically sepa-rating them into case materials, metal grids and poles, lead pastes (oxides and sulphate), and the acid, which is collected and reused or disposed. Pastes are then treated to remove sulphur before entering the furnace with the grid metal. Lead metal low in antimony is produced along with antimony metal contain-ing lead from the grid metal. Smelting can occur in rotary furnaces as well as TSL tech-nology (Figure 47), for example, which can produce around 130,000 tpa of recycled lead from a variety of feeds. Finally, the lead is re-fined to produce soft lead or, most common-ly, new battery alloys. If other lead scrap is added during smelting, extra refining may be needed to produce a suitable metal quality.
10.6 Batteries in electric vehicles
The possible increase in the use of elec-tric vehicles poses the question if there are enough resources for these new products. Lithium is an important element in this re-gard due to the required battery technol-ogy. A recent study by Fraunhofer ISI (EU, 2010) shows that if newly registered cars would globally consist of 50 % electric vehi-cles, only about 20 per cent of the currently known global lithium resources would have been used by 2050 (Figure 104). This scenario considers the use of recycled materials and lithium demand for other applications. Even if market penetration would reach 85 %, the re-source would not be depleted by 2050, but the current resources that can be recovered by present technology will have been exhaust-ed. Thus, developing recycling is important in addition to the development of technologies allowing the highest possible recovery of lith-ium form its natural deposits. Various pro-jects recently started in the EU to address the recycling of lithium-containing batteries for the automotive sector.
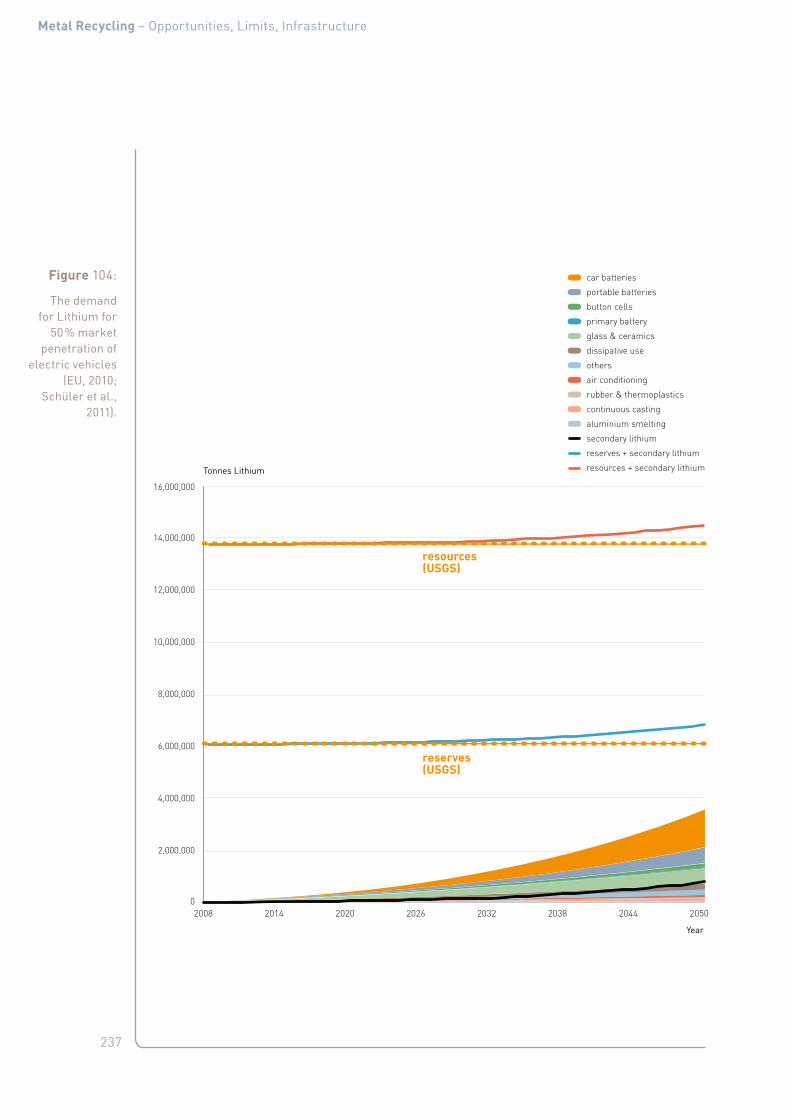
237
Metal Recycling – Opportunities, Limits, Infrastructure
Figure 104:
The demand for Lithium for
50 % market penetration of
electric vehicles (EU, 2010;
Schüler et al., 2011).
car batteries
portable batteries
button cells
primary battery
glass & ceramics
dissipative use
others
air conditioning
rubber & thermoplastics
continuous casting
aluminium smelting
secondary lithium
reserves + secondary lithium
resources + secondary lithium
2,000,000
0
4,000,000
6,000,000
8,000,000
10,000,000
12,000,000
14,000,000
16,000,000
20502044203820322026202020142008
resources(USGS)
reserves(USGS)
Tonnes Lithium
Year

238
Metal Recycling – Opportunities, Limits, Infrastructure
10.7 Quantifying materials in EoL batteries
Figure 105 summarizes the use of Ni, REs, Co and Li in batteries in diverse applications in the EU, measured relative to the total pro-duction of these metals. It is clear that nickel, REEs, cobalt and lithium are important met-als for the future.
The following data are reported for small white and brown goods (Van Schaik, 2011; Wecycle, 2011): 0.0654 % NiCd (dry), 0.0336 % alkaline, 0.0118 % NiMH, 0.0056 % Li-ion en 0.123 % lead batteries (dry) (% of total), which is 26,456 tonnes in 2010 for the Netherlands. This translates to roughly 250 kg REEs/year for collected NiMH batteries in the Nether-lands. This is an indicative though rather low number. Figure 105 projects the use of REEs and other metals used in batteries to 2020 from 2010, showing a large increase if vehi-cle applications increase. Noteworthy is the still rather low REE usage, Ni and Co being dominant. These would be well suited for re-cycling on the back of the Carrier Metals of Figure 15.
Figure 105:
The use of Ni, REs, Co and Li in
batteries in the EU and the use
of the metals relative to total
production (HEV: Hybrid Electric
Vehicle; EV: Full Electric Vehicle)
(Eurometaux, 2010) – (also EU Critical Metals).
0 2000 4000 6000 8000 10000 12000
2020
2010
NickelEV 6.0 %
NickelHEV
NickelPortable
Tonnes/YearTonnes/Year
2020
2010
Pour redimensionner la plage de données du graphique, faites glisser le coin inférieur droit de la plage.
0 500 1000 1500 2000 2500 3000 3500
Rare-EarthHEV
Rare-EarthPortable
From 100,000 to 1.0 million HEV& 1.0 million Full EV (EU data)
From 100,000 to 1.0 million HEV in EU
Nickel
2010 Nickel uses in Batteries: > 5 %
Rare Earth
Rare Earth uses in Batteries: 20 %
2020
2010
CobaltEV (6.0 %)
CobaltHEV
CobaltPortable
LithiumEV (1.5 %)
LithiumHEV
LithiumPortable
Tonnes/YearTonnes/Year
2020
2010
Pour redimensionner la plage de données du graphique, faites glisser le coin inférieur droit de la plage.
From 100,000 to 1.0 million HEV& 1.0 million Full EV
Cobalt
2010 Cobalt uses in Batteries: 20 %
Lithium
2010 Lithium uses in Batteries: > 25 %
0 500 1000 1500 2000 2500 30000 2000 4000 6000 8000 10000 12000

239
Metal Recycling – Opportunities, Limits, Infrastructure
11. Appendix D: Mobile Phone Collection
The efforts of mobile phone company Nokia (Nokia, 2012) to recycle mobile phones pro-vide an example of what can be achieved with collection schemes (Elker 2012).
11.1 Mobile phone collection for recycling
Mobile-phone recycling programmes started in the late 1990s in Europe. Today, Nokia of-fers recycling programmes for mobile phones in almost 100 countries. At the company’s own premises, very efficient waste sorting can lead to true closed-loop material cir-cles. When discussing take-back of obsolete phones from consumers, the challenge is different, because of the difficulty in aware-ness raising of post-consumer waste and the building up of eco efficient collection infra-structures. Financial incentives can be used for initiating recycling behaviour, but their impact decreases when recycling becomes a daily habit. One of the main teachings of past take-back projects has been the use of the right language for communicating the
benefits of recycling and finding the right partners, and, most importantly, creating long-term commitment to programmes. Con-sumers who recycled their old mobile phones increased from 3 % to 9 % between 2007 and 2011. There are differences between devel-oped and developing markets in the access to recycling points and information, but the importance of the topic is becoming globally understood.
A 2011 study commissioned by Nokia found a disparity between the awareness of materi-als and items that can be recycled and actual recycling behaviour in the studied markets. Finland, Germany and Spain were the biggest recyclers in terms of the range of items that people usually recycle. Of the 11 countries in the study, the United Arab Emirates, Nige-ria and Indonesia recycled the smallest range of items. Overall, developed countries were more aware of the range of different materi-als and items that can be recycled than de-veloping nations, and also tended to recycle more. The barriers to recycling in developing countries were less awareness of what can be recycled and fewer recycling channels; see also Figure 18.
The main barrier for phone recycling is that people like to keep the phones as spare or back-up. Figure 106 shows seven reasons for not recycling a mobile phone.
Figure 106:
Reasons for not recycling a
mobile phone (Damanhuri,
2012).
0 2010 155
I was concerned about the security of my personal data that was stored on my phone
I didn‘t know that I could recycle old mobile phones
My old mobile phone was worth good money soI didn‘t want to give it away for nothing
There are no mobile phone recycling facilities near me
I don‘t know where to go to recycle my mobile phone
It didn‘t occur to me to recycle my mobile phone
I prefer to keep my old mobile phones as backup
[%]
25 30 35
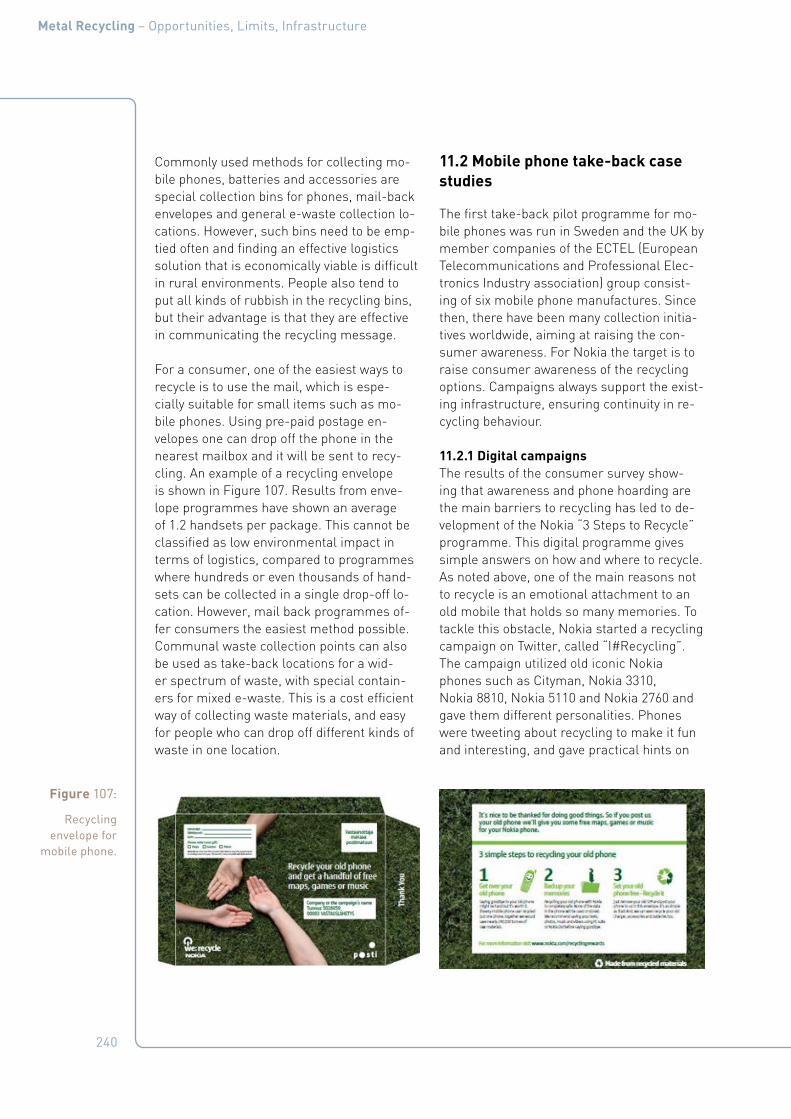
240
Metal Recycling – Opportunities, Limits, Infrastructure
Commonly used methods for collecting mo-bile phones, batteries and accessories are special collection bins for phones, mail-back envelopes and general e-waste collection lo-cations. However, such bins need to be emp-tied often and finding an effective logistics solution that is economically viable is difficult in rural environments. People also tend to put all kinds of rubbish in the recycling bins, but their advantage is that they are effective in communicating the recycling message.
For a consumer, one of the easiest ways to recycle is to use the mail, which is espe-cially suitable for small items such as mo-bile phones. Using pre-paid postage en-velopes one can drop off the phone in the nearest mailbox and it will be sent to recy-cling. An example of a recycling envelope is shown in Figure 107. Results from enve-lope programmes have shown an average of 1.2 handsets per package. This cannot be classified as low environmental impact in terms of logistics, compared to programmes where hundreds or even thousands of hand-sets can be collected in a single drop-off lo-cation. However, mail back programmes of-fer consumers the easiest method possible. Communal waste collection points can also be used as take-back locations for a wid-er spectrum of waste, with special contain-ers for mixed e-waste. This is a cost efficient way of collecting waste materials, and easy for people who can drop off different kinds of waste in one location.
11.2 Mobile phone take-back case studies
The first take-back pilot programme for mo-bile phones was run in Sweden and the UK by member companies of the ECTEL (European Telecommunications and Professional Elec-tronics Industry association) group consist-ing of six mobile phone manufactures. Since then, there have been many collection initia-tives worldwide, aiming at raising the con-sumer awareness. For Nokia the target is to raise consumer awareness of the recycling options. Campaigns always support the exist-ing infrastructure, ensuring continuity in re-cycling behaviour.
11.2.1 Digital campaignsThe results of the consumer survey show-ing that awareness and phone hoarding are the main barriers to recycling has led to de-velopment of the Nokia “3 Steps to Recycle” programme. This digital programme gives simple answers on how and where to recycle. As noted above, one of the main reasons not to recycle is an emotional attachment to an old mobile that holds so many memories. To tackle this obstacle, Nokia started a recycling campaign on Twitter, called “I#Recycling”. The campaign utilized old iconic Nokia phones such as Cityman, Nokia 3310, Nokia 8810, Nokia 5110 and Nokia 2760 and gave them different personalities. Phones were tweeting about recycling to make it fun and interesting, and gave practical hints on
Figure 107:
Recycling envelope for
mobile phone.

241
Metal Recycling – Opportunities, Limits, Infrastructure
where and how to recycle. During the three weeks of the campaign, it reached 170,000 people online in 44 countries and created 2800 Facebook "likes". The campaign was also translated into Chinese and run in Chi-nese social media channels.
11.2.2 The case UgandaWhen Nokia planned the first mobile-phone recycling campaign in Uganda in 2010, many people were sceptical about the success of the campaign. Comments stated that “recy-cling may work in Western countries, but not in Africa”, or “People expect money in re-turn for their old phones, and if you don't give money you won't get any phones back.” Even with such comments, there was a belief that with over 11 million mobile subscribers in Uganda, there was a great potential.
The first recycling campaign was arranged in the Uchumi supermarket in Kampala for two days. During those two days 459 old phones, 254 chargers and 239 batteries, in all almost one thousand items, were collected for re-cycling. Consumers in Uganda see every day the problems created by the illegal dumping of electronic waste in their country, and they are ready to take action. Among the success factors of the campaign were the radio ads that Nokia ran on several stations, encour-aging people to recycle, and the distribution of small gifts and the organization of a raffle with a chance to win a new phone. In addi-tion, permanent collection points have been set up at the Nokia repair centres, with recy-cling bins for people to drop off their unwant-ed phones and accessories.
11.2.3 Phone recycling in other countriesIn Latin American countries, Nokia and oth-er recycling programmes started in 2006 in Mexico, in cooperation with telecom opera-tor Telefonica. Cooperation has expanded to Peru, Brazil, Chile, Columbia, Ecuador and Argentina. Latin American countries have already collected 375 tonnes of e-waste in these programmes, which are good examples of the long-term thinking needed when start-ing recycling programmes for consumers and
how the working concept can be duplicated from one country to another.
Nokia Brazil started a recycling programme by partnering with Pão de Açúcar Group, the largest retailer in the country. With this, Nokia broadens considerably the number of recycling points, which, until then, had fo-cused only on the Nokia service centres. For a limited period, a discount for a new phone is offered for those who recycle their old phone.
Nokia has also raised recycling awareness in cooperation with environmental NGO’s in many countries. In Lebanon, it has been working in cooperation with the Association for Forests, Development and Conservation (AFDC) to conduct recycling events in uni-versities. In the United Arab Emirates, there is collaboration with the Emirates Environ-mental Group (EEG) working with schools and corporations to raise the awareness level about recycling. Posters created by a well-known filmmaker in the UAE help to change children into “Recycling heroes”. Nokia India also made two educational books for chil-dren in cooperation with TERI (The Energy and Resource Institute), to support aware-ness raising at schools. In Singapore, as part of Nokia’s Environmental Conservation initiative—Recycle A Phone, Adopt A Tree—students from Temasek Polytechnic got a chance to participate in a field trip to WWF re-forestation site Rinjani Forest on Lombok Island, Indonesia, that Nokia is sponsoring. Wild Ocean is a nature film that in the USA has helped Nokia to spread the sustainabil-ity message for school groups. A Wild Ocean education campaign was launched utilizing Nokia-branded educator guides and activity posters available for schools.

242
Metal Recycling – Opportunities, Limits, Infrastructure
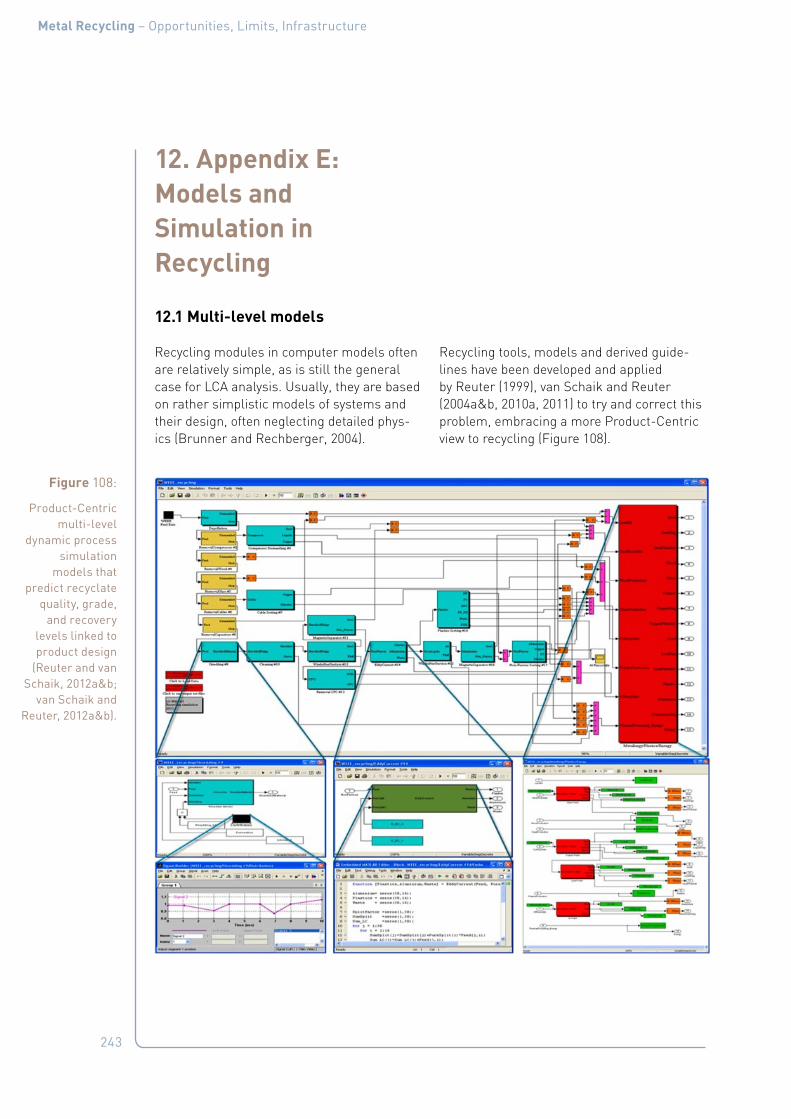
243
Metal Recycling – Opportunities, Limits, Infrastructure
12. Appendix E: Models and Simulation in Recycling
12.1 Multi-level models
Recycling modules in computer models often are relatively simple, as is still the general case for LCA analysis. Usually, they are based on rather simplistic models of systems and their design, often neglecting detailed phys-ics (Brunner and Rechberger, 2004).
Recycling tools, models and derived guide-lines have been developed and applied by Reuter (1999), van Schaik and Reuter (2004a&b, 2010a, 2011) to try and correct this problem, embracing a more Product-Centric view to recycling (Figure 108).
Figure 108:
Product-Centric multi-level
dynamic process simulation
models that predict recyclate
quality, grade, and recovery
levels linked to product design
(Reuter and van Schaik, 2012a&b;
van Schaik and Reuter, 2012a&b).
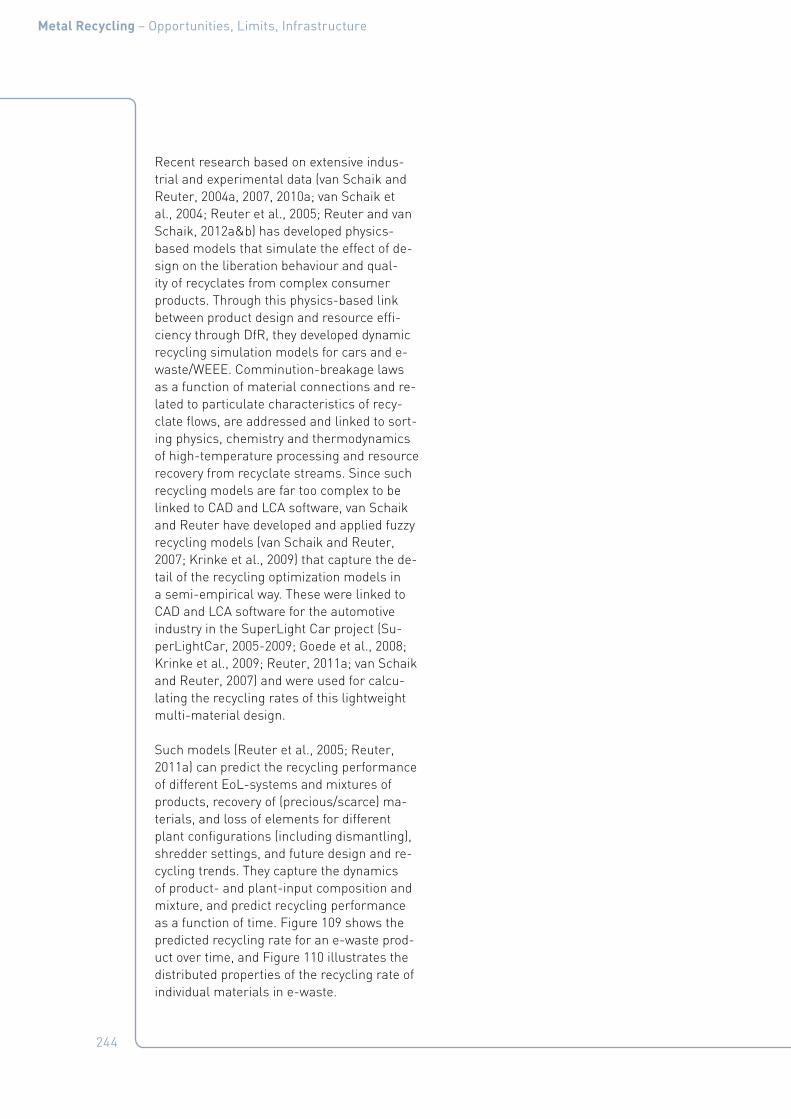
244
Metal Recycling – Opportunities, Limits, Infrastructure
Recent research based on extensive indus-trial and experimental data (van Schaik and Reuter, 2004a, 2007, 2010a; van Schaik et al., 2004; Reuter et al., 2005; Reuter and van Schaik, 2012a&b) has developed physics-based models that simulate the effect of de-sign on the liberation behaviour and qual-ity of recyclates from complex consumer products. Through this physics-based link between product design and resource effi-ciency through DfR, they developed dynamic recycling simulation models for cars and e-waste/WEEE. Comminution-breakage laws as a function of material connections and re-lated to particulate characteristics of recy-clate flows, are addressed and linked to sort-ing physics, chemistry and thermodynamics of high-temperature processing and resource recovery from recyclate streams. Since such recycling models are far too complex to be linked to CAD and LCA software, van Schaik and Reuter have developed and applied fuzzy recycling models (van Schaik and Reuter, 2007; Krinke et al., 2009) that capture the de-tail of the recycling optimization models in a semi-empirical way. These were linked to CAD and LCA software for the automotive industry in the SuperLight Car project (Su-perLightCar, 2005-2009; Goede et al., 2008; Krinke et al., 2009; Reuter, 2011a; van Schaik and Reuter, 2007) and were used for calcu-lating the recycling rates of this lightweight multi-material design.
Such models (Reuter et al., 2005; Reuter, 2011a) can predict the recycling performance of different EoL-systems and mixtures of products, recovery of (precious/scarce) ma-terials, and loss of elements for different plant configurations (including dismantling), shredder settings, and future design and re-cycling trends. They capture the dynamics of product- and plant-input composition and mixture, and predict recycling performance as a function of time. Figure 109 shows the predicted recycling rate for an e-waste prod-uct over time, and Figure 110 illustrates the distributed properties of the recycling rate of individual materials in e-waste.
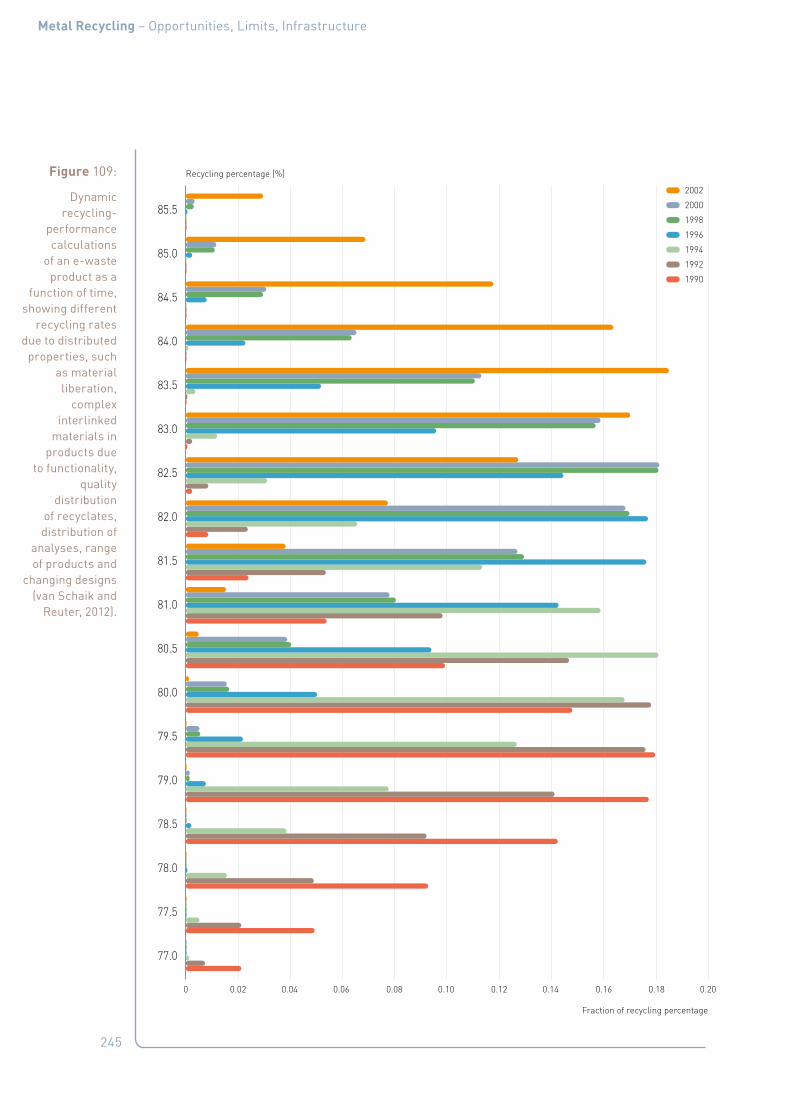
245
Metal Recycling – Opportunities, Limits, Infrastructure
Figure 109:
Dynamic recycling-
performance calculations
of an e-waste product as a
function of time, showing different
recycling rates due to distributed
properties, such as material liberation,
complex interlinked
materials in products due
to functionality, quality
distribution of recyclates, distribution of
analyses, range of products and
changing designs (van Schaik and
Reuter, 2012).
0 0.02 0.04 0.080.06 0.10 0.12 0.14 0.16 0.18 0.20
2002
2000
1998
1996
1994
1992
1990
85.5
85.0
84.5
84.0
83.5
83.0
82.5
82.0
81.5
81.0
80.5
80.0
79.5
79.0
78.5
78.0
77.5
77.0
Recycling percentage [%]
Fraction of recycling percentage
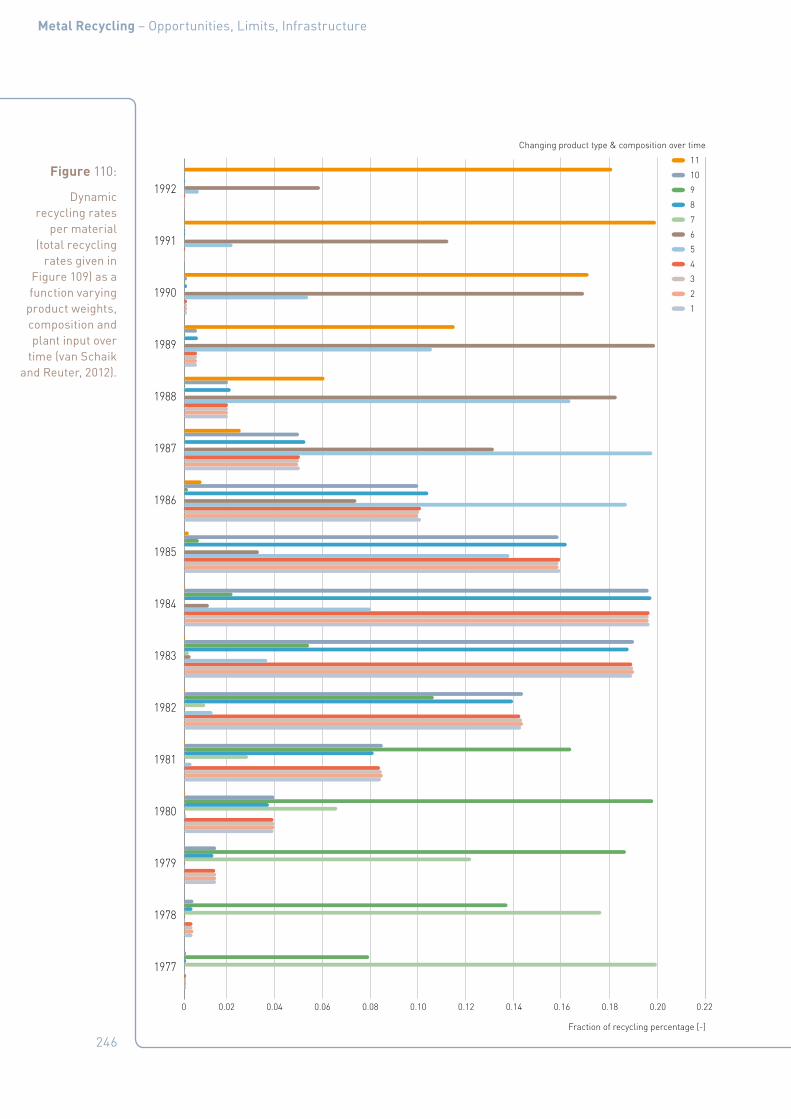
246
Metal Recycling – Opportunities, Limits, Infrastructure
Figure 110:
Dynamic recycling rates
per material (total recycling
rates given in Figure 109) as a function varying
product weights, composition and plant input over
time (van Schaik and Reuter, 2012).
11
10
9
8
7
6
5
4
3
2
1
0 0.02 0.04 0.080.06 0.10 0.12 0.14 0.16 0.18 0.20 0.22
1992
1991
1990
1989
1988
1987
1986
1985
1984
1983
1982
1981
1980
1979
1978
1977
Changing product type & composition over time
Fraction of recycling percentage [-]

247
Metal Recycling – Opportunities, Limits, Infrastructure
An extensive recycling flowsheet (for example for ELVs, see Figure 111) was defined in these models representing the entire recycling sys-tem based on a network of processes and material flows. This describes, defines and optimizes the combination of individual recy-cling processes for material flows originating from multi-material design (see Figure 59). This flowsheet is the basis for investigat-ing different processing routes for a prod-uct. Multi-dimensional flowsheets provide a graphical and technological blueprint of recy-cling system models, to predict and calculate the possibilities and limits of recycling.
The predicted recyclate and recycling-prod-uct mass flows by these models, including the presence of contaminants and dispersion of critical and/or toxic materials during recy-cling, is the basis for the illustrated recycling
rate calculations. Figure 112 shows, as an ex-ample, the calculated mass flow (relative to input/output of plant) of selected recyclate streams from e-waste recycling. These pre-dictions include a bandwidth of the results as a function of changing processing conditions, input composition (based on changing mix-ture of plant input), changing product weight, composition, etc. Figure 113 shows the cal-culated distributed nature of quality, based on the example of a ferrous recyclate. This il-lustrates that the quality and grade of recy-clates are not only calculated from its ferrous content, but also include other materials and
contaminants in the recyclate streams, due to imperfect separation and liberation. This type of modelling is needed to drive changes and identify recycling possibilities and limits for future situations.
Figure 111:
Post-shredder technology plant
for ELVs as operated by ARN
(2013).
207 mm 207 mm192 mm 192 mm
SEPARATION2
SHREDDER WASTE
1
FINALFRACTIONS3
Aluminiumand copper
ventilator
sieveAluminiumand copper
19%Plastics
26%Fibres
35%Minerals
14%Others
3%
Ferro
3%
Non-ferros
Tiel
From waste to raw materialThanks to the PST plant, it will already be possible to recycle roughly 90% of end-of-life cars in 2010. This illustration shows a large part of the process..
1 The PST plant processes the shredder waste.
2 The smaller pieces of iron are separated with
a rotating magnet.
3 Non-ferros are separated with
an eddy current.
4 An air knife separates the heavy pieces. The materials pass over a hole through
which air is being blown. Lighter particles can pass over the hole but heavier pieces which the hammermill can’t handle, such as stainless steel and stone, fall into the hole..
5 The rest is finely crushed in a hammermill and
then sifted.
6 Air separation technology is used to remove dust
and microfibres from the smallest fraction. What is left is the sand fraction.
7 The particles larger than 5 mm are amalgamated,
ultimately forming the fibre fraction.
8 Particles are finely crushed by a grinder.
Density separation is then used to separate the non-ferrous particles
9 Air is blown upwards through
a zig-zag classifier. The fraction descends
10 Plastics of different quality are then
separated according to density using a method of floating or sinking.
particles>5 mm
particles<30 mm
particles1 to 5 mm
minor streamsand minerals
HighPVC content
(sinks)
particles<1 mm
dust, microfibers
air
air
water
Minerals
Stainless steel
Iron
Minerals
Fibres
Low PVCcontent
Eddy currentAn instrument that generates a magnetic field. In it, a conductive particle (non-ferrous) acts as the opposing magnetic force so that it is repelled. Some non-ferrous parts are more conductive than others, so that some parts are repelled further than others.
End-of-life cars are crushed in a shredder.
Shredder waste is transported to the PST plant by truck.
Composition of the shredder waste:
TIELTIEL
in 10 steps
Viz
ualis
m 2
009
From waste to raw material
AUTORN006-milieuverslUK-binnen-AF2.indd 23-26 30-07-2009 12:26:07
Figure 112:
Bandwidth of various produced
recyclate streams (van Schaik and
Reuter, 2012).
Copper recyclate
Stainless Steel recyclate
Aluminium recyclate
Ferrous recyclate
Organic/combustiblerecyclate
Fines (noncombustible) recyclate
Inert recyclate
0 2010 4030 6050
Bandwidth of recyclate mass flow [% of total]

248
Metal Recycling – Opportunities, Limits, Infrastructure
Figure 113:
Quality of ferrous recyclate stream
including the quantification
and specification of the
composition and contamination
of the recyclate streams – it is
obvious that the 3.1 % copper in
the top figure is not good for
steel quality (van Schaik and
Reuter, 2012).
0 20 40 60 80 100
Min
Max
% Fe/Steel
% Other Materials
[%]
0.0 0.2 0.4 0.6 0.8
Max
Min
Others
Main cord
Bitumen
Concrete
Magnets
Brass
Rubber
PWB
Ceramics
Glass
Wood
Plastics
Copper wire
Copper
Stainless Steel
Aluminium
Contaminants in [%] of total recyclate stream

249
Metal Recycling – Opportunities, Limits, Infrastructure
12.2 Uses of multi-level simulation tools
Engineering- and industry-friendly simula-tion models define and provide the essential metrics for measuring, controlling and im-proving recycling, determining recycling con-cepts, and enhancing product design, thus facilitating high recycling and energy recov-ery rates while advising policy. While simi-lar models were discussed elsewhere in this document for WEEE recycling, the follow-ing example based on ELVs illustrates some of the modelling that has been done to date. The models developed for the EU funded Su-perLightCar project managed by Volkswagen AG, provide detailed and physics-based cal-culations on recycling and recovery of ELVs, and have also been applied for determining optimal recycling concepts (combination and arrangement of processes) for a car body, in-cluding the following aspects:
■ Product design and liberation.
■ Separation physics of automated sorting.
■ Chemistry and thermodynamics of metal production and recycling systems.
■ Recyclate and recycling product quality (physical and chemical) as a function of product design choices and calorific values of the (intermediate) recycling streams.
■ Losses and emissions.
■ Optimization and selection of plant and flowsheet architecture with changing prod-uct design (Figure 59).
This enables the following industrial applica-tions:
■ Calculation and prediction of the dynami-cally changing recycling and recovery rates of ELVs and light-weight car-design con-cepts and of all individual materials in these products for different recycling sce-narios and objectives (maximum total re-cycling/recovery, maximum recycling of metals, minimum production of waste, legislative constraints, etc.) as a function of the distributed ELV population over time (see Figure 10); this approach has also been applied to different types of e-waste products;
■ Prediction of grade (quality/composition) of all (intermediate) recycling streams (steel, copper, plastic, etc.) and recycling prod-ucts (metal, matte, speiss, slag, flue dust, off gas) (see Figure 114).Figure 114:
Quality of (a) fer-rous and (b) alu-
minium recyclate streams, includ-
ing quantification and specification
of the composi-tion/contamina-tion of recyclate streams (c) and (d) respectively for ferrous and
aluminium frac-tion (presented as bandwidths
as a function of changes in input, recycling routes,
etc.) (Reuter et al., 2005; Su-perLightCar, 2005 – 2009).
0.0 0.2 0.4 0.6 0.8 1.0
Min
Max
% Fe/Steel
% Others
[%]
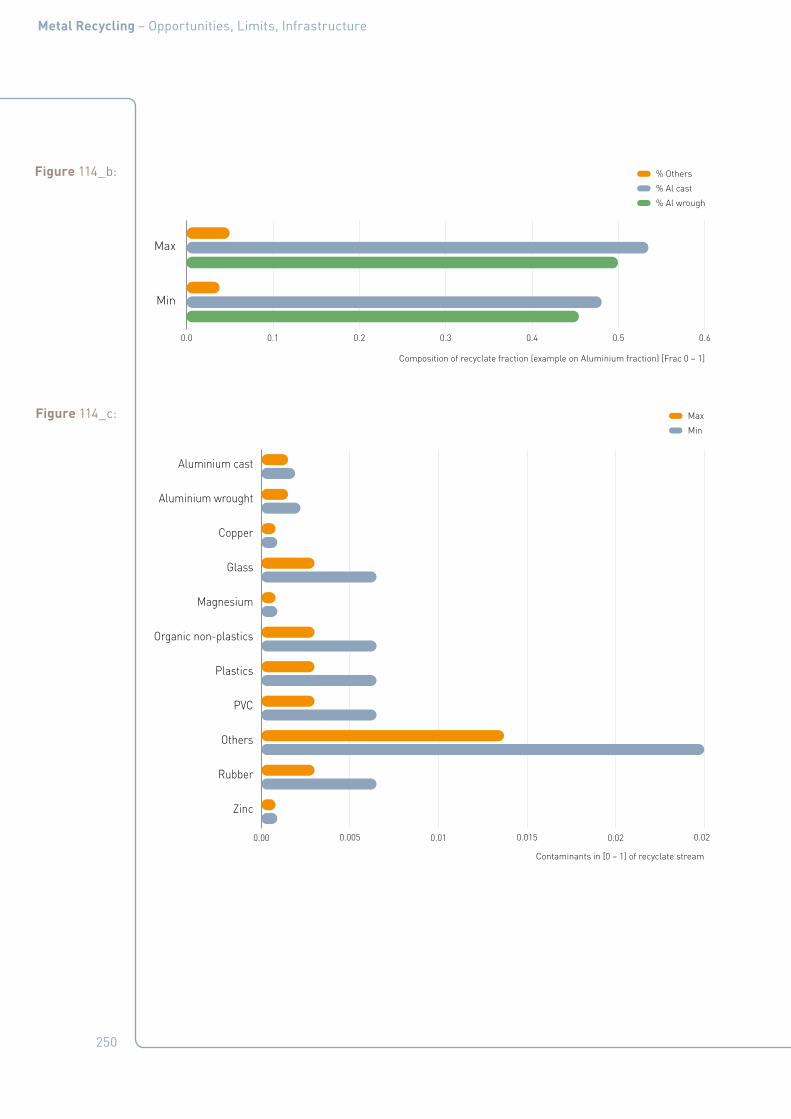
250
Metal Recycling – Opportunities, Limits, Infrastructure
Figure 114_b:
0.0 0.1 0.2 0.3 0.4 0.5 0.6
% Al wrough
% Al cast
% Others
Min
Max
Composition of recyclate fraction (example on Aluminium fraction) [Frac 0 – 1]
Figure 114_c:
0.00 0.005 0.01 0.015 0.02 0.025
Zinc
Rubber
Others
PVC
Plastics
Organic non-plastics
Magnesium
Glass
Copper
Aluminium wrought
Aluminium cast
Contaminants in [0 – 1] of recyclate stream
Min
Max

251
Metal Recycling – Opportunities, Limits, Infrastructure
■ Prediction of the dispersion, occurrence and appearance (chemical phase) of pos-sible toxic/harmful elements in recycling products.
■ Prediction of the limits and possibilities of recycling technology in view of the EU ELV directive.
■ Definition of the best recycling concept for multi-material designs such as the SLC concept (recycling plant/flowsheet configu-ration) for optimal recycling results and/or minimal material losses.
These tools can play a significant role in benchmarking recycling efficiency through quantifying process performance with state-of-the-art environmental-impact software. HSC Sim and GaBi show this connection, a
basis for creating benchmark BAT LCI data, complementing the present more averaged data from the industry. It is now even possi-ble to perform exergy analyses of metallurgi-cal and recycling plants directly with simula-tors such as HSC Sim (Outotec). These exergy data in addition to LCA data provide a basis for running an LCA analysis, using for exam-ple GaBi that maps the detailed simulation model in HSC Sim. Hence, all metallurgical-process designs of whichever complexity, on numerous levels, and all based on thermo-dynamic and reactor technology principles, can be benchmarked. In addition, as all com-pounds of each stream are known, toxicologi-cal detail can be investigated to a detail not possible within a LCA tool.
Figure 114_d:
0 10 20 30 40 50 60
Zinc
Steel
Rubber
Others
PVC
Plastics
Organic non-plastics
Magnesium
Glass
Copper
Aluminium wrought
Aluminium cast
Contaminants in [0 – 1] of recyclate stream
Min
Max
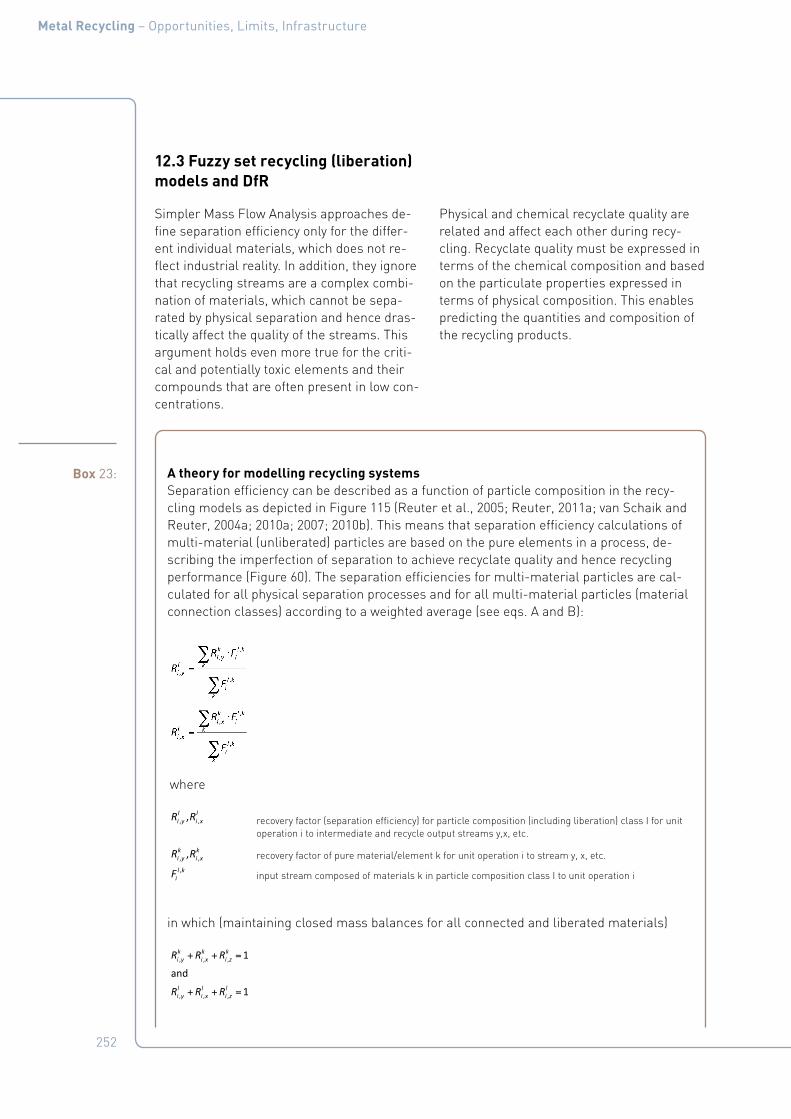
252
Metal Recycling – Opportunities, Limits, Infrastructure
12.3 Fuzzy set recycling (liberation) models and DfR
Simpler Mass Flow Analysis approaches de-fine separation efficiency only for the differ-ent individual materials, which does not re-flect industrial reality. In addition, they ignore that recycling streams are a complex combi-nation of materials, which cannot be sepa-rated by physical separation and hence dras-tically affect the quality of the streams. This argument holds even more true for the criti-cal and potentially toxic elements and their compounds that are often present in low con-centrations.
Physical and chemical recyclate quality are related and affect each other during recy-cling. Recyclate quality must be expressed in terms of the chemical composition and based on the particulate properties expressed in terms of physical composition. This enables predicting the quantities and composition of the recycling products.
Box 23: A theory for modelling recycling systemsSeparation efficiency can be described as a function of particle composition in the recy-cling models as depicted in Figure 115 (Reuter et al., 2005; Reuter, 2011a; van Schaik and Reuter, 2004a; 2010a; 2007; 2010b). This means that separation efficiency calculations of multi-material (unliberated) particles are based on the pure elements in a process, de-scribing the imperfection of separation to achieve recyclate quality and hence recycling performance (Figure 60). The separation efficiencies for multi-material particles are cal-culated for all physical separation processes and for all multi-material particles (material connection classes) according to a weighted average (see eqs. A and B):
in which (maintaining closed mass balances for all connected and liberated materials)
⋅=
⋅=
∑
∑
∑
∑
,,
,,
,,
,,
, ,, recovery factor(separationefficiency)for particle composition(includingliberation)classl
forunitoperation i tointermediateandrecyclateo
k l ki y i
l ki y
l ki
k
k l ki x i
l ki x
l ki
k
l li y i x
R FR
F
R FR
F
where
R R
, ,
,
utputstreamsy, x, etc.
, recovery factor of purematerial/element k for unit operation i to stream y, x, etc.
input stream composed of materials k in particle composition class l to unit op
k ki y i x
l ki
R R
F eration i
+ + =
+ + =
, , ,
, , ,
1
and
1
k k ki y i x i z
l l li y i x i z
R R R
R R R
where
recovery factor (separation efficiency) for particle composition (including liberation) class I for unit operation i to intermediate and recycle output streams y,x, etc.
recovery factor of pure material/element k for unit operation i to stream y, x, etc.
input stream composed of materials k in particle composition class I to unit operation i
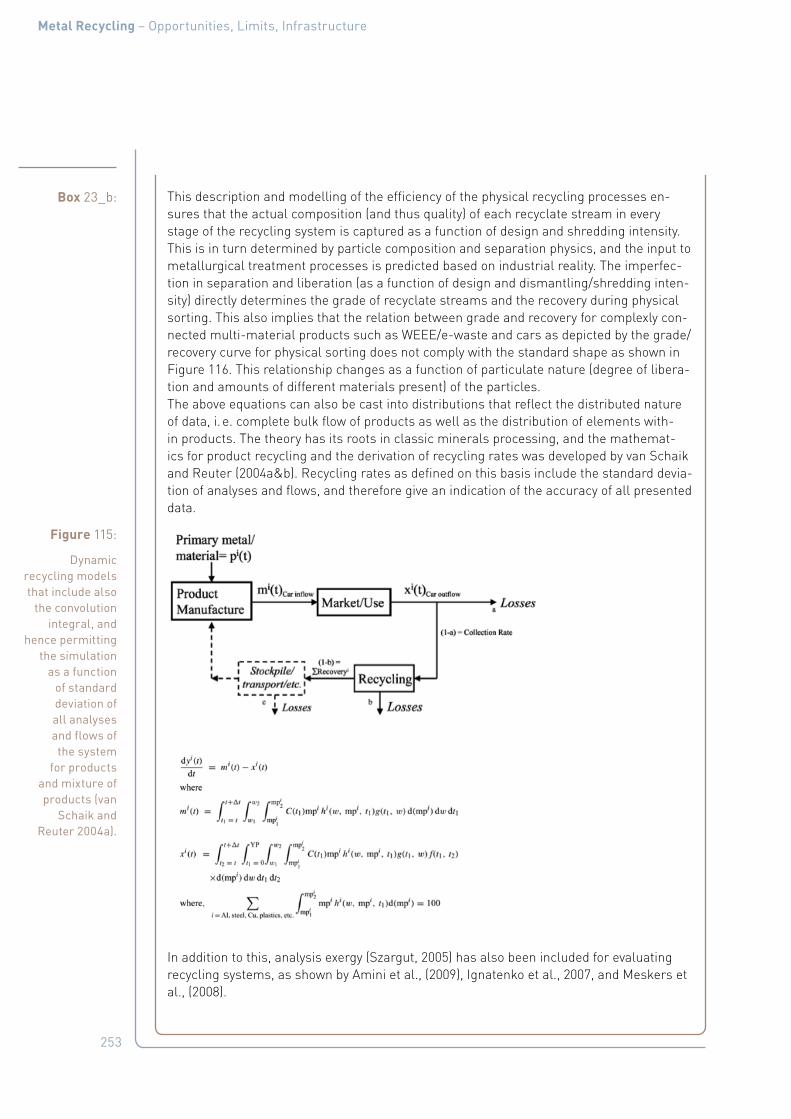
253
Metal Recycling – Opportunities, Limits, Infrastructure
Box 23_b: This description and modelling of the efficiency of the physical recycling processes en-sures that the actual composition (and thus quality) of each recyclate stream in every stage of the recycling system is captured as a function of design and shredding intensity. This is in turn determined by particle composition and separation physics, and the input to metallurgical treatment processes is predicted based on industrial reality. The imperfec-tion in separation and liberation (as a function of design and dismantling/shredding inten-sity) directly determines the grade of recyclate streams and the recovery during physical sorting. This also implies that the relation between grade and recovery for complexly con-nected multi-material products such as WEEE/e-waste and cars as depicted by the grade/recovery curve for physical sorting does not comply with the standard shape as shown in Figure 116. This relationship changes as a function of particulate nature (degree of libera-tion and amounts of different materials present) of the particles.The above equations can also be cast into distributions that reflect the distributed nature of data, i. e. complete bulk flow of products as well as the distribution of elements with-in products. The theory has its roots in classic minerals processing, and the mathemat-ics for product recycling and the derivation of recycling rates was developed by van Schaik and Reuter (2004a&b). Recycling rates as defined on this basis include the standard devia-tion of analyses and flows, and therefore give an indication of the accuracy of all presented data.
In addition to this, analysis exergy (Szargut, 2005) has also been included for evaluating recycling systems, as shown by Amini et al., (2009), Ignatenko et al., 2007, and Meskers et al., (2008).
Figure 115:
Dynamic recycling models that include also
the convolution integral, and
hence permitting the simulation
as a function of standard deviation of all analyses and flows of the system
for products and mixture of products (van
Schaik and Reuter 2004a).
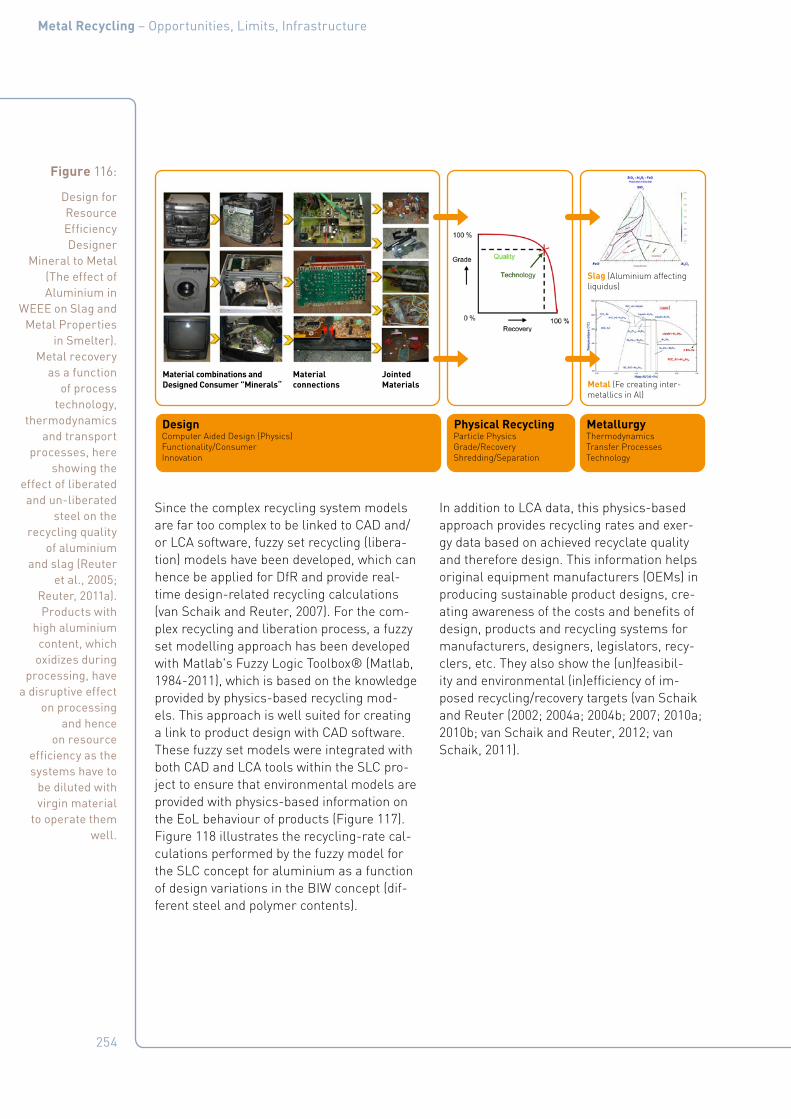
254
Metal Recycling – Opportunities, Limits, Infrastructure
Since the complex recycling system models are far too complex to be linked to CAD and/or LCA software, fuzzy set recycling (libera-tion) models have been developed, which can hence be applied for DfR and provide real-time design-related recycling calculations (van Schaik and Reuter, 2007). For the com-plex recycling and liberation process, a fuzzy set modelling approach has been developed with Matlab's Fuzzy Logic Toolbox® (Matlab, 1984-2011), which is based on the knowledge provided by physics-based recycling mod-els. This approach is well suited for creating a link to product design with CAD software. These fuzzy set models were integrated with both CAD and LCA tools within the SLC pro-ject to ensure that environmental models are provided with physics-based information on the EoL behaviour of products (Figure 117). Figure 118 illustrates the recycling-rate cal-culations performed by the fuzzy model for the SLC concept for aluminium as a function of design variations in the BIW concept (dif-ferent steel and polymer contents).
In addition to LCA data, this physics-based approach provides recycling rates and exer-gy data based on achieved recyclate quality and therefore design. This information helps original equipment manufacturers (OEMs) in producing sustainable product designs, cre-ating awareness of the costs and benefits of design, products and recycling systems for manufacturers, designers, legislators, recy-clers, etc. They also show the (un)feasibil-ity and environmental (in)efficiency of im-posed recycling/recovery targets (van Schaik and Reuter (2002; 2004a; 2004b; 2007; 2010a; 2010b; van Schaik and Reuter, 2012; van Schaik, 2011).
Figure 116:
Design for Resource Efficiency Designer
Mineral to Metal (The effect of Aluminium in
WEEE on Slag and Metal Properties
in Smelter). Metal recovery
as a function of process
technology, thermodynamics
and transport processes, here
showing the effect of liberated and un-liberated
steel on the recycling quality
of aluminium and slag (Reuter
et al., 2005; Reuter, 2011a). Products with
high aluminium content, which
oxidizes during processing, have
a disruptive effect on processing
and hence on resource
efficiency as the systems have to
be diluted with virgin material
to operate them well.
DesignComputer Aided Design (Physics)Functionality/ConsumerInnovation
Physical RecyclingParticle PhysicsGrade/RecoveryShredding/Separation
MetallurgyThermodynamicsTransfer ProcessesTechnology
Slag (Aluminium affecting liquidus)
Metal (Fe creating inter-metallics in Al)
Material combinations and Designed Consumer ”Minerals“
Material connections
JointedMaterials
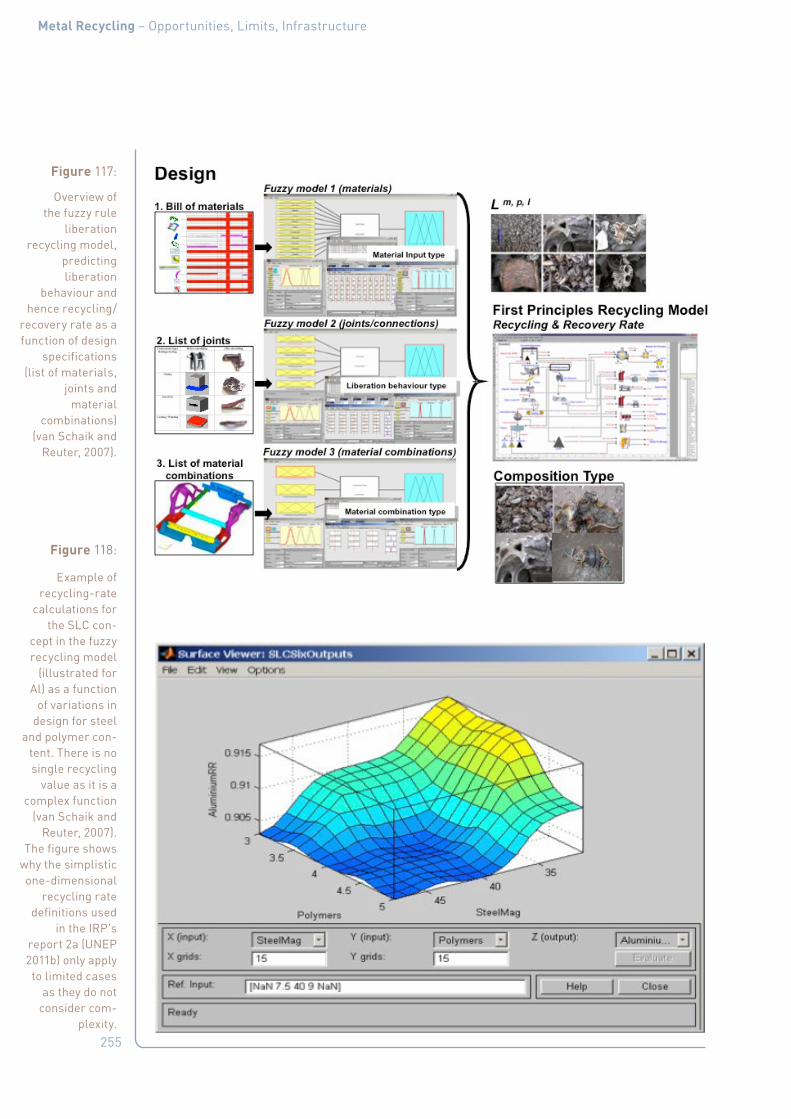
255
Metal Recycling – Opportunities, Limits, Infrastructure
Figure 117:
Overview of the fuzzy rule
liberation recycling model,
predicting liberation
behaviour and hence recycling/
recovery rate as a function of design
specifications (list of materials,
joints and material
combinations) (van Schaik and
Reuter, 2007).
Figure 118:
Example of recycling-rate
calculations for the SLC con-
cept in the fuzzy recycling model
(illustrated for Al) as a function
of variations in design for steel
and polymer con-tent. There is no single recycling
value as it is a complex function
(van Schaik and Reuter, 2007).
The figure shows why the simplistic one-dimensional
recycling rate definitions used
in the IRP's report 2a (UNEP 2011b) only apply to limited cases
as they do not consider com-
plexity.
256
Metal Recycling – Opportunities, Limits, Infrastructure
The physical materials in the model are translated not only into its corresponding chemical elements, but also its phases. The physical quality or composition of (interme-diate) recycling streams is directly related to the chemical composition of the metal frac-tion (alloying composition, contamination, oxides, etc.), the inorganic fraction, and the chemical composition and heat content of the organic fractions. This crucial informa-tion highlights the effect that design has on recycling efficiency and environmental per-formance of the system. Figure 117 shows the physics-based link that is created be-tween the physical description (i. e. the ma-terial combinations created by the designer and by physical separation) and the chemical description of post-consumer goods bridging the gap between design, physical separation and chemical metal, and material recycling and energy recovery. The recycling flowsheet and recycling models for ELVs include sever-al final-treatment options, including: (i) Steel converting; (ii) Aluminium recycling; (iii) Mag-nesium recycling; (iv) Metallic zinc recycling; (v) Copper production/recycling; (vi) Thermal processing (e. g. EBARA, Reshment, Ther-moselect, CITRON (Ignatenko et al., 2007)); (vii) Incineration; (viii) Plastics processing; and (ix) Landfill. Since recyclate quality does not always meet the requirements for met-al production, primary-production processes were included in the assessment of ELV re-cycling, to determine the amount of prima-ry metals required for diluting or upgrading the produced metal alloys to sufficient qual-ity/alloy composition. This directly affects re-source depletion and energy consumption, and therefore is an important parameter for determining the environmental impact of the recycling system. Primary-metal producing processes such as (i) Electrolytic copper pro-duction, (ii) Electrolytic zinc production, (iii) Electrolytic magnesium production, (iv) Elec-trolytic aluminium production, (v) Si produc-tion, and (vi) Pig iron production, are consid-ered in the ELV recycling models (see Fig-ure 59).
The separation and recovery in these types of processes into different phases (metal, matte, speiss, slag, flue dust, off gas etc.) are modelled based on process thermodynam-ics and the chemical content and interaction between different elements/phases in the recyclates obtained from dismantling and/or physical separation. The simulation mod-els for ELV recycling are therefore based on physics-based understanding as well as in-dustrial (also tacit) knowledge of thermody-namics and associated process technology in an appropriate economic environment.
12.4 The importance of relevant data on product design and composition
Without a good understanding of the “min-eralogy” of products and the representa-tive data for this, as briefly presented in this section, no physics-based simulation mod-els can be calibrated. Meaningful data must include at least the following for describing and innovating recycling systems on a phys-ics basis:
■ The total metal-flow rates (usually as re-quired by MFAs) including their average and standard deviation.
■ The flow rates of different product types (average and standard deviation).
■ The composition of product types in terms of sub-groups as shown in Figure 119, such as metals, alloys and compounds (av-erage and standard deviation).
■ The definition of connections/joints from which liberation behaviour can be estimat-ed for the various functional groupings of the equipment.
■ The definition of different particle categories.
■ Mapping of different data sets in a com-pound/metal format that is useful for a pyro- or hydro-metallurgical process.

257
Metal Recycling – Opportunities, Limits, Infrastructure
■ The morphology of the recyclate as, for in-stance, aluminium turnings or swarf react differently than an ingot in a furnace when remelting/refining.
Figure 119 (Chancerel et al., 2009; Chancerel and Rotter, 2009a) provides useful data for
recycling from which simulation models can be calibrated and used for predicting system performance. The results reflected by these data could be simulated by van Schaik and Reuter (2010a), showing that they have the data detail required for evaluating systems and system physics.
Figure 119:
The importance of good data (for
a coffee machine) that are aligned
and of value to modelling and
simulation of processes, either
with reconciled mass-balance
data and/or simulation tools
(Chancerel et al., 2009; Chancerel
and Rotter, 2009a).
Maximum
the higherquartile (80 %)
the lowerquartile (20 %)
Medium
Minimum
0
200
400
600
800
1000
1200
1400
1600
1800
absolute weight [g per appliance]
Cable E- motor
Ferrous Metal
Glass/Ceram-ics
Non-Ferrous Metal
Other Plastic Printed circuit board
Total mass
Median [g] 118.0 11.0 73.0 0.0 87.0 0.0 729.0 0.0 1022.0
Arihmetic mean [g]
114.1 10.9 74.2 48.4 100.3 2.3 634.5 3.0 987.7
Standard derivation [g]
46.0 6.1 47.6 125.7 64.0 6.3 427.1 18.2 501.9
Required sample size* n (α=90 %, e=20 %)
12 23 31 510 31 562 34 2731 20
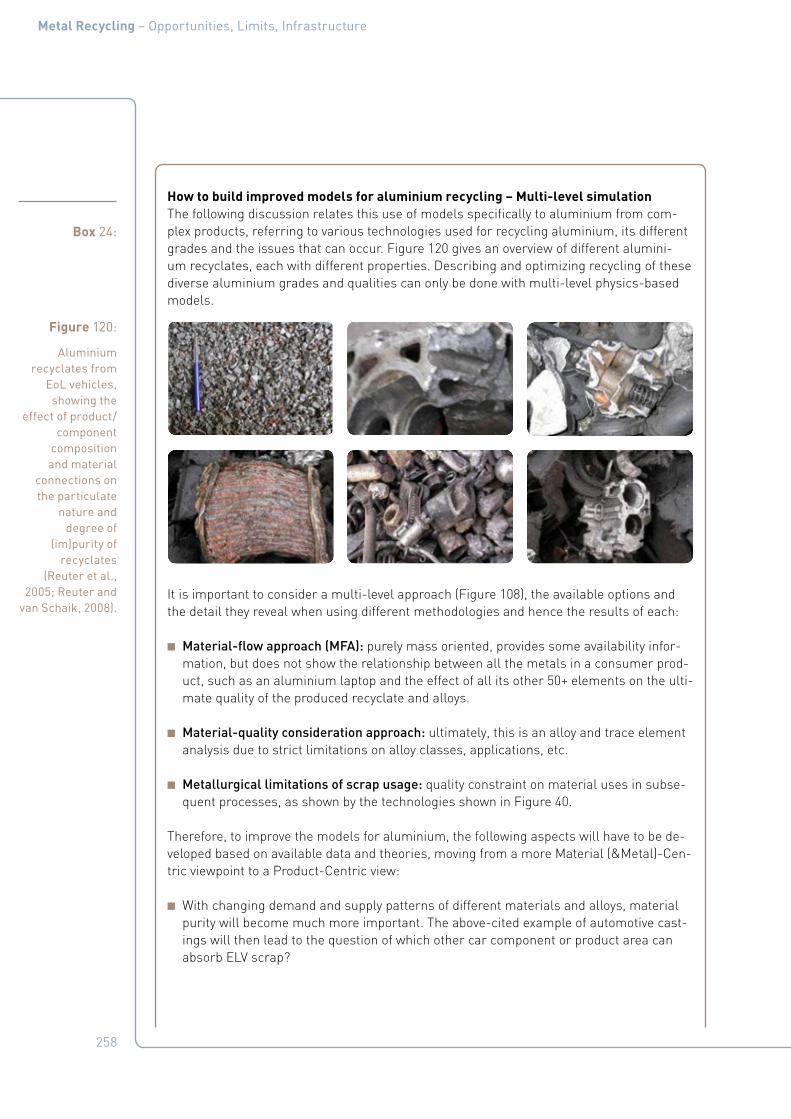
258
Metal Recycling – Opportunities, Limits, Infrastructure
Box 24:
How to build improved models for aluminium recycling – Multi-level simulationThe following discussion relates this use of models specifically to aluminium from com-plex products, referring to various technologies used for recycling aluminium, its different grades and the issues that can occur. Figure 120 gives an overview of different alumini-um recyclates, each with different properties. Describing and optimizing recycling of these diverse aluminium grades and qualities can only be done with multi-level physics-based models.
It is important to consider a multi-level approach (Figure 108), the available options and the detail they reveal when using different methodologies and hence the results of each:
■ Material-flow approach (MFA): purely mass oriented, provides some availability infor-mation, but does not show the relationship between all the metals in a consumer prod-uct, such as an aluminium laptop and the effect of all its other 50+ elements on the ulti-mate quality of the produced recyclate and alloys.
■ Material-quality consideration approach: ultimately, this is an alloy and trace element analysis due to strict limitations on alloy classes, applications, etc.
■ Metallurgical limitations of scrap usage: quality constraint on material uses in subse-quent processes, as shown by the technologies shown in Figure 40.
Therefore, to improve the models for aluminium, the following aspects will have to be de-veloped based on available data and theories, moving from a more Material (&Metal)-Cen-tric viewpoint to a Product-Centric view:
■ With changing demand and supply patterns of different materials and alloys, material purity will become much more important. The above-cited example of automotive cast-ings will then lead to the question of which other car component or product area can absorb ELV scrap?
Figure 120:
Aluminium recyclates from
EoL vehicles, showing the
effect of product/component
composition and material
connections on the particulate
nature and degree of
(im)purity of recyclates
(Reuter et al., 2005; Reuter and
van Schaik, 2008).

259
Metal Recycling – Opportunities, Limits, Infrastructure
Box 24_b: ■ Already today, customers require a high recycled content and it could well be that EU legislation will favour the recycled content for green labelling.
■ Consequently, we must know how much scrap can be used in closed or open loop sys-tems before the metallurgical limits are reached in terms of castability/formability/physical properties/surface appearance, as well as losses, residues created, etc.
■ Dynamic models are required, due to the changing chemical composition of today’s scrap and the ongoing development of material specifications (and properties) (Fig-ure 28, Figure 29 and Figure 30).
To move from static MFA models to dynamic models the following limitations and chal-lenges must be considered.
Material flow approach: The present situation is:
■ At European level, different recycling efficiency indicators exist for product and material considerations (recycled content vs. end-of-life recycling).
■ Metals must overcome the disadvantages of long-life products in MFA calculations caused by the material gap in growing markets.
■ Presently, MFA considers material flow as mass flow only and not in a dynamic manner as shown by Figure 60 (van Schaik and Reuter, 2004a).
■ The forecast of scrap availability is production oriented and growth determined.
■ For recycling quotas and recycled content calculations, only theoretical scrap amounts are used, based on product shipments and static lifetimes.
The issues at present are:
■ In MFA models, the “accessibility” of recycled EoL raw materials in terms of collection probability is still missing.
■ MFA models already give a good description of the order of magnitude of recycling raw material for stakeholders, but now must aim at the understanding of stocks as dynamic consumer- and application-determined systems.
■ Regional and temporal data (lifetime distribution, trade and per capita “consumption” of materials) are needed.
■ With such a demand and supply model in place, an extension including CO2 emissions is possible. Furthermore, scenarios for different targets and the contribution of recy-cling can be calculated (e. g. long-term scenarios evaluating the contribution of recy-cling in IEA 2050 targets).
260
Metal Recycling – Opportunities, Limits, Infrastructure
Box 24_c: Because aluminium applications are relatively simple, the MFA approach works. However, considering a complex tablet type application packaged in aluminium and containing 50+ elements, some of the above statements could be problematic as these elements, plas-tics, etc. may affect produced alloys and losses as shown in section 3.4.1.3.
Material quality consideration: The detailed recycling models discussed in this document, describing scrap and particle types, liberated or not and connected to various metals, brings us to quality, the key point that recycling models (van Schaik and Reuter, 2004a; 2004b; 2007; 2010a; 2010b; van Schaik and Reuter, 2012; van Schaik, 2011) must describe. If scrap flows are known in terms of collection, defined recycling loops and their amount, the next criterion is material quality. Consider:
■ First an evaluation is needed of the condition in which the individual part/material/alloy/element is present (e. g. gallium in PV cells or 6063 aluminium profiles in ELV shredder fractions; see section 3.4.2).
■ Secondly, the “metallurgical accessibility” at element or alloy level must define the need for thermal or mechanical upgrading or sorting processes and, if possible, for metal re-fining (see section 3.4.2).
■ The achievable purity before the melting step determines the recyclability or scrap val-ue for the target application, if no later refining is possible (see section 3.4.1.3).
■ A long-term goal is to develop a “quality constraint material availability model”, based on dynamic stock modelling with the understanding of alloy qualities and limited refin-ing possibilities (see Figure 59 and Figure 60).
■ The aim is to discover element accumulation trends in life cycles (alloying and trace el-ements; see section 5.4.5).
■ With the quality extension of the pure demand and supply model application, specific scenarios can be calculated: e. g. will casting alloys in car applications remain available as a sink for high alloyed scrap if alternative drive concepts require fewer and smaller engines?

261
Metal Recycling – Opportunities, Limits, Infrastructure
12.5 Details of life-cycle assessment
12.5.1 General aspects (UNEP, 2011c)According to standards 14040 and 14044 of the International Organization for Standardi-zation (ISO, 2006a, 2006b), four phases are distinguished within an LCA study (see Fig-ure 121):
■ Goal and scope definition: The scope, in-cluding system boundaries and level of de-tail, of an LCA depends on the subject and the intended use of the study. The depth and breadth of LCA can differ considerably, depending upon the goal of a particular LCA (ISO 2006b).
■ Life-cycle inventory analysis (LCI) is the second phase of LCA. It is an inventory of input/output data with regard to the sys-tem being studied. It involves the collection of data necessary to meet the goals of the defined study (ISO 2006b).
■ Life-cycle impact assessment (LCIA) is the third phase of the LCA. Its purpose is to provide additional data for assessing a system’s inventory results, to better un-derstand and evaluate the magnitude and significance of potential environmental impact related to the LCI data (ISO 2006a, 2006b).
■ Interpretation is the final phase of the LCA. Here, the findings of either the invento-ry analysis or the impact assessment, or both, are evaluated in terms of the defined goal and scope, in order to reach conclu-sions and recommendations (ISO 2006b).
LCA is a relative and iterative approach, based on transparency and comprehensive-ness. Relative, as an LCA is always structured around a functional unit that defines what is examined, all further activities then tak-ing place are relative to this functional unit. Iterative, because, as shown in Figure 121, each step uses the results of the other steps. Which, by passing several times across the various steps, results in comprehensiveness. As almost all product life cycles include pro-cesses that occur worldwide, a high-quality global environmental inventory database is mandatory to ensure sound and credible re-sults of LCA studies.
In relation to the topic of this report, i. e. the recycling of various metals, the goal and scope of the respective LCA studies is either the examination of the impact of producing a specific amount (e. g. 1 kg) of (recycled) met-als, or the total impact of the various treat-ment options for a specific amount of waste input. When not only the production, but also a complete life cycle of a metal for a specific use context is considered, the goal and scope step ensures that all functionalities of the metal for this context are taken into account and adequately covered, by choosing a suit-able functional unit and the system bounda-ries.
Figure 121:
The LCA framework
according to the ISO 14040/14044
series (ISO, 2006a).
Goal and Scope Definition
Inventory Analysis Interpretation
Impact Assessment

262
Metal Recycling – Opportunities, Limits, Infrastructure
12.5.2 Life-cycle inventory (LCI)As mentioned above, this is the second phase of LCA, resulting in an inventory of input/output data with regard to the system be-ing studied. Input data are energy and mate-rial amounts consumed in the various pro-cess steps, from extraction of the metal-con-taining ore, through the various beneficiation and concentration steps, up to the final sup-ply of one unit (e. g. one kg) of a metal to the global metal market. On the output side, the amount of emissions to air, water and soil, the amount of waste water and waste, is re-corded as detailed as possible for the same process steps as the above mentioned input data.
In analogy to primary production, recycling production of metals from scrap (often a complex mixture of metallic compounds, such as e-waste), leads to the joint produc-tion of different metals. Hence, allocation is-sues play an important role (Stamp et al., 2011). Dubreuil et al. (2010) reported that representatives from ferrous and non-ferrous metal groups agreed on a “consensus-map-ping presentation of a general allocation ap-proach and the identification of harmonized metrics”. The developed approach distin-guishes between four different cases called “recycling map models”, each of them repre-senting a typical life cycle of a metal. A table in Dubreuil et al. (2010) gives some examples for each of the four types (see Table 46).

263
Metal Recycling – Opportunities, Limits, Infrastructure
So far, however, there are no generally ac-cepted, accurate allocation factors available for an application of these four above de-scribed types and, as mentioned in Dubreuil et al. (2010), “important work needs to be done” to achieve this. Despite this shortcom-ing, several LCA and/or LCI studies on metals exist and are published, using their own, spe-cific allocation factors.
Table 46:
Table with metal-recycling-
loop examples (Dubreuil et
al.,2010).
Type 1 Closed metal loop
Type 2 Alloy loop
Type 3 Transfer to another metal pool
Type 4 Metallurgical re-separation
Steel scrap is recy-cled by a minimill where it is remelt-ed and formed into semi-products.
Stainless steel al-loys are retained in a distinct metal pool. Constituents include iron, chro-mium, nickel and other elements.
Nickel in low-al-loy steel is recycled into the steel loop, where it is retained in dilute fractions in the steel pool.
Gold and plati-num group met-als are retained in copper-rich metal-lic fractions during electronic equip-ment recycling. At the copper smelter, these other metals are separated and refined.
Steel scrap is re-cycled by an inte-grated mill where the recycled metal is blended with pri-mary metal coming from the blast fur-nace into the basic oxygen furnace.
Aluminum-magne-sium alloy used for beverage cans is re-cycled as a distinct pool. The purity and properties of the al-loy are managed and preserved.
Chromium coating on steel is recycled into the steel loop, where it is retained in dilute fractions in the steel pool.
Zinc used for gal-vanizing follows the steel onto which it is coated. Dur-ing steel recycling, zinc is separated to Electric Arc Fur-nace dust, which is treated to remove cadmium. Zinc is then recovered in an Imperial Smelting Furnace.
Copper in appli-cations where it is nearly pure is recy-cled back to semi-fabricators, where it is remelted and reformed into semi-products.
Brass is a copper-zinc alloy that is collected and recy-cled to retain alloy properties.
Due to inefficiencies in physical separa-tion, copper parti-cles are entrained with the steel re-cycling flow. Once melted, copper can-not be removed economically from the steel.
264
Metal Recycling – Opportunities, Limits, Infrastructure
12.5.3 Life-cycle impact assessment (LCIA)In the Life Cycle Impact Assessment (LCIA) phase, the third step of the ISO framework, the emissions and resource data collected in the preceding LCI step are translated into indicators that represent environmental and health impacts as well as resource scarcity. This is based on factors that represent the impact per unit emission or resource con-sumption. These factors are generally cal-culated with models (EU, 2010), but over the past two to three decades a broad variety of such LCIA factors has been developed and published. An overview of this can be found e. g. in the 'Ecoinvent' database, which is not yet complete, as its developers want to pub-lish a clear guidance on the use of LCIA fac-tors and methods in combination with data from their database, but without actively de-veloping LCIA methods (Hischier et al., 2010).
As part of the International Reference Life-Cycle Data System (ILCD) handbook – a series of technical documents providing detailed guidance on all steps required for a Life-Cy-cle Assessment (LCA) – the European Com-mission’s Joint Research Centre (EC-JRC) started a public consultation on recommend-ed methods for Life-Cycle Impact Assess-ment after a thorough analysis of the existing approaches in 2010 (European Commission, 2010a; 2010b; 2010c). The report with recom-mended LCIA factors was distributed in the LCA community and a workshop was held in Brussels in October 2010; a draft of this re-port is available on the Internet, but may not be cited.
In relation to the recycling of metals, impor-tant indicators are available among the huge amount of LCIA indicators in a variety of LCIA methods (for a recent overview see e. g. Eu-ropean Commission, 2010a) According to the above-mentioned draft report on recom-mended LCIA factors, the following model-ling approaches are recommended for such single-impact assessment factors:
■ Resource Depletion: For this topic, the draft report recommends using the 2004 update of the factors for the depletion of abiotic resources reported in the EDIP 97 LCIA method (Hauschild and Wenzel, 1998; Hauschild and Potting, 2005). This model considers fossil fuels and minerals, and introduces the "person-reserve", meaning the quantity of resource available to an av-erage world citizen. For calculation of the characterization factors, the amount ex-tracted is divided by the global production of the reference year (2004) and weighted according to the economically viable re-serves of this material.
■ Global Warming Potential (GWP): For this, it is recommended to use the “default” 100-year baseline model for greenhouse gases according to the IPCC report (IPCC, 2007). The IPCC factor is used in all LCIA methods that consider GWP, though not all methods use the latest version of the IPCC report. Among the three perspectives (20, 100 and 500 years), the 100-year baseline is commonly used; this is also the time ho-rizon used for the Kyoto protocol or further policy work in the area of climate change.
■ Acidification Potential (AP): For this, the EC draft report recommends the so-called “Accumulated Exceedance” by Seppälä and co-workers. This method not only consid-ers the dispersion of an emission in the atmosphere, but also the sensitivity of the ecosystem receiving the (additional) dep-osition due to this emission (Seppälä et al., 2006), and calculates European coun-try-dependent characterization factors. The atmospheric transport and deposition model to land areas and major lakes/riv-ers is determined with the EMEP model, a detailed model for long-range transport of air pollutants in Europe, combined with a European critical-load database for sul-phur and nitrogen deposition in Europe. However, few LCA software tools have as yet integrated this approach for practical application.

265
Metal Recycling – Opportunities, Limits, Infrastructure
■ Ecotoxicity Potential (ETP): For ETP, the recent common international framework for toxicity categories (Rosenbaum et al., 2008) was used. This approach results from a consensus-building effort among related modellers and the underlying prin-ciples reflect the agreed recommendations from these experts. The model accounts for all-important parameters in the impact pathway as identified by a systematic mod-el comparison within the consensus pro-cess. It addresses the freshwater part of the environment problem and includes the vital model elements in a scientifically up-to-date way. USEtox has also been set up to model a global default continent. USE-tox distinguishes between interim and rec-ommended characterization factors, quali-tatively reflecting the level of expected reli-ability of the calculations. Ecotoxicological characterization factors for ‘metals’, ‘dis-sociating substances’ and ‘amphiphilics’ (detergents) are all classified as interim in USEtox (Rosenbaum et al. 2008).
In case of Cumulative Energy Demand (CER), the European Commission does not recom-mend any factor, but indirectly recommends dealing with these resources as with mineral/metal resources. In any case, the consump-tion of fossil fuels is also part of the above-described ARD factor for resource deple-tion. However, CER analysis has a rather long tradition; and the indicator was created, as reported e. g. in Hischier et al. (2010), in the early 1970s after the first oil-price crisis (Pi-mentel, 1973; Boustead and Hancock, 1979). At the same time, CED is widely used as a screening indicator for environmental impact (Hischier et al., 2010). Here, we use the defi-nition of CED from the Ecoinvent database, based on the respective document from the German Industry Association (VDI). Howev-er, in contrast to the Ecoinvent database that shows the various factors of CED in a non-aggregated form; we have aggregated all these values into a single number, the “Total Cumulative Energy Demand”. More details about this issue can be found in Hischier et al. (2010).
12.5.4 Life-cycle impact assessment of larger or complete systemsTrue resource efficiency can only be achieved if all the complex non-linear interactions are considered and optimized simultaneously. Of great importance is the linking of metals, materials, water and energy in such assess-ment, to truly improve society’s resource ef-ficiency. By linking all aspects into a bigger flowsheet and using BAT to create the base-line (Figure 6 – left) and then link it to an environmental assessment tool (Figure 6 – right) can help much in determining the true limits of resource efficiency.
266
Metal Recycling – Opportunities, Limits, Infrastructure

267
Metal Recycling – Opportunities, Limits, Infrastructure
13. Appendix F: Physics of Extractive Metallurgy
We briefly discuss some theoretical aspects of extractive metallurgy in this section, as this knowledge is required for defining legis-lation and maximizing resource efficiency on a physics basis. The Metal Wheel (Figure 15) succinctly captures the many steps of metal-lurgy that are defined by the thermodynamics briefly discussed hereafter.
13.1 Energy balance of recycling – Possible energy reductions
The remelting of pure scrap, e. g. copper coils, is only possible if it has been very well sorted. For this case, the theoretical amount of energy required to remelt pure (100 % Cu) coils into copper would be 756.9 MJ/t Cu at a remelting temperature of 1250 °C (Fig-ure 122), a necessary processing step to ren-der it suitable for further processing into high-grade products. However, if impuri-ties enter with the scrap, such as shown on the bottom part of Figure 122, this min-imum remelting energy rapidly increas-es. The maximum improvement that can be achieved by design, which has a direct im-pact on the achievable scrap quality, sepa-ration technology and metallurgy, would be (1493.8 – 756.9) MJ/t. In general, the closer the energy required for remelting any scrap is to the theoretical baseline, the better.
It is clear from Figure 122 that, generally, the baseline will be the energy required for smelting a defined material, and that impuri-ties will increase the energy required. How-ever, exothermic reactions of the contained materials will offset this problem, lowering the carbon footprint of the system and im-proving efficiency, a major focus of “sustain-ability” though engineers call this just "better efficiency". What really improves the system is to minimize impurities in the feed, which is what a good system model must be able to predict as well as suggesting improvements. Optimizing the system is thus more equated to “sustainability”. Also clear from this exam-ple is the CO2 fraction used for remelting is only a small fraction of the value summarized in Figure 24.
Figure 122:
A comparison of pure copper scrap melting 756.9 MJ/t Cu
(top) and impure copper recyclate
smelting 1493.8 MJ/t Cu,
showing the effect of
impurities in scrap feed (down)
at 1250 °C as calculated by
HSC for adiabatic conditions with
methane as fuel (HSC Chemistry 7,
1974 – 2013).

268
Metal Recycling – Opportunities, Limits, Infrastructure
13.2 The stability of oxides and other metal-containing minerals
Concerning the primary production of metals and their recovery from end-of-life applica-tions, some principles of chemical thermo-dynamics must be understood. Figure 123 shows the abundance of chemical elements in earth’s upper continental crust. Metals seldom occur in their native state in nature, though some precious metals, such as Au, Ag and Pt do, but only in limited amounts. Most common metals are found in a wide variety of stable minerals, including oxides, sulphides, fluorides and halides. Parts of these occur as ores, containing mineral concentrations near the surface of the earth that can be mined economically. The relative abundance of met-als in the earth’s crust ranges from very low (e. g. 0.001 – 0.01 ppm for Au, Os, Pt) to very high (Si 27.7 % by weight, Al 8.1 % by weight, Fe 5.0 % by weight).
Metal ores include mainly oxides, sulphides, carbonates and halides. As sulphides and carbonates are easily converted into oxides by roasting or calcination, metal extraction is mainly from oxides by chemical or electrolytic reduction.
Figure 123:
The abundance (atom fraction) of the chemical
elements in the earth's
upper crust as a function of their atomic number.
The rarest elements (yellow)
are the densest. Major industrial
metals are shown in red (USGS).

269
Metal Recycling – Opportunities, Limits, Infrastructure
According to the principles of equilibrium thermodynamics, every material system tries to minimize its Gibbs free energy, G, on the way to its equilibrium state. The simple fact that most metals in nature are not pure, but are bound to oxygen, sulphur, chlorine, etc., reflects that their Gibbs free energy is lower than the corresponding Gibbs free energies of the unreacted elements. Consider for ex-ample the reaction:
22 SiOOSi =+
The standard free energy of formation of SiO2, ∆G0SiO2, is the difference between the stand-ard Gibbs free energy of the reaction product (1 mole of pure SiO2) and the standard Gibbs free energy of the reactants (1 mole of pure Si and 1 mole of pure O2 at a pressure of 1 atm, Figure 124).
The Gibbs energy of an element or compound is expressed with respect to a standard state, often that of the pure element in its stable crystal structure at a given temperature (liq-uids and solids) and for gases the perfect gas at a given temperature. For any chemical re-action, hence also for the formation of oxides, sulphides, etc., the actual reaction free en-ergy can be expressed, referring to the stand-ard states, as:
QRTGG ln0 +Δ=Δ
where the reaction quotient Q (e. g. SiO2 for-mation) refers to the actual activities of reac-tants and products:
2
2
. OSi
SiO
aaa
Q =
Figure 124:
Various thermochemical
data for the given reaction (HSC
Chemistry 7, 1974 – 2013).

270
Metal Recycling – Opportunities, Limits, Infrastructure
The activities of pure solids and liquids are the activities in the corresponding standard states and are equal to 1. The activity of gas at moderate pressures is equal to the actual pressure of the gas, therefore:
A reacting system comes to equilibrium when its Gibbs free energy reaches its minimal value, when the driving force for the reaction is:
where λ is the so-called progress variable. From the above equation we conclude that at equi-librium:
and hence:
In the case of SiO2 formation, the standard reaction free energy predicts what will be the equi-librium pressure of oxygen as a function of temperature (which is log(pO2) = -11.453 at 2000 °C as can be seen from Figure 124). The more negative ∆G 0T becomes, or the more stable the oxide, the lower will be this equilibrium pressure of oxygen: the oxide hardly decomposes. A negative ∆G 0T for the formation of a compound indicates directly how much energy is at least required for decomposing the compound into its elements, hence to produce pure metal out of its mineral. The Gibbs free energy is composed of two contributions: enthalpy (H) and entropy (S):
thus, for the formation of the above-mentioned compounds (see Figure 124),
2
1Op
Q =
0=Δ=⎟⎠
⎞⎜⎝
⎛λ∂∂ GG
0ln0 =+Δ=Δ eqQRTGG
eqO
eqOeq pRT
pRTQRTG
,2
2
ln1lnln0 =⎟⎟⎠
⎞⎜⎜⎝
⎛−=−=Δ
TSHG −=
000TTT STHG Δ−Δ=Δ

271
Metal Recycling – Opportunities, Limits, Infrastructure
Ellingham was the first to plot ∆G 0T as a func-tion of temperature for oxidation and sulphi-dation reactions for a series of metals, rel-evant to the extraction of metals from their ores. Figure 125 shows an Ellingham dia-gram for oxides. In between temperatures at which phase transitions of reactants or prod-ucts occur, the relation between ∆G 0T and T is approximately linear, the slope being equal to the average value of -∆S 0T . From Figure 125 it is clear that the slopes are almost the same for all oxides. This is because the entropy changes in all these cases are similar, be-ing almost entirely due to the condensation of 1 mole of oxygen:
Such a diagram shows the relative stability of the different oxides and the minimal amount of energy required to produce the metal. The more negative the ∆G 0T at a given temper-ature, the more stable is the correspond-ing oxide, and hence the more energy will be required for extracting the metal from it. A metal oxide can be reduced by any metal or element that itself forms a more stable oxide.
Figure 125:
Various ΔG (Ellingham) functions of
temperature for given oxides,
showing that the REO La2O3 is
most stable and CuO the least. Therefore it is
easiest to create metal from CuO
and most difficult from La2O3 (HSC
Chemistry 7, 1974 – 2013).
[ ] ( ) [ ]yxOMSy
OSMSyxS 0
29820298
0298
0298
22⎟⎟⎠
⎞⎜⎜⎝
⎛−+⎟⎟
⎠
⎞⎜⎜⎝
⎛=Δ−
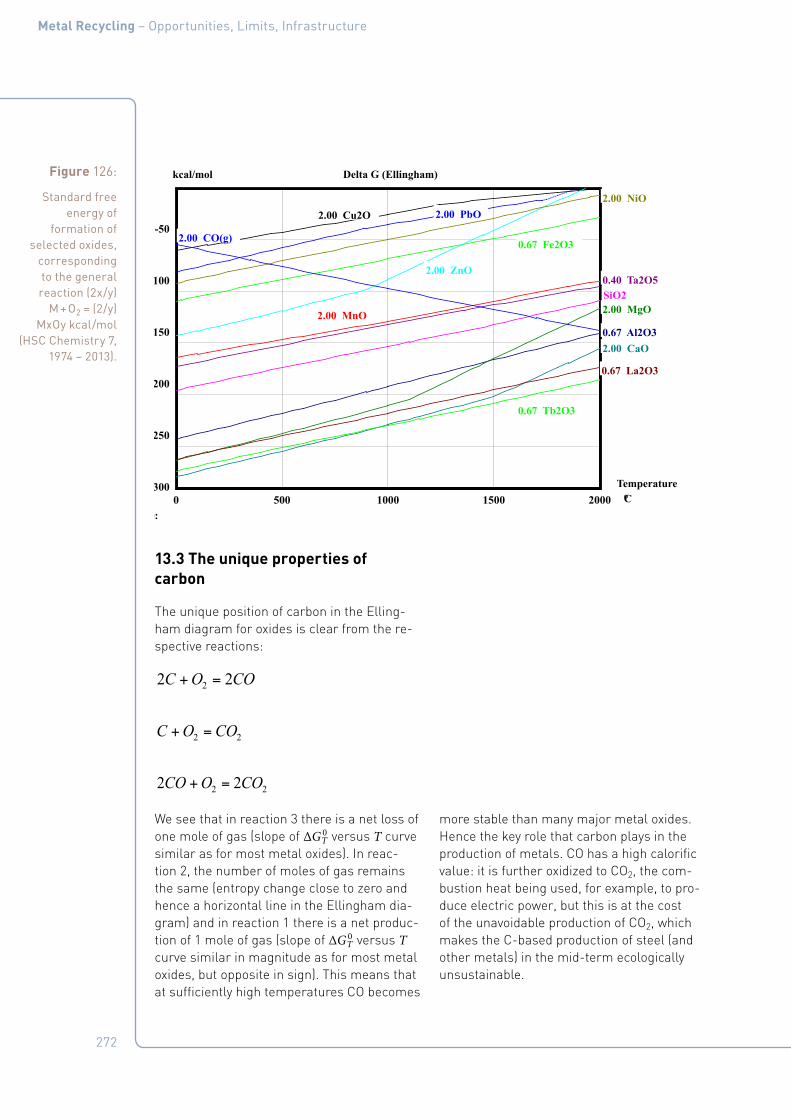
272
Metal Recycling – Opportunities, Limits, Infrastructure
13.3 The unique properties of carbon
The unique position of carbon in the Elling-ham diagram for oxides is clear from the re-spective reactions:
We see that in reaction 3 there is a net loss of one mole of gas (slope of ∆G 0T versus T curve similar as for most metal oxides). In reac-tion 2, the number of moles of gas remains the same (entropy change close to zero and hence a horizontal line in the Ellingham dia-gram) and in reaction 1 there is a net produc-tion of 1 mole of gas (slope of ∆G 0T versus T curve similar in magnitude as for most metal oxides, but opposite in sign). This means that at sufficiently high temperatures CO becomes
more stable than many major metal oxides. Hence the key role that carbon plays in the production of metals. CO has a high calorific value: it is further oxidized to CO2, the com-bustion heat being used, for example, to pro-duce electric power, but this is at the cost of the unavoidable production of CO2, which makes the C-based production of steel (and other metals) in the mid-term ecologically unsustainable.
Figure 126:
Standard free energy of
formation of selected oxides,
corresponding to the general reaction (2x/y)
M + O2 = (2/y)MxOy kcal/mol
(HSC Chemistry 7, 1974 – 2013).
0 500 1000 1500 2000-300
-250
-200
-150
-100
-50
Delta G (Ellingham)
File: °C
kcal/mol
Temperature
2.00 Cu2O 2.00 PbO
0.67 Fe2O3
2.00 ZnO
2.00 MnO
SiO2
0.67 Al2O3
2.00 MgO
2.00 CaO
0.67 La2O3
0.40 Ta2O5
2.00 NiO
2.00 CO(g)
0.67 Tb2O3
COOC 22 2 =+
22 COOC =+
22 22 COOCO =+
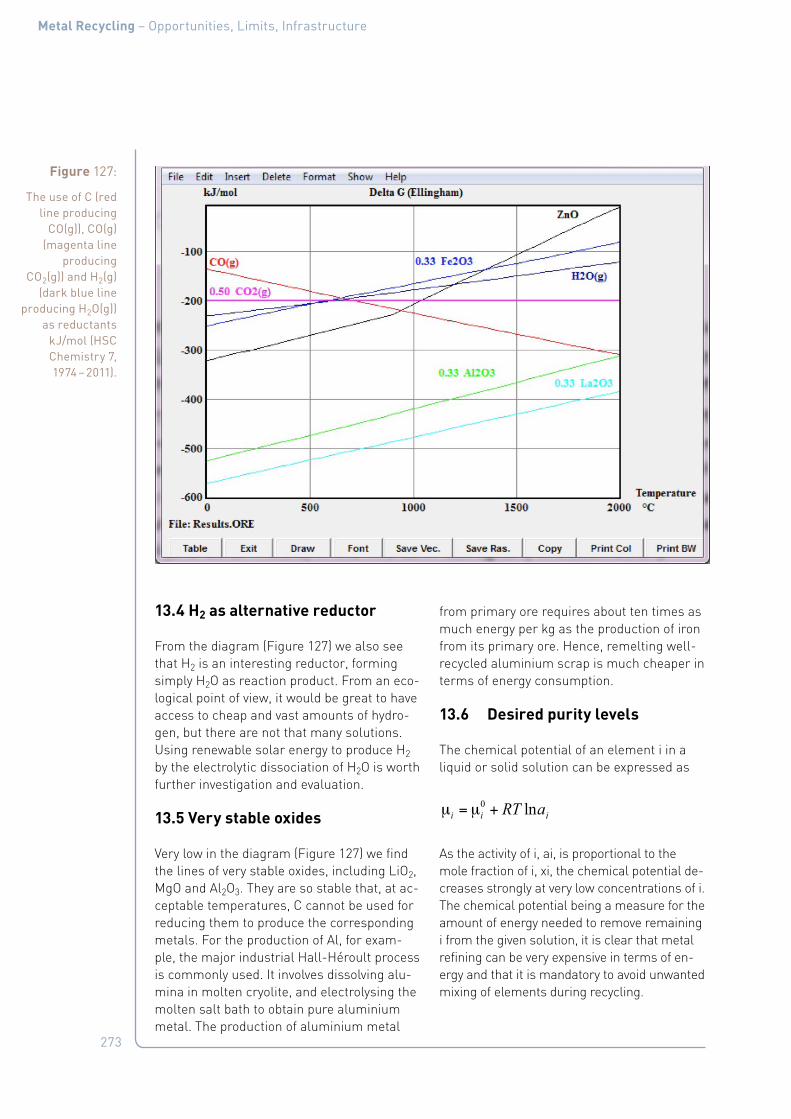
273
Metal Recycling – Opportunities, Limits, Infrastructure
13.4 H2 as alternative reductor
From the diagram (Figure 127) we also see that H2 is an interesting reductor, forming simply H2O as reaction product. From an eco-logical point of view, it would be great to have access to cheap and vast amounts of hydro-gen, but there are not that many solutions. Using renewable solar energy to produce H2 by the electrolytic dissociation of H2O is worth further investigation and evaluation.
13.5 Very stable oxides
Very low in the diagram (Figure 127) we find the lines of very stable oxides, including LiO2, MgO and Al2O3. They are so stable that, at ac-ceptable temperatures, C cannot be used for reducing them to produce the corresponding metals. For the production of Al, for exam-ple, the major industrial Hall-Héroult process is commonly used. It involves dissolving alu-mina in molten cryolite, and electrolysing the molten salt bath to obtain pure aluminium metal. The production of aluminium metal
from primary ore requires about ten times as much energy per kg as the production of iron from its primary ore. Hence, remelting well-recycled aluminium scrap is much cheaper in terms of energy consumption.
13.6 Desired purity levels
The chemical potential of an element i in a liquid or solid solution can be expressed as
As the activity of i, ai, is proportional to the mole fraction of i, xi, the chemical potential de-creases strongly at very low concentrations of i. The chemical potential being a measure for the amount of energy needed to remove remaining i from the given solution, it is clear that metal refining can be very expensive in terms of en-ergy and that it is mandatory to avoid unwanted mixing of elements during recycling.
Figure 127:
The use of C (red line producing
CO(g)), CO(g) (magenta line
producing CO2(g)) and H2(g)
(dark blue line producing H2O(g))
as reductants kJ/mol (HSC Chemistry 7, 1974 – 2011).
iii aRT ln0 +µ=µ

274
Metal Recycling – Opportunities, Limits, Infrastructure
13.7 Slag chemistry and phase diagrams
Typical components in a slag are summarized in Table 47. Their melting points clearly show which compounds have to be controlled in or-der for the melting temperature not to become too high.
When mixed and molten in a furnace, they usually have lower melting points than the in-dividual compounds as shown in Table 48 and also by the phase diagrams of Figure 128 and Figure 129. Note the importance of a low Fe/SiO2 ratio (Row 1 and Row 2) in controlling a low melting temperature. Also note that a bit of lime can bring down the melting temperature (Row 3) but too much is detrimental (Row 4).
Table 47:
Common compounds
in a slag and their melting
points (HSC Chemistry 7). Note that due
to various crystalline forms
of SiO2 a lower value of 1600 °C is
given. For CaO a value of 2572 °C is reported showing
some variations in data.
Slag compound Name Melting Point (°C)
FeO Iron oxide (Fe: iron & O: oxygen)
1377
SiO2 Silica (Si: silicon & O: oxygen)
1723
CaO Lime (Ca: calcium & O: oxygen)
2899
MgO Magnesia (Mg: magnesium & O: oxygen)
2832
Al2O3 Alumina (Al: aluminium & O: oxygen)
2054
ZnO Zinc Oxide (Zn: zinc & O: oxygen)
1975
PbO Lead Oxide (Pb: lead & O: oxygen)
887
Table 48:
Common compound
mixtures in a slag (see Figure 128 and Figure 129)
and their melting points and Fe/
SiO2 ratios (HSC Chemistry 7).
Slag compound Mass % Mixture & Ratio Melting Point (°C)
FeO + SiO2 (2FeO•SiO2 – fayalite)
29.5 % SiO2 and 70.5 % FeO (Fe/SiO2 = 1.86)
1217
FeO + SiO2 37 % SiO2 and 63 % FeO (Fe/SiO2 = 1.32)
1187
CaO + FeO 19.6 % CaO and 80.4 % FeO 1059
CaO + SiO2 (CaSiO3)
49.7 % SiO2 and 48.3 % CaO 1540

275
Metal Recycling – Opportunities, Limits, Infrastructure
The data in Table 47 and Table 48 can be best visualized in triangular phase diagrams a sim-plified version of which is given by Figure 128. The shaded area in the diagram shows the large molten slag area at 1300 °C, a good op-erating temperature for a non-ferrous smelt-ing furnace. This slag composition is targeted:
■ To enable operation at lower temperatures.
■ To reduce refractory damage and fuel us-age, maintaining the slag composition within this region to ensure the slag is flu-id for effective furnace operation and easy tapping.
■ To achieve the target composition, silica, iron ore and limestone fluxes are used.
Figure 128 is very useful for determining the operating area, limits and constraints of the system. From this diagram, we can observe the following:
■ Straight dotted lines on the diagram repre-sent targets relating to slag composition. Maintaining the slag composition on this operating line provides the greatest opera-tional flexibility (i. e. small changes in slag composition can be absorbed by the sys-tem without the occurrence of operational difficulties).
■ Key targets are the FeO/SiO2 ratio and the quantity of lime in slag.
■ It is necessary to control the slag composi-tion within these maximum and minimum target values to ensure the slag remains fluid.
Figure 128:
A simplified SiO2-FeO-CaO
phase diagram showing the area that is molten at 1300 °C with an
industrially safe range of Fe/SiO2 as shown (FACT
Sage).

276
Metal Recycling – Opportunities, Limits, Infrastructure
First, note that all analyses on a triangular phase diagram add up to 100 %. If the compo-sition 49.3 % FeO, 47.6 % SiO2 and 3.1 %CaO is drawn on the phase diagram as shown by Figure 129, it is clear that, since the operat-ing point lies outside the yellow which is un-desirable, the furnace may have an only par-tially molten slag.
Figure 129:
A simplified SiO2-FeO-CaO phase
diagram showing the area that is
molten at 1250 °C and the operating
point (FACT Sage).
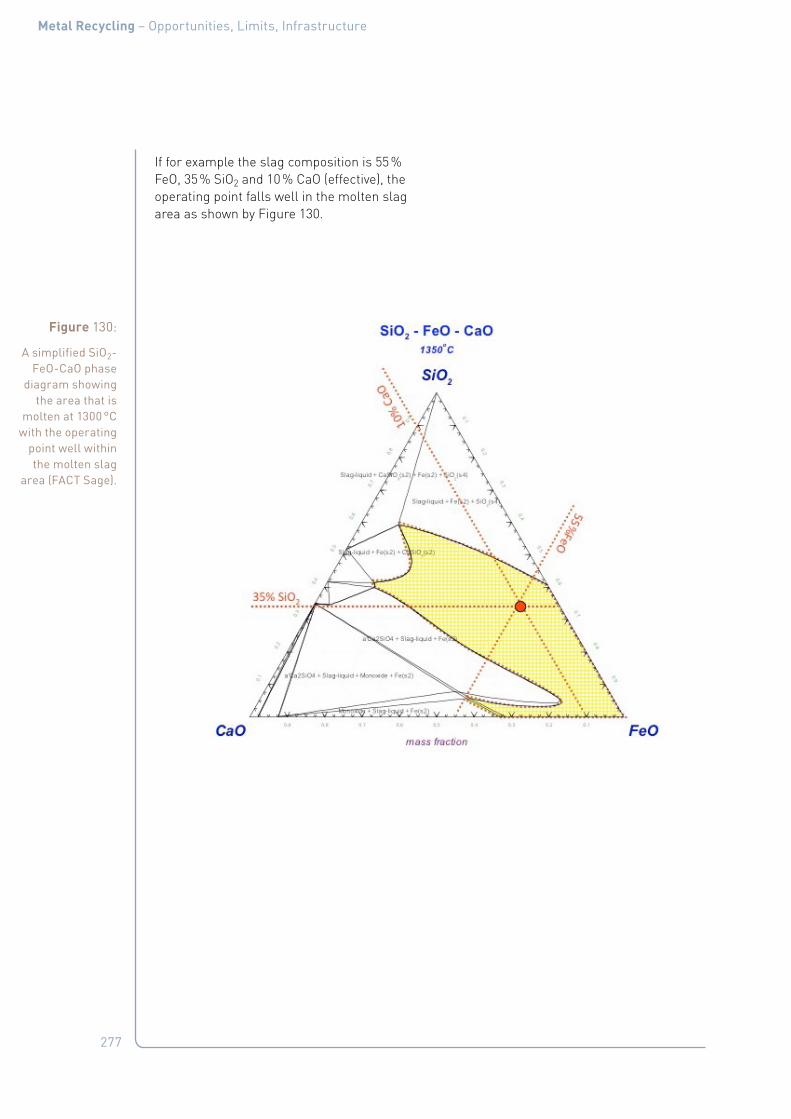
277
Metal Recycling – Opportunities, Limits, Infrastructure
If for example the slag composition is 55 % FeO, 35 % SiO2 and 10 % CaO (effective), the operating point falls well in the molten slag area as shown by Figure 130.
Figure 130:
A simplified SiO2-FeO-CaO phase
diagram showing the area that is
molten at 1300 °C with the operating
point well within the molten slag
area (FACT Sage).

278
Metal Recycling – Opportunities, Limits, Infrastructure
13.8 Thermodynamic costs and benefits of recycling
The benefits of recycling are usually uncon-tested: it saves natural resources and is bet-ter for the environment. However, these ben-efits depend very much on the performance of the recycling processes involved and, in reality, neither of the two potential benefits are necessarily realized. The environmental performance of recycling processes is best assessed using the Life-Cycle Assessment methodology (see above). Depending on tech-nical circumstances, material composition and efficiency of the processes involved, recy-cling might perform better or worse in terms of environmental burdens when compared with primary production. Concerning metals, recycling often compares favourably with pri-mary production (see for instance the Ecoin-vent database for Life-Cycle Assessment, www.ecoinvent.ch).
Regarding resource consumption, one could naively argue that recycling in all cases saves natural resources: natural ores can remain in the ground when recycled materials are used instead. However, even in this category producing metals from recycled sources can be more resource consuming than primary production. This is the case when the target metals can only be extracted from the waste stream with large efforts, as is the case for highly mixed fractions or with chemically or metallurgically challenging material feeds. In these cases, while ores are being saved, oth-er resources, mainly energy carriers, have to be consumed in recycling the target materi-al. In terms of physics, you cannot “upgrade” one resource without causing other resourc-es to be “downgraded” by at least the same amount.
This is essentially the meaning of the sec-ond law of thermodynamics (Kondepudi and Prigogine, 1998), which is why it is a perfect starting point to discuss the aggregated re-source consumption of recycling processes. In the context of this law, the concept of en-tropy is used for measuring the downgrading of resources. Interpretation of the second law
in terms of resource consumption is simple: the more resources are consumed, the more entropy is produced (Gößling, 2001; Gößling-Reisemann, 2008a; 2008b; 2008c; 2011; Gößling-Reisemann et al., 2011). Entropy production is thus the most general form for measuring the physical aspects of resource consumption and the concept can be applied to all processes where materials and energy are transformed (Hinderink et al., 1996).
Entropy production occurs in many forms. Converting high-quality energy carriers to low-temperature heat is one of the most prominent examples, as the mixing of mate-rials produces entropy. As a rule of thumb, whenever a process results in making mate-rial and energy flows less available for fur-ther processing, entropy is produced. The higher the loss in availability of the trans-formed material and energy flows, the high-er is the entropy production. The availability of energy stored within material and energy flows is also known by another name: exergy (Szargut, 2005). As one can easily guess, en-tropy production and exergy loss are high-ly correlated. In fact, in most cases they are proportional and can easily be converted into one another via a simple formula (the Gouy-Stodola equation).
The most important fact about the second law of thermodynamics is that it describes a one-way situation: entropy is created in eve-ry process, it is never destroyed. Only in the unrealistic case of perfect reversibility can the overall entropy be conserved. In other words, resources that were consumed can never be regained. It should be obvious now that “saving resources” with recycling pro-cesses is impossible in general. One can save one resource, but only at the cost of consum-ing others; somewhere, entropy is always produced. What we really do in recycling is spending energy and consuming materials, i. e. we produce entropy for the separation and transformation of recycled materials, in-creasing their technical and economic value.
As we can see, the thermodynamic costs of recycling can be equated with entropy pro-

279
Metal Recycling – Opportunities, Limits, Infrastructure
duction, but what about the benefits? In the same manner that mixing material streams increases their entropy, “unmixing” does the opposite. In reality, the mixing entropy con-tributes only little to the overall entropy of a material flow. However, to decrease this mix-ing entropy, comparatively huge efforts are necessary that in themselves produce large amounts of entropy through resource con-sumption. To avoid confusion, unmixing does not destroy entropy; it is just transferred somewhere else, usually to the surroundings as waste heat. In addition, unmixing usual-ly consumes energy and materials and thus produces even more entropy. Nevertheless, the unmixing of materials is really at the core of recycling. Especially for metals, it is the ultimate service delivered by recycling pro-cesses. In this respect, the local and metal-specific entropy decrease between recycling materials (wastes, discards, obsolete prod-ucts) and recycled metals is the quantifiable benefit of recycling (Gößling-Reisemann et al., 2011; Rechberger, 1999; Rechberger et al., 2008; Rechberger and Brunner, 2002).
13.9 Recycling performance: effectiveness and efficiency (exergy)
Viewed from a thermodynamic perspective and related to the topic of recycling, entro-py production (or exergy loss) can be seen as the most general cost of producing materials, whether from primary ore or from recycling sources. At the same time, the benefit of metal recycling lies in the separation of met-als from unwanted materials and the separa-tion (un-mixing) of mixed metal streams; this benefit can be quantified by a decrease in the entropy of mixing. The more the mixing en-tropy decreases, the more effective is the re-cycling process. However, the less entropy is produced in this process, the more efficient is the process.
When we consider a typical metal-recycling situation, we usually have multiple input flows containing metals in various forms: as pure metals, as metal mixtures, as part of chemical compounds, and so on. In each in-
put flow, the situation might be different: one contains only a mixture of pure metals or al-loys, while another contains various metal oxides or other compounds. For each input flow, we can calculate the total mixing entro-py by applying the text book formula:
where R is the universal gas constant (8.314472 J∙K-1∙mol-1), nj are the molar amounts of component j (compound or ele-ment) and yj are the molar concentrations.
By simply disaggregating the sum, we yield an expression for the partial mixing entropy of each component, e. g. each metal-bear-ing compound (Gößling-Reisemann, 2008c; Gößling-Reisemann et al., 2011):
The mixing entropy of a specific metal X in this input flow is then simply the sum of all partial mixing entropies of compounds that contain X:
Adding the contributions from all input flows (1..k) for a metal X, we arrive at the incoming mixing entropy for metal X into the recycling process:
We can calculate the same for output flows and we can compare the two mixing entro-pies to measure the metal-specific absolute effectiveness of the process:
is negative when the process reduces the mixing of metal X, i. e. when metal X is con-centrated. It is positive when metal X is dissi-pated, i. e. when its mixing across the output

280
Metal Recycling – Opportunities, Limits, Infrastructure
flows is larger than it was across the input flows. Relating the change in metal-specific mixing entropy to the incoming entropy as a base line, gives the relative metal-specific ef-fectiveness of the process:
In recycling practice, usually only some met-als will be of economic interest and are then concentrated, while others might get dis-sipated. In evaluating the whole recycling smelting process, it is instructive to look at all metals that enter the process. The ag-gregated relative effectiveness then gives a measure for the balance between concentra-tion vs. dissipation:
In an ideal case, a perfect recycling process (or chain of processes) would decrease all metal-specific mixing entropies to zero, i. e. it would produce pure fractions, and the rela-tive effectiveness would then be one. These fractions do not need to be pure metals, though. As a fictive example, a process that separates a mixture of say Fe, FeO, and Fe2O3 into three pure fractions would also have an effectiveness of one, even though the result-ing fractions are far from what you would expect from a recycling process. In anoth-er fictive process, carbon might be added to the mixture, and pure fractions of Fe and CO2 could be produced. Again, the effectiveness as defined above is the same, but the qual-ity of the product is different! However, the improved quality comes at a price, i. e. car-bon has to be added. Thus, to fully evaluate process performance, effect has to be com-pared with cost and product quality has to be considered as well. For all practical matters, of course, an effectiveness of one cannot be achieved; there are always losses of metals or metal compounds to other material flows (slags, dust, offgas, etc.) such that the rela-tive effectiveness is below one.
However, when aiming for a sustainable met-als management, effectiveness should be as high as possible, and, within the limits im-posed by economics and technology, entro-py-based measures can help identifying the most effective solutions by considering multi-ple metals at the same time.
As said before, effectiveness is not every-thing: for a complete evaluation we must consider the costs. Economic and energetic costs are relevant factors for market success and environmental performance, and are thus usually analysed sufficiently well. How-ever, resource consumption, as introduced at the beginning of this chapter, is usually not considered in the same detail. A complete picture of the recycling process in terms of thermodynamic performance emerges when the thermodynamic effect is compared with the thermodynamic cost, i. e. the decrease in overall mixing entropy is compared with over-all entropy production. We can do this by ana-lysing the entropy flows into and out of the process over a typical process cycle to get the entropy change of the system (Gößling-Re-isemann, 2008b, 2008c). This entropy change can be decomposed into an exchange term and an internal production term. The first captures the entropy exchanged with the surroundings by heat, material and radia-tion transfer. The internal production part is due to irreversibilities inside the process and forms the actual resource consumption as discussed above:
For steady-state processes, or for a complete cycle in a batch process, the system entropy change ΔSsys is zero: no entropy is accumu-lated inside the system. The internal entro-py production Δi Ssys can then be calculated from the entropy exchange of material, heat and radiation with the surroundings Δe Ssys (Gößling, 2001; Gößling-Reisemann et al., 2011):
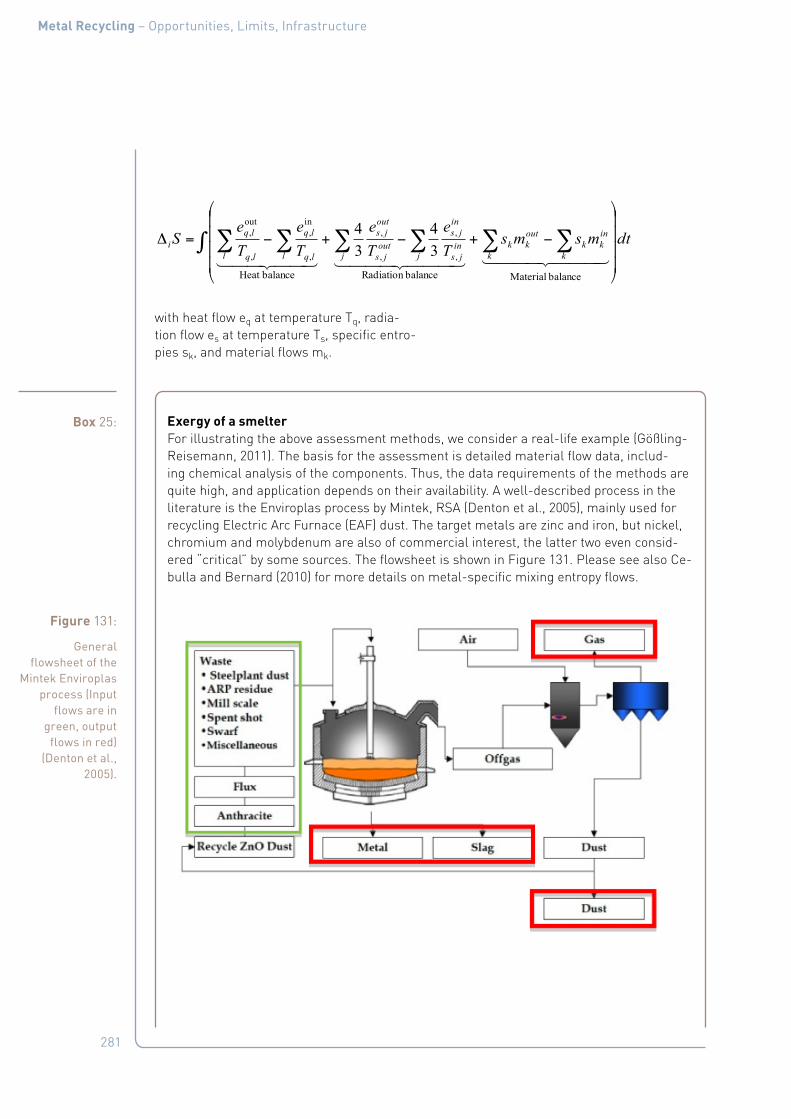
281
Metal Recycling – Opportunities, Limits, Infrastructure
with heat flow eq at temperature Tq, radia-tion flow es at temperature Ts, specific entro-pies sk, and material flows mk.
tdmsmsTe
Te
Te
Te
Sk
inkk
k
outkk
j jinjs
injs
outjs
outjs
l lq
lq
l lq
lqi ∫ ∑∑∑ ∑∑∑
⎟⎟⎟⎟
⎠
⎞
⎜⎜⎜⎜
⎝
⎛
−+−+−=Δ
balance Materialbalance RadiationbalanceHeat
,
,
,
,
,
in,
,
out,
34
34
Box 25: Exergy of a smelterFor illustrating the above assessment methods, we consider a real-life example (Gößling-Reisemann, 2011). The basis for the assessment is detailed material flow data, includ-ing chemical analysis of the components. Thus, the data requirements of the methods are quite high, and application depends on their availability. A well-described process in the literature is the Enviroplas process by Mintek, RSA (Denton et al., 2005), mainly used for recycling Electric Arc Furnace (EAF) dust. The target metals are zinc and iron, but nickel, chromium and molybdenum are also of commercial interest, the latter two even consid-ered “critical” by some sources. The flowsheet is shown in Figure 131. Please see also Ce-bulla and Bernard (2010) for more details on metal-specific mixing entropy flows.
Figure 131:
General flowsheet of the
Mintek Enviroplas process (Input
flows are in green, output
flows in red) (Denton et al.,
2005).

282
Metal Recycling – Opportunities, Limits, Infrastructure
13.10 Solution thermodynamics
The three boxes of the following section brief-ly present examples in pyro- and hydrometal-lurgical solution chemistry, which is of criti-cal importance for predicting the destination of elements between different phases and therefore their recovery throughout the metal production system.
Box 25:_b Fe, Ca and Zn are well concentrated, consistent with the main economic incentive. Oth-er metals are only concentrated slightly like Al, Cr, and Mg, and Mn, Mo, Ni, and Ti are even slightly dissipated. Compared to the concentrating effect on zinc, the overall perfor-mance in terms of metal concentration is only medium (-33%), but in terms of economics it is probably sufficient since zinc and iron are the main motivation for operating the whole process.
The entropy production of the Enviroplas process has not yet been analysed in detail, but by using the data in Denton et al. (2005) and with the help of GEMIS and Ecoinvent, two life-cycle assessment databases, one can roughly estimate the entropy production to be in the range of 90 MJ/K per tonne of metal produced. The entropy-based efficiency can then be calculated to be in about 0.001 (or 0.1%). Without a benchmark, however, this number does not say very much about the maturity of the process. All one can say, is that probably much room exists for improvement, either in decreasing the resource consumption or by improving the overall metal concentration.
Viewed from a sustainability perspective, the Enviroplas process can be improved. Just by how much is not clear from the above analysis, which shows that choosing certain tech-nologies for concentrating target metals affect the possible dissipation of non-target met-als. To approach a closed-loop metals economy, we must consider these side effects and design recycling flowsheets that capture the widest range of metals, without too much dissipative loss.
Box 26: Pyrometallurgy: maximal recovery of materials into a valuable liquid metal phase To separate metals from other metals and optimally recover metals from their metal ox-ides from slags (mixture of molten oxides), a theoretical understanding of phase relation-ships is required. In Figure 132 (left-hand) the effect of iron dissolved in molten aluminium is shown, showing that a large number of inter-metallic compounds are created, which makes the removal of Fe from Al very difficult, while also noting the eutectic at around 1.8 % Fe. Figure 132 (right-hand) shows a ternary phase diagram defining the melting points of all possible mixtures of FeO-SiO2-CaO. From this figure it is evident that alumin-ium oxidized to alumina (Al2O3) and dissolved in slag markedly increases the melting point of slag. Excess aluminium in the feed should thus be avoided in scrap that goes to a non-ferrous smelter. The latter has to operate with a liquid and low-viscosity slag to operate well and recover the metals from the slag into a metal phase. Aluminium in the feed re-duces process functionality and thus metal recovery in a non-ferrous smelter.
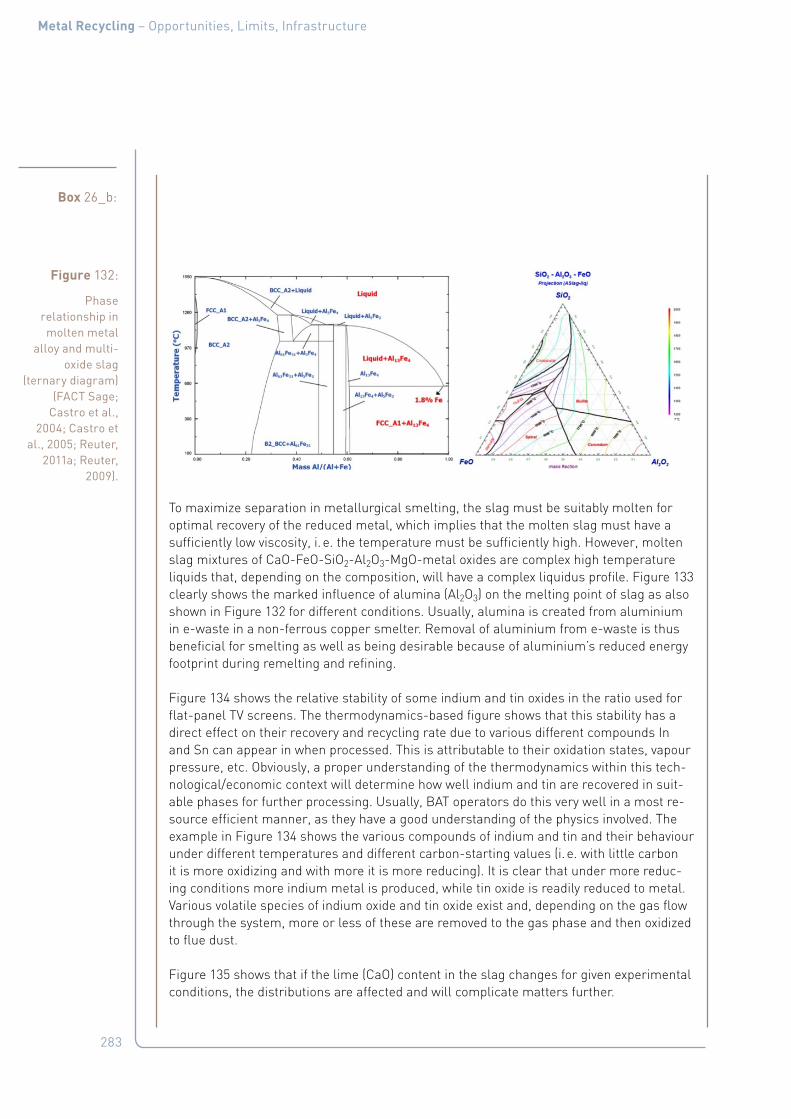
283
Metal Recycling – Opportunities, Limits, Infrastructure
Box 26_b:
To maximize separation in metallurgical smelting, the slag must be suitably molten for optimal recovery of the reduced metal, which implies that the molten slag must have a sufficiently low viscosity, i. e. the temperature must be sufficiently high. However, molten slag mixtures of CaO-FeO-SiO2-Al2O3-MgO-metal oxides are complex high temperature liquids that, depending on the composition, will have a complex liquidus profile. Figure 133 clearly shows the marked influence of alumina (Al2O3) on the melting point of slag as also shown in Figure 132 for different conditions. Usually, alumina is created from aluminium in e-waste in a non-ferrous copper smelter. Removal of aluminium from e-waste is thus beneficial for smelting as well as being desirable because of aluminium’s reduced energy footprint during remelting and refining.
Figure 134 shows the relative stability of some indium and tin oxides in the ratio used for flat-panel TV screens. The thermodynamics-based figure shows that this stability has a direct effect on their recovery and recycling rate due to various different compounds In and Sn can appear in when processed. This is attributable to their oxidation states, vapour pressure, etc. Obviously, a proper understanding of the thermodynamics within this tech-nological/economic context will determine how well indium and tin are recovered in suit-able phases for further processing. Usually, BAT operators do this very well in a most re-source efficient manner, as they have a good understanding of the physics involved. The example in Figure 134 shows the various compounds of indium and tin and their behaviour under different temperatures and different carbon-starting values (i. e. with little carbon it is more oxidizing and with more it is more reducing). It is clear that under more reduc-ing conditions more indium metal is produced, while tin oxide is readily reduced to metal. Various volatile species of indium oxide and tin oxide exist and, depending on the gas flow through the system, more or less of these are removed to the gas phase and then oxidized to flue dust.
Figure 135 shows that if the lime (CaO) content in the slag changes for given experimental conditions, the distributions are affected and will complicate matters further.
Figure 132:
Phase relationship in molten metal
alloy and multi-oxide slag
(ternary diagram) (FACT Sage;
Castro et al., 2004; Castro et
al., 2005; Reuter, 2011a; Reuter,
2009).

284
Metal Recycling – Opportunities, Limits, Infrastructure
Box 26_c:
Figure 133:
The effect of different alumina
levels (from aluminium in
e-waste) on the slag liquidus
temperature, on solids in solution
as a function of temperature, and on oxygen partial
pressure of a typical slag (FACT
Sage; Reuter et al., 2011b).
Figure 134:
The stability of some of tin
(Sn) and indium (In) oxides
under different operating
conditions: (a, left) shows
more reducing conditions while (b, right) shows more oxidizing
conditions (HSC Chemistry 7, 1974 – 2013;
Outotec).

285
Metal Recycling – Opportunities, Limits, Infrastructure
Box 26_d:
Figure 136 shows Gibbs Free Energy (Ellingham) graphs for various oxides as a function of temperature. This so-called Ellingham diagram shows the relative stability of oxides and how easily these can be reduced to metal. SnO2/In2O3 are easiest to reduce, while various REO are extremely difficult to reduce with, e. g., carbon and hydrogen, requiring the use of hydrometallurgy for refining.
Figure 135:
The distribution of indium and
copper between metal and slag as a function of
lime addition at 1300 oC, Fe/
SiO2 = 1.1-1.2 and log(pO2) = -7
(Anindya et al., 2011).
Figure 136:
Ellingham Diagram for the Stability
of various compounds
in e-waste – the bottom
compounds being the most stable
(HSC Chemistry 7, 1974 – 2013;
Outotec).

286
Metal Recycling – Opportunities, Limits, Infrastructure
Box 27: Hydrometallurgy: maximal recovery of materials into a valuable aqueous phaseAs for pyrometallurgy, hydrometallurgy requires a keen understanding of the thermody-namics of aqueous solutions. Similar to phase diagrams at different temperatures for different partial oxygen pressures, Eh-pH diagrams (Figure 137) provide an indication of which different phases are stable in aqueous electrolytes. Ultimately, the ‘critical’ ele-ments at some stage go through hydrometallurgy to create pure metals and compounds.
Note that during for example leaching of printed wire boards entropy is increased considerable when numerous metals (and compounds) go into solution as mg/l and g/l and then having subsequently to clean the solutions to recover pure compounds and metals (thus decreasing entropy again). Careful analysis of thermodynamics and associated economics are required to evaluate its suitability for this. This analysis is especially important as a hazardous heavy metal contain-ing printed wire board remains, which will incur landfill and/or other/further treatment costs. Usually an economic dic-tated balance between pyro- and hydrometallurgy is required to best recycle printed circuit boards.Figure 137:
Eh-pH diagram for an aqueous
electrolyte showing the
behaviour of different
dissolved elements, which
are subsequently recovered by
various refining processes (HSC
1974 – 2013).
Box 28: Recycling of gallium-arsenide on a printed wire boards vis-à-vis steel beverage can recyclingThe successful recycling of steel beverage cans can be explained by various “simple” recy-cling-rate-calculation definitions, which are close to a Material (& Metal)-Centric recycling view.
On the other hand, the recycling of gallium (Ga) and arsenic (As) from a gallium-arsenide component on printed wire boards (PWB) in electronic products is far more difficult. Due to its functional linkages, using simple Material (& Metal)-Centric recycling-rate-calcula-tion definitions is not possible. A Product-Centric recycling view takes note of the sophisti-cated physics that is required for separating Ga and As from all the other 50+ elements in some End-of-Life products, producing pure GaAs for reuse on PWBs. However, GaAs may be present as traces and may well be locked up in, for example, environmentally benign slag. In this case, recycling of these elements makes no economic sense, but it is impor-tant to have a system that can take care of all these element mixes while maximizing met-al recovery, profit and minimizing ecological damage.
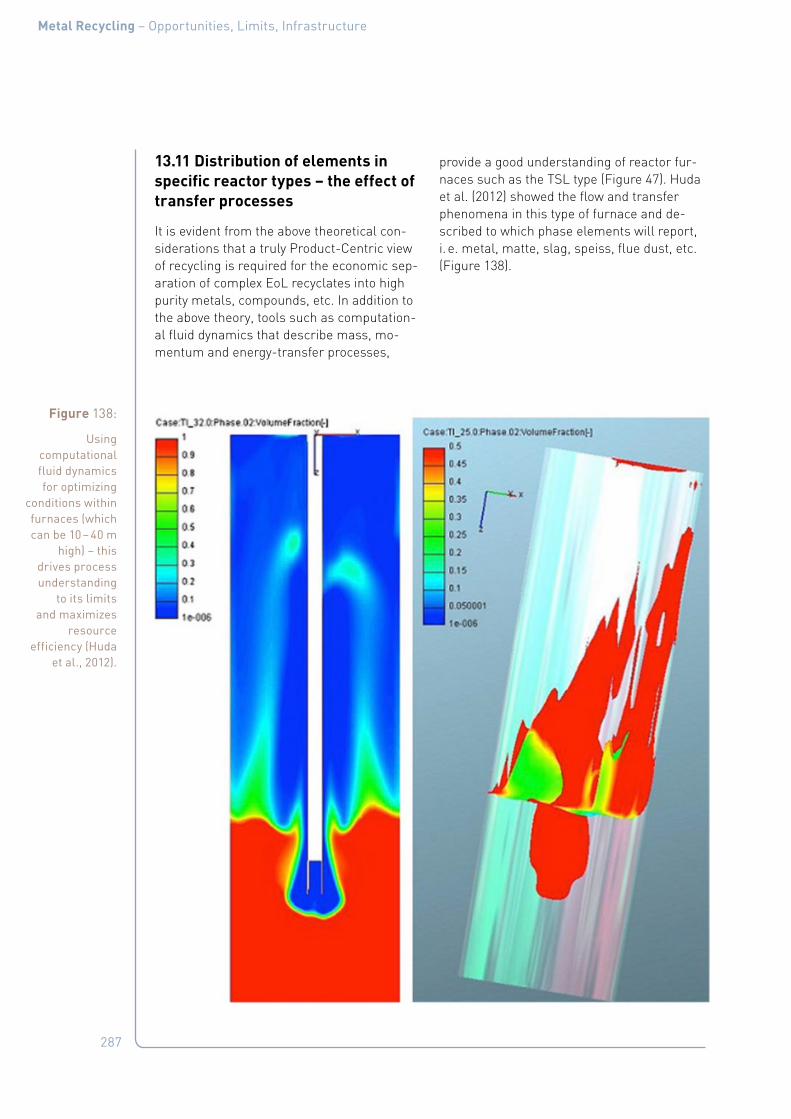
287
Metal Recycling – Opportunities, Limits, Infrastructure
13.11 Distribution of elements in specific reactor types – the effect of transfer processes
It is evident from the above theoretical con-siderations that a truly Product-Centric view of recycling is required for the economic sep-aration of complex EoL recyclates into high purity metals, compounds, etc. In addition to the above theory, tools such as computation-al fluid dynamics that describe mass, mo-mentum and energy-transfer processes,
provide a good understanding of reactor fur-naces such as the TSL type (Figure 47). Huda et al. (2012) showed the flow and transfer phenomena in this type of furnace and de-scribed to which phase elements will report, i. e. metal, matte, slag, speiss, flue dust, etc. (Figure 138).
Figure 138:
Using computational fluid dynamics for optimizing
conditions within furnaces (which can be 10 – 40 m
high) – this drives process understanding
to its limits and maximizes
resource efficiency (Huda
et al., 2012).

288
Metal Recycling – Opportunities, Limits, Infrastructure
The “element radar chart” (Figure 64) graphi-cally shows how easy or difficult it is to sepa-rate metals within various mainstream-met-al (Carrier Metal) reactor types (Nakajima et al., 2009; 2011; Hiraki et al. 2011) for prima-ry production. The chart shows how metals (and their compounds) split between met-al, slag and flue dust, and therefore whether they are recoverable in the indicated reactor types (note that this tells us nothing about the downstream processes). The theoretical aspects discussed above determine the dis-tribution of all these elements in a specific reactor. For example, alloying elements for steel such as nickel, tungsten, molybdenum, and cobalt are stable in molten iron. This thermodynamic feature usually leads them to stay in metallic iron, where they are lost for other uses and become impurities in the steel, which cannot be removed by conven-tional recycling systems of steel, aluminium or magnesium. The radar chart shows this, indicating that removing impurities and/or
extracting valuable scarce metals is easier for the other metal processes shown. This il-lustrates that the level of impurities in metal produced by conventional steel, aluminium and magnesium recycling depends upon the purity of the input. With some impurities, like tin and copper in steel, the metal will become substandard. Tin dissolves in the molten steel and, on cooling, solidifies on the steel-grain boundaries, thereby destroying the steel phase-structure necessary for steel’s strength and durability. Copper above 0.25 % by weight in scrap input for steel making, will cause the steel to become brittle or soft ("hot shortness"), prohibiting the manufacture of high quality products from such scrap.
Ultimately the distribution of elements be-tween the different phases within a metallur-gical reactor are among others functions of the technology but also how well the temper-ature and partial oxygen pressure can be ma-nipulated to achieve the best economic goal.
Figure 139:
Manipulating conditions within a TSL to achieve
desired metal production and
energy recovery, recycling and
waste processing (www.outotec.
com).
Precious metal cuppelation
Precious metal smelting
Cu/Ni(Converting/continuous-C3, e-waste)
SPL
MWI (Slag)
Sn (Smelting)
Sn (Slag)
Zn (EAF, Residues and Oxidic Ores)
Cu/Ni(Smelting)
Pb(High grade concentrates)
Pb(Battery recycling)
PbLow grade concentrates, Slags
CuBlack & e-waste
Ni Laterite
Fe (AusIron-Pilot) Ferroalloys IlmeniteProcessing
800° C
pO2
1000° C 1200° C 1400° C 1600° C 1800° C
Operating Temperature
Oxidizing
Reducing
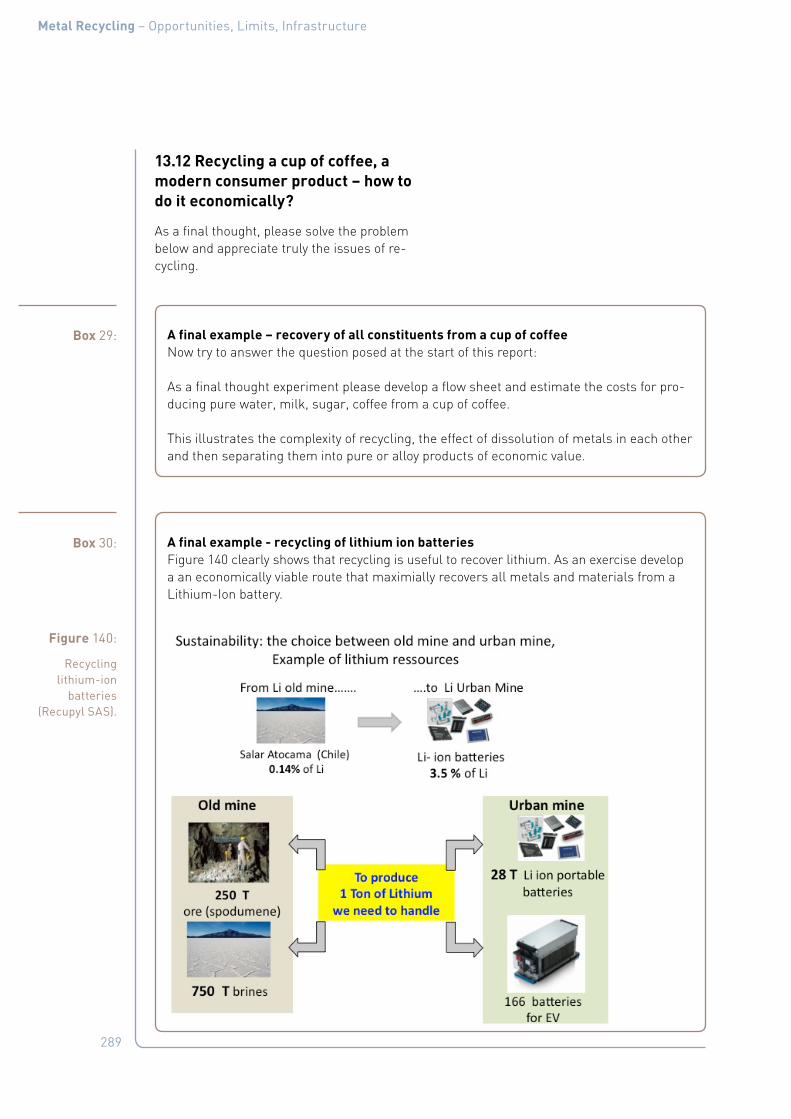
289
Metal Recycling – Opportunities, Limits, Infrastructure
13.12 Recycling a cup of coffee, a modern consumer product – how to do it economically?
As a final thought, please solve the problem below and appreciate truly the issues of re-cycling.
Box 29: A final example – recovery of all constituents from a cup of coffeeNow try to answer the question posed at the start of this report:
As a final thought experiment please develop a flow sheet and estimate the costs for pro-ducing pure water, milk, sugar, coffee from a cup of coffee.
This illustrates the complexity of recycling, the effect of dissolution of metals in each other and then separating them into pure or alloy products of economic value.
Box 30: A final example - recycling of lithium ion batteries Figure 140 clearly shows that recycling is useful to recover lithium. As an exercise develop a an economically viable route that maximially recovers all metals and materials from a Lithium-Ion battery.
Figure 140:
Recycling lithium-ion
batteries (Recupyl SAS).

290
Metal Recycling – Opportunities, Limits, Infrastructure
8. References
1. Abelson, P. H. A potential phosphate crisis. Science, vol. 283, No.5410 p. 2015 (1999).
2. Achzet, B., Reller, A.: Powering the Future (pre-publication) (2011).
3. Van Acker, K., Verpoest, I.: Is CFRP an environmentally friendly alternative for transport? – LCA of the entire life cycle of CFRP, GO Carbon Fibre 2011, Seattle, Washington, October 5 – 6, 2011.
4. AEB Amsterdam. Facts and Figures. Available from: http://www.amsterdam.nl/aeb/english/about-us/facts-figures/(accessed December 7th, 2012).
5. Agricola, G. De Re Metallica, p. 439p. (1556). Translated by H.C. Hoover & L.H. Hoover, Dover Publications, New York, p. 638 (1950).
6. Alfantazi, A.M., Moskalyk, R.R.: Pro-cessing of indium: a review. Minerals Engineering, vol.16, No. 8, pp. 687 – 694 (2003).
7. Allwood, J.M., Ashby, M.F., Gutowski, T.G., Worrell, E.: Material efficiency: A white paper. Resources, Conservation and Recycling, vol. 55, pp. 362 – 381 (2011).
8. Amini, S. H. Remmerswaal, J. Castro, M.B. and Reuter, M.A., Quantifying the quality loss and resource efficiency of Recycling by means of exergy analysis. Journal of Cleaner Production, vol. 15, pp. 907 – 913 (2007).
9. Anastas, P.T., Breen, J.J.Design for the environment and green chemistry: the heart and soul of industrial ecol-ogy. Journal of Cleaner Production, vol. 5(1 – 2), 97 – 102 (1997).
10. Angerer, G. Raw materials for emerg-ing technologies; The case of Lithium, Eco-efficient Economy, Presentation, Linkoping, November 2009, Available from: http://isi.fraunhofer.de/isi-en/service/presseinfos/2010/pri10-02.php (accessed December 7th, 2012).
11. Anindya, A., Swinbourne, D., Reuter, M.A., Matusewicz, R. Indium distribution during smelting of WEEE with copper scrap, European Metal Conference, EMC 2011, GDMB (Goslar), Düsseldorf, Ger-many (June 26th – 29th, 2011), 1, 3 – 14 (2011).
12. ARN – Auto Recycling Nederland. Re-cycling Process. Available from: http://www.arn.nl/english/ARN-Recycling/Process (accessed December 7th, 2012).
13. Aspen Plus: AspenTech (1994 – 2011) Available from www.aspentech.com (ac-cessed December 7th, 2012).
14. Aurubis www.aurubis.com (accessed December 7th, 2012).
15. Ayres, R.U. Metals Recycling: economic and environmental implications. Re-sources, Conservation and Recycling, vol. 21, pp. 145 – 173 (1997).
16. Baker, E., Bournay, E., Harayama, A. and Rekacewisz, P. Vital Waste Graph-ics. Basel Convention Secretariat/UNEP-GRID. Available from: http://www.grida.no/publications/vg/waste/ (2005).
17. Basson, L., Petrie, J. A critical sys-tems approach to decision support for process engineering. Computers and Chemical Engineering, vol. 31, pp. 876 – 888 (2007). Basel Secretariat, 2012. Origins of the Convention. Avail-able from: http://www.basel.int/conven-tion/basics.html#1 (accessed Decem-ber 7th, 2012).
18. Befesa www.befesa-steel.com (ac-cessed December 7th, 2012).

291
Metal Recycling – Opportunities, Limits, Infrastructure
19. Bernardes, A.M., Espinosa, D.C.R., Tenório, J.A.S. Recycling of batteries: a review of current processes and tech-nologies. Journal of Power Sources, vol. 130, pp. 291 – 298 (2004).
20. Bertram, M., Martchek, K.J., Rombach, G. Material Flow Analysis in the Alu-minum Industry. Journal of Industrial Ecology, vol. 13(5), pp. 650 – 654 (2009).
21. Bertuol, D.A. et al.: Spent NiMH batter-ies: Characterization and metal recov-ery through mechanical processing. Journal of Power Sources, vol. 160, pp. 1465 – 1470 (2006).
22. Biddle, M.B., Dinger, P., Fisher, M.M. An Overview of Recycling Plastics from Durable Goods: Challenges and Oppor-tunities. IdentiPlast II Conference, Brus-sels (April 1998).
23. BIR, Bureau of International Recycling www.bir.org (accessed December 7th, 2012).
24. Bodénan F., Hanrot F., Moulin I., Poirier J., Rose J., Piantone P. et al. Recycling physically sorted steelworks slag for the metallurgical and cement industries: conclusions of the ORLA research pro-ject. Proceedings of the 12th European Congress and Exhibition on Advanced Materials and Processes (Euromat 2011). Session C52, 12 – 15 sept 2011, Montpellier, France (2011).
25. Boin, U.M.J., Bertram, M.: Melting Standardized Aluminum Scrap: A Mass Balance Model for Europe, Journal of Metals, vol.46, pp. 26 – 33 (2005).
26. NewBoliden. Available from: www.bo-liden.se (accessed December 7th, 2012).
27. Boni, H. and R. Widmer: Disposal of Flat Panel Display Monitors in Switzerland, EMPA, March 2011.
28. Bosmans, A., et al. Enhanced Landfill Mining: a crucial role for Waste-to-Energy technologies. Journal of Cleaner Production (2012).
29. Boustead, I., Hancock G-F.Handbook of Industrial Energy Analysis. Ellis Hor-wood Ltd., 1979.
30. Bundesanstalt für Geowissenschaften und Rohstoffe (BGR), Raw Materials Group (2010). Available from: http://www.bgr.bund.de (accessed December 7th, 2012).
31. Briffaerts, K. Spirinckx, C., Van der Linden, A., Vrancken, K.: Waste battery treatment options: Comparing their en-vironmental performance, Waste Man-agement, vol. 29, pp. 2321 – 2331 (2009).
32. Brunner, P.H., Rechberger, H. Practi-cal Handbook of Material Flow Analysis, Lewis Publishers, Boca Raton, FL, ISBN 1566706041, p. 336 (2004).
33. Brundtland Report: Our Common Fu-ture, Oxford: Oxford University Press. ISBN 0-19-282080-X, 1987. Available from http://www.un-documents.net/wced-ocf.htm (accessed December 7th, (2012).
34. Buckminster Fuller, R. Critical Path, St. Martin’s Press, New York, p. 471 (1981).
35. McDonough, W., Braungart, M. Cradle To Cradle Remaking the Way We Make Things, North Point Press, New York, p. 193 (2002).
36. Castro, B., Remmerswal, H., Boin, U., Reuter, M.A. A thermodynamic ap-proach to the compatibility of materials combinations for recycling. Resources, Conservation and Recycling, vol. 43(1), pp. 1 – 19 (2004).

292
Metal Recycling – Opportunities, Limits, Infrastructure
37. Castro, B., Remmerswal, H., Brezet, H., Van Schaik, A., Reuter, M.A. A simula-tion model of the comminution-libera-tion of recycling streams: Relationship between product design and the libera-tion of materials during recycling. Inter-national Journal of Minerals Processing. vol. 75 (3 – 4), pp. 255 – 281 (2005).
38. Chancerel, P.; Meskers, C.; Hagelüken, C.; Rotter, S. WEEE: metals too precious to ignore. Recycling International No-vember, pp. 42 – 45 (2008).
39. Chancerel, P., Meskers, C.E.M., Hagelüken, C., and Rotter, V.S.: Precious metal flows during the preprocessing of electronic waste. Journal of Industrial Ecology, vol. 13(5), pp. 791 – 810 (2009).
40. Chancerel, P., Rotter, S. Recycling-oriented characterization of small waste electrical and electronic equip-ment, Waste Management, vol. 29, pp. 2336 – 2352 (2009a).
41. Chancerel, P., Rotter, V.S. Assessing the management of small Waste Electri-cal and Electronic Equipment through Substance Flow Analysis – The exam-ple of gold in Germany and the USA. Proceedings of the ISSST International Symposium on Sustainable Systems and Technology, 18 – 20 May 2009, Phoenix (2009b).
42. Chancerel, P. Substance flow analysis of the recycling of small waste electri-cal and electronic equipment – An as-sessment of the recovery of gold and palladium. Doctoral thesis, Technische Universitaet Berlin, Germany (2010). Available from: http://opus.kobv.de/tu-berlin/frontdoor.php?source_opus=2590 (accessed December 7th, 2012).
43. Cebulla, B.: Beschreibung der Recyclin-geffienz und -effektivität mittels ther-modynamischer Maße anhand zweier ausgewählter metallurgischer Prozes-se. Bachelor thesis. Advisor: Stefan
Gößling-Reisemann. University of Bre-men, Faculty of Production Engineering, Division of Technological Design and Development (Prof. A. von Gleich) (2010).
44. Chemconserve, Nederland (2011). Avail-able from: www.chemconserve.com (accessed December 7th, 2012).
45. Chi, X., Streicher-Porte, M., Wang, M.Y.L., Reuter, M.A. Informal electronic waste Recycling: A sector review with special focus on China, Waste Manage-ment, vol. 31, pp. 731 – 742 (2011).
46. Copper Development Association. Cop-per Info. Available from: http://www.copperinfo.co.uk/alloys (accessed No-vember 2, 2012).
47. Copper, International Copper Associa-tion. Available from: http://www.arcat.com/arcatcos/cos37/arc37309.html (ac-cessed December 7th, 2012).
48. Choi, B., Shin, H., Lee, S., Hur, T. Life Cycle Assessment of a Personal Com-puter and its Effective Recycling Rate. International Journal of LCA, vol. 11(2), pp. 122 – 128 (2006).
49. Christen, K., Closing the phosphorus loop. Environmental Science and Tech-nology, vol. 41, p. 2078 (2007).
50. Cowell, S.J., Wehrmeyer, W., Argust, P.W., Robertson, J.G.S. Sustainability and the primary extraction industries: theories and practice. Resources Policy, vol. 25, pp. 277 – 286 (1999).
51. Cui, J., Forssberg, E. Mechanical Re-cycling of waste electric and electronic equipment: a review. Journal of Hazard-ous Materials, B99, pp. 243 – 263 (2003).
52. Cui, J., Zhang, L. Metallurgical recov-ery of metals from electronic waste: A review. Journal of Hazardous Materials, vol. 158, pp. 228 – 256 (2008).
293
Metal Recycling – Opportunities, Limits, Infrastructure
53. Damanhuri, E. Post-Consumer Waster Recycling and Optimal Production, Published by InTech Janeza Trdine 9, 51000 Rijeka, Croatia, 306p. (2012). Available from: http://www.intechopen.com/books/post-consumer-waste-recy-cling-and-optimal-production (accessed November 2, 2012).
54. Denton, G. M., Barcza, N. A., Scott, P. D., Fulton, T. EAF Stainless Steel Dust Processing. Mintek, Pyrometallurgy Division. Randburg, South Africa. Mintek Technical Papers (2005).
55. DEFRA. Department for Environment, Food and Rural Affairs. Trial to establish waste electrical and electronic equip-ment (WEEE) protocols, p. 104 (2007).
56. Deubzer, O. Explorative Study into the Sustainable Use and Substitution of Sol-dering Metals in Electronics. Doctoral thesis, Delft University of Technology, Delft, the Netherlands (2007).
57. Dewulf, J., Van Langenhove, H. Integrat-ing industrial ecology principles into a set of environmental sustainability indicators for technology assessment. Resources Conservation and Recycling, vol. 43, pp. 419 – 432 (2005).
58. Dewulf, J., Van der Vorst, G., Denturck, K., Van Langenhove, H., Ghyoot, W., Tytgat, J., Vandeputte, K. Recycling rechargeable lithium ion batteries: criti-cal analysis of natural resource sav-ings. Resource Conservation Recycling, vol. 54, pp. 229 – 234 (2010).
59. Dodbiba, G., Takahashi, K., Sadaki, J., Fujita, T.: The Recycling of plastic wastes from discarded TV sets: compar-ing energy recovery with mechanical Recycling in the context of life cycle as-sessment. Journal of Cleaner Produc-tion, vol. 16, pp. 458 – 470 (2006).
60. U.S. Department of Energy (2010): Criti-cal Materials Strategy. Available from: http://energy.gov/sites/prod/files/edg/news/documents/criticalmaterialsstrat-egy.pdf (accessed November 2, 2012)
61. DOWA. Available from: www.dowa.com (accessed December 7th, 2012).
62. Dubreuil A, Young SB, Atherton J, Glora TP. Metals recycling maps and alloca-tion procedures in life cycle assessment. International Journal of Life Cycle As-sessment, vol.15, pp. 621 – 634 (2010).
63. Duflou, J.R., Seliger, G., Kara, S., Um-eda, Y., Ometto, A., Willems, B.Efficiency and feasibility of product disassem-bly: A case-based study. CIRP Annals – Manufacturing Technology, vol. 57, pp. 583 – 600 (2008).
64. Duflou, J.R., Deng, Y., Van Acker, K., Dewulf, W., Do fiber-reinforced polymer composites provide environmentally advantageous benign alternatives? – An LCA-based study. MRS Bulletin Sustain-ability issue (to be published) (2012).
65. Durao Jr., W.A. et al., Mercury reduction studies to facilitate the thermal decon-tamination of phosphor powder residues from spent fluorescent lamps. Waste Management, vol. 28, pp. 2311 – 2319 (2008).
66. European Aluminium Association, Alu-minium Recycling in Europe. The Road to High Quality Products, p. 52 (2006).
67. Edwards, R., Pearce, D. The effect of prices on the recycling of waste mate-rials. Resources Policy, pp. 242 – 248 (December 1978).
68. Integrated Pollution Prevention and Control (IPPC) Reference Document on Best Available Techniques in the Non Ferrous Metals Industries December 2001 (Next Version Due 2012).

294
Metal Recycling – Opportunities, Limits, Infrastructure
69. European Commission DG ENV.E3, Heavy Metals in Waste, Final Report, February 2002. Available from: www.ec.europa.eu/environment/waste/stud-ies/pdf/heavy_metalsreport.pdf (ac-cessed December 7th, 2012).
70. European Parliament and Council Di-rective 94/62/EC of 20 December 1994 on packaging and packaging waste. OJ L365, Brussels, Belgium.
71. European Parliament and Council Di-rective 1999/31/EC of the European parliament and of the council of 26 April 1999 on the landfilling of waste. Official Journal of the European Communities 1999; L182:1 – 19, Brussels Belgium.
72. European Parliament and Council Di-rective 2000/53/EC of the European Par-liament and the council of 18 Septem-ber 2000 on end of life vehicles, Official Journal of the European Communities, 21-10-2000, Brussels Belgium.
73. European Parliament and Council Di-rective 2002/96/EC of the European par-liament and of the council of 27 January 2003 on waste electrical and electronic equipment (WEEE). Official Journal OJ L 37 of 13.02.2003, Brussels Belgium.
74. European Parliament and Council Di-rective 2002/95/EC of the European Parliament and of the Council of 27 Jan-uary 2003 on the restriction of the use of certain hazardous substances in electri-cal and electronic equipment (RoHS). Official Journal OJ L 37 of 13.02.2003, Brussels Belgium.
75. REACH (Registration, Evaluation, Au-thorisation and Restriction of Chemical substances), REACH is the European Community Regulation on chemicals and their safe use (EC 1907/2006). Avail-able from: http://ec.europa.eu/environ-ment/chemicals/reach/reach_intro.htm (accessed December 7th, 2012).
76. Staff Working Paper Accompanying the proposal for a directive of the European Parliament and of the Council on waste electrical and electronic equipment (WEEE) (recast) – Impact Assessment {COM(2008) 810 final} {SEC(2008) 2934}.
77. European Lamp Companies Federa-tion. Environmental aspects of lamps. Brussels, 2nd edition, p. 17 (April 2009). Available from: http://www.elcfed.org/documents/090811_elc_brochure_envi-ronmental_aspects_lamps_updated_fi-nal.pdf (accessed December 7th, 2012).
78. Ellen McArthur Foundation (2012), To-wards the circular Economy. Economic and business rationale for an acceler-ated transition, p. 99 (2012). Available from: http://www.thecirculareconomy.org/. (accessed December 7th, 2012).
79. Elker. Available from: http://www.elker.fi (accessed December 7th, 2012).
80. Critical raw materials for the EU. Report of the Ad-hoc Working Group on defin-ing critical raw materials, Enterprise and Industry Directorate General, p. 85 (2010). Available from: http://ec.europa.eu/enterprise/policies/raw-materials/documents/index_en.htm (accessed December 7th, 2012).
81. COM 699. Communication from the commission to the European Parliament and the Council. The Raw Materials Initiative – Meeting our critical needs for growth and jobs in Europe, Brussels (2008).
82. United Nations University. Review of Directive 2002/96 on Waste. Electrical and Electronic Equipment – Study No. 07010401/2006/442493/ETU/G4, p. 347 (2007).

295
Metal Recycling – Opportunities, Limits, Infrastructure
83. European Commission DG Environment: Gather, process, and summarize infor-mation for the review of the waste elec-tric and electronic equipment directive (2002/96/EC). Synthesis report. Final version September 21, 2006. [ENV.G.1/FRA/2004/0081, study no. 16], p. 293 (2006).
84. European Commission. Analysis of Existing Environmental Impact As-sessment Methodologies for use in Life Cycle Assessment. In: European Commission, editor. ILCD Handbook – International Reference Life Cycle Data System. Joint Research Centre (EC-JRC), Institute for Environment and Sustainability, Ispra (Italy) (2010).
85. European Commission. Proposal for a DIRECTIVE OF THE EUROPEAN PARLIA-MENT AND OF THE COUNCIL on waste electrical and electronic equipment (WEEE). Summary of the Impact As-sessment, 2008a. Available from: http://eurlex.europa.eu/LexUriServ/LexUriS-erv.do?uri=SEC:2008:2934:FIN:EN:PDF (accessed December 7th, 2012).
86. European Commission. Recast of the WEEE Directive, 2012. Available from: http://ec.europa.eu/environment/waste/weee/index_en.htm (accessed Decem-ber 7th, 2012).
87. European Topic Centre on Sustainable Consumption and Production. Waste from electrical and electronic equip-ment (WEEE) (2009). Available from: http://scp.eionet.europa.eu/themes/waste/#6 (accessed December 7th, 2012).
88. Eurometaux’s proposals for the raw materials initiative, Darmstadt/Brussels (11th June 2010). Availabel from: http://www.oeko.de/oekodoc/1069/2010-115-en.pdf and appendix (accessed Decem-ber 7th, 2012).
89. FACT Sage. Availabel from: www.factsage.com (accessed December 7th, 2012).
90. Fagan, J.E., Reuter, M.A. Langford, K.J. Dynamic performance metrics of integrated urban water systems. Re-source Conservation Recycling, vol. 54, pp. 719 – 736 (2010).
91. Food and Agriculture Organization, FAOSTAT. Rome: Statistics Division, FAO, (2011).
92. Ferrão, P., Amaral, J. Assessing the economics of auto recycling activities in relation to European Union Directive on end of life vehicles. Technological Forecasting & Social Change, vol. 73, pp. 277 – 289 (2006).
93. Franz, K.A., Kehr, W.G., Siggel, A., Wieczoreck, J., Adam, W. Luminescent Materials. Ullmann’s Encyclopedia of Industrial Chemistry, Wiley-VCH Verlag GmbH & Co, KGaA, Weinheim, Germany, p. 41 (2010).
94. Froelich, D., Maris, E., Haoues, N., Chemineau, L., Renard, H., Abraham, F., Lassartesses, R. State of the art of plastic sorting and Recycling: Feedback to vehicle design. Minerals Engineering, vol. 20, pp. 902 – 912 (2007).
95. First Solar. Available from: www.firstso-lar.com (accessed December 7th, 2012).
96. Futatsuka, T. Shitogiden, K. Miki, T. Nagasaka, T. and Hino, M. Dissolution behavior of nutrition elements from steelmaking slag into seawater. ISIJ In-ternational, vol. 44, pp. 753 – 761 (2004).
97. GaBi 4&5 LCA/LCE Software: PE Inter-national. Available from: www.pe-inter-national.com (1989 – 2012) (accessed December 7th, 2012).

296
Metal Recycling – Opportunities, Limits, Infrastructure
98. Gautier M., Poirier J., Franceschini G., Bodénan F. Influence of the cooling con-ditions on the nature and the size of the mineral phase in a BOF slag. WASCON Proceedings, Lyon (2009).
99. García-Serna, J., Pérez-Barrigón, L., Cocero, M.J. New trends for design towards sustainability in chemical engi-neering: Green engineering. Chemical Engineering Journal, vol. 133, pp. 7 – 30 (2007).
100. Geldermann, J., Treitz, M., Rentz, O. Integrated technique assessment based on the pinch analysis approach for the design of production networks. Euro-pean Journal of Operational Research, vol. 171, pp. 1020 – 1032 (2006).
101. Global Steel Dust. Available from: www.globalsteeldust.com/steel_dust_recy-cling (accessed December 8th, 2012).
102. Gmünder, S. Recycling – from waste to resource: assessment of optimal man-ual dismantling depth of a desktop PC in China based on eco-efficiency calcu-lations. Master Thesis: Swiss Federal Institute of Technology (ETH) and Swiss Federal Laboratories for Materials Sci-ence and Technology (EMPA), Zurich/St. Gallen Switzerland (2007).
103. Goede, M., Stehlin, M., Rafflenbeul, L., Kopp, G., Beeh, E. Super Light Car-lightweight construction thanks to a multi-material design and function in-tegration. European Transport Reseach Review, vol. 1, pp. 5 – 10 (2008).
104. Goedkoop M, Spriensma R. The Eco-indicator 99: a damage oriented method for life cycle impact assessment. Con-sultants Amersfoort, P. The Nether-lands. 2000. Available from: http://www.pre-sustainability.com/download/misc/EI99_methodology_v3.pdf (accessed December 8th, 2012).
105. Goosey, M., Kellner, R. A scoping study. End of life printed circuit boards. Sup-ported by Department of Trade and Industry Intellect Shipley Europe Lim-ited (2002).
106. Goosey, M., Kellner, R. Recycling tech-nologies for the treatment of end of life printed circuit boards (PCBs). Circuit World, vol. 29/3, pp. 33 – 37 (2003).
107. Gößling, S. Entropy production as a measure for resource use: Method development and application to met-allurgical processes. Dissertation, Hamburg (2001). Available from: http://www.sub.uni-hamburg.de/opus/voll-texte/2004/1182/ (accessed December 7th, 2012).
108. Gößling-Reisemann, S. What Is Re-source Consumption and How Can It Be Measured? Theoretical considerations. Journal of Industrial Ecology, vol. 12(1), pp. 10 – 25 (2008a).
109. Gößling-Reisemann, S.: What Is Re-source Consumption and How Can It Be Measured? Application of Entropy Analy-sis to Copper Production. Journal of In-dustrial Ecology, vol. 12(4), pp. 570 – 582 (2008b).
110. Gößling-Reisemann, S. Entropy analy-sis of metal production and recycling. Management of Environmental Quality, vol. 19(4), pp. 487 – 492 (2008c).
111. Gößling-Reisemann, S. Entropy Produc-tion and Resource Consumption in Life Cycle Assessments. Thermodynamics and the Destruction of Resources. Bak-shi, B., Gutowski, T., Sekulic, D., Eds. Cambridge University Press: New York (2011).
297
Metal Recycling – Opportunities, Limits, Infrastructure
112. Gößling-Reisemann, S., von Gleich, A., Knobloch, V., Cebulla, B. Bewertungs-maßstäbe für metallische Stoffströme: von Kritikalität bis Entropie. In Metho-den der Stoffstromanalyse: Konzepte, agentenbasierte Modellierung und Öko-bilanz. Beckenbach, F., Ed. Stoffstroma-nalysen 1; Metropolis: Marburg (2011).
113. Graedel, T.E. On the Future Availability of the Energy Metals, Annual Review of Materials Science, vol. 41, pp. 323 – 335 (2011).
114. Graedel, T.E., Allenby, B.R. Industrial Ecology, 2nd Edition, Upper Saddle River, N.J., Prentice Hall, p. 363 (2003).
115. Grant R.M. Zinc concentrate and pro-cessing trends. World Zinc ’93, ed.: Matthew I.G., the Australasian Institute of Mining and Metallurgy, pp. 391 – 397 (1993).
116. Guinée, JB., Gorrée, M., Heijungs, R., Huppes, G., Kleijn,R., de Koning A, et al. Life cycle assessment. An operational guide to the ISO standards. Part 3: Sci-entific Background. Ministry of Housing SPaEVaCoESC, Den Haag and Leiden, The Netherlands, 2001. Available from: http://media.leidenuniv.nl/legacy/new-dutch-lca-guide-part-3.pdf (accessed March 12th, 2013).
117. Habashi, F. Handbook of Extractive Met-allurgy, III, WILEY-VCH Verlagsgesells-chaft mbH, Weinheim, Deutschland, p. 2426 (1997).
118. Hagelüken, C. Secondary Raw Material Sources for Precious and Special Met-als, R. Sinding-Larsen and F.-W. Wellm-er (eds.), Non-Renewable Resource Issues: Geoscientific and Societal Chal-lenges, International Year of Planet Earth, DOI 10.1007/978-90-481-8679-2_10, Springer Science+Business Media B.V. pp. 195 – 212 (2012).
119. Hagelüken C., Corti, C.W. Recycling of gold from electronics: Cost-effective use through ‘Design for Recycling’, Gold Bulletin, vol. 43(3), pp. 209 – 220 (2010).
120. Hagelüken, C., Meskers, C.E.M. Com-plex lifecycles of precious and special metals. In: Graedel, TE, van der Voet E (eds) Linkages of Sustainability. Strüng-mann Forum Report 4. MIT Press, Cam-bridge, MA pp. 165 – 197 (2010).
121. Hagelüken C., Buchert, M., Ryan, P. Materials flow of platinum group met-als in Germany, International Journal of Sustainable Manufacturing, vol.1(3), pp. 330 – 346 (2009).
122. Hagelüken, C. Recycling of Electronic Scrap at Umicore’s Integrated Met-als Smelter and Refinery. World of Metallurgy – Erzmetall, vol. 59(3), pp. 152 – 161 (2006).
123. Hagelüken, C. Improving metal returns and eco-efficiency in electronics recy-cling – a holistic approach for interface optimisation between pre-processing and integrated metals smelting and refining. In proceedings of the IEEE International Symposium on Electron-ics & the Environment, 8 – 11 May, San Francisco, pp. 218 – 223 (2006).
124. Hagelüken, C., Buchert, M., Stahl, H. Materials Flow of Platinum Group Met-als. Umicore AG & Co. KG and Öko-In-stitut e. V. London: GFMS Limited (2005).
125. Hauschild, M., Wenzel, H. Environmen-tal Assessment of Products. Volume II – Scientific background. London (UK), Weinheim (Germany), New York (USA), Tokyo (Japan), Melburne (Australia), Madras (India): Champan & Hall (1998).

298
Metal Recycling – Opportunities, Limits, Infrastructure
126. Hauschild, M., Potting J. Spatial dif-ferentiation in life cycle impact assess-ment – the EDIP2003 methodology. Environmental News no. 80. The Danish Ministry of the Environment, Environ-mental Protection Agency, Copenhagen, DK (2005).
127. Heiskanen, K. Particle Classification. Chapman & Hall, London, Great Britain. ISBN 0 412 493004 (1993).
128. Hester, R.E. and Harrison, R.M. Elec-tronic Waste Management Design, Analysis and Application. London. Royal Society of Chemistry, ISBN 978-0-85404-112-1 (2008).
129. Hinderink, A.P., Kerkhof, F.P.J.M., Lie, A.B.K., De Swaan Arons, J. de, Van der Kooi, H.J. Exergy analysis with a flowsheeting simulator I. Theory; Cal-culating Exergies of material streams, Chemical Engineering Science, vol. 51(20), pp. 4693 – 4700 (1996)
130. Hischier, R., Wäger, P., Gauglhofer, J. Does WEEE Recycling make sense from an environmental perspective? The environmental impacts of the Swiss take-back and Recycling systems for waste electrical and electronic equip-ment (WEEE). Environmental Impact As-sessment Review, vol. 25, pp. 525 – 539 (2005).
131. Hischier, R., Weidema, B., Althaus, H-J., Doka, G., Dones, R., Frischknecht, R., et al. Implementation of Life Cycle Impact Assessment Methods. Swiss Centre for Life Cycle Inventories, St. Gallen, CH (2010).
132. Hiraki, T. Takeda, O. Nakajima, K. Mat-subae, K. Nakamura, S. and Nagasaka T. Thermodynamic criteria for the re-moval of impurities from end-of-life magnesium alloys by evaporation and flux treatment. Science and Technology of Advanced Materials, vol. 12 (2011).
133. Hoang, J., Reuter, M.A., Matusewicz, R., Hughes, S., Piret, N. Top Submerged Lance Direct Zinc Smelting. Minerals Engineering, vol. 22, pp. 742 – 751 (2009).
134. Hoek van den, W.J., Luijks, G.M.J.F., Hoelen. C.G.H. Lamps. Ullmann’s En-cyclopaedia of Industrial Chemistry, Wiley-VCH Verlag GmbH & Co. KGaA, Weinheim, Germany, p. 53 (2010).
135. Hogland, W., Hogland, M., Marques, M. Enhanced Landfill Mining: Material re-covery, Energy Utilization and Econom-ics in the EU (Directive) perspective. In: Jones, P.T., Tielemans, Y. (ed.) (2011).
136. Hieronymi, K. Is enough focus being given to designing-in recyclability in consumer electronics? Copper Re-cycling Conference, Brussels (11 – 13 June, 2012).
137. Huang, K., Guo, J., Xu Z. Recycling of waste printed circuit boards: A review of current technologies and treatment status in China. Journal of Hazardous Materials, vol. 164, pp. 399 – 408 (2009).
138. Huda, N., Naser, J., Brooks, G., Reuter, M.A., Matusewicz, R.W. Computational Fluid Dynamic Modeling of Zinc Slag Fuming Process in Top-Submerged Lance Smelting Furnace. Metallurgical Transactions B, vol. 43B(1), pp. 39 – 55 (2012).
139. HSC Chemistry 7 (1974 – 2011). Available from: http://www.outotec.com (accessed December 7th, 2012).
140. International Aluminium Institute, Im-proving Sustainability in the Transport Sector Through Weight Reduction and the Application of Aluminium. Available from: http://www.worldaluminium.org/media/filer/2012/06/12/fl0000307.pdf (accessed December 7th, 2012).
299
Metal Recycling – Opportunities, Limits, Infrastructure
141. IChemE. The Sustainability Metrics: Sustainable Development Metrics, Insti-tution of Chemical Engineers (IChemE), p. 29 (2001).
142. Ignatenko, O., Van Schaik, A., Reuter, M.A. Recycling system flexibility: the fundamental solution to achieve high energy and material recovery quotas, Journal of Cleaner Production, vol. 16, pp. 432 – 449 (2008).
143. Ignatenko, O., Van Schaik, A., Reuter, M.A. Exergy as a tool for evaluation of the resource efficiency of Recycling systems. Minerals Engineering, vol. 20, pp. 862 – 874 (2007).
144. Indaver (2011). Available from: www.indaver.com (accessed December 7th, 2012).
145. International Chrome Development Organization. Available from: http://www.icdacr.com (accessed December 7th, 2012).
146. International Zinc Association, Reuter, M.A. et al. Zinc College, Course Notes, International Zinc Association, ISBN 90-805644-5-1 (2001, 2002). Available from: http://www.zinc.org (accessed Decem-ber 7th, 2012).
147. IP.com, “Method for the mixed recycling of lithium-based anode batteries and cells” (2007). Available from: http://ip.com/patapp/US20070196725 (ac-cessed December 7th, 2012).
148. IPCC. IPCC Climate Change Fourth Assessment Report: Climate Change: Intergovernmental Panel on Climate Change (2007). Available from: http://www.ipcc.ch/ipccreports/assessments-reports.htm (accessed December 7th, 2012).
149. ISO. Environmental Management – Life Cycle Assessment – Principles and Framework. International Standardiza-tion Organization (ISO), European Stand-ard EN ISO 14040, Geneva (Switzerland) (2006a).
150. ISO. Environmental Management – Life Cycle Assessment – Requirements and Guidelines. International Standardisa-tion Organisation (ISO), European Stand-ard EN ISO 14044, Geneva (Switzerland) (2006b).
151. James, S.E. Recycling of zinc, Course Notes from Short Course presented before 4th International Symposium on Recycling of Metals and Engineered Materials, TMS (October, 2000).
152. Jahanshahi, S., Xie, D., Pan, Y., Ridge-way, P., Mathieson, J. Dry slag granu-lation with integrated heat recovery, Proceedings METEC, InSteelCon, Düs-seldorf, 27th June – 1st July 2011, p. 7 (2011).
153. Jeswani, H.K., Azapagic, A., Sche-pelmann, P., Ritthoff, M. Options for broadening and deepening the LCA approaches. Journal of Cleaner Produc-tion, vol. 18, pp. 120 – 127 (2010).
154. Johnson-Matthey, PLATINUM 2011, p. 64 (2011). Avalable from: http://www.platinum.matthey.com/publica-tions/pgm-market-reviews/archive/platinum-2011 (accessed December 7th, 2012).
155. Johnson, J., Reck, B.K., Wang, T., Graedel, T.E. The Energy Benefit of Stainless Steel Recycling. Energy Policy, vol. 36, pp. 181 – 192 (2008).
156. Jones, P.T., De Meyere, V. Terra re-versa, de transitie naar rechtvaardige duurzaamheid, EPO/Jan Van Arkel, Berchem-Antwerpen, p. 359 (2009).

300
Metal Recycling – Opportunities, Limits, Infrastructure
157. Jones, P.T. Landfill Mining: history and current status overview. In: Proceedings of the Global Landfill Mining Conference 2008 (1.1 – 1.4. 2008).
158. Jones, P.T., Geysen, D., Tielemans, S., Van Passel, S., Pontikes, Y., Blanpain, B., Quaghebeur, M., Hoekstra, N. En-hanced Landfill Mining in view of multi-ple resource recovery: a critical review, Journal of Cleaner Production (In Press, 2012).
159. Keller, M. Assessment of gold recovery processes in Bangalore, India and eval-uation of an alternative recycling path for printed wiring boards, a case study. Master Thesis, Swiss Federal Institute of Technology (ETH) and Swiss Federal Laboratories for Materials Science and Technology (EMPA), Zurich/St.Gallen Switzerland (2006).
160. Kepplinger, W.L. Actual state of smelt-ing-reduction processes in iron making. Stahl und Eisen, vol. 129(7), pp. 43 – 51 (2009).
161. Kim H.J., Kernbaum S., Seliger, G. Emulation-based control of a disassem-bly system for LCD monitors. The Inter-national Journal of Advanced Manufac-turing Technology, vol. 40, pp. 383 – 392 (2009).
162. King, R.P. Modeling & Simulation of Mineral Processing Systems. Butter-worth-Heinemann publications, Oxford, Great Britain. ISBN 0-7506-4884-8, p. 403 (2001).
163. Klauber, C., Gräfe, M., Power, G. Bauxite residue issues: I. Current management, disposal and storage practices. Hydro-metallurgy, vol. 108, pp. 33 – 45 (2011a).
164. Klauber, C., Gräfe, M., Power, G. Bauxite residue issues: II. Options for residue utilization. Hydrometallurgy, vol. 108, pp. 11 – 32 (2011b).
165. Kondepudi, D., Prigogine, I. Modern thermodynamics: From heat engines to dissipative structures. Chichester, Wiley (1998).
166. Krinke, S., van Schaik, A. Reuter, M.A. Stichling, J. Recycling and DfR of multi-material vehicles (as part of ‘Life cycle assessment and Recycling of innova-tive multimaterial applications’). In: Proceedings of the International Con-ference ‘Innovative Developments for Lightweight Vehicle Structures’. May, 26 – 27th 2009, Wolfsburg, Germany (Volkswagen Head Office), pp. 196 – 208, ISBN 978-3-00-027891-4 (2009).
167. Kubo, H. Matsubae-Yokoyama, K. and Nagasaka, T., Magnetic separation of phosphorus enriched phase from mul-tiphase dephosphorization slag. ISIJ International, vol. 50, pp. 59 – 64 (2010).
168. Kuo, T.C. The construction of a collabo-rative-design platform to support waste electrical and electronic equipment Recycling. Robotics and Computer-Integrated Manufacturing, vol. 26, pp. 100 – 108 (2010).
169. Krüger, J., Reuter, M.A. Kögler, C., Probst, T. Electrothermal Reactors, Ullmann's Encyclopaedia of Industrial Chemistry, Wiley-VCH Verlag GmbH & Co. KGaA, Weinheim, Germany (2005). (also consult chapters on all metals discussed in this document).
170. Lassner, E. and Schubert, W.-D. Tung-sten: Properties, Chemistry, Technology of the Element, Alloys, and Chemical Compounds, Kluwer Academic/Plenum Publishers,New York, p. 422 (1999).
171. Li J., Gao S., Duan H., Liu L. Recovery of valuable materials from waste liquid crystal display panel. Waste Manage-ment, vol. 29, pp. 2033 – 2039 (2009).

301
Metal Recycling – Opportunities, Limits, Infrastructure
172. Lidgren, K. The economics of recy-cling – matter of life or death for the recovery sector in the 1980s and 1990s. Resources and Conservation, vol. 12, pp. 175 – 192 (1986).
173. London Metal Exchange. Available from: http://www.lme.com (accessed Decem-ber 7th, 2012).
174. Luidold, S. Process and product devel-opments for niobium, tantalum, molyb-denum and tungsten. World of Metallur-gy – Erzmetall, vol. 62, pp. 91 – 99 (2009).
175. Luidold, S., Antrekowitsch, H. Red mud – hazardous waste or valuable raw material? In: Proceedings of EMC 2011, pp. 853 – 864 (2011).
176. Lupis, C.H.P., Chemical Thermodynam-ics of Materials, North Holland, New York, p. 134 (1983)
177. Lynas Corporation Ltd. Rare Earths – We touch them every day. Investor presentation, May 2011. Available from: http://www.lynascorp.com/content/up-load/files/Presentations/Investor_Pres-entation_May_2011.pdf (accessed De-cember 7th, 2012).
178. Manley, J.B., Anastas, P.T., Cue Jr., B.W. Frontiers in Green Chemistry: Meeting the grand challenges for sustainability in R&D and manufacturing. Journal of Cleaner Production, vol. 16, pp. 743 – 750 (2008).
179. Mäkelä, M. The Complexity of Mobile Phone Recycling, Developing user oriented design guidelines and future concepts for mobile phone Recycling, School of Art and Design, Aalto Univer-sity, Helsinki (2011).
180. Matusewicz, R, Reuter, M.A. The role of Ausmelt’s TSL in Recycling and clos-ing the material loop. Proceedings REWAS2008, Cancun, Mexico, Ed. B. Mishra, C. Ludwig and S. Das, The Min-erals, Metals & Materials Society (TMS) Warrendale, Pennsylvania, pp. 951 – 962, ISBN 978-0-87339-726-1 (2008).
181. Matlab. 1984 – 2011: The Language of Technical Computing, The MathWorks, Inc. Available from: http://www.math-works.com (accessed December 7th, 2012).
182. Mathieux, F., Froelich, D., Moszkowicz, P. ReSICLED: A new recovery-conscious design method for complex products based on a multi-criteria assessment of the recoverability, Journal of Cleaner Production, vol. 16, pp. 277 – 298 (2008).
183. Matsubae-Yokoyama, K. Kubo, H. Na-kajima, K. and Nagasaka, T., A material flow analysis of phosphorus in Japan – The iron and steel industry as a major source. Journal of Industrial Ecology, vol. 13, pp. 687 – 705 (2009).
184. Matsubae-Yokoyama, K., Kubo, H., and Nagasaka. T., Recycling Effects of Residual Slag after Magnetic Separa-tion for Phosphorus Recovery from Hot Metal Dephosphorization Slag. ISIJ International, vol. 50, pp. 65 – 70 (2010).
185. May, G. The Evolution of the Lead/Acid Battery Market and the Effect of Chang-es in Automotive Technology on Battery Design, FOCUS Consulting, Internation-al Lead Zinc Study Group, Presentation, Lisbon (September 2011). Available from http://www.ilzsg.org/generic/pages/list.aspx?table=document&ff_aa_docu-ment_type=P&from=1 (accessed De-cember 7th, 2012).
302
Metal Recycling – Opportunities, Limits, Infrastructure
186. McGill, I. Rare Earth Elements, Ul-lmann’s Encyclopedia of Industrial Chemistry, Wiley-VCH Verlag GmbH & Co. KGaA, Weinheim, Germany, p. 46 (2010).
187. Mellor, W., Wright, E., Clift, R., Azapagic, A., Stevens, G. A mathematical model and decision-support framework for material recovery, recycling and cascad-ed use. Chemical Engineering Science, vol. 57, pp. 4697 – 4713 (2002).
188. Meskers, C., Reuter, M.A., Boin, U., Kvi-thyld, A. A fundamental metric for metal Recycling applied to coated magnesium. Metallurgical Transactions B, vol. 39(3), pp. 500 – 517 (2008).
189. Meskers, C.E.M., Hagelüken, C. et al. Impact of pre-processing routes on precious metal recovery from PCs. Proceedings of European Metallurgical Conference EMC (2009).
190. Meskers, C.E.M, Hagelüken, C. Salhofer, S. Spitzbart, M. Impact of pre-process-ing routes on precious metal recovery from PCs. Proceedings of European Metallurgical Conference EMC Inns-bruck (28 June – 1 July 2009).
191. Metal Bulletin, Average values (2010).
192. Meurer, U. Gewinnung von Zinkoxid aus sekundären Rohstoffen – Neue entwick-lungen in Wälzprozess, in: "Intensivie-rung metallurgischer Prozesse", ed.: Liese, F., GDMB, Clausthal-Zellerfeld, Germany, pp. 183 – 196 (2000).
193. Ministry of Environment and Forests of the Government of India (2011). E-Waste (Management and Handling) Rules 2011. Available from: http://moef.nic.in/down-loads/rules-and-regulations/1035e_eng.pdf (accessed December 7th, 2012).
194. Ministry of Commerce of the People’s Republic of China. Circular Economy Promotion Law of the People’s Republic of China (2009). Available from: http://www.fdi.gov.cn/pub/FDI_EN/Laws/Gen-eralLawsandRegulations/BasicLaws/P020080919377641716849.pdf (accessed December 7th, 2012).
195. Müller, T., Friedrich, B. Development of a Recycling process for nickel-metal hydride batteries. Journal of Power Sources, vol. 158, pp. 1498 – 1509 (2006).
196. Münster, M., Lund, H. Comparing Waste-to-Energy technologies by ap-plying energy system analysis. Waste Management, vol. 30(7), pp. 1251 – 1263 (2010).
197. Nakajima, K. Yokoyama, K. and Naga-saka, T., Substance flow analysis of zinc associated with the iron and steel cycle in Japan. ISIJ International, vol. 48, pp. 1478 – 1483 (2008).
198. Nakajima, K. Takeda, O. Miki, T. Na-gasaka, T. Evaluation method of metal resources recyclability based on ther-modynamic analysis. Materials Transac-tions, vol. 50, pp. 453 – 460 (2009).
199. Nakajima, K. Takeda, O. Miki, T. Mat-subae, K., Nagasaka, T. Thermodynamic analysis for the controllability of ele-ments in Recycling process of metals. Environmental Science & Technology, vol. 11, pp. 4929 – 4936 (2011).
200. Nakamura, S. and Nakajima, K. Waste input-output material flow analysis of metals in the Japanese economy, Materials Transactions, vol. 46, pp. 2550 – 2553 (2005).
201. Nakamura, S. Nakajima, K. Kondo, Y. and Nagasaka, T. The waste input-output approach to material flow analy-sis: Concepts and application to base metals. Journal of Industrial Ecology, vol. 11, pp. 50 – 63 (2007).
303
Metal Recycling – Opportunities, Limits, Infrastructure
202. Nakamura, S., Kondo, Y. Input-output analysis of waste management. Journal of Industrial Ecology, vol. 6(1), pp. 39 – 63 (2002).
203. Nakamura, S., Kondo, Y. A waste input-output life-cycle cost analysis of the recycling of end-of-life electrical home appliances. Ecological Economics, vol. 57, pp. 494 – 506 (2006).
204. Nemry, F., Leduc, G., Mongelli, I., Ui-hlein, A. Environmental Improvement of Passenger Cars (IMPRO-car), Joint Research Centre Institute for Prospec-tive Technological Studies JRC 40598 EUR 23038 EN ISBN: 978-92-79-07694-7, p. 216 (2008).
205. Nickel Institute. Available from: http://www.nickelinstitute.org (accessed De-cember 7th, 2012).
206. Nokia. Available from: http://www.nokia.com (accessed December 7th, 2012).
207. Novak, E. Verwertungsmöglichkeiten für ausgewählte Fraktionen aus der Demontage von Elektroaltgeräten – Kunststoffe (Recycling possibilites for selected fractions from dismantling of waste electrical equipment – Plastics). Federal Ministry of Agriculture, Forestry, Environment and Water Management, Vienna, Austria (2001).
208. Ochsenkühn-Petropulu, M. et al. Re-covery of lanthanides and yttrium from red mud by selective leaching. Analytica Chimica Acta, vol. 319, pp. 249 – 254 (1996).
209. OECD, Extended producer responsibil-ity: A guidance manual for governments. Paris/France OECD (2001).
210. D. Schüler et al. Study on Rare Earths and Their Recycling Final Report for The Greens/EFA Group in the European Parliament. Öko-Institut e. V. Darmstadt, Germany, p. 140 (2011).
211. OMG Group. Available from: http://www.omgi.com (accessed December 7th, 2012).
212. Ongondo, F.O., Williams, I.D., Cher-rett, T.J. How are WEEE doing? A global review of the management of electrical and electronic wastes. Waste Manage-ment, vol. 31, pp. 714 – 730 (2011).
213. ORLA project for “Optimizing the re-cycling of solid by-products from steel works” (2008 – 2011) with the financial support of ANR (French Research Agen-cy) under the Precodd 2007 program. BRGM coordinator with ArcelorMit-tal, LERM, CNRS/CEMHTI and CNRS/CEREGE partners (2011). Available from: http://orla.brgm.fr/ (accessed Decem-ber 7th, 2012).
214. Orth, A., Anastasijevic, N., Eichberger, H. Low CO2 emission technologies for iron and steelmaking as well as titania slag production. Minerals Engineering, vol. 20, pp. 854 – 861 (2007).
215. Owada, S. Tsuchiya, K. Takasugi, A. Kato, Y. Funakoshi, T. and Tanno, H. XRT and XRF sorting for the mutual separa-tion of aluminum alloys to achieve “sash to sash” Recycling, Proceedings of the 11th International Symposium on East Asian Resources Recycling Technology (EARTH2011), Plenary Lecture, Kaohsi-ung, Taiwan (November 1, 2011).
216. Outotec. Available from: http://www.outotec.com. (accessed December 7th, 2012).
217. PE-International. Available from: http://www.pe-international.com (accessed December 7th, 2012).
218. Pietrelli, L. et al. Rare earths recovery from NiMH spent batteries. Hydrometal-lurgy, vol. 66, pp. 135 – 139 (2002).

304
Metal Recycling – Opportunities, Limits, Infrastructure
219. Pimentel, D. Food Production and the Energy Crisis, Science, vol. 182, pp. 443 – 449 (1973).
220. Piret, N.Iron Stabilization by Pyrometal-lurgical Treatment, 3rd International Symposium on Iron Control in Hydro-metallurgy, Short Course, Montreal (2006).
221. Plastics Europe. Available from: http://www.plasticseurope.org (accessed De-cember 7th, 2012).
222. Prechthai, T., Padmasri, M., Visvana-than, C. Quality assessment of mined MSW from an open dumpsite for recy-cling potential. Resources, Conservation and Recycling, vol. 53, pp. 70 – 78 (2008).
223. Pruvost, P. Potential for increased alu-minium recovery from bottom ashes in Europe, CEWEP-EAA Seminar Copenha-gen (September 5 – 6, 2011).
224. Rabah, M.A. Recovery of aluminium, nickel-copper alloys and salts from spent fluorescent lamps. Waste Man-agement, vol. 24, pp. 119 – 126 (2004).
225. Rabah, M.A. Recyclables recovery of europium and yttrium metals and some salts from spent fluorescent lamps. Waste Management, vol. 28, pp. 318 – 325 (2008).
226. Rebitzer, G. Life cycle assessment Part 1: Framework, goal and scope defini-tion, inventory analysis, and applica-tions. Environment International, vol. 30, pp. 701 – 720 (2004).
227. RECHARGE aisbl, The European Asso-ciation for Rechargeable Batteries, 168, Ave de Tervueren, box3. B-1150 Brussels, Belgium. www.rechargebatteries.org
228. Rechberger, H. Entwicklung einer Me-thode zur Bewertung von Stoffbilanzen in der Abfallwirtschaft, 1999. Wien: Technische Universität, Institute für Wassergüte und Abfallwirtschaft (Wie-ner Mitteilungen, 158).
229. Rechberger H., Brunner, P.H. A New, Entropy based method to support waste and resource management decisions. Environmental Science and Technology, vol. 36, pp. 809 – 816 (2002).
230. Rechberger, H, Brunner, P. H. Die Meth-ode der Stoffkonzentrierungseffizienz (SKE) zur Bewertung von Stoffbilanzen in der Abfallwirtschaft, 2008. In: Hösel, G., Bilitewski, B., Schenkel, W., Schnur-er, H. (Hg.): Müllhandbuch. Berlin: Erich Schmidt Verlag, 8506.1, pp. 1 – 18 (5/2002).
231. Reuter, M.A., Heiskanen, K., Boin, U., Van Schaik, A., Verhoef, E., Yang, Y. The Metrics of Material and Metal Ecology, Harmonizing the resource, technology and environmental cycles, Elsevier BV, Amsterdam, p. 706, ISBN: 13 978-0-444-51137-9 (2005).
232. Reuter, M.A. Limits of Design for Re-cycling and “Sustainability”: A review. Waste and Biomass Valorisation, vol. 2, pp. 183 – 208 (2011).
233. Reuter, M.A. The simulation of indus-trial ecosystems. Minerals Engineering, vol. 11(10), pp. 891 – 917 (1998).
234. Reuter, M.A., Van Schaik, A., Ignatenko, O. Fundamental limits for the Recycling of end-of-life vehicles. Minerals Engi-neering, vol. 19(5), pp. 433 – 449 (2006).
235. Reuter, M.A., Van Schaik, A. Thermo-dynamic Metrics for Measuring the “Sustainability” of Design for Recycling. Journal of Metals, vol. 60(8), pp. 39 – 46 (2008).

305
Metal Recycling – Opportunities, Limits, Infrastructure
236. Reuter, M.A. The Niche of Metallurgy in Design for “Recycling”. World of Metallurgy – ERZMETALL, vol. 62(5), pp. 276 – 287 (2009).
237. Reuter, M.A., Van Schaik, A. Material and metal ecology, Encyclopedia of Ecology (Editors-in-Chief: Sven Erik Jorgensen and Brian D. Fath), 1st Edition, Elsevier, BV, Oxford, pp. 2247 – 2260 (2008).
238. Reuter, M.A., Matusewicz, R., Hughes, S., Wood, J. Secondary copper pro-cessing using Outotec’s Ausmelt TSL process. Plenary Lecture, International Conference, Copper Metallurgy, 50th Anniversary of KGHM, Poland (2011).
239. Reuter, M.A. The simulation of indus-trial ecosystems. Minerals Engineering, vol. 11(10), pp. 891 – 917 (1999).
240. Reuter, M.A., Van Schaik A. Opportuni-ties and Limits of recycling – A Dynam-ic-Model-Based Analysis. MRS Bulletin, vol. 37(4), pp. 339 – 347 (special edition on Sustainability) (2012a).
241. Reuter, M.A., Van Schaik A. Opportuni-ties and Limits of WEEE Recycling – Recommendations to Product Design from a Recyclers Perspective. Proceed-ings for Electronics Goes Green 2012, Eds. Klaus-Dieter Lang, Nils F. Nissen, Andreas Middendorf, Perrine Chancerel, Berlin, Fraunhofer Institute for Reli-ability and Microintegration IZM, Berlin Technische Universität Berlin, Research Center for Microperipheric Technologies Paper A.5.3 (2012b).
242. Rhodia. Available from: http://www.rho-dia.com (accessed December 7th, 2012).
243. Richard, A., van Schaik, A., Reuter, M.A. A comparison of the modelling and liberation in minerals processing and shredding of passenger vehicles. EPD Congress 2005, Edited by M.E. Schles-inger TMS (The Minerals, Metals & Ma-terials Society), pp. 1039 – 1052 (2005).
244. Robinson, B.H. E-waste: An assessment of global production and environmental impacts. Science of the Total Environ-ment, vol. 408, pp. 183 – 191 (2009).
245. Rombach E. et al. Altbatterien als sekundäre Rohstoffressource fur die Metallgewinnung. World of Metallurgy – Erzmetall, vol. 61(3), pp. 180 – 185 (2008).
246. Rosenbaum, R.K., Bachmann, T.M., Gold, L.S., Huijbregts, M.A.J., Jolliet, O., Juraske, R., Köhler, A., Larsen, H.F., MacLeod, M., Margni, M., McKone, T.E., Payet, J., Schuhmacher, M., van de Meent D., Hauschild, M.Z. USEtox – The UNEP-SETAC toxicity model: recom-mended characterization factors for hu-man toxicity and freshwater ecotoxicity in Life Cycle Impact Assessment. Inter-national Journal of Life Cycle Assess-ment, vol. 13, pp. 532 – 546 (2008).
247. Ruhrberg, M. Assessing the recycling efficiency of copper from end-of-life products in Western Europe. Resources, Conservation and Recycling, vol. 48, pp. 141 – 165 (2006).
248. Salhofer, S., Spitzbart, M., Maurer, K. Recycling of LCD Screens in Europe – State of the Art and Challenges, Pro-ceedings: J. Hesselbach and C. Her-rmann (eds.), Glocalized Solutions for Sustainability in Manufacturing: Pro-ceedings of the 18th CIRP International Conference on Life Cycle Engineering, Technische Universität Braunschweig, Braunschweig, Germany, May 2nd – 4th, 2011, DOI 10.1007/978-3-642-19692-8_78, Springer-Verlag Berlin Heidelberg (2011).

306
Metal Recycling – Opportunities, Limits, Infrastructure
249. Sander, K., Schilling, S. Optimierung der Steuerung und Kontrolle grenzüber-schreitender Stoffströme bei Elek-troaltgeräten/Elektroschrott. Hamburg: Ökopol (2010). Available from: http://www.umweltdaten.de/publikationen/fpdf-l/3769.pdf (accessed December 7th, 2012).
250. Sayilgan, E., Kukrer, T., Civelekoglu, G., Ferella, F., Akcil, A., Veglio, F., Kitis, M. A review of technologies for the recov-ery of metals from spent alkaline and zinc-carbon batteries, Hydrometallurgy, vol. 97, pp. 158 – 166 (2009).
251. Saurat, M., Bringezu, S. Platinum group metal flows of Europe, part 1: Global supply, use in industry and shift-ing of environmental impacts. Jour-nal of Industrial Ecology, vol. 12(5/6), pp. 754 – 767 (2008).
252. Van Schaik, A., Reuter, M.A., Boin, U., Dalmijn, W.L. Dynamic modelling and optimization of the resource cycle of passenger vehicles. Minerals Engineer-ing, vol. 15(11), pp. 1001 – 1016 (2002).
253. Van Schaik A., Reuter, M.A. The time-varying factors influencing the Re-cycling rate of products. Resources, Conservation and Recycling, vol. 40(4), pp. 301 – 328 (2004a).
254. Van Schaik, A., Reuter, M.A. The effect of design on Recycling rates for cars – Theory and practice. Proceedings of the International Automobile Recycling Congress, Geneva, Switzerland, March 10 – 13, 2004, p. 21 (2004b).
255. Van Schaik, A., Reuter, M.A., Heiskanen, K. The influence of particle size reduc-tion and liberation on the Recycling rate of end-of-life vehicles. Minerals Engi-neering, vol. 17, pp. 331 – 347 (2004).
256. Van Schaik A., Reuter, M.A. The use of fuzzy rule models to link automotive de-sign to Recycling rate calculation. Min-erals Engineering, vol. 20, pp. 875 – 890 (2007a).
257. Van Schaik, A., Reuter, M.A. Calculating the Recyclability, Product Design is the Key to High Recycling Rates. Recycling Magazine, vol. 12, pp. 14 – 17. Internet version of Recycling Magazine published by Reed. Available from: http://www.Recycling-magazine.com (accessed December 7th, 2012) (2007b).
258. Van Schaik A., Reuter, M.A. Dynamic modelling of E-waste Recycling sys-tem performance based on product design. Minerals Engineering, vol. 23, pp. 192 – 210 (2010a).
259. Van Schaik, A., Reuter, M.A., Van Stok-kom, H., Jonk, J., Witter, V. Manage-ment of the Web of Water and Web of Materials. Minerals Engineering, vol. 23, pp. 157 – 174 (2010b).
260. Van Schaik, A., Reuter, M.A. Shredding, sorting and recovery of metals from WEEE: linking design to resource ef-ficiency, In: Waste electrical and elec-tronic equipment (WEEE) handbook (Edited by V Goodship, University of War-wick, UK and A Stevels, Delft University of Technology, The Netherlands). Avail-able from: http://www.woodheadpub-lishing.com/en/book.aspx?bookID=2385 (accessed December 7th, 2012) (2012).
261. Van Schaik, A. Kwantificering kritische grondstoffen in E-waste producten (in commission of Vereniging NVMP). 51p, 2011. Available from: http://www.producenten-verantwoordelijkheid.nl (accessed December 7th, 2012).
262. Schaik, A. van, Reuter, M.A. Modell-haftes Recycling. Recycling Magazine, vol. 04, pp. 26 – 29 (2009).
307
Metal Recycling – Opportunities, Limits, Infrastructure
263. Schneider, W.D., Romberg, T., Schwab, B. Recycling von Zn-Pb-haltigen Rest-stoffen. Die notwendige Weiterentwick-lung des IS-Prozesses, in: "Intensivie-rung metallurgischer Prozesse", ed.: Liese, F., GDMB, Clausthal-Zellerfeld, Germany, pp. 171 – 182 (2000).
264. Schweiz. Bundesrat. Ordinance of 14 January 1998 on the return, the tak-ing back and the disposal of electrical and electronic equipment (ORDEE) (2004). Available from: http://www.bafu.admin.ch/abfall/01472/01478/index.html?lang=en (accessed December 7th, 2012).
265. Sepúlveda, A, Schluep, M, Renaud, F.G., Streicher, M., Kuehr, R., Hagelüken, C., Gerecke, A.C. A Review of the environ-mental fate and effects of hazardous substances released from electrical and electronic equipments during recycling: Examples from China and India. Envi-ronmental Impact Assessment Review, vol. 30, pp. 28 – 41 (2010).
266. Seppälä, J., Posch, M., Johansson, M., Hettelingh, J-P. Country-dependent Characterisation Factors for Acidifi-cation and Terrestrial Eutrophication Based on Accumulated Exceedance as an Impact Category Indicator. Interna-tional Journal of Life Cycle Assessment, vol. 11, pp. 403 – 416 (2006).
267. Singhal, P. Shaping consumers’ behav-ior for responsible Recycling in India. Proceedings of Going Green Care Inno-vation, Vienna (November, 2010).
268. Sinha-Khetriwal, D., Kraeuchi P., Schwaninger M. A Comparison of elec-tronic waste recycling in Switzerland and in India. Environmental Impact As-sessment Review, vol. 25, pp. 492 – 504 (2005).
269. Sinha-Khetriwal, D., Widmer, R., Schluep, M., Eugster, M., Wang, Xuejun, Lombard, R., Ecroignard, L. Legislat-ing e-waste management: Progress from various countries. Environmental Law Network International, vol. 1+2/06, pp. 27 – 36 (2006).
270. Sinha-Khetriwal, D., Kraeuchi, P., Wid-mer, R. Producer responsibility for e-waste management: Key issues for consideration – Learning from the Swiss experience. Journal of Environmental Management, vol. 90(1), pp. 153 – 165 (2009).
271. Skinner, A., Dinter, Y., Lloyd, A., Stroth-mann, P. The Challenges of E-Waste Management in India: Can India draw lessons from the EU and the USA? The Journal of Contemporary Asia, 117, pp. 7 – 26. (2010).
272. SLC – SuperLightCar, 6th framework EU project. Available from: http://www.superlightcar.com (accessed Decem-ber 7th, 2012). Project leader Volkswa-gen (2005 – 2009). Project brochure available from: http://www.superlight-car.com/public/docs/SuperLIGHTCar_project_brochure.pdf (accessed Decem-ber 7th, 2012).
273. SMS-Siemag. Available from: http://www.sms-siemag.com (accessed De-cember 7th, 2012).
274. UNEP. Life Cycle Management: A Busi-ness Guide to Sustainability, ISBN 978 – 92-807-2772-2, p. 52 (2007).
275. Balkau, F., Sonnemann G. Managing sustainability performance through the value-chain. Corporate Governance, vol. 10(1), p. 46 (2010).

308
Metal Recycling – Opportunities, Limits, Infrastructure
276. Stamp, A., Meskers, C.E.M., Reimer, M., Wäger, P., Althaus, H.-J., Scholz, R.W. Challenges for LCAs of Complex Systems: The Case of a Large-Scale Precious Metal Refinery Plant, in: Fink-beiner, M., (Ed.). Towards Life Cycle Sustainability Management. Springer Netherlands, pp. 247 – 258 (2011).
277. Stehlik, P. Contribution to advances in waste-to-energy technologies. Jour-nal of Cleaner Production, vol. 17, pp. 919 – 931 (2009).
278. Szargut, J. Exergy method. Technical and Ecological Applications, WitPress, Southampton, Boston, p. 192 (2005).
279. Tam, V.W.Y., Tam, C.M. A review on the viable technology for construction waste recycling. Resource Conservation Recy-cling, vol. 47, pp. 209 – 221 (2006).
280. Tanskanen, P. Takala, R. A decom-position of the End of Life process. Journal of Cleaner Production, vol. 14, pp. 15 – 16, (2006).
281. Titech. Available from: http://www.titech.com (accessed December 7th, 2012).
282. Toxco. 2003. Available from: http://www.toxco.com/processes.html (accessed December 7th, 2012).
283. Toyota Tsusho Corporation, Toyota Tsusho Promotes Plan for Construc-tion of Rare Earth Manufacturing Plant in India (2010). Available from: http://www.toyotatsusho.com/english/press/2010/12/20101208-3590.html (accessed December 7th, 2012).
284. Truttmann, N. Rechberger, H. Contribu-tion to resource conservation by reuse of electrical and electronic household ap-pliances. Resources, Conservation and Recycling, vol. 48, pp. 249 – 262 (2006).
285. Tuncuk, A., Stazi, V., Akcil, A., Yazici, E.Y., Deveci, H. Aqueous metal recovery techniques from e-scrap: Hydrometal-lurgy in recycling. Minerals Engineering, vol. 25, pp. 28 – 37 (2012).
286. Ullmann's Encyclopedia of Industrial Chemistry, Numerous Metal/Element/Compound/Alloy/Materials Chapters in Wiley-VCH Verlag GmbH & Co. KGaA, Weinheim, Germany (2005).
287. Umicore/Rhodia: Press release. CP-2011-18-R Umicore and Rhodia develop unique rare earth Recycling process for rechargeable batteries. 16th June 2011 (2011). Available from: http://www.rhodia.com/en/news_center/news_re-leases/Umicore_rare_earth_160611.tcm (accessed December 7th, 2012).
288. Umicore. Umicore Technology. Brochure (May 2010). Available from: http://www.batteryrecycling.umicore.com/UBR/pro-cess (accessed December 7th, 2012).
289. Umicore, Belgium. Available from: http://www.umicore.com (accessed December 7th, 2012).
290. UNEP. StEP Report: Recycling – From E-waste to Resources. Berlin, Germany, p. 120 (2009). Available from: http://www.unep.org and www.step-initiative.org (accessed 6th December 2012).
291. UNEP. Towards a Green Economy: Path-ways to Sustainable Development and Poverty Eradication, ISBN: 978-92-807-3143-9 (2011). Available from: http://www.unep.org/greeneconomy (accessed December 7th, 2012).
292. UNEP. Decoupling natural resource use and environmental impacts from eco-nomic growth, A Report of the Working Group on Decoupling to the Internation-al Resource Panel. Fischer-Kowalski, M., Swilling, M., von Weizsäcker, E.U.,
309
Metal Recycling – Opportunities, Limits, Infrastructure
Ren, Y., Moriguchi, Y., Crane, W., Kraus-mann, F., Eisenmenger, N., Giljum, S., Hennicke, P., Romero Lankao, P., Sir-iban Manalang, A., Sewerin, S. (2011a).
293. UNEP. Assessing the Environmental Impacts of Consumption and Produc-tion: Priority Products and Materials, A Report of the Working Group on the Environmental Impacts of Products and Materials to the International Panel for Sustainable Resource Management. Hertwich, E., van der Voet, E., Suh, S., Tukker, A, Huijbregts M., Kazmierczyk, P., Lenzen, M., McNeely, J., Moriguchi, Y. (2010).
294. UNEP. Recycling Rates of Metals – A status report, A report of the Working Group on the Global Metal Flows to the International Resource Panel, Graedel, T.E., Alwood, J., Birat, J.-P., Reck, B.K., Sibley, S.F., Sonnemann, G., Buchert, M., Hagelüken, C., 2011b. Available from: http://www.unep.org/resource-panel/Portals/24102/PDFs/Metals_Re-cycling_Rates_110412-1.pdf (accessed December 7th, 2012).
295. U.S. Geological Survey (USGS). Rare Earth Elements—Critical Resources for High Technology, USGS Fact Sheet 087-02 (2002). Available from: http://www.usgs.gov (accessed December 7th, 2012).
296. U.S. Geological Survey (USGS). The Principal Rare Earth Elements Deposits of the United States—A Summary of Domestic Deposits and a Global Per-spective Scientific Investigations Report 2010. 5220 U.S. Department of the Interior U.S. Geological Survey. Reston, Virginia, p. 104. Available from: http://www.usgs.gov (accessed December 7th, 2012).
297. U.S. Geological Survey, Mineral com-modity Summaries, Yttrium (2010b). Available from: http://www.usgs.gov (accessed December 7th, 2012).
298. U.S. Geological Survey, Mineral com-modity summaries. U.S. Geological Survey, p. 193 (2010c). Available from: http://minerals.usgs.gov/minerals/pubs/mcs/. (accessed December 7th, 2012).
299. U.S. Geological Survey. Historical Statis-tics for Mineral and Material Commodi-ties in the United States (2011). Avail-able from: http://minerals.usgs.gov/ds/2005/140/#data (accessed December 7th, 2012).
300. Van der Zee, D.J., Achterkamp, M.C., de Visser, B.J. Assessing the Market Opportunities of Landfill Mining. Waste Management, vol. 24(8), pp. 795 – 804 (2004).
301. Fthenakis, V.M. End-of-life management and Recycling of PV modules, Energy Policy, vol. 28, pp. 1051 – 1058 (2000).
302. Veenstra, A., Wang, C., Fan, W. and Ru, Y. An analysis of E-waste flows in China. International Journal of Advanced Manufacturing Technology, vol. 47(5 – 8), pp. 449 – 459 (2010).
303. Venkateswaran, S. et al. W-Scrap Recy-cling by the Melt Bath Technique. Inter-national Journal of Refractory Metals & Hard Materials, vol. 14, pp. 263 – 270 (1996).
304. Vermeulen, I., et al. Automotive shred-der residue (ASR): Reviewing its pro-duction from end-of-life vehicles (ELVs) and its Recycling, energy or chemicals’ valorization. Journal of Hazardous Ma-terials, vol. 190, pp. 8 – 27 (2011).
305. Verhoef, E., Dijkema, G., Reuter, M.A. Process knowledge, system dynamics and metal ecology. Journal of Industrial Ecology, vol. 8(1 – 2), pp. 23 – 43 (2004).
306. Volkswagen. Available from: http://www.volkswagen.com (accessed December 7th, 2012).

310
Metal Recycling – Opportunities, Limits, Infrastructure
307. Voss, R. What new challenges confront the merchant and recycler today? Cop-per Recycling Conference, Brussels (11 – 13 June 2012).
308. Wäger, P.A., Hischier, R. Eugster, M. Environmental impacts of the Swiss collection and recovery systems for Waste Electrical and Electronic Equip-ment (WEEE): A follow-up. Science of the Total Environment, vol. 409, pp. 1746 – 1756 (2011).
309. World Business Council of Sustainable Development WBCSD. Available from: http://www.wbcsd.org (accessed De-cember 7th, 2012).
310. Wecycle, Nederland (2011). Available from: http://www.wecycle.nl (accessed December 7th, 2012).
311. Von Weizsäcker, E.U., Hargroves, K., Smith, M.H., Desha, C., Stasinopoulos, P. Factor Five – Transforming the Global Economy through 80 % Improvements in Resource Productivity, Earthscan, p. 448 (2009).
312. Welz,T., Hischier, R., Hilty, L.M. Environ-mental impacts of lighting technologies – Life cycle assessment and sensitivity analysis. Environmental Impact As-sessment Review, vol. 31, pp. 334 – 343 (2011).
313. Widmer, R., Schluep, M., Denzler, S. The Swiss Global e-Waste Programme. Waste Management Conference (Waste-Con2008). Durban, South Africa (2008).
314. Widmer, R., Oswald-Krapf, H., Sinha-Khetriwal, D., Schnellmann, M., Böni, H. Global Perspectives on e-waste. Envi-ronmental Impact Assessment Review, vol. 25, pp. 436 – 458 (2005).

311
Metal Recycling – Opportunities, Limits, Infrastructure
315. Williams, E., Kahhat, R. Allenby, B., Kavazanjian, E., Kim, J., Xu, M. En-vironmental, Social, and Economic Implications of Global Reuse and Recy-cling of Personal Computers. Environ-mental Science & Technology, vol. 42, pp. 6446 – 6454 (2008).
316. Witik, R.A., Payet, J., Michaud, V., Lud-wig, C., Månson, J-A. Assessing the life cycle costs and environmental per-formance of lightweight materials in automobile Applications. Composites: Part A, vol. 42, pp. 1694 – 1709, (2011).
317. World Steel Association, Steel and En-ergy (2008a). Available from: http://www.worldsteel.org/dms/internetDocumen-tList/fact-sheets/Factsheet_Energy/document/Fact%20sheet_Energy.pdf (accessed December 7th, 2012).
318. World Steel Association. Environmental Case Study: Wind Energy (2008b). Avail-able from: http://www.worldsteel.org/dms/internetDocumentList/case-stud-ies/Wind-energycase-study/document/Wind%20energy%20case%20study.pdf (accessed December 7th, 2012).
319. Xiao, Y., Reuter, M.A. Recycling of dis-tributed aluminium turning scrap. Min-erals Engineering, vol. 15, pp. 963 – 970 (2002).
320. Xu J. et al. A review of processes and technologies for the Recycling of lithi-um-ion secondary batteries. Journal of Power Sources, vol. 177, pp. 512 – 527 (2008).
321. Xua, J., Thomas, H.R., Francis, R.W., Lumb, K.R., Wang, J., Liang, B. A review of processes and technologies for the Recycling of lithium-ion secondary bat-teries. Journal of Power Sources, vol. 177, pp. 512 – 527 (2008).
322. Yellishetty, M., Mudd, G.M., Ranjith, P.G., Tharumarajah, A. Environmental life-cycle comparisons of steel production and Recycling: Sustainability issues, problems and prospects. Environmental Science & Policy, vol. 14, pp. 650 – 663 (2011).
323. Yokoyama, K., Kubo, H., Mori, K., Oka-da, H., Takeuchi, S. and Nagasaka T. Separation and recovery of phosphorus from steelmaking slags with the aid of strong magnetic field. ISIJ International, vol. 47, pp. 1541 – 1548 (2007).
312
Environmental Risks and Challenges of Anthropogenic Metals Flows and Cycles
Acronyms and Definitions
ADP Abiotic Depletion
AHSS Advanced High Strength Steel
AOD Argon Oxygen Decarburization (stainless steel converter)
ASR Automotive Shredder Residue
BAT Best Available Technique
BIR Bureau of International Recycling
BIW Body-in-White (term for basic structure of automobile)
BOF Basic Oxygen Furnace (steel converter)
CAD Computer-Aided Design
CAPEX Capital Expenditure
C2C/CtC Cradle-to-Cradle
Carrier Metals Metals that form the backbone of recycling—commodity or base metals in industry jargon—and the basis of the complete metallurgical and techno-logical infrastructure for the recovery of their various thermodynamically associated minor elements from the earth’s minerals. Modern consum-er products and their unique mixtures challenge this infrastructure due to their incompatibility with basic thermodynamics. Therefore for optimal re-source efficiency, a network of carrier metal production facilities must be maintained at BAT level.
CO2eq Equivalent CO2 (each Greenhouse gas is scaled relative to CO2 and added to obtain the CO2eq)
DfD Design for Dismantling
DfE Design for Environment
DfR Design for Recycling
DfS Design for Sustainability
DfRE Design for Resource Efficiency
EoL End of Life
EEE Electrical and Electronic Equipment
EEP European Environmental Protection
ELFM Enhanced landfill management
ELV End of Life Vehicle
EPA Environmental Protection Agency
EPR Extended Producer Responsibility
ET Ecotoxicity

313
Environmental Risks and Challenges of Anthropogenic Metals Flows and Cycles
EU27 EU 27 Membership Countries (Austria, Belgium, Bulgaria, Cyprus, Czech Republic, Denmark, Estonia, Finland, France, Germany, Greece, Hungary, Ireland, Italy, Latvia, Lithuania, Luxembourg, Malta, Netherlands, Poland, Portugal, Romania, Slovakia, Slovenia, Spain, Sweden, United Kingdom)
EWM Enhanced Waste Management
Exergy The availability of energy stored within material and energy flows
HT Humantoxicity
IRP International Resource Panel (UNEP)
KPI Key Performance Indicator
LCA Life Cycle Assessment
LCD Liquid Crystal Display
LCI Life Cycle Inventory
LCM Life Cycle Management
LED Light-Emitting Diode
LFM Landfill Management
LIBS Laser-Induced-Breakdown-Spectroscopy
LME London Metal Exchange
Material Centric Recycling that considers only single elements, i. e. one at a time without the non-linear interactions between all connected materials to that ele-ment. This is the basis for the data in the 1st UNEP report on recycling.
MFA Mass Flow Analysis
Multiphysics Studies that combine hitherto separate physical disciplines, to generate relational mathematical models and validate them with controlled experi-ments for enhancing the understanding of natural behaviour. A recycling system can only be understood with a full grasp of all physics describing it.
ODP Ozone Layer Depletion Potential
OEM Original Equipment Manufacturer
OLED Organic Light-Emitting Diode
OPEX Operating Expenses
PGM Platinum Group Element
PM Precious Metal
POCP Photochemical Ozone Creation Potential
ppm Part per million

314
Environmental Risks and Challenges of Anthropogenic Metals Flows and Cycles
Product Centric Recycling that considers the entire product, including all non-linear inter-actions of materials on the recycling of all metals, elements and materials from complex products and their designer “minerals” similarly as is the basis for processing of geological minerals. To calculate this, requires de-tailed flowsheeting as well as considering the physics involved. This is the topic of the present report, in addition to defining multi-dimensional and non-linear definitions for recycling. This approach quite naturally leads to techniques for reuse, etc., for improving resource efficiency to be included in optimizing the recycling system.
PST Post Shredding Technology
PWB Printed Wire Board (also called Printed Circuit Board – PCB, but this may be confused with PCBs, the chemical)
Recyclate Raw material sent to, and processed in, a waste recycling plant or materi-als recovery facility.
REE Rare Earth Element
REO Rare Earth Oxide
SHA Small Home Appliance
SLC Super Light Car (Volkswagen-led EU project)
tpa tonnes per annum (metric)
UNEP United Nations Environmental Programme (www.unep.org)
USGS United States Geological Survey
WBCSD World Business Council of Sustainable Development
WEEE Waste Electrical and Electronic Equipment
WIO Waste Input-Output
WtoE Waste to Energy
XRF X-Ray Fluorescence
XRT X-Ray Transmission

315
Environmental Risks and Challenges of Anthropogenic Metals Flows and Cycles
Alphabetic list of all elements and their names, symbols and atomic numbersActinium Ac 89 – Aluminium Al 13 – Americium Am 95 – Antimony Sb 51 – Argon Ar 18 – Arsenic As 33 – Astatine At 85 – Barium Ba 56 – Berkelium Bk 97 – Beryllium Be 4 – Bismuth Bi 83 – Bohrium Bh 107 – Boron B 5 – Bromine Br 35 – Cadmium Cd 48 – Calcium Ca 20 – Californium Cf 98 – Carbon C 6 – Cerium Ce 58 – Cesium Cs 55 – Chlorine Cl 17 – Chromium Cr 24 – Cobalt Co 27 – Copper Cu 29 – Curium Cm 96 – Darmstadtium Ds 110 – Dubnium Db 105 – Dysprosium Dy 66 – Einsteinium Es 99 – Erbium Er 68 – Europium Eu 63 – Fermium Fm 100 – Fluorine F 9 – Francium Fr 87 – Gadolinium Gd 64 – Gallium Ga 31 – Germanium Ge 32 – Gold Au 79 – Hafnium Hf 72 – Hassium Hs 108 – Helium He 2 – Holmium Ho 67 – Hydrogen H 1 – Indium In 49 – Iodine I 53 – Iridium Ir 77 – Iron Fe 26 – Krypton Kr 36 – Lanthanum La 57 – Lawrencium Lr 103 – Lead Pb 82 – Lithium Li 3 – Lutetium Lu 71 – Magnesium Mg 12 – Manganese Mn 25 – Meitnerium Mt 109 – Mendelevium Md – 101 Mercury Hg 80 – Molybdenum Mo 42 – Neodymium Nd 60 – Neon Ne 10 – Neptunium Np 93 – Nickel Ni 28 – Niobium Nb 41 – Nitrogen N 7 – Nobelium No 102 – Osmium Os 76 – Oxygen O 8 – Palladium Pd 46 – Phosphorus P 15 – Platinum Pt 78 – Plutonium Pu 94 – Polonium Po 84 – Potassium K 19 – Praseodymium Pr 59 – Promethium Pm 61 – Protactinium Pa 91 – Radium Ra 88 – Radon Rn 86 – Rhenium Re 75 – Rhodium Rh 45 – Rubidium Rb 37 – Ruthenium Ru 44 – Rutherfordium Rf 104 – Samarium Sm 62 – Scandium Sc 21 – Seaborgium Sg 106 – Selenium Se 34 – Silicon Si 14 – Silver Ag 47 – Sodium Na 11 – Strontium Sr 38 – Sulfur S 16 – Tantalum Ta 73 – Technetium Tc 43 – Tellurium Te 52 – Terbium Tb 65 – Thallium Tl 81 – Thorium Th 90 – Thulium Tm 69 – Tin Sn 50 – Titanium Ti 22 – Tungsten W 74 – Ununbium Uub 112 – Ununhexium Uuh 116 – Ununoctium Uuo 118 – Ununpentium Uup 115 – Ununquadium Uuq 114 – Ununseptium Uus 117 – Ununtrium Uut 113 – Ununium Uuu 111 – Uranium U 92 – Vanadium V 23 – Xenon Xe 54 – Ytterbium Yb 70 – Yttrium Y 39 – Zinc Zn 30 – Zirconium Zr 40

316
Environmental Risks and Challenges of Anthropogenic Metals Flows and Cycles
International Resource Panel
As our economies have grown, so has the use of materials and resources. In an increas-ingly globalised economy, the challenge for policy-makers is to streamline actions for ensuring a more sustainable management of resources, both renewable and non-renew-able. There are existing measures such as policies on climate change and biodiversi-ty that tackle certain aspects of the global resource issues. However a holistic approach to resources management is needed to better identify their interlinkages and gaps in a sys-temic way.
The establishment of the International Resource Panel, or Resource Panel for short, is a first step towards addressing this need. Hosted at UNEP, the Resource Panel was officially launched in November 2007 to pro-vide the scientific impetus for decoupling economic growth and resource use from environmental degradation.
The objectives of the Resource Panel are to provide independent, coherent and authorita-tive scientific assessments of policy relevance on the sustainable use of natural resources and in particular their environmental impacts over the full life cycle as well as to contribute to a better understanding of how to decou-ple economic growth from environmental degradation.
This work builds on and contributes to other related international initiatives, including the 10-Year Framework of Programmes on Sustainable Consumption and Production (10YFP) and the Green Economy Initiative.
Global Metal Flows Working Group
Economic development is deeply coupled with the use of metals. The growing demand for metals implies a permanent pressure on the resource base. Metals are resources that have a high value and in principle can be easily reused and recycled. Reuse and recy-cling activities of metals on a global scale can contribute to closing the loops, turn waste into resources, and are expected to thereby reduce environmental impacts, safeguard the availability of metals, minimize metal prices, and promote meaningful and safe jobs for poor people in developing countries.
The Global Metal Flows Working Group aims at contributing to the promotion of reuse and recycling of metals and the establishment of an international sound material-cycle society by providing scientific and authoritative assessment studies on the global flows of metals. Expected results include revealing potentials for increasing the resource efficiency of metal flows at the national and international level.
About the UNEP Division of Technology,Industry and Economics
The UNEP Division of Technology, Industry and Economics (DTIE) helps governments, local authorities and decision-makers in business and industry to develop and implement policies and practices focusing on sustainable development.
The Division works to promote:> sustainable consumption and production,> the effi cient use of renewable energy,> adequate management of chemicals,> the integration of environmental costs in development policies.
The Offi ce of the Director, located in Paris, coordinates activities
through:
> The International Environmental Technology Centre - IETC (Osaka, Shiga), which implements integrated waste, water and disaster management programmes, focusing in particular on Asia.
> Sustainable Consumption and Production (Paris), which promotes sustainable consumption and production patterns as a contribution to human development through global markets.
> Chemicals (Geneva), which catalyzes global actions to bring about the sound management of chemicals and the improvement of chemical safety worldwide.
> Energy (Paris and Nairobi), which fosters energy and transport policies for sustainable development and encourages investment in renewable energy and energy effi ciency.
> OzonAction (Paris), which supports the phase-out of ozone depleting substances in developing countries and countries with economies in transition to ensure implementation of the Montreal Protocol.
> Economics and Trade (Geneva), which helps countries to integrate environmental considerations into economic and trade policies, and works with the fi nance sector to incorporate sustainable development policies.
UNEP DTIE activities focus on raising awareness,
improving the transfer of knowledge and information,
fostering technological cooperation and partnerships, and
implementing international conventions and agreements.
For more information,see www.unep.fr
AcknowledgmentsEditor: International Resource Panel, Working Group on the Global Metal Flows
Lead author: Ester van der Voet, University of Leiden, Netherlands; Chapter editors: Ester van der Voet, Leiden University, Netherlands; Reijo Salminen,Geological Survey Finland, Finland; Matthew Eckelman, North Eastern University, Boston, USA; Gavin Mudd, Monash University, Australia; Terry Norgate, CSIRO Minerals Down Under Flagship, Australia; Roland Hischier, EMPA, Switzerland; Contributing authors: Job Spijker, National Institute for Public Health and the Environment, Netherlands; Martina Vijver, Leiden University, Netherlands; Olle Selinus, Linneaus University, Sweden; Leo Posthuma, National Institute for Public Health and the Environment, Netherlands; Dick de Zwart, National Institute for Public Health and the Environment, Netherlands; Dik van de Meent, Radboud University Nijmegen, Netherlands; Markus Reuter, Outotec Oyj, Espoo, Finland; Ladji Tikana, German Copper Development Association, Germany; Sonia Valdivia, UNEP, France; Patrick Wäger, EMPA, Switzerland; Michael Hauschild, Technical University of Denmark, Denmark; Arjan de Koning, Leiden University, Netherlands.
The following people have contributed by reviewing draft versions of the report and providing valuable information and comments (Alpha-betical): John Atherton, International Council on Mining and Metals; Caroline Braibant, European Precious Metals Federation; Clare Broad-bent, World Steel Association; Peter Campbell, Université du Québec, Institut National de la Recherche Scientifi que, Canada; Sandra Carey, International Molybdenum Association; Grant Darrie, International Chromium Development Association; Katrien Delbeke, European Copper Institute; Johannes Drielsma, Euromines; Alain Dubreuil, Natural Resources Canada, Canada; Maria Amelia Enriquez, Federal University of Pará State, Brazil; Kevin Farley, Manhattan College, USA; Thomas Graedel, Yale University, USA; Edgar Hertwich, Norwegian University of Science and Technology, Norway, Paola Kistler, Rio Tinto, Switzerland; Christian Leroy, European Aluminium Association; Eirik Nordheim, European Aluminium Association; Jerome Nriagu, University of Michigan, USA, Jozef M. Pacyna, Norwegian Institute for Air Research, Norway; Claudia Peña, Chilean Research Centre for Mining and Metallurgy, Chile; Patrick van Sprang, Arche Consulting Brussels, Belgium; Sangwon Suh, University of California, USA; Frans Vollenbroek, European Commission, Belgium; Pia Voutilainen, Scandinavian Copper Development Association, Finland and (further) representatives of the following organisations: Codelco, Euromines, European Aluminium Association, European Precious Metals Federation, International Chromium Development Association, International Copper Association, International Council on Mining and Metals, International Molybdenum Association, International Zinc Association, Rio Tinto, and World Steel Association.
The report went through several rounds of peer-review coordinated in an effi cient and constructive way by Jacqueline Aloisi de Larderel to-gether with the International Resource Panel Secretariat. Valuable comments were received from several anonymous reviewers in this process. The preparation of this report also benefi ted from discussions with many colleagues at various meetings.
Special thanks go to Ernst Ulrich von Weizsäcker and Ashok Khosla as Co-Chairs of the International Resource Panel for their continuing sup-port and encouragement, as well as to the members of the International Resource Panel and its Steering Committee for their dedication and commitment and additional helpful comments.
Special thanks also go to Melanie Studer (Leiden University, Netherlands) for her support during the fi nal stages of the document preparation. Shaoyi Li, Tomas Marques and Philip Strothmann, UNEP, provided valuable input and comments; the International Resource Panel’s Secre-tariat coordinated the preparation of this report. Sibylle Schmidtchen and the team from 3f design were instrumental in creating and editing the fi gures and graphics.
The main responsibility for errors remains with the authors.
UNEP promotes environ-
mentally sound practices globally and in its own activities.
Please print this publication – when printing is necessary – on recycling
paper or FSC certi� ed paper. Our distri-bution policy aims to reduce UNEP’s
carbon footprint.
The report should be referenced as follows: UNEP (2013) Environmental Risks and Challenges of Anthropogenic Metals Flows and Cycles, A Report of the Working Group on the Global Metal Flows to the International Resource Panel. van der Voet, E.; Salminen, R.; Eckelman, M.; Mudd, G.; Hischier, R.
Copyright © United Nations Environment Programme, 2011
This publication may be reproduced in whole or in part and in any form for educational or nonprofi t purposes without special permission from the copyright holder, provided acknowledgement of the source is made. UNEP would appreciate receiving a copy of any publication that uses this publication as a source.
No use of this publication may be made for resale or for any other commercial purpose whatsoever without prior permission in writing from the United Nations Environment Programme.
Design/layout: 3f design, cover concept, UNEP.
Photos: iStockphoto.com …
DisclaimerThe designations employed and the presentation of the material in this publication do not imply the expression of any opinion whatsoever on the part of the United Nations Environment Programme concerning the legal status of any country, territory, city or area or of its authorities, or concerning delimitation of its frontiers or boundaries. Moreover, the views expressed do not necessarily represent the decision or the stated policy of the United Nations Environment Programme, nor does citing of trade names or commercial processes constitute endorsement.
ISBN: 978-92-807-3266-5Job Number: DTI/1534/PA

UN
IT
ED
N
AT
IO
NS
E
NV
IR
ON
ME
NT
P
RO
GR
AM
ME
A key question that relates to the very broad and intensive use of metals is whether society needs to be concerned about long-term supplies of any or many of them. This is a many-faceted question that cannot be answered quickly or unequivocally. To address it, the Global Metal Flows Group envisions a series of six reports, of which this is the second-b one addressing opportunities, limits and infrastructure for metal recy-cling. This report follows the IRP’s fi rst report on recycling, which has demonstrated the status quo of global recycling rates for sixty metals.
Product-Centric recycling is dis-cussed in this report by acknowl-edged experts. This approach is considered to be an essential enabler of resource effi ciency by increasing recycling rates. Due to complex functionality, modern products contain complex mixes of almost any imaginable metal, material and compound. This re-port provides a techno-economic, product design and physics basis to address the challenges of recy-cling these increasingly complex products in the 21st century.
Published in April 2013
METAL RECYCLING
For more information, contact:Resource Panel Secretariat UNEP DTIESustainable Consumptionand Production Branch15 rue de Milan75441 Paris CEDEX 09FranceTel: +33 1 44 37 14 50Fax: +33 1 44 37 14 74E-mail: [email protected] www.unep.org/resourcepanel
DTI/1535/PAISBN: 978-92-807-3267-2
Opportunities, Limits, Infrastructure