Embed Size (px)
Citation preview

Steven French | @NMITWEETS Natural Marketing Institute
Market Insights from Top Researchers: The Latest Intelligence on Customer Attitudes and Behavior
#SB15London
Raphael Bemporad | @rbemporad BBMG
Dorothy Mackenzie | @DragonRogueUKDragon Rogue
Lucy Shea | @swishinglucy Futerra
Kristoph Kahlert Serviceplan Corporate Reputation
Dan Gavshon Brady | @DanBG88 Wolff Colins
1 © 2014, Natural Marke1ng Ins1tute
Global Sustainability Trends: Opportuni5es & Challenges
SB London 2015 Steve French, NMI Managing Partner
16 November 2015
2 © 2015, Natural Marke1ng Ins1tute (NMI) All Rights Reserved
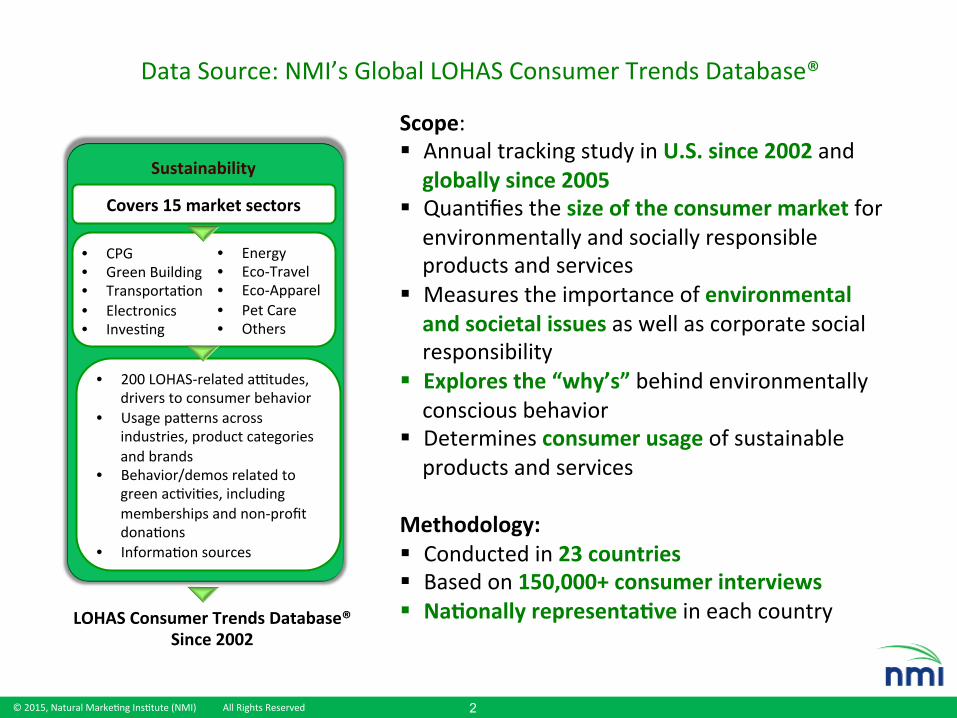
Sustainability
• 200 LOHAS-‐related aDtudes, drivers to consumer behavior
• Usage paKerns across industries, product categories and brands
• Behavior/demos related to green ac1vi1es, including memberships and non-‐profit dona1ons
• Informa1on sources
Covers 15 market sectors
• CPG • Green Building • Transporta1on • Electronics • Inves1ng
• Energy • Eco-‐Travel • Eco-‐Apparel • Pet Care • Others
LOHAS Consumer Trends Database® Since 2002
Data Source: NMI’s Global LOHAS Consumer Trends Database®
Scope: § Annual tracking study in U.S. since 2002 and globally since 2005
§ Quan1fies the size of the consumer market for environmentally and socially responsible products and services
§ Measures the importance of environmental and societal issues as well as corporate social responsibility
§ Explores the “why’s” behind environmentally conscious behavior
§ Determines consumer usage of sustainable products and services
Methodology: § Conducted in 23 countries § Based on 150,000+ consumer interviews § NaSonally representaSve in each country

3 © 2015, Natural Marke1ng Ins1tute (NMI) All Rights Reserved
• This research classified 9 countries studied into Developed and Emerging in order to beKer understand the ‘developmental stage’ of the country, thereby laying the groundwork for why differences in aDtudes and behaviors may exist.
Emerging countries -‐ Brazil, China, India, Russia, South Africa Developed countries -‐ Germany, Japan, UK, US
Developed vs. Emerging Perspec1ve
Developed countries
US UK
Germany Japan
Emerging countries
Russia China India Brazil
S. Africa

4 © 2015, Natural Marke1ng Ins1tute (NMI) All Rights Reserved
Most consumers feel that the environmental ‘buzz’ is not a temporary fad, but is here to stay
Developed countries Emerging countries
2013 % total growth (2010-‐2013)
Russia 72% 112%
Brazil 71% -‐4%
China 69% -‐5%
South Africa 62% N/A
UK 57% 19%
Germany 57% 21%
U.S. 52% 4%
India 52% 2%
Japan 33% -‐18%
Top 3 countries who believe
environmental ‘movement’ is here to stay
Russia appears to be ‘buying-‐in’ on a much higher level than in the past, while Japan is s1ll on the fence.

5 © 2015, Natural Marke1ng Ins1tute (NMI) All Rights Reserved
Brazil
China
Germany
India
Japan
Russia SA UK
0%
20%
40%
60%
80%
0% 20% 40% 60% 80% 100%
Socially re
spon
sible bu
sine
ss
ProtecSng the environment
Most Emerging countries (except Russia) care strongly about environmental protec1on and socially responsible business, while the Developed markets less so
% consumers who care about…
Size of bubble is determined by popula1on of each country; emerging country popula1on is adjusted for urban popula1on based on sta1s1cs from the Human Development Report Office (HDRO), 2012
US
Developed countries Emerging countries

6 © 2015, Natural Marke1ng Ins1tute (NMI) All Rights Reserved
Many consumers also feel they are ‘very’ informed about how to live an eco-‐friendly and green lifestyle
Not at all informed
Very well informed
UK (28%)
China (52%)
India (60%)
Russia (44%)
Brazil (58%)
S. Africa (35%)
Germany (31%)
Japan (10%)
% countries indica1ng they feel ‘VERY’ informed about how to live an eco-‐friendly and green lifestyle
U.S. (32%)
Japan, UK and Germany lag behind, perhaps highligh1ng countries where educa1onal opportuni1es exist.
Developed countries Emerging countries

7 © 2015, Natural Marke1ng Ins1tute (NMI) All Rights Reserved
Choosing sustainable or e-‐friendly products over conven1onal ones has shown some substan1al increases since 2010
48%
53% 50%
42% 43% 44%
42% 44%
42%
36% 34% 34%
New, Preliminary 2015 Data
2014 2013 2012 2011 2010
I will choose those products and services that are environmentally-‐friendly
I will choose products from sustainable sources over other conven1onal products
% U.S. General Popula1on indica1ng… “When given the choice to buy or use a product or service…”
8 © 2015, Natural Marke1ng Ins1tute (NMI) All Rights Reserved
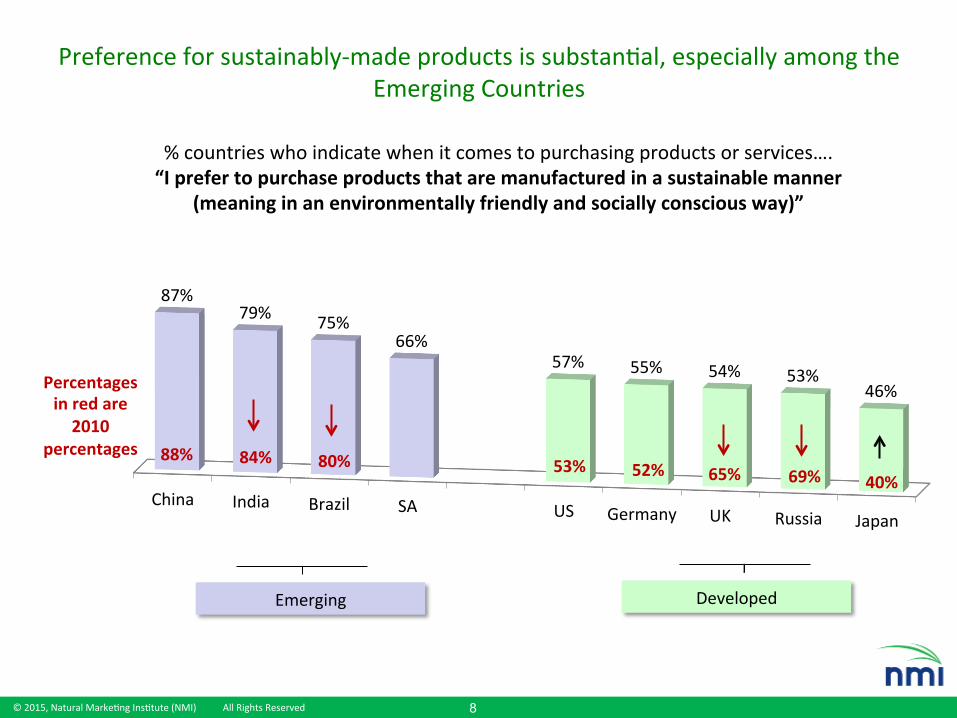
% countries who indicate when it comes to purchasing products or services…. “I prefer to purchase products that are manufactured in a sustainable manner
(meaning in an environmentally friendly and socially conscious way)”
Preference for sustainably-‐made products is substan1al, especially among the Emerging Countries
China India Brazil SA US Germany UK Russia Japan
87% 79% 75%
66% 57% 55% 54% 53%
46%
Emerging Developed
88% 84% 80% 52% 65% 69% 40%
Percentages in red are 2010
percentages 53%

9 © 2015, Natural Marke1ng Ins1tute (NMI) All Rights Reserved
Brazil, China and India are extremely opportunis1c as they exhibit increasingly strong e-‐friendly behaviors
34%
40% 36%
10% 7%
26%
12%
13%
46% 51%
41%
22% 17%
7%
27%
11%
13%
Brazil China India SA Germany Japan Russia UK US
2010 2013
% countries who completely agree: “I buy as many green, eco-‐friendly products as I can”

10 © 2015, Natural Marke1ng Ins1tute (NMI) All Rights Reserved
Sustainability has broad impact across brand appeal; be sure to tell your whole brand story when communica1ng with consumers
% U.S. General Popula1on indica1ng… “Knowing that a company is mindful of its impact on the environment and
society makes me…”
CAG ’09-‐’14: 4.3% 2.6% 2.4% 2.0%
more likely to try their products or services
more likely to buy their products repeatedly
more likely to talk with my friends and family about the company
less concerned with the price of their products
58% 53% 45% 30%
11 © 2015, Natural Marke1ng Ins1tute (NMI) All Rights Reserved
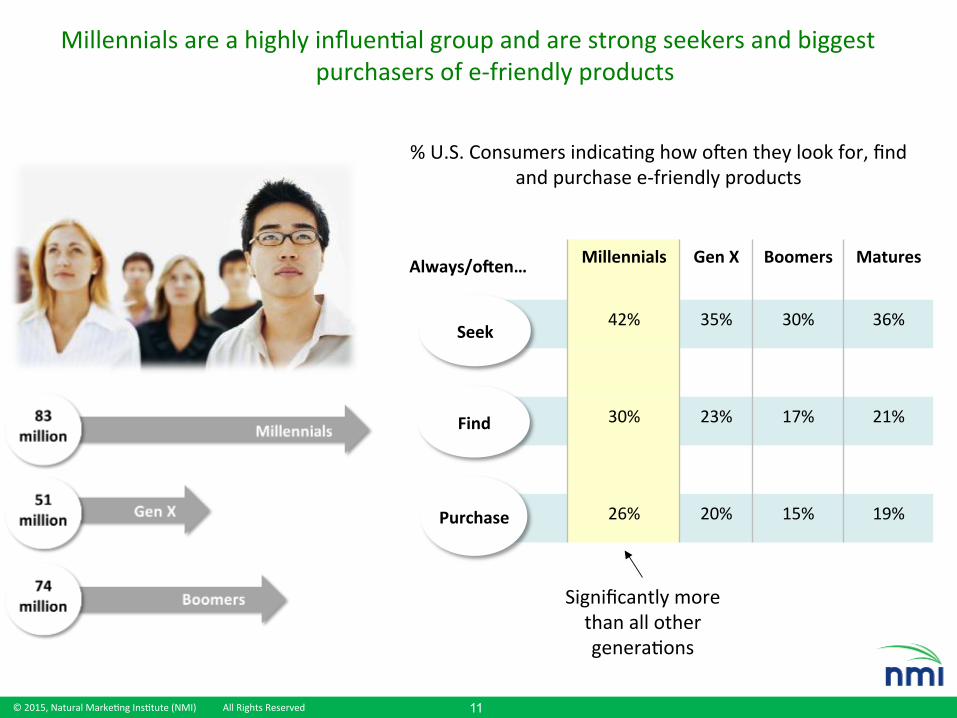
Millennials are a highly influen1al group and are strong seekers and biggest purchasers of e-‐friendly products
Millennials Gen X Boomers Matures
42% 35% 30% 36%
30% 23% 17% 21%
26% 20% 15% 19%
Seek
Find
Purchase
Always/ojen…
% U.S. Consumers indica1ng how open they look for, find and purchase e-‐friendly products
Significantly more than all other genera1ons
12 © 2015, Natural Marke1ng Ins1tute (NMI) All Rights Reserved
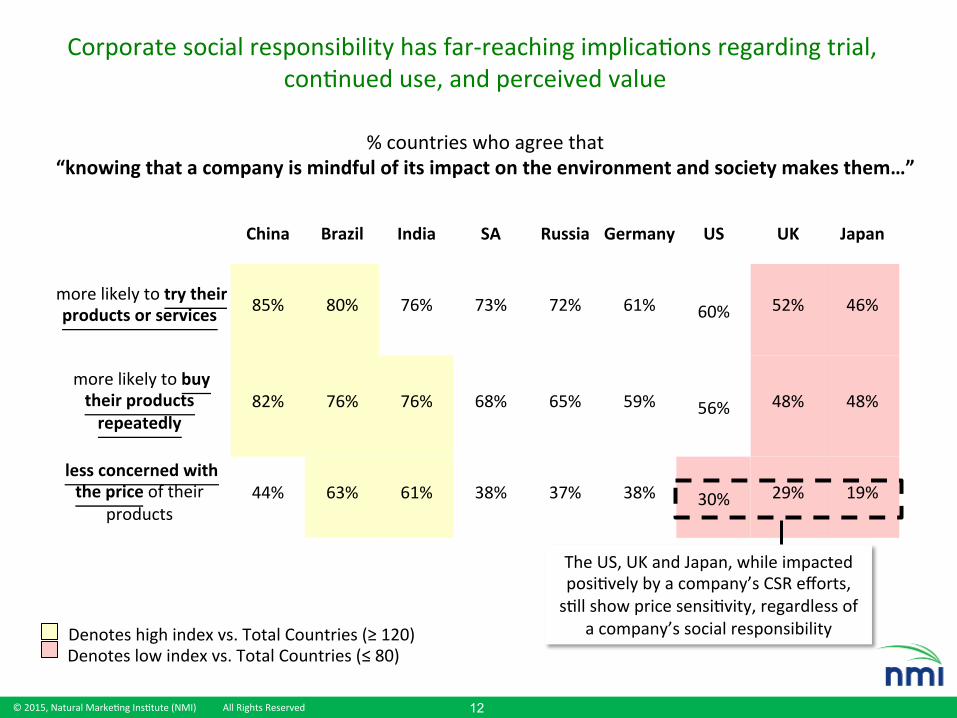
China Brazil India SA Russia Germany US UK Japan
more likely to try their products or services 85% 80% 76% 73% 72% 61% 60% 52% 46%
more likely to buy their products repeatedly
82% 76% 76% 68% 65% 59% 56% 48% 48%
less concerned with the price of their
products 44% 63% 61% 38% 37% 38% 30% 29% 19%
% countries who agree that “knowing that a company is mindful of its impact on the environment and society makes them…”
Corporate social responsibility has far-‐reaching implica1ons regarding trial, con1nued use, and perceived value
Denotes high index vs. Total Countries (≥ 120) Denotes low index vs. Total Countries (≤ 80)
The US, UK and Japan, while impacted posi1vely by a company’s CSR efforts, s1ll show price sensi1vity, regardless of
a company’s social responsibility

13 © 2015, Natural Marke1ng Ins1tute (NMI) All Rights Reserved
20%
30%
40%
50%
60%
70%
80%
90%
100%
China SA India Brazil Germany Russia US UK Japan
Quality
Price
Convenience
Anything
% countries who indicate “I do not want to sacrifice… when buying environmentally-‐friendly products”
Environmentally-‐made products cannot concede on quality or price, as consumers are not willing to sacrifice these aKributes
Emerging Developed

14 © 2015, Natural Marke1ng Ins1tute (NMI) All Rights Reserved
% U.S. General Popula1on who agree with the following statements…
Willingness to pay a premium for environmentally-‐friendly products is back on par with pre-‐recessionary levels, however, most consumers s1ll primarily price-‐driven
28% 30%
17% 15% 16% 16% 13%
27% 29% 27%
54% 61%
69% 68% 69% 68% 70% 63% 63% 64%
2006 2007 2008 2009 2010 2011 2012 2013 2014 New, Preliminary 2015 Data
I am willing to pay 20% more for products which are made in an environmentally friendly and sustainable way
I care about the environment, but my purchase is determined mainly by price

15 © 2015, Natural Marke1ng Ins1tute (NMI) All Rights Reserved
As consumer aDtudes and behaviors surrounding sustainability con1nue to grow, companies involved in the green and sustainable marketplace should also
see a growth in return on investment
Feel more responsible for protecSng
environment
Sustainability is here to
stay
Sustainable ini1a1ves boost ROI
Impact of CSR on trial and
purchase is growing
Consumers’ “green” aDtudes are growing……

16 © 2015, Natural Marke1ng Ins1tute (NMI) All Rights Reserved
The U.S. sustainability consumer market will grow to $1.5 trillion by 2020
2005 (US$ MM) 2012 (US$ MM) 2020 (US$ MM)
AlternaSve Energy $607 $700 $820
AlternaSve TransportaSon $6,121 $185,045 $572,440
Green Building $35,401 $55,722 $116,684
Natural Lifestyles $5,394 $6,394 $8,913
Organic Comon/Natural Fiber & TexSle $4,018 $7,545 $8,756
Personal Health $25,140 $36,980 $47,148
Ecotourism $24,200 $144,200 $416,929
Electronics/ Appliances $39,902 $119,491 $161,648
Consumer Packaged Goods $57,271 $104,664 $191,087
Grand Total $198,054 $660,740 $1,524,425
17 © 2015, Natural Marke1ng Ins1tute (NMI) All Rights Reserved
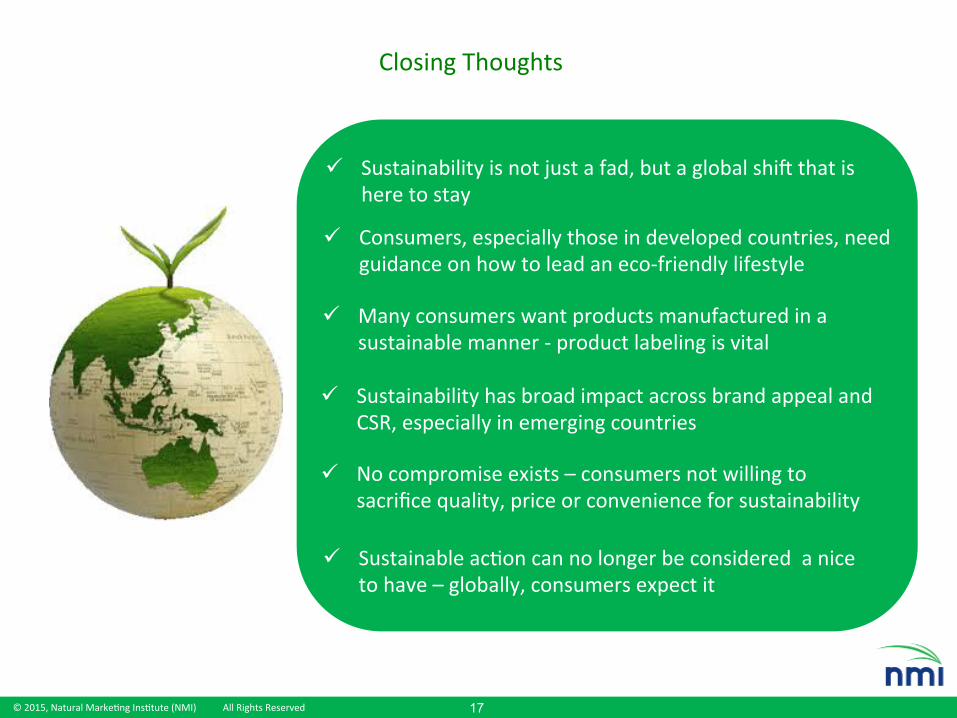
Closing Thoughts
ü Consumers, especially those in developed countries, need guidance on how to lead an eco-‐friendly lifestyle
ü Sustainability is not just a fad, but a global ship that is here to stay
ü Sustainability has broad impact across brand appeal and CSR, especially in emerging countries
ü Many consumers want products manufactured in a sustainable manner -‐ product labeling is vital
ü Sustainable ac1on can no longer be considered a nice to have – globally, consumers expect it
ü No compromise exists – consumers not willing to sacrifice quality, price or convenience for sustainability

18 © 2015, Natural Marke1ng Ins1tute (NMI) All Rights Reserved
Natural MarkeSng InsStute (NMI) 272 Ruth Road Harleysville, PA USA 19438 Steve French Managing Partner [email protected] +1 215 513 7300 x214 www.NMIsoluSons.com All materials herein are © 2013-‐2015 by NMI (Natural Marke1ng Ins1tute). All rights reserved. Reproduc1on, publica1on (internal and/or external), transmission, or other use of any of the within materials, including but not limited to graphics, data, and/or text, for any commercial or non-‐commercial purposes, is strictly prohibited without the prior express wriKen permission of NMI.


![PRINCIPALS’ ATTITUDES AND INSIGHTS CONCERNING THE ...cnweb.cn.edu/tedu/NCATE-State/Examples-ProfMajor/EDUC600Sample[3].pdfPrincipal’s Attitudes 3 Definitions Within the context](https://img.pdfslide.us/doc/110x75/5f5072c8548981174f5e18d2/principalsa-attitudes-and-insights-concerning-the-cnwebcneduteduncate-stateexamples-profmajoreduc600sample3pdf.jpg)