Embed Size (px)
Citation preview
1
Behavior Change, Education & Action: Utilizing Proven Strategies to Increase Recycling
R3-Recycling and Organics Conference
MassRecycle March 30, 2015
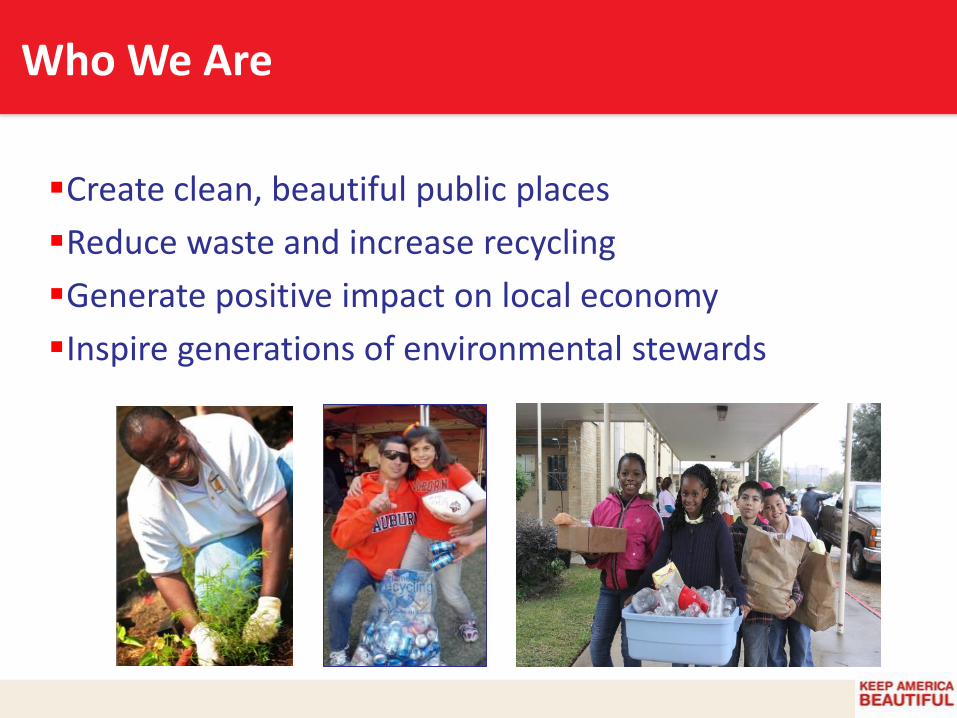
Who We Are
Create clean, beautiful public places
Reduce waste and increase recycling
Generate positive impact on local economy
Inspire generations of environmental stewards
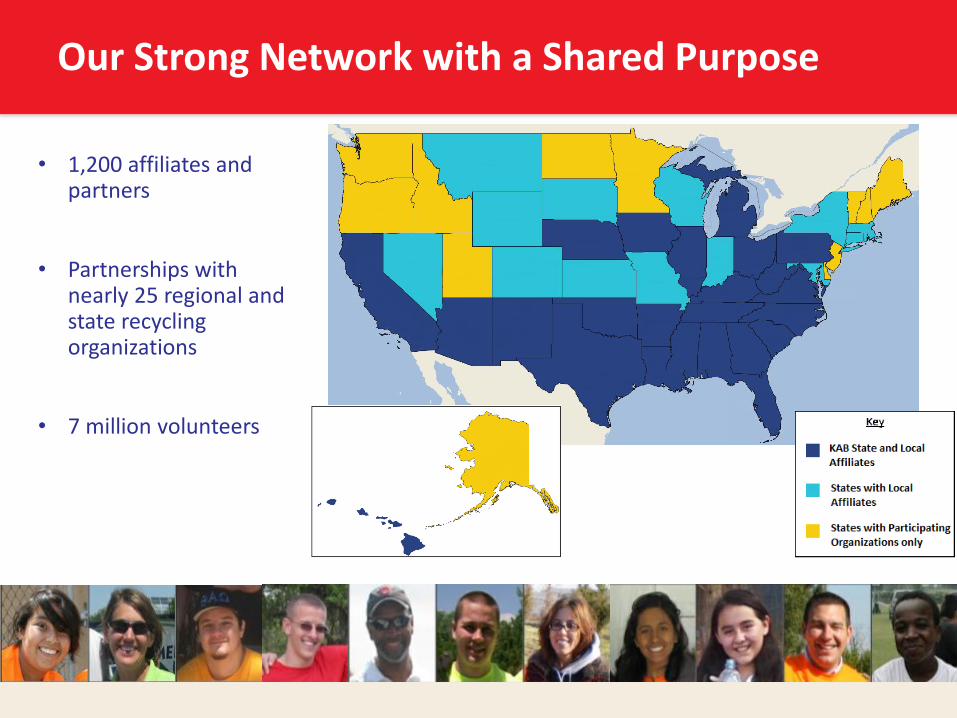
Our Strong Network with a Shared Purpose
• 1,200 affiliates and partners
• Partnerships with nearly 25 regional and state recycling organizations
• 7 million volunteers
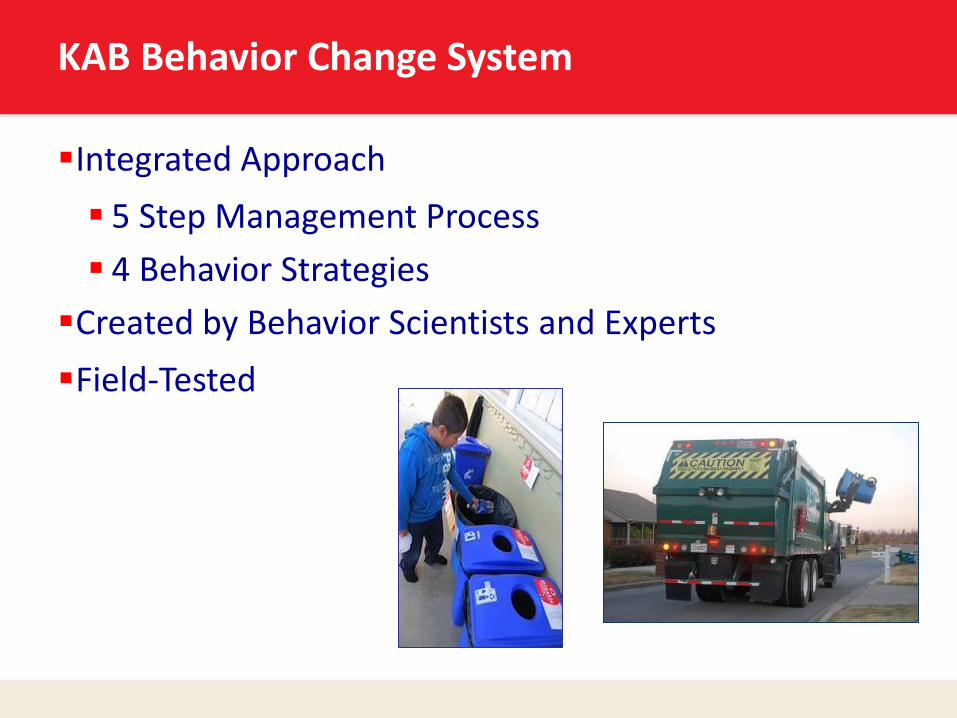
KAB Behavior Change System
Integrated Approach
5 Step Management Process
4 Behavior Strategies
Created by Behavior Scientists and Experts
Field-Tested
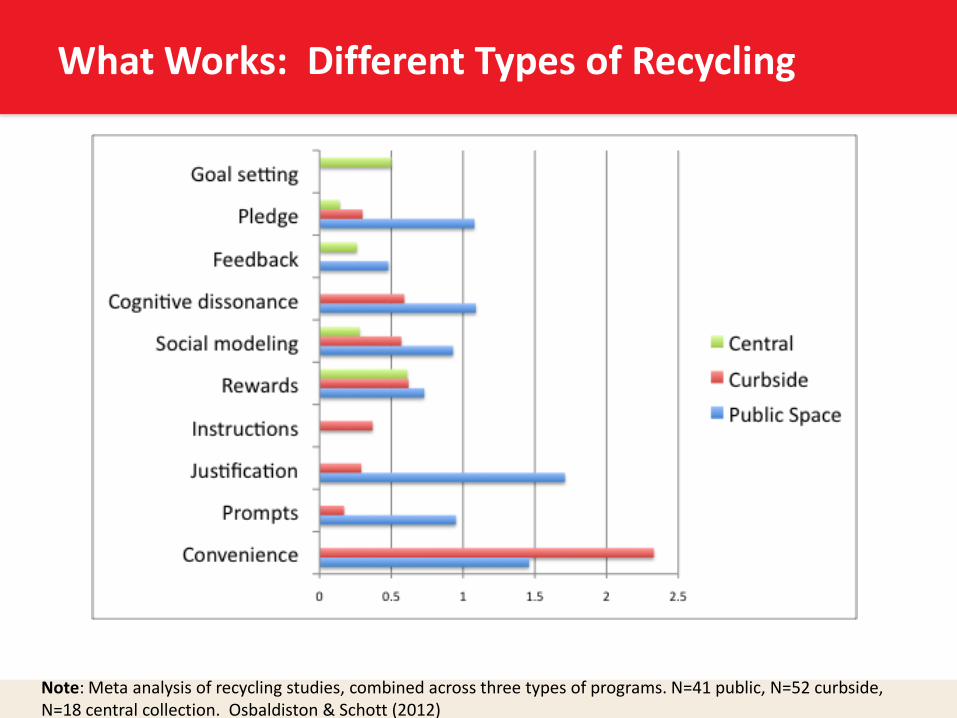
What Works: Different Types of Recycling
Note: Meta analysis of recycling studies, combined across three types of programs. N=41 public, N=52 curbside, N=18 central collection. Osbaldiston & Schott (2012)
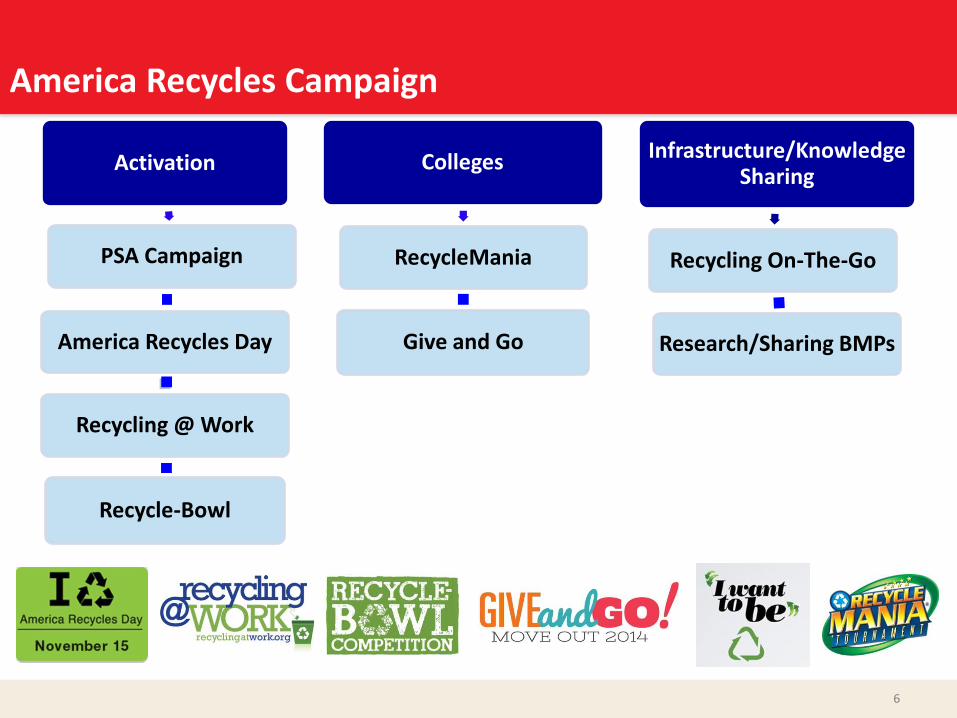
America Recycles Campaign
6
Activation
PSA Campaign
America Recycles Day
Recycling @ Work
Recycle-Bowl
Colleges
RecycleMania
Give and Go
Infrastructure/Knowledge Sharing
Recycling On-The-Go
Research/Sharing BMPs
7
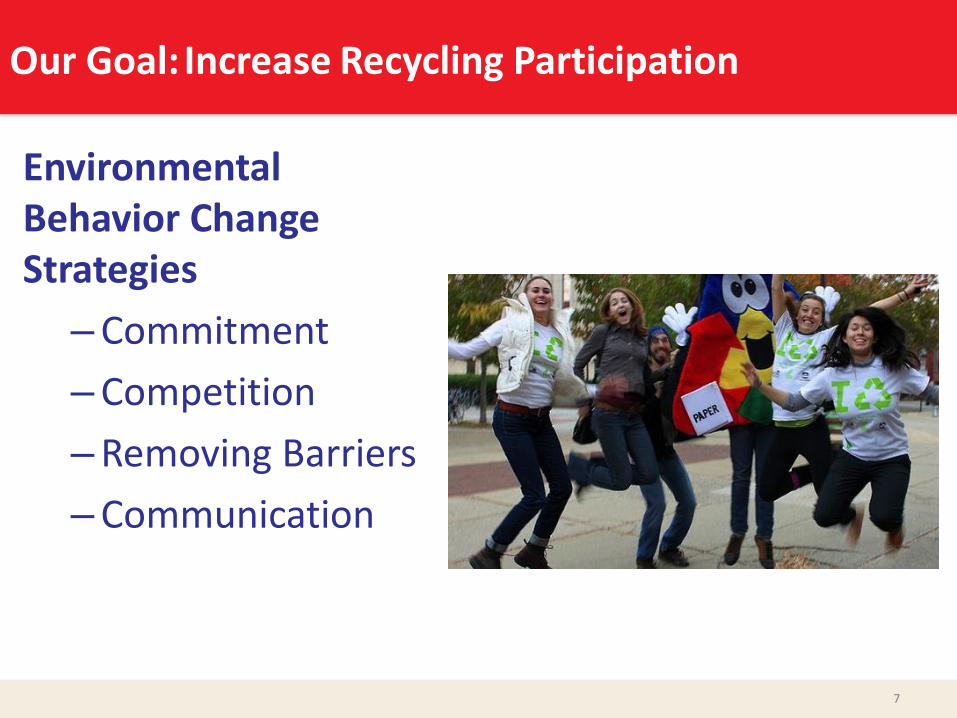
Our Goal: Increase Recycling Participation
Environmental Behavior Change Strategies
–Commitment
–Competition
–Removing Barriers
–Communication
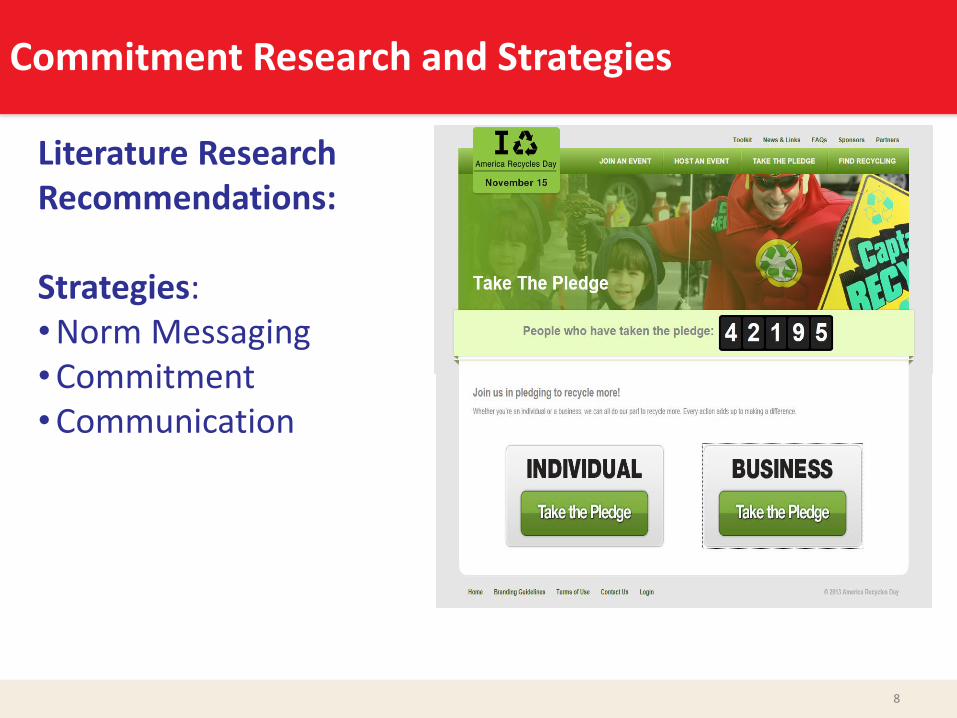
Commitment Research and Strategies
8
Literature Research Recommendations: Strategies: •Norm Messaging •Commitment •Communication
9
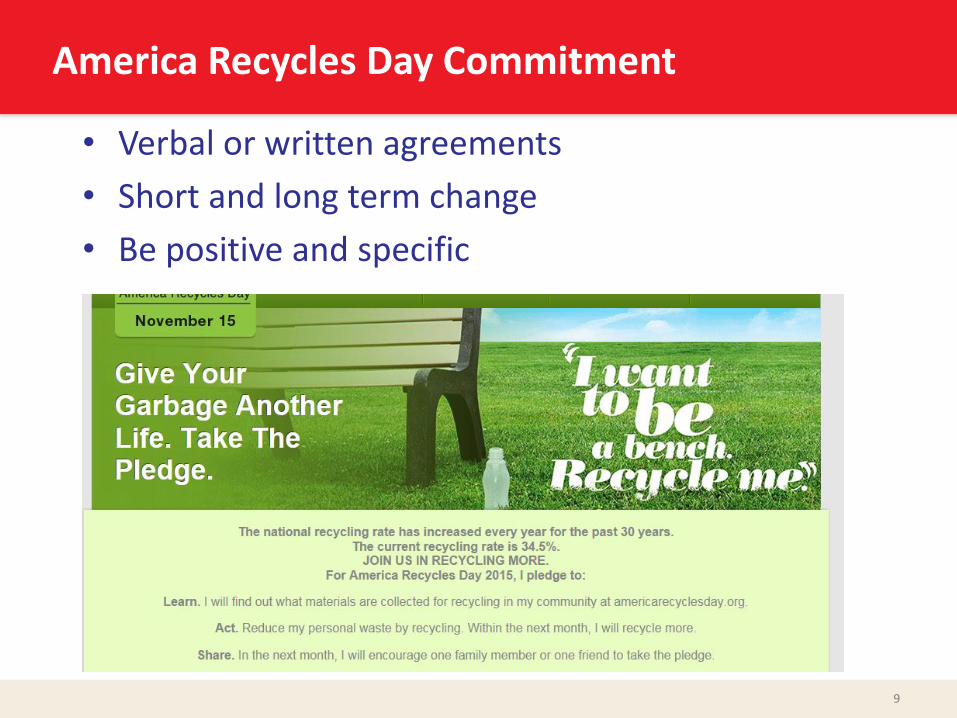
America Recycles Day Commitment
• Verbal or written agreements
• Short and long term change
• Be positive and specific
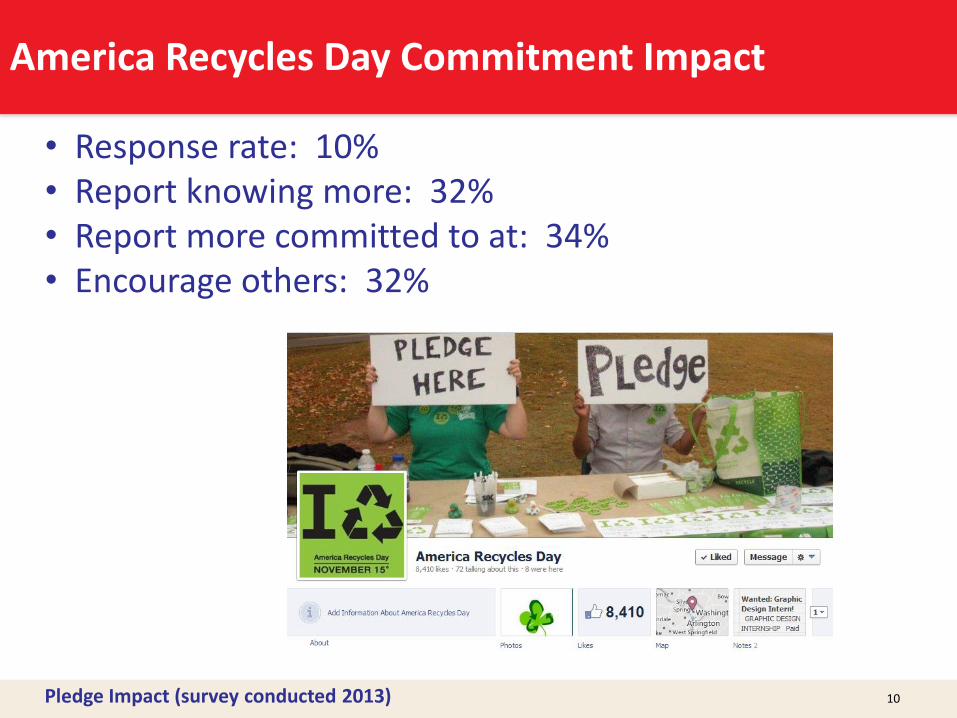
America Recycles Day Commitment Impact
• Response rate: 10% • Report knowing more: 32% • Report more committed to at: 34% • Encourage others: 32%
Pledge Impact (survey conducted 2013)
10
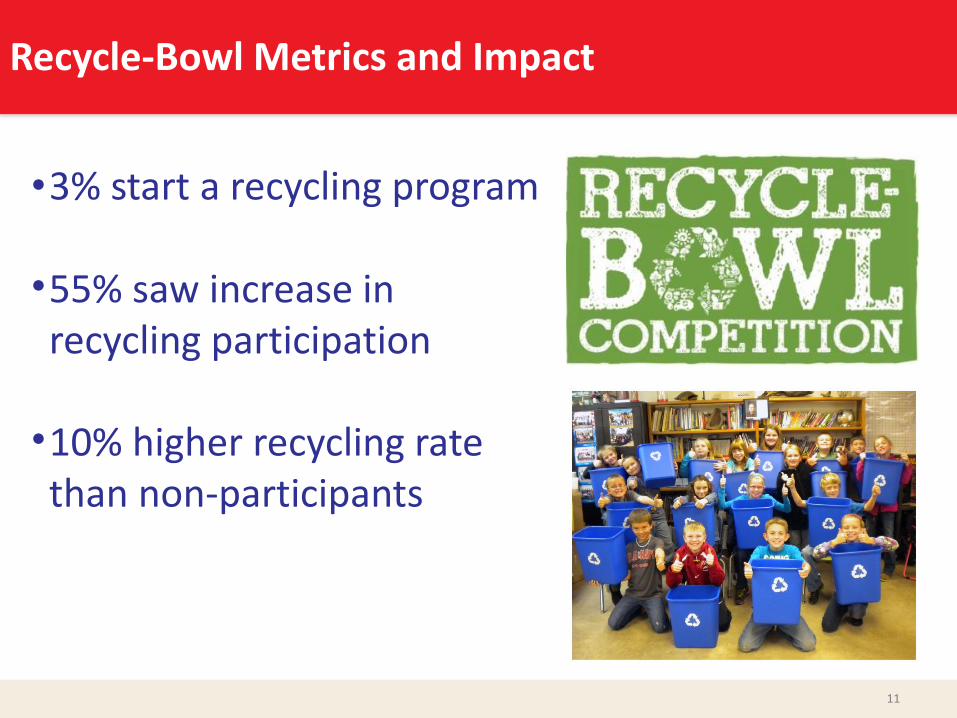
Recycle-Bowl Metrics and Impact
•3% start a recycling program •55% saw increase in recycling participation •10% higher recycling rate than non-participants
11
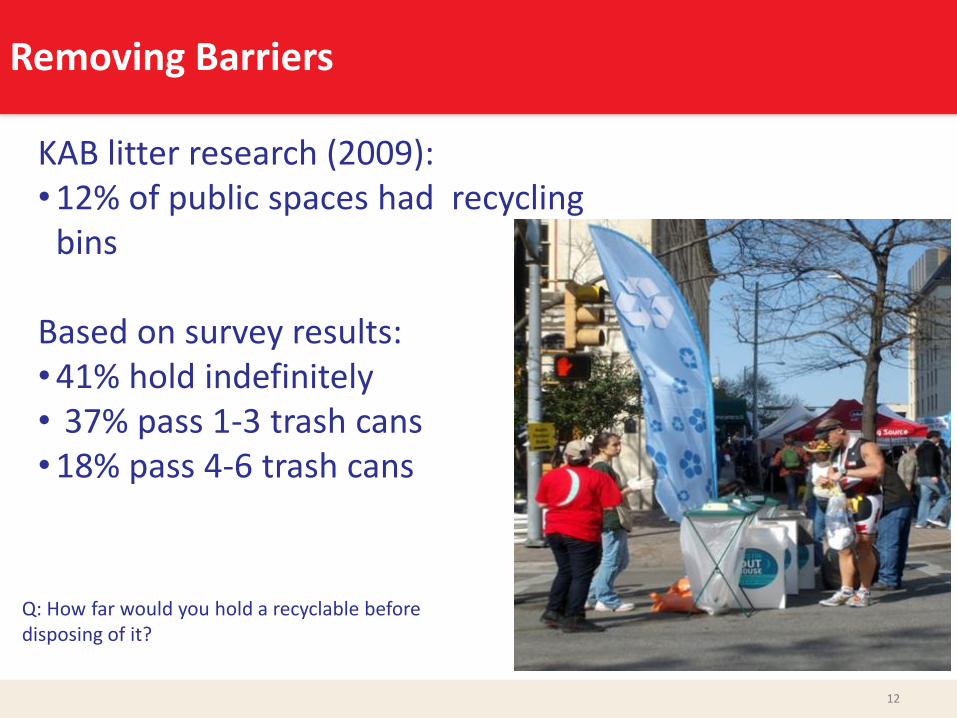
Removing Barriers
12
KAB litter research (2009): •12% of public spaces had recycling
bins Based on survey results: •41% hold indefinitely • 37% pass 1-3 trash cans •18% pass 4-6 trash cans
Q: How far would you hold a recyclable before disposing of it?
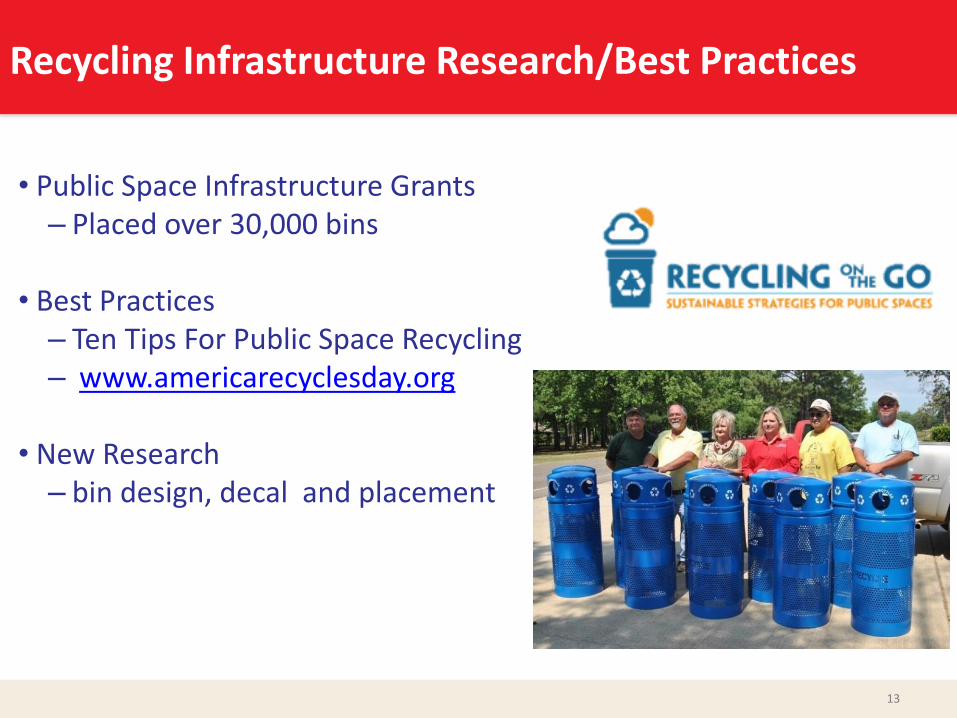
Recycling Infrastructure Research/Best Practices
• Public Space Infrastructure Grants – Placed over 30,000 bins
• Best Practices – Ten Tips For Public Space Recycling – www.americarecyclesday.org
• New Research – bin design, decal and placement
13
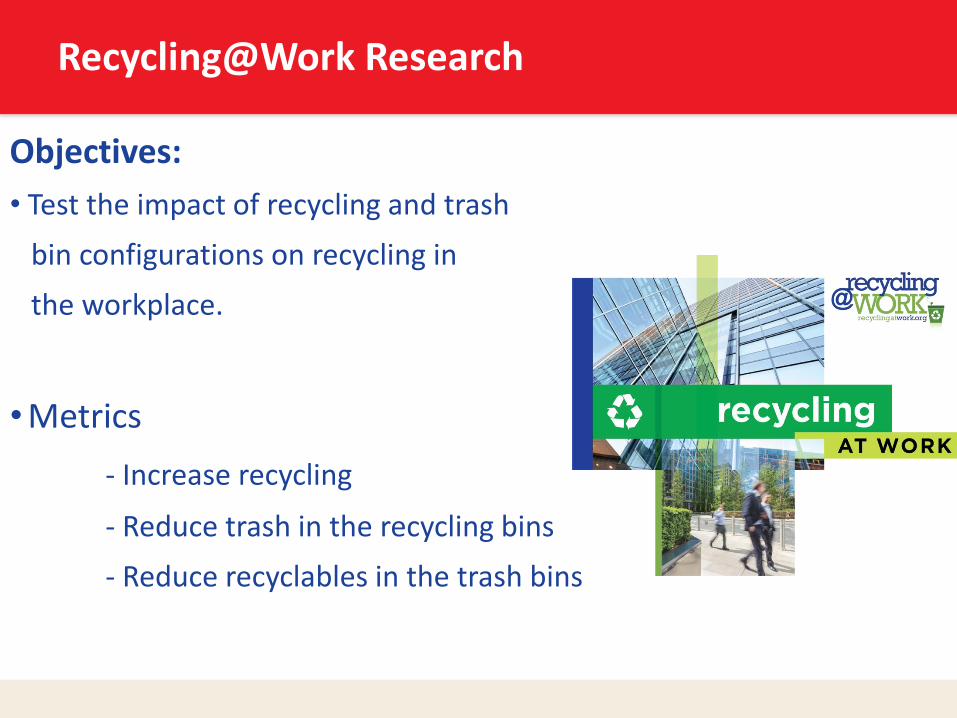
Recycling@Work Research
Objectives:
• Test the impact of recycling and trash
bin configurations on recycling in
the workplace.
•Metrics
- Increase recycling
- Reduce trash in the recycling bins
- Reduce recyclables in the trash bins
Partners
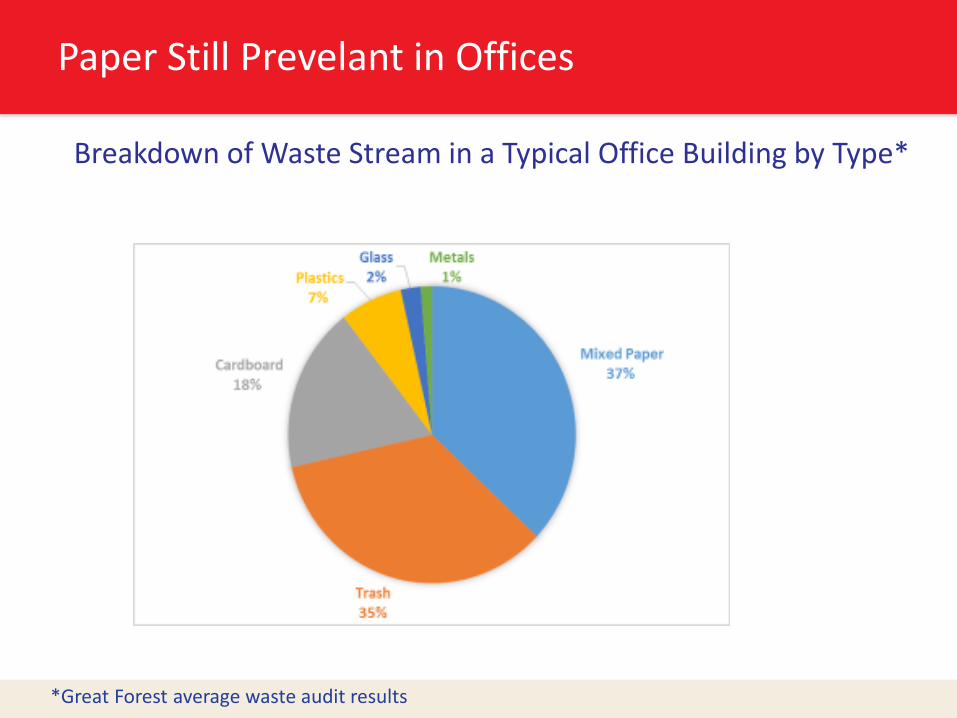
Paper Still Prevelant in Offices
Breakdown of Waste Stream in a Typical Office Building by Type*
*Great Forest average waste audit results
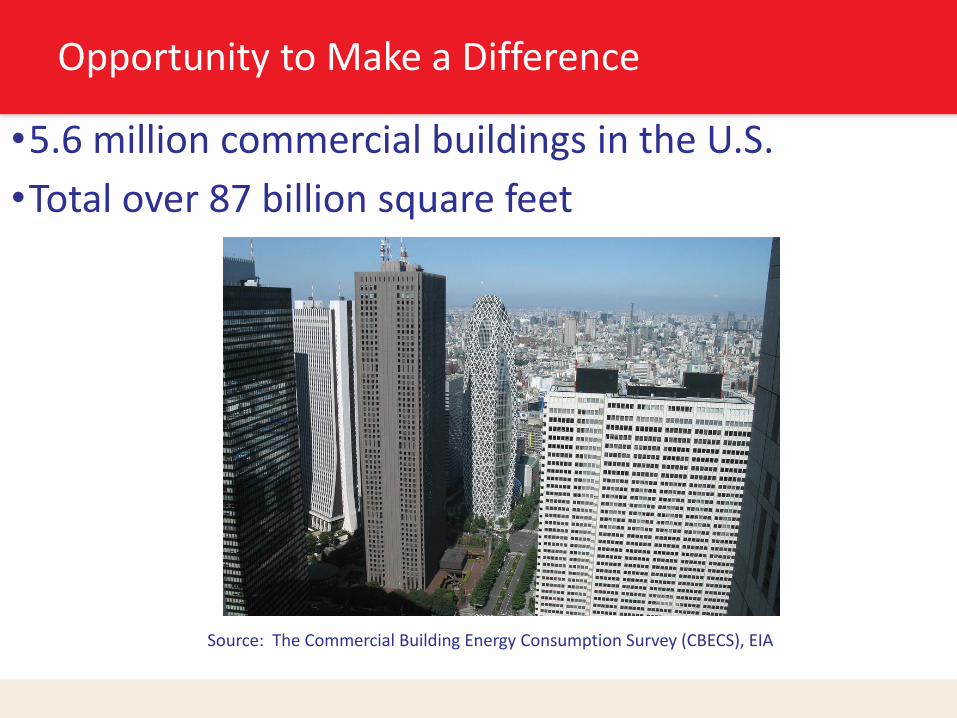
Opportunity to Make a Difference
•5.6 million commercial buildings in the U.S.
•Total over 87 billion square feet
Source: The Commercial Building Energy Consumption Survey (CBECS), EIA
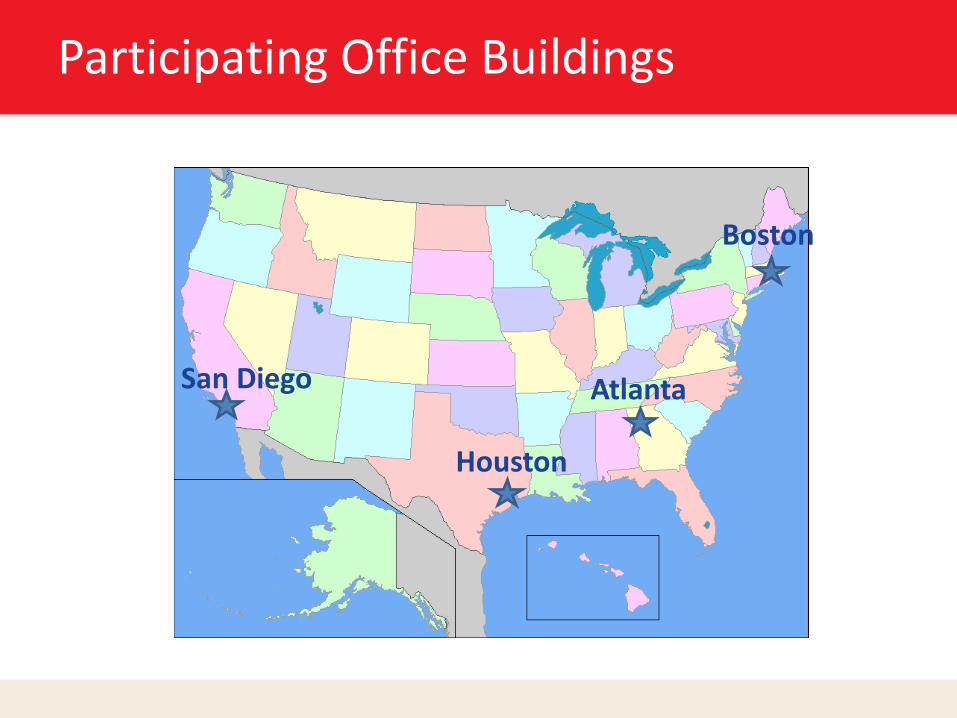
Participating Office Buildings
San Diego
Houston
Atlanta
Boston
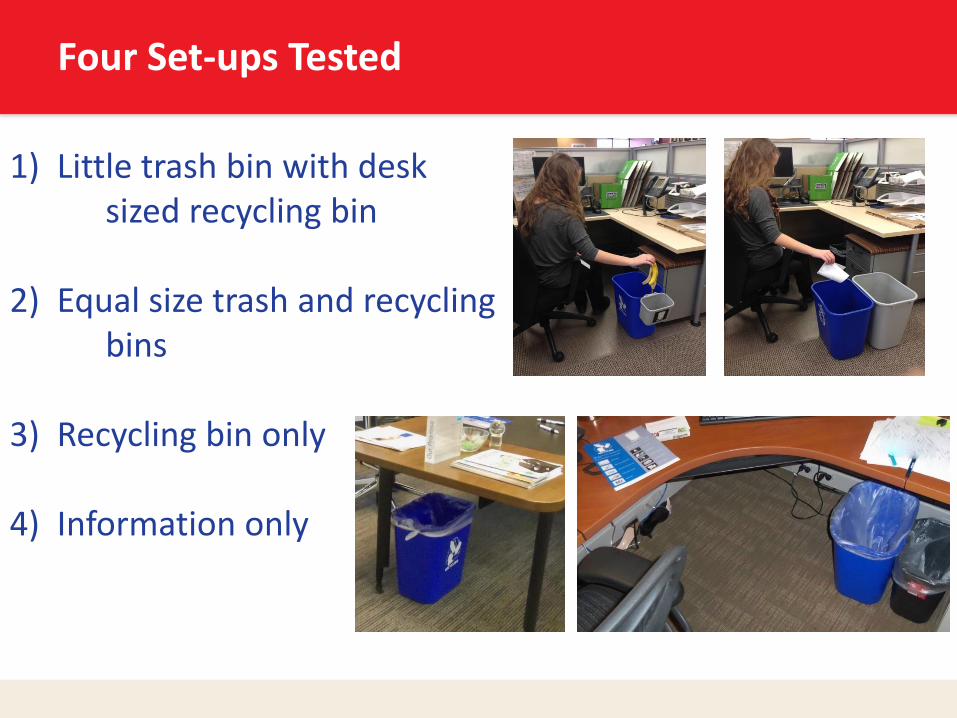
Four Set-ups Tested
1) Little trash bin with desk sized recycling bin
2) Equal size trash and recycling bins
3) Recycling bin only
4) Information only
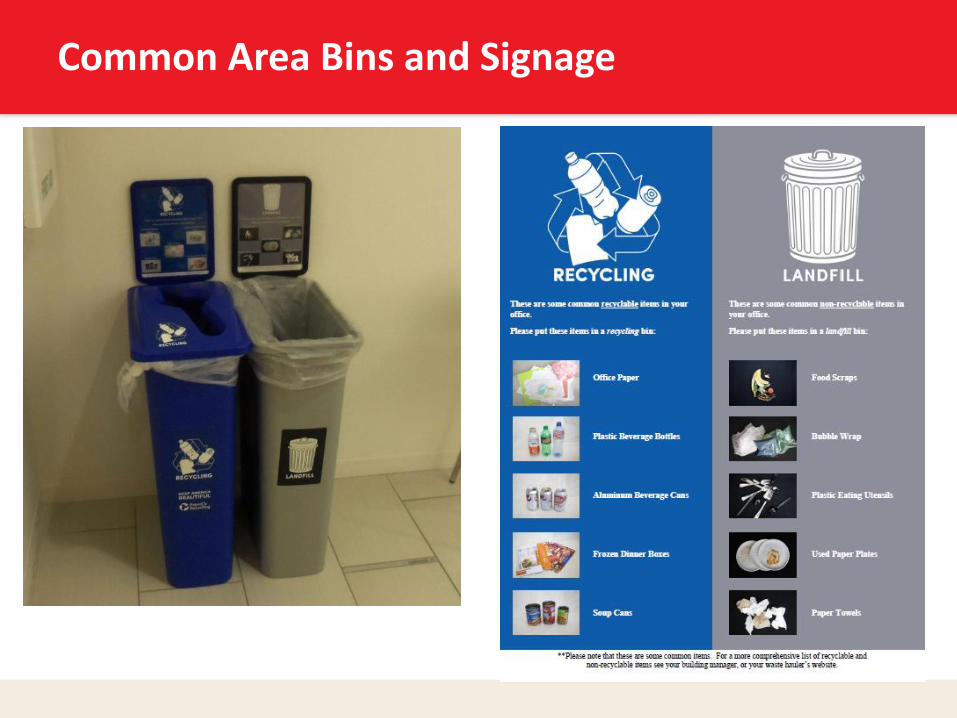
Common Area Bins and Signage
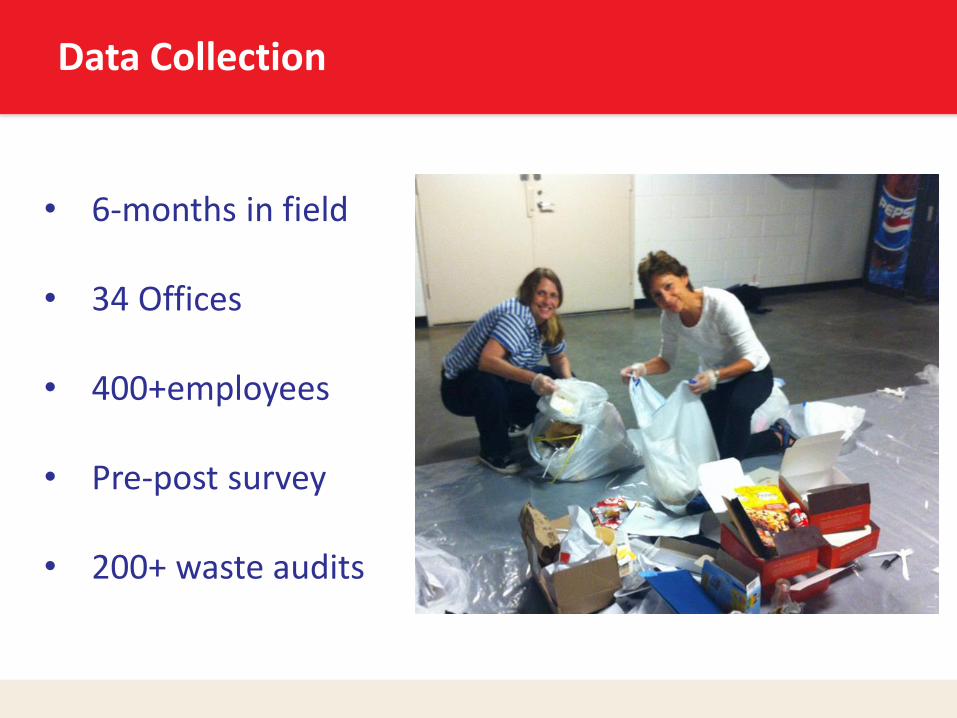
Data Collection
• 6-months in field
• 34 Offices
• 400+employees
• Pre-post survey
• 200+ waste audits
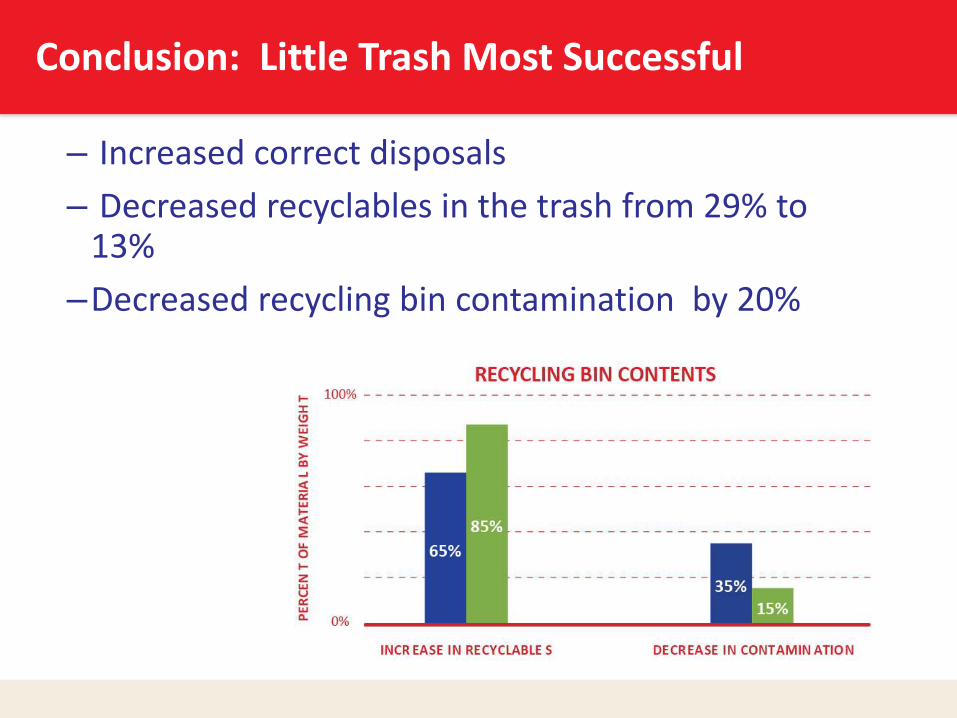
Conclusion: Little Trash Most Successful
– Increased correct disposals
– Decreased recyclables in the trash from 29% to 13%
–Decreased recycling bin contamination by 20%
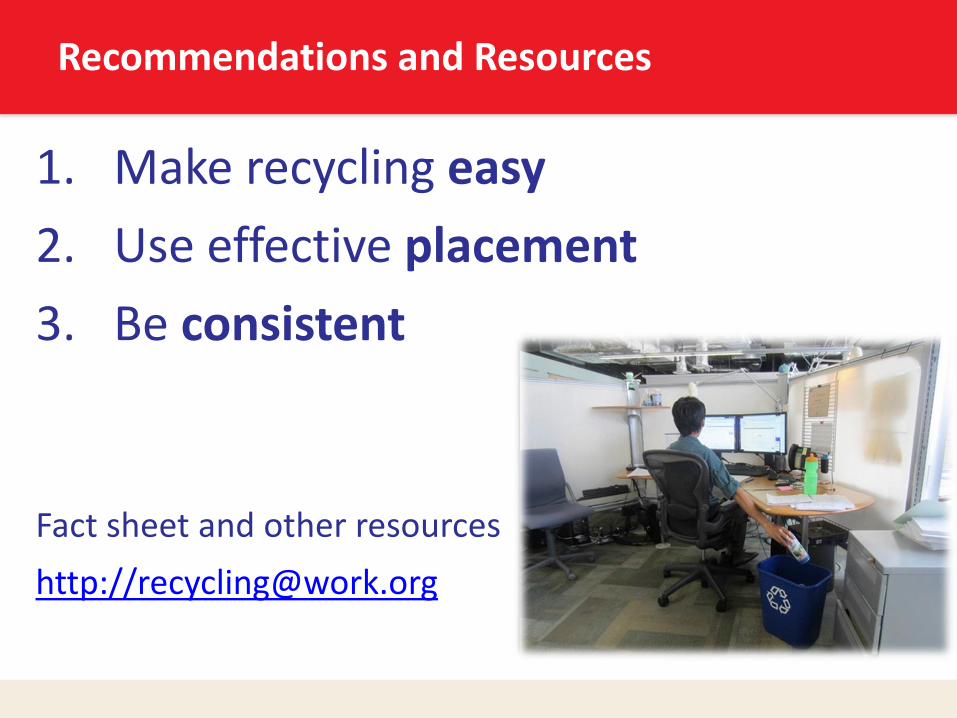
Recommendations and Resources
1. Make recycling easy
2. Use effective placement
3. Be consistent
Fact sheet and other resources
http://[email protected]
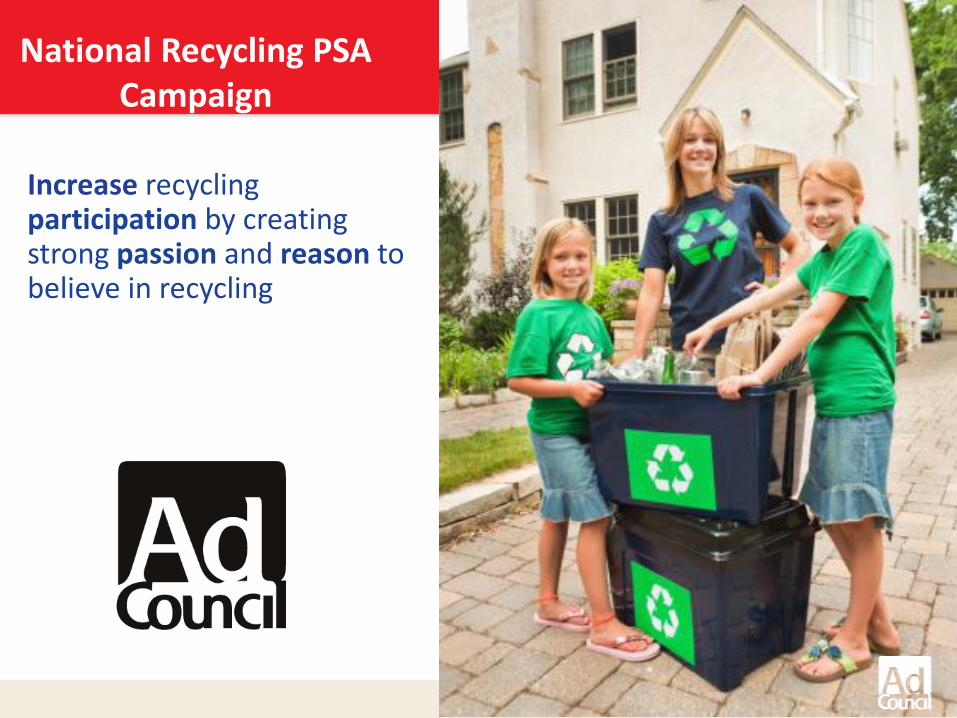
National Recycling PSA Campaign
Increase recycling participation by creating strong passion and reason to believe in recycling
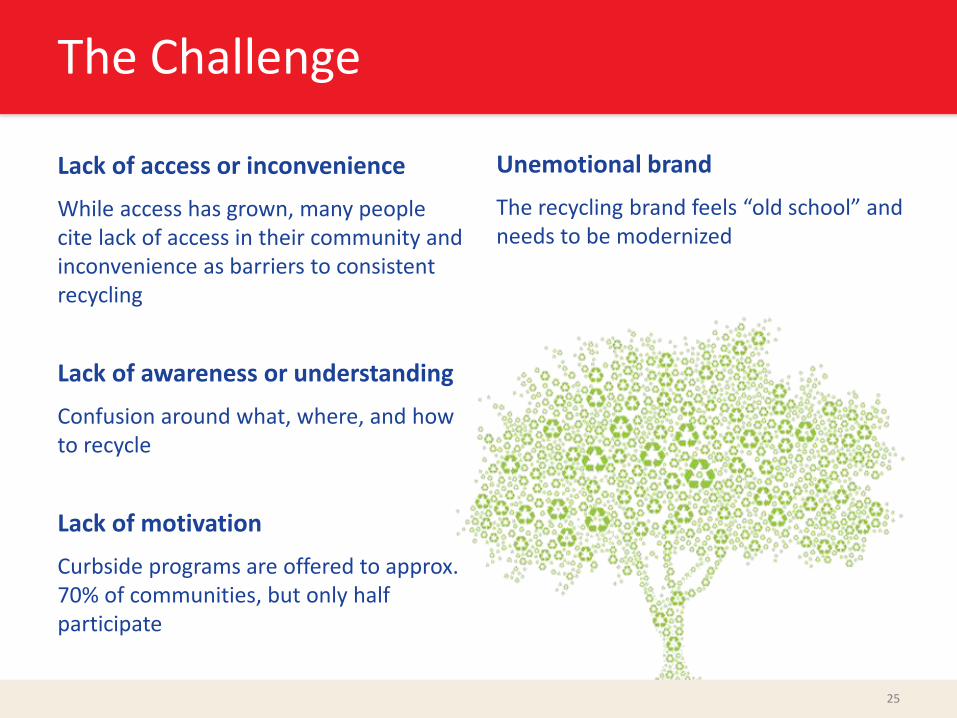
The Challenge
Unemotional brand
The recycling brand feels “old school” and needs to be modernized
25
Lack of access or inconvenience
While access has grown, many people cite lack of access in their community and inconvenience as barriers to consistent recycling
Lack of awareness or understanding
Confusion around what, where, and how to recycle
Lack of motivation
Curbside programs are offered to approx. 70% of communities, but only half participate
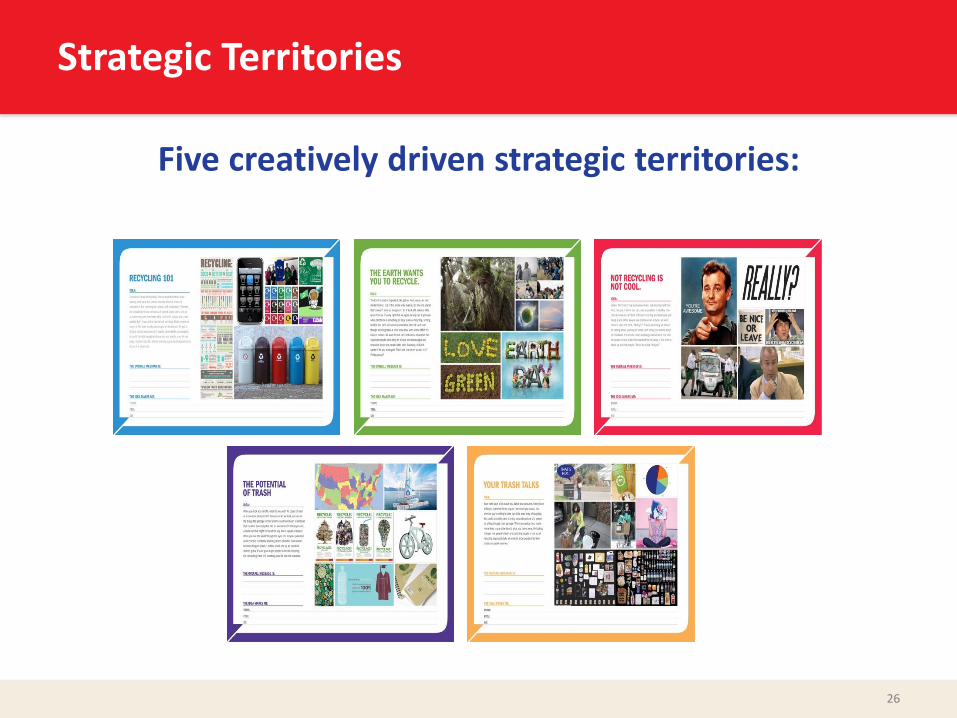
Strategic Territories
Five creatively driven strategic territories:
26
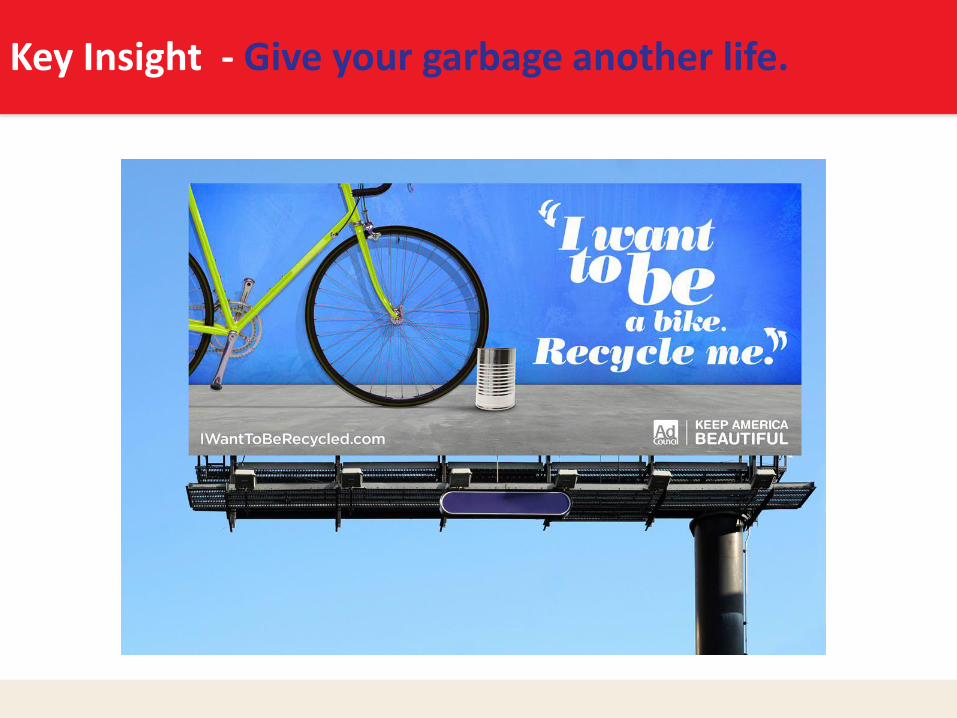
Key Insight - Give your garbage another life.
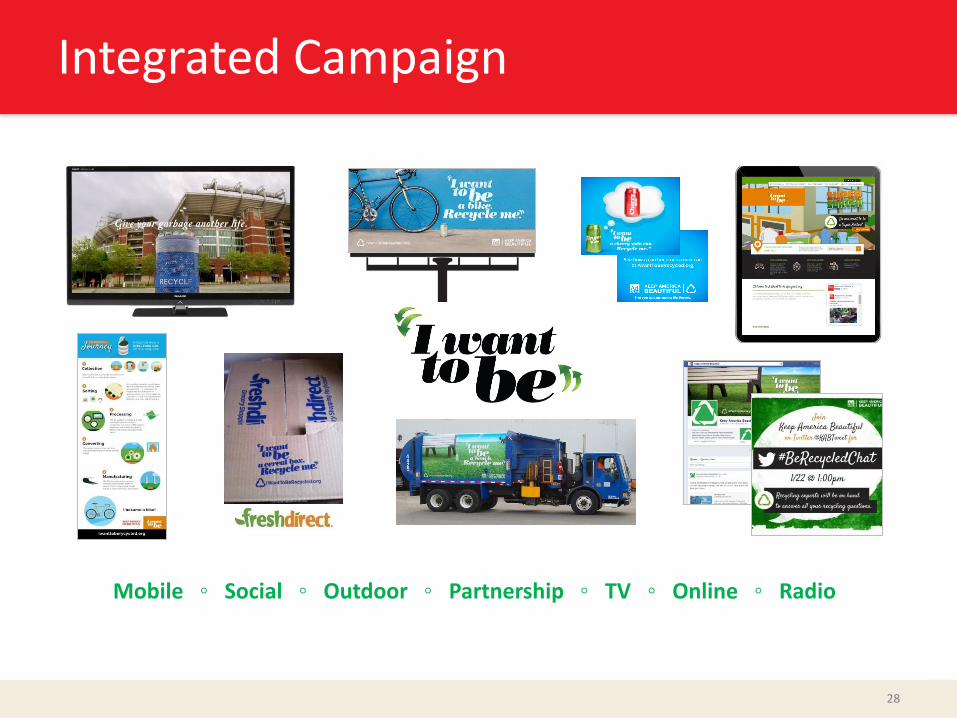
Integrated Campaign
Mobile ◦ Social ◦ Outdoor ◦ Partnership ◦ TV ◦ Online ◦ Radio
28
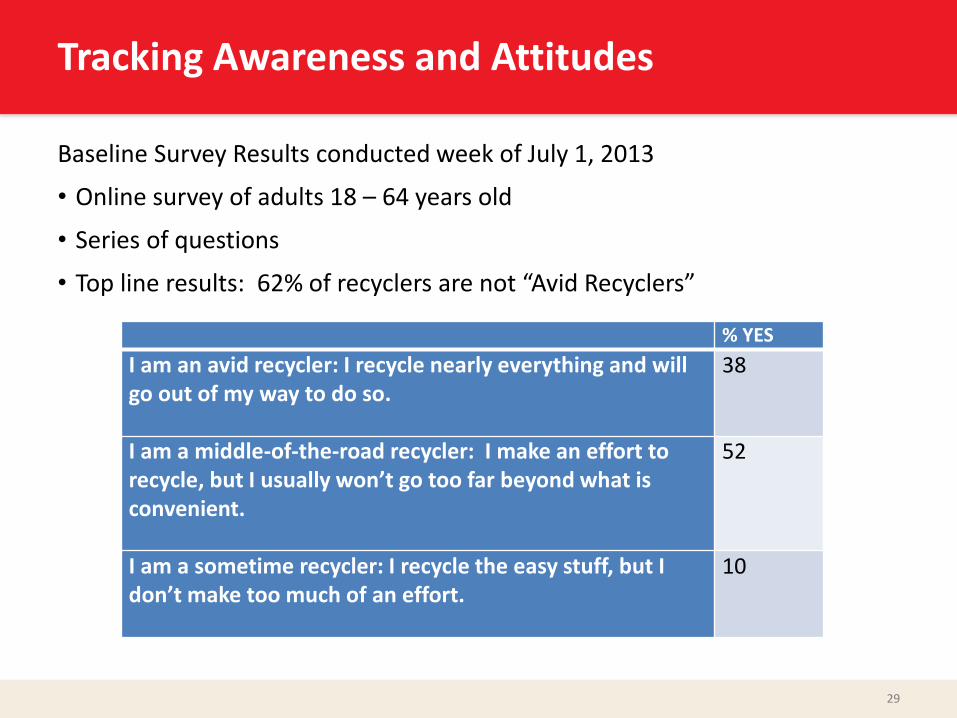
Tracking Awareness and Attitudes
Baseline Survey Results conducted week of July 1, 2013
• Online survey of adults 18 – 64 years old
• Series of questions
• Top line results: 62% of recyclers are not “Avid Recyclers”
29
% YES
I am an avid recycler: I recycle nearly everything and will go out of my way to do so.
38
I am a middle-of-the-road recycler: I make an effort to recycle, but I usually won’t go too far beyond what is convenient.
52
I am a sometime recycler: I recycle the easy stuff, but I don’t make too much of an effort.
10
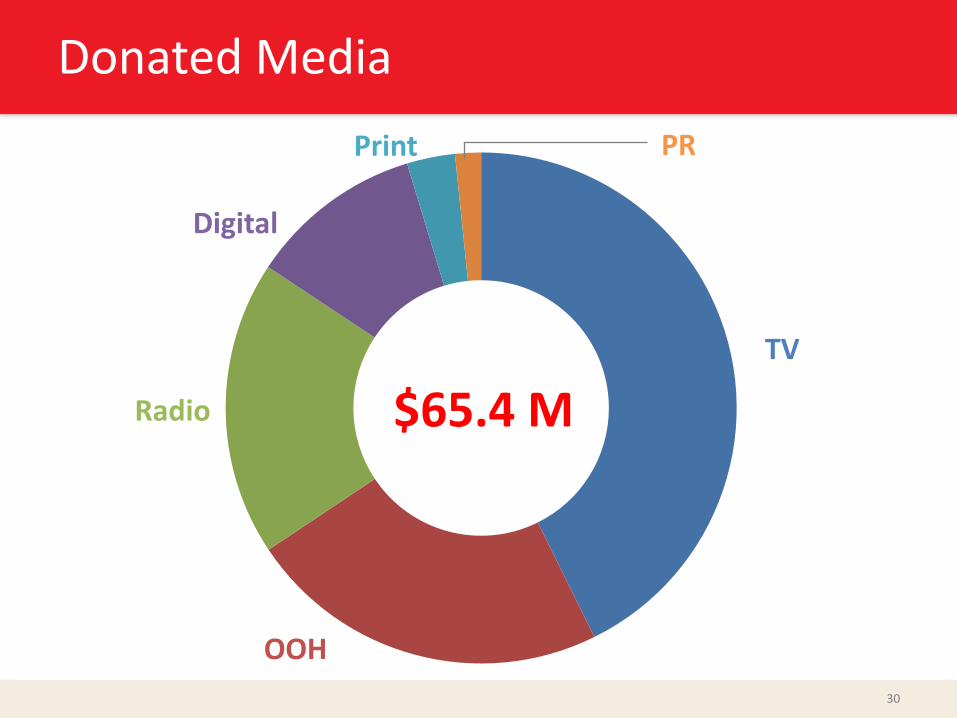
Donated Media
TV
OOH
Radio
Digital
Print PR
$65.4 M
30
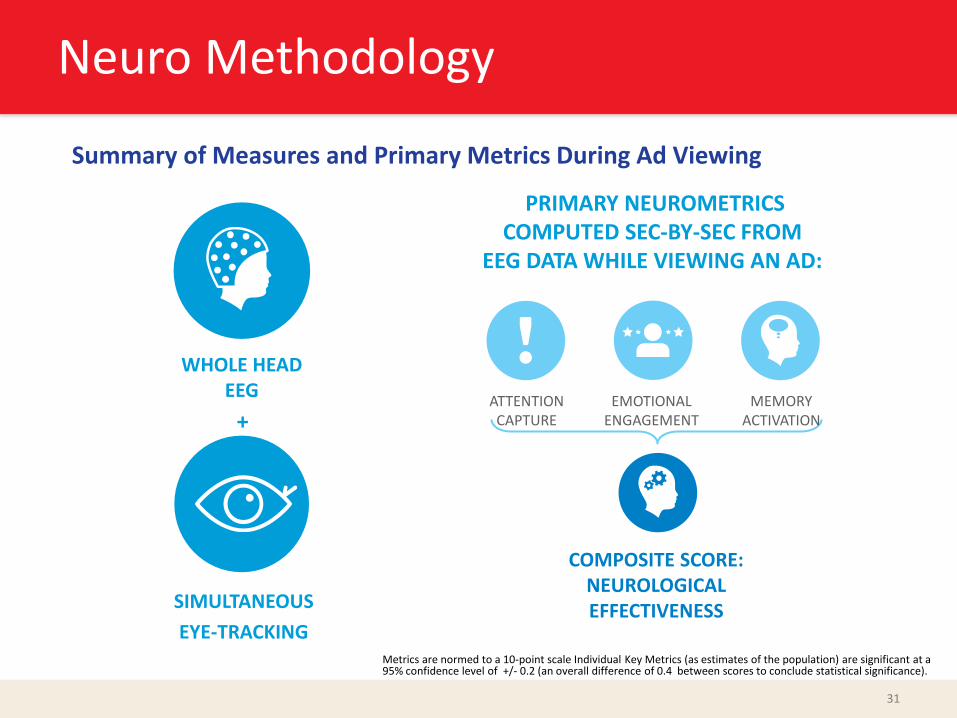
Neuro Methodology
31
Summary of Measures and Primary Metrics During Ad Viewing
WHOLE HEAD EEG
SIMULTANEOUS
EYE-TRACKING
COMPOSITE SCORE: NEUROLOGICAL EFFECTIVENESS
ATTENTION CAPTURE
EMOTIONAL ENGAGEMENT
MEMORY ACTIVATION
PRIMARY NEUROMETRICS COMPUTED SEC-BY-SEC FROM
EEG DATA WHILE VIEWING AN AD:
+
Metrics are normed to a 10-point scale Individual Key Metrics (as estimates of the population) are significant at a 95% confidence level of +/- 0.2 (an overall difference of 0.4 between scores to conclude statistical significance).
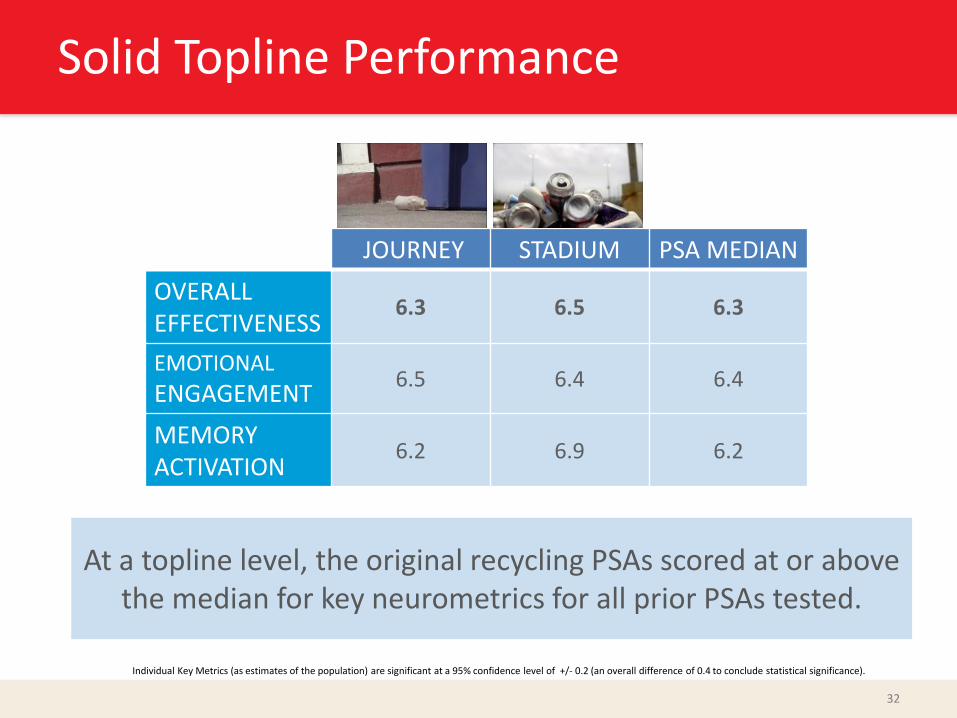
Solid Topline Performance
32
JOURNEY STADIUM PSA MEDIAN
OVERALL EFFECTIVENESS
6.3 6.5 6.3
EMOTIONAL
ENGAGEMENT 6.5 6.4 6.4
MEMORY ACTIVATION
6.2 6.9 6.2
At a topline level, the original recycling PSAs scored at or above the median for key neurometrics for all prior PSAs tested.
Individual Key Metrics (as estimates of the population) are significant at a 95% confidence level of +/- 0.2 (an overall difference of 0.4 to conclude statistical significance).
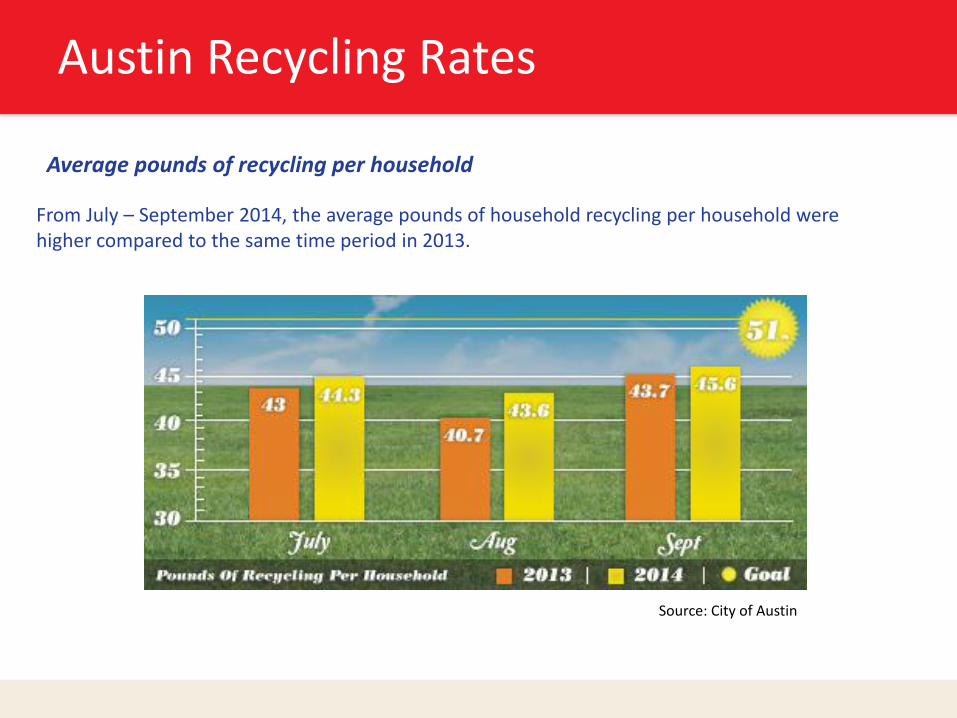
From July – September 2014, the average pounds of household recycling per household were higher compared to the same time period in 2013.
Source: City of Austin
Average pounds of recycling per household
Austin Recycling Rates

TV ad: Smile
34

TV ad: Superhero
35
Conclusions
•Behavioral strategies can make a difference
•Proven through research, testing and evaluation
•No silver bullet
• Identify and overcome barriers, be positive, be consistent
Resources
• America Recycles Day - http://americarecyclesday.org/
• Public Space Infrastructure BMPs
• Recycle-Bowl - http://www.recycle-bowl.org/
• Recycling @Work - http://[email protected]
• National PSA Campaign - www.iwanttoberecycled.org
37