Embed Size (px)
Citation preview

Funded in part by the soybean checkoff
2015 SWCS Conference
July 28, 2015Greensboro, North Carolina
Improved Bioreactor Management through Monitoring of Potential Contaminants
Keegan Kult – Iowa Soybean AssociationMark Dittrich – Minnesota Department of Agriculture
Dr. Robert Hudson – University of Illinois

Mr. Irrelevant
• “Mr. Irrelevant” is the title bestowed each year upon the last pick of the annual National Football League draft. ~Wikipedia

Questions to be answered
• When are contaminants produced?• How much is being produced?• How can bioreactors be manage/designed to
prevent production?

• Removes nitrate-N from field tiles
• Divert water through wood chips
• 30 – 100 acre drainage areas
• Small footprint• 10 – 15 year lifespan
Denitrifying Bioreactors
Image from John Petersen

Hamilton County
2010 2012 2013 2014 Total
Nit
rate
-N L
oa
d,
kg
0
100
200
300
400
500
600
Performance
LWFC
2012 2013 2014 Total
Nit
rate
-N l
oad
, kg
0
250
500
750
1000
1250
Potential Load
Actual Load
Greene County
2009 2010 2011 2012 2013 Total
An
nu
al N
itra
te-N
Lo
ad, k
g
0
250
500
750
1000
1250
To
tal N
itra
te-N
Lo
ad, k
g0
500
1000
1500
2000
2500
3000
20 – 32% 12 – 76%
35 – 42%

• State Nutrient Reduction Strategies– Reduce nitrogen export by
45%– Edge of field practices play
critical role
• ISA has been part of 22 installations
Implementation

NRCS Practice Standard
• Must meet 1 of following criteria– Treat peak flow of 10 yr – 24 hr drain event– 15% of peak flow from drainage system– 60% of ave. annual flow
• 3 hour hydraulic retention time• 30% annual load reduction• Prevent stagnation

• Nitrous oxide (N20)• Hydrogen sulfide (HS)• Methylmercury• Dissolved organic carbon
Potential contaminants
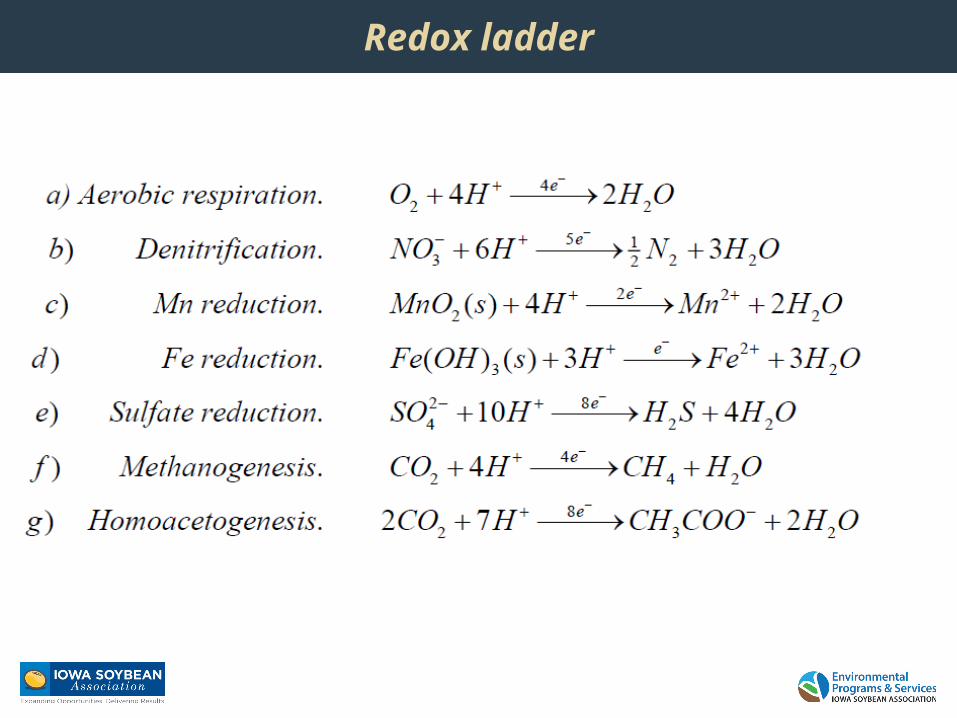
Redox ladder

Minnesota Testing
• Low flow/high temperature conditions• 24 hour HRT• 6 day pump tests• 4 bioreactors• Ideal conditions for methylmercury production

Minnesota sites
County City Year Installed Source Contrib. Area, ac
Bioreactor dimension, ft
Jackson Windom 2009 Lake 58 75 x 10 x 6
Yellow Med. Granite Falls† 2012 River 20 75 x 10 x 6.5
Mower Grand Meadows 2011 Ditch 200 285 x 8 x 5
Stevens Morris‡ 2012 Well 20 60 x 20 x 6
† Four chambered control structure‡ Treat all – No bypass

Methylmercury
Minnesota Bioreactors
Site
GMD GRF MRS WND
Met
hylm
ercu
ry g
ener
atat
ed,
ng/L
-2.0
-1.5
-1.0
-0.5
0.0
0.5
1.0

Iowa sites
Bioreactor Year Installed Drainage area, ac Bioreactor dimension, ft
Greene 2008 47 50 x 25
Hamilton 2009 50 100 x 10
LWFC 2011 45 126 x 31

Methylmercury cont.
2012 Iowa Bioreactors
Site
Greene Hamilton LWFC
Met
hylm
ercu
ry g
ene
rate
d,
ng/
L
0.00
0.05
0.10
0.15
0.20
0.25
20 hr HRT38 hr HRT
71 hr HRT

Illinois sites
Bioreactor Year Installed Drainage area, ac Bioreactor dimension, ft
Deland North Fall 2009 7 56 x 10
Deland South Fall 2007 3 93 x 10
Monticello Fall 2008 15 40 x 10

Methylmercury cont.
Illinois Bioreactors
2013
Feb Mar Apr May Jun
Met
hylm
erc
ury
gene
rate
d, n
g/L
0.000
0.005
0.010
0.015
0.020
0.025
0.030
Deland North Deland South Monticello

Nitrous oxide
Minnesota Bioreactors
Site
GMD GRF MRS WND
Ave
rage
N2O
pro
duce
d, m
g/L
-0.04
-0.03
-0.02
-0.01
0.00
0.01
0.02
0.03
0.04

Nitrous oxide
Bioreactor Measured IC molarity change
Predicted IC molarity change
Greene 0.62 0.94
Hamilton 1.03 1.28
LWFC 0.97 0.75
UWFC 0.50 0.67
LEC 2 0.55 0.56
4NO3- + 5CH2O → 2N2(g) + 4HCO3
- + H+ +2H2O (denitrification)

Total organic carbon
Bioreactor Influent TOC, mg/L (n) Effluent TOC, mg/L (n)Greene 3.1 (23) 6.4 (23)
Hamilton 3.4 (21) 5.7 (21)
LWFC 3.1 (24) 14.0 (23)
UWFC 3.2 (30) 11.4 (29)
LEC 2 3.9 (29) 13.7 (29)

• Observed MeHg ≤0.20 ng/L • Evidence N2O production
possible• TOC average ranges of 5.7
– 14 mg/L
Summary

• Match bioreactors to tiles with consistent flows
• Periodic monitoring• High nitrate tiles• Remove stop logs in late
July• Manage for at least 3 to 4
hr HRT
Recommendations

Recommendations cont.
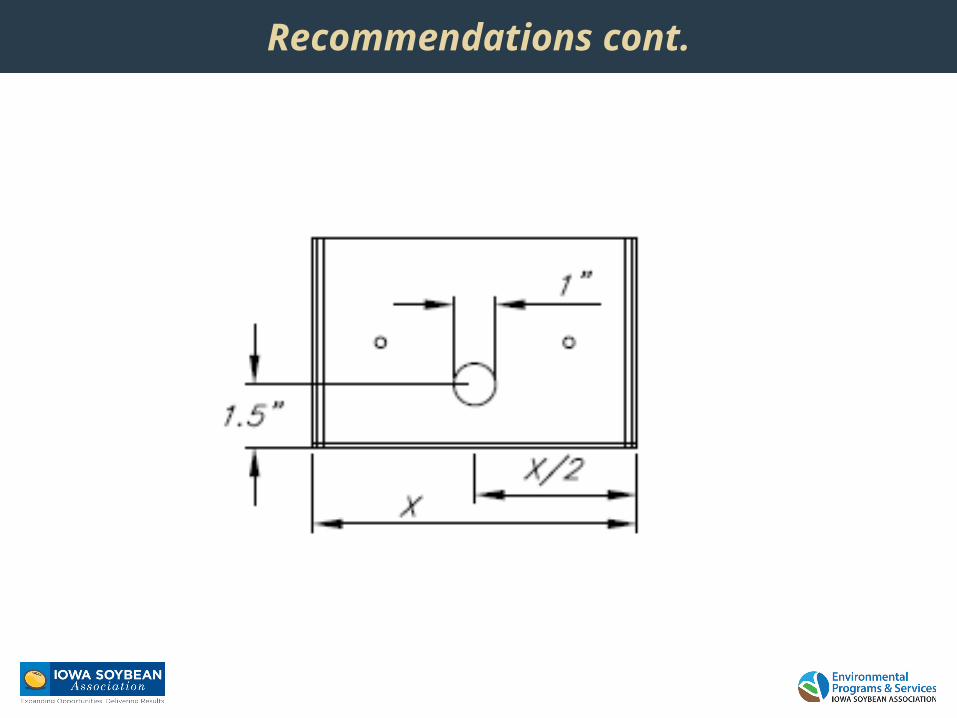
Recommendations cont.

Acknowledgements
• Minnesota Department of Agriculture and the University of Minnesota• University of Illinois with data collected by Dr. Richard Cooke and Todd Oleson• Farmer partners
This material is based upon work supported by the Natural Resources Conservation Service, U.S. Department of Agriculture, under number 69-3A75-11-190. Any opinions, finding, and conclusions or recommendations expressed in this material are those of the authors and do not necessarily reflect the views of the U.S. Department of Agriculture.