Embed Size (px)
Citation preview
www.TransformingTransportation.org
The Global Commission on the
Economy and Climate
Felipe Calderón
Chair, Global Commission on the Economy
and Climate
Presented at Transforming Transportation 2015
1
1
THE GLOBAL COMMISSION ON THE ECONOMY AND CLIMATE
Felipe Calderón, Washington D.C., 15 January 2015
2
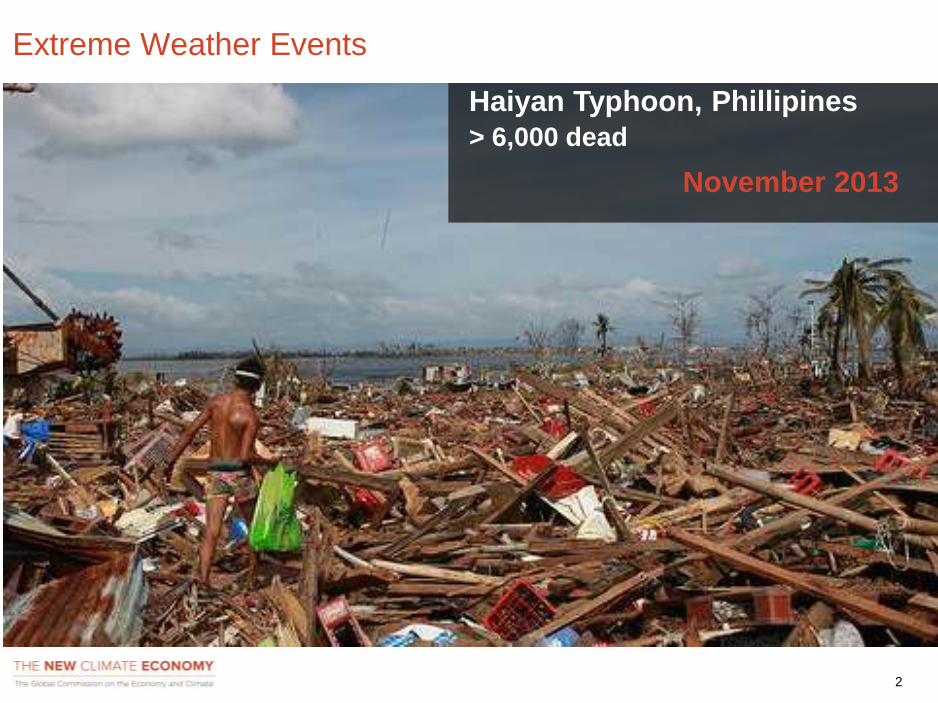
Extreme Weather Events
Haiyan Typhoon, Phillipines
> 6,000 dead
November 2013
3
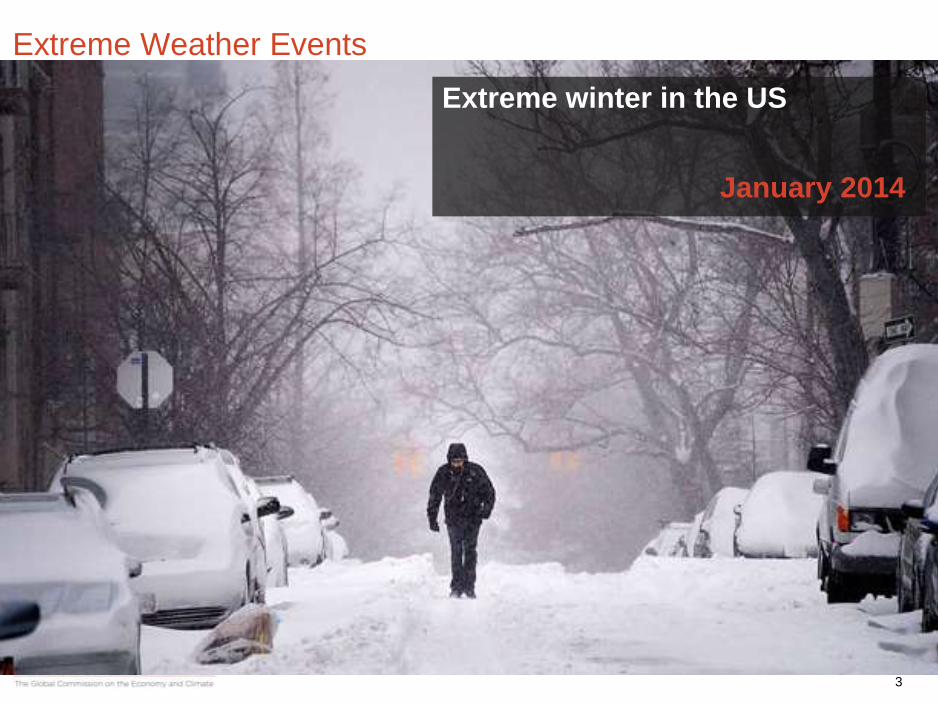
Extreme winter in the US
January 2014
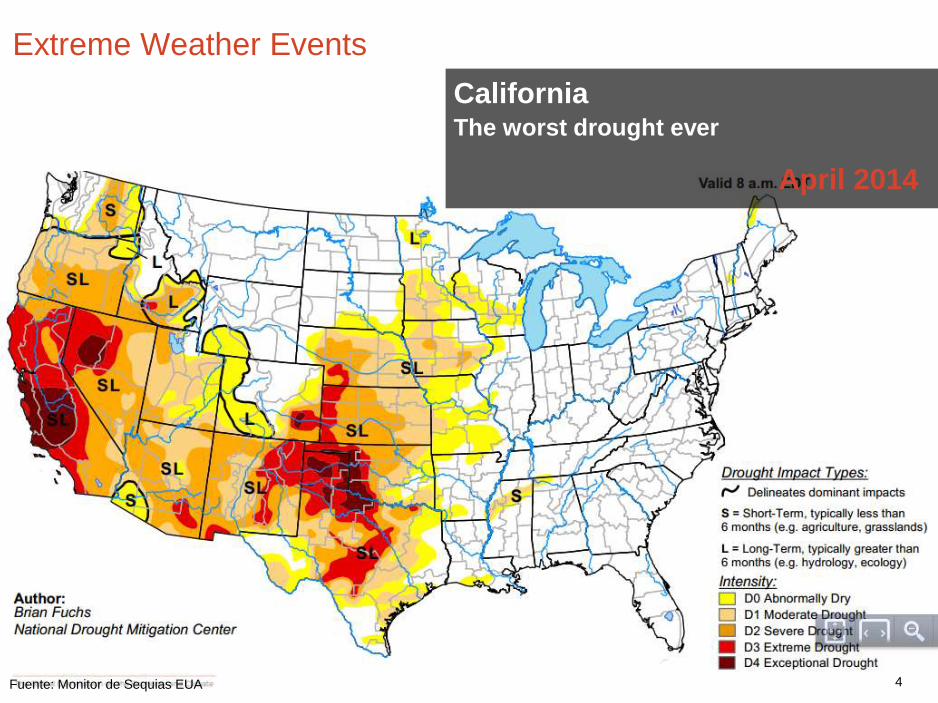
Extreme Weather Events
4
CaliforniaThe worst drought ever
April 2014
Fuente: Monitor de Sequias EUA
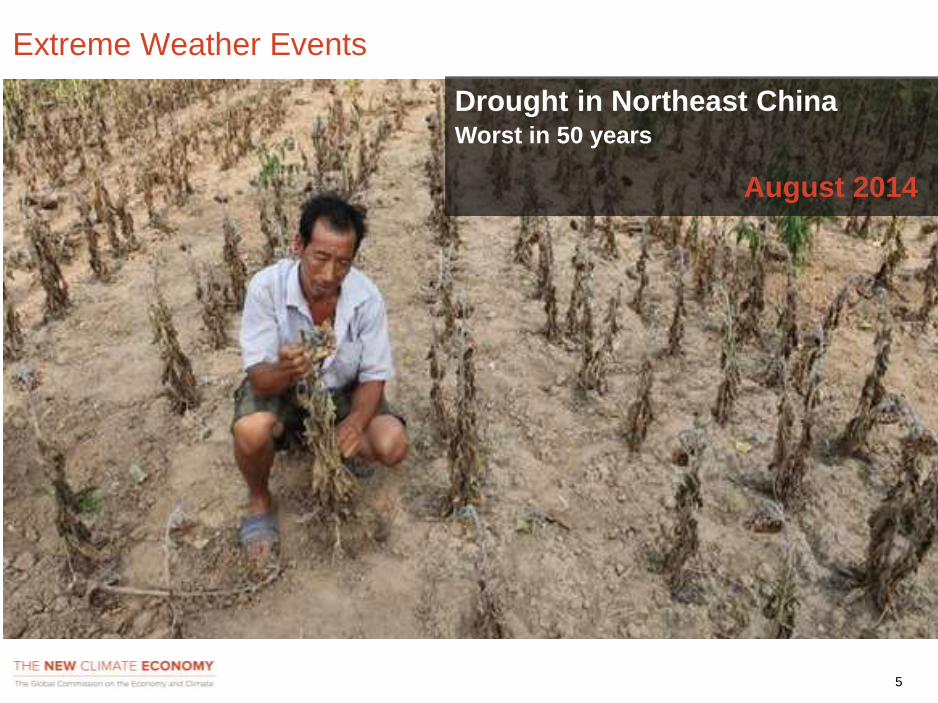
Extreme Weather Events
5
Drought in Northeast ChinaWorst in 50 years
August 2014
Extreme Weather Events
6
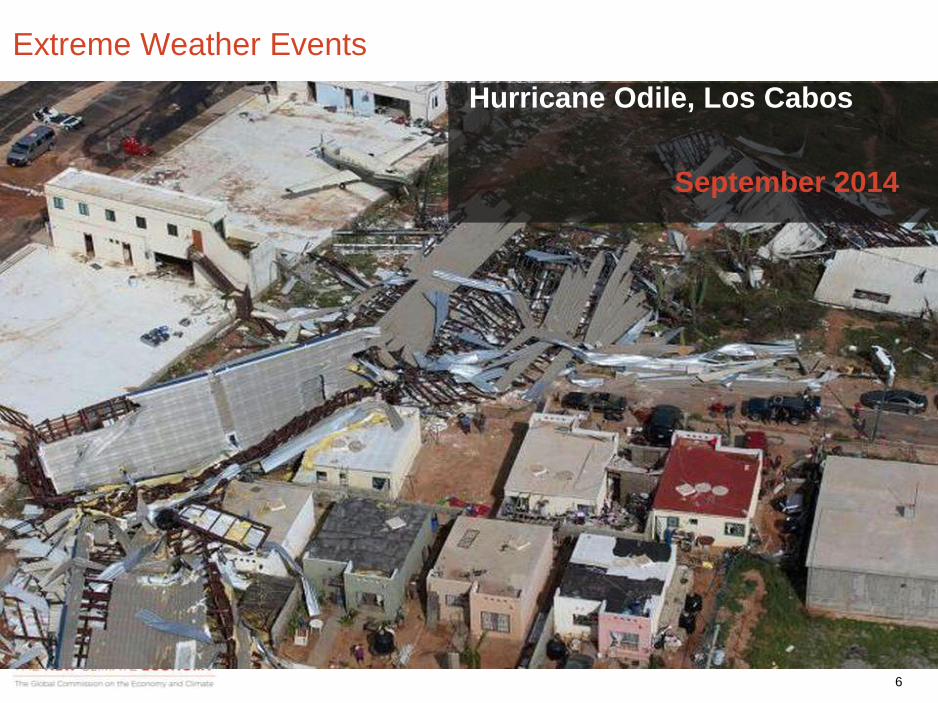
Extreme Weather Events
Hurricane Odile, Los Cabos
September 2014
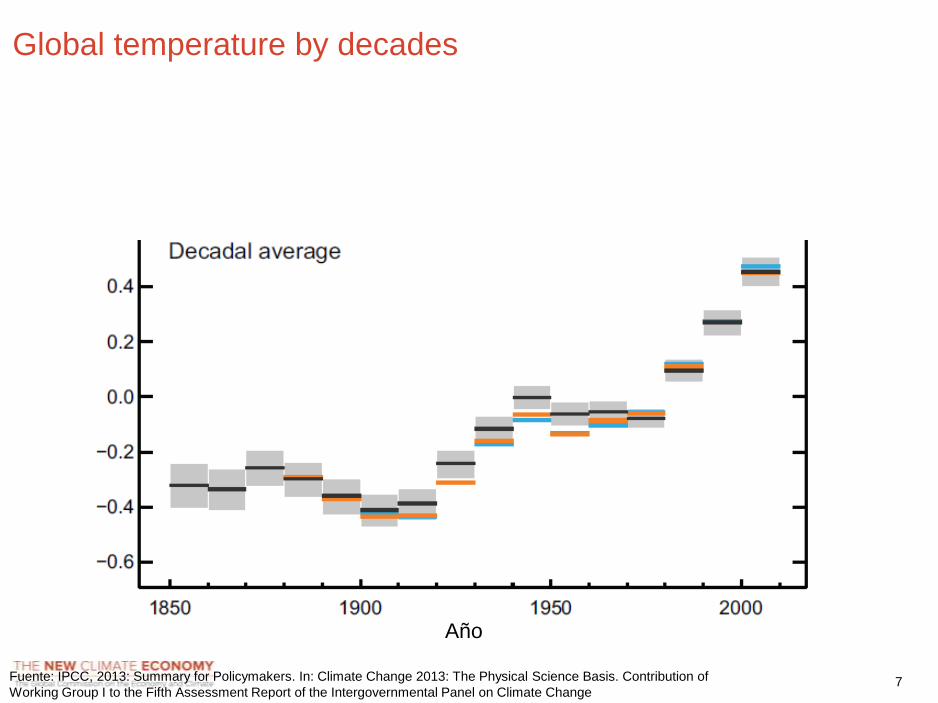
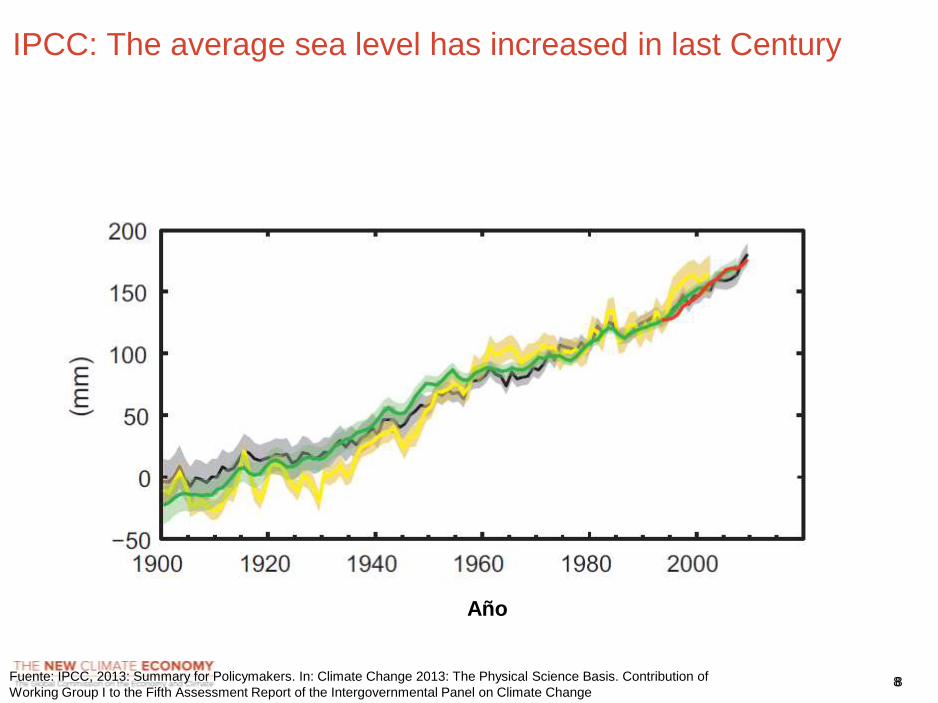
7Fuente: IPCC, 2013: Summary for Policymakers. In: Climate Change 2013: The Physical Science Basis. Contribution of
Working Group I to the Fifth Assessment Report of the Intergovernmental Panel on Climate Change
Año
Global temperature by decades
88Fuente: IPCC, 2013: Summary for Policymakers. In: Climate Change 2013: The Physical Science Basis. Contribution of
Working Group I to the Fifth Assessment Report of the Intergovernmental Panel on Climate Change
IPCC: The average sea level has increased in last Century
Año
99
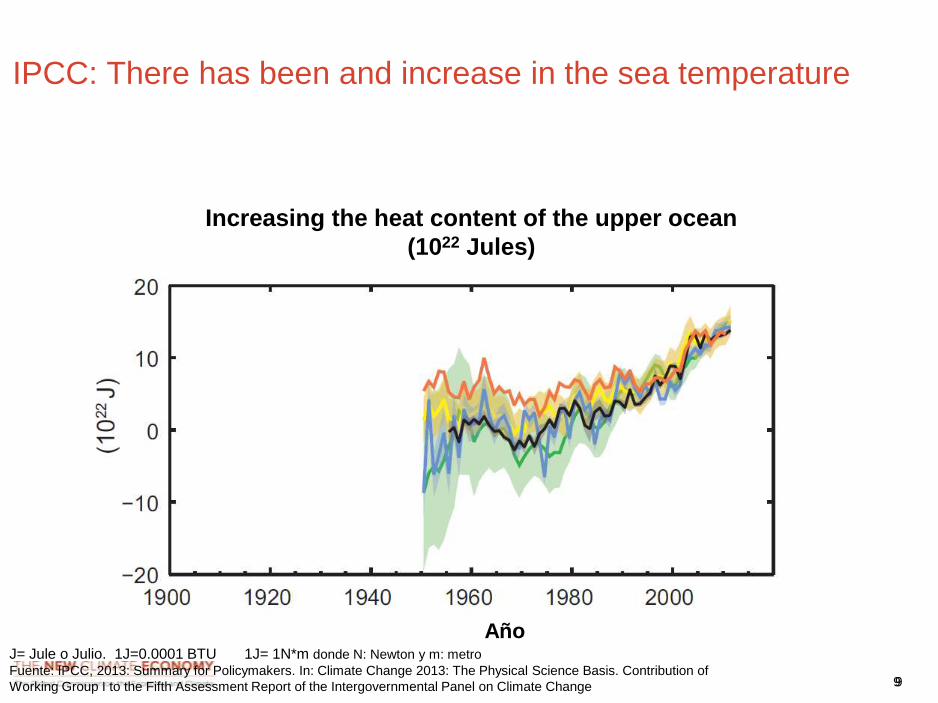
J= Jule o Julio. 1J=0.0001 BTU 1J= 1N*m donde N: Newton y m: metro
Fuente: IPCC, 2013: Summary for Policymakers. In: Climate Change 2013: The Physical Science Basis. Contribution of
Working Group I to the Fifth Assessment Report of the Intergovernmental Panel on Climate Change
Increasing the heat content of the upper ocean
(1022 Jules)
IPCC: There has been and increase in the sea temperature
Año
1010
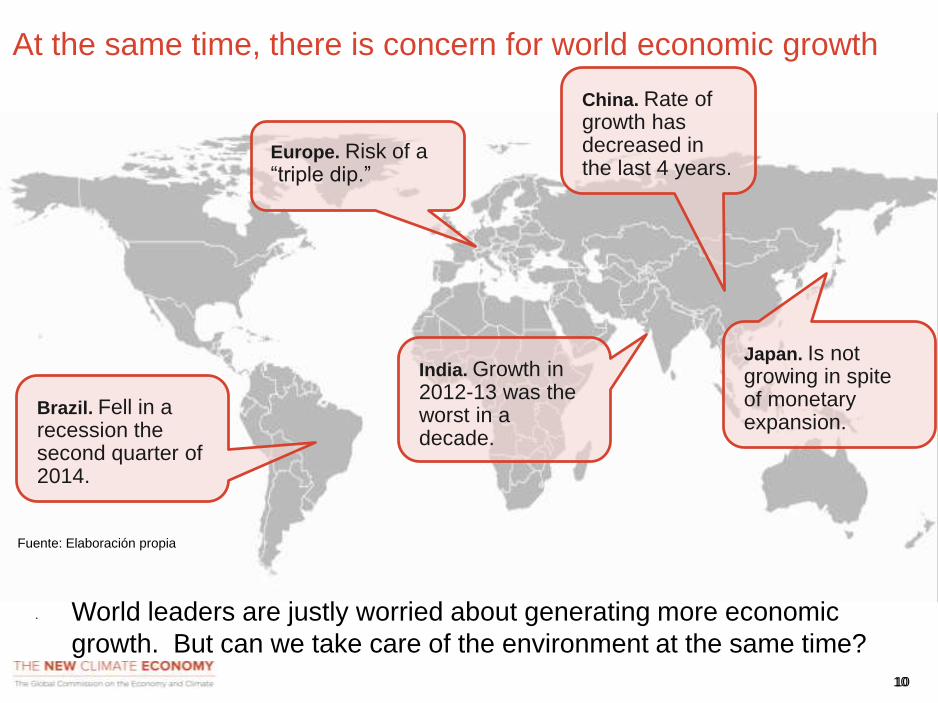
At the same time, there is concern for world economic growth
Europe. Risk of a “triple dip.”
Brazil. Fell in a recession the second quarter of 2014.
China. Rate of growth has decreased in the last 4 years.
Japan. Is not growing in spite of monetary expansion.
India. Growth in 2012-13 was the worst in a decade.
Fuente: Elaboración propia
• World leaders are justly worried about generating more economic
growth. But can we take care of the environment at the same time?

11
12
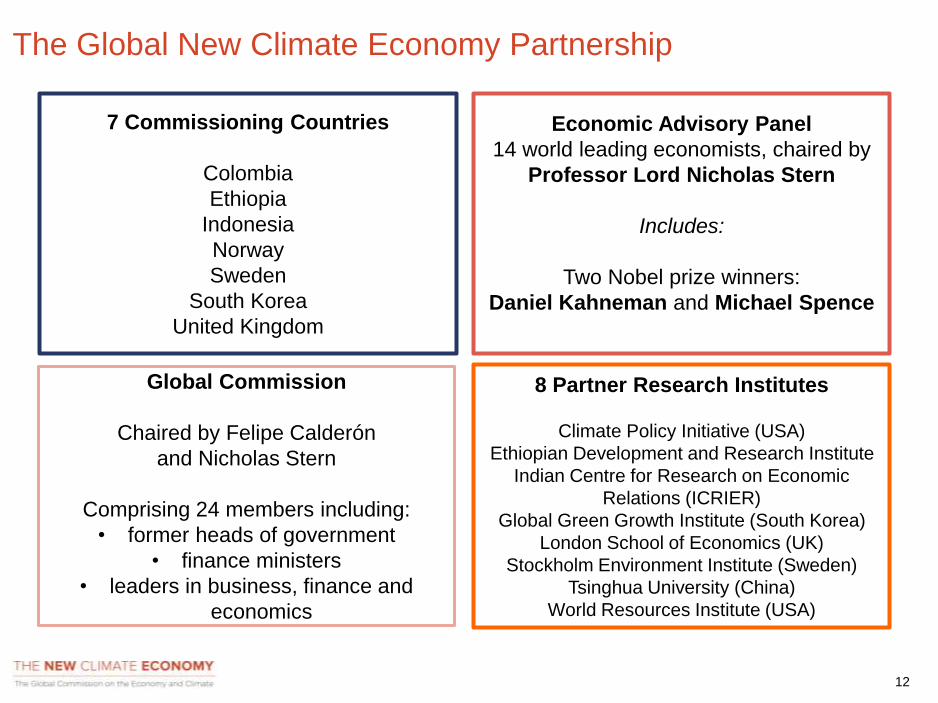
The Global New Climate Economy Partnership
Global Commission
Chaired by Felipe Calderón
and Nicholas Stern
Comprising 24 members including:
• former heads of government
• finance ministers
• leaders in business, finance and
economics
Economic Advisory Panel
14 world leading economists, chaired by
Professor Lord Nicholas Stern
Includes:
Two Nobel prize winners:
Daniel Kahneman and Michael Spence
7 Commissioning Countries
Colombia
Ethiopia
Indonesia
Norway
Sweden
South Korea
United Kingdom
8 Partner Research Institutes
Climate Policy Initiative (USA)
Ethiopian Development and Research Institute
Indian Centre for Research on Economic
Relations (ICRIER)
Global Green Growth Institute (South Korea)
London School of Economics (UK)
Stockholm Environment Institute (Sweden)
Tsinghua University (China)
World Resources Institute (USA)
13
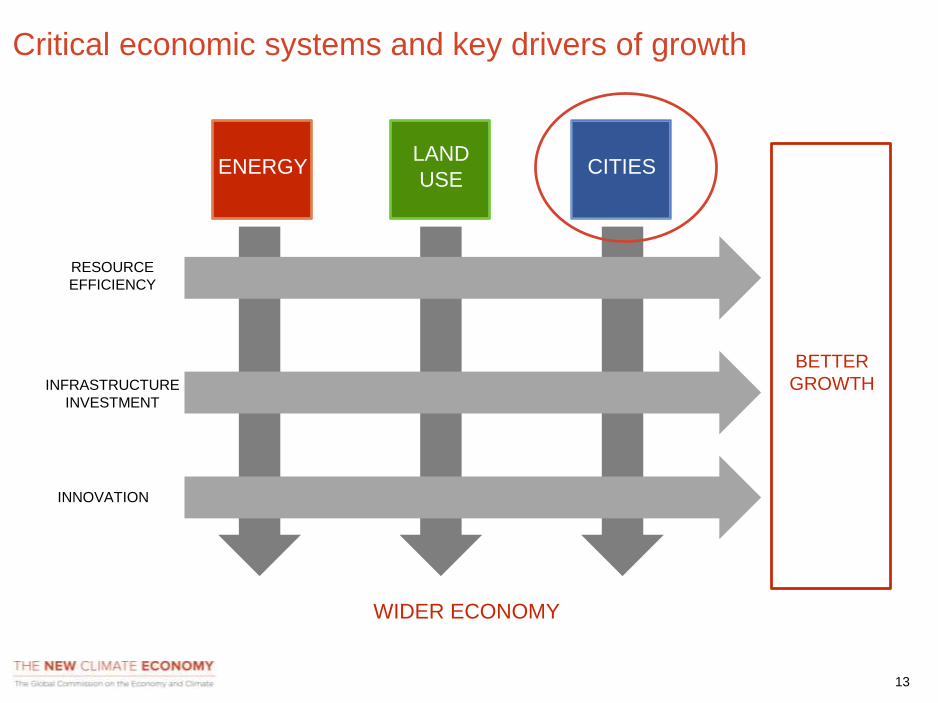
CITIESLAND
USEENERGY
RESOURCE
EFFICIENCY
INFRASTRUCTURE
INVESTMENT
INNOVATION
WIDER ECONOMY
BETTER
GROWTH
Critical economic systems and key drivers of growth
14
14
1. Energy
Critical economic systems
15
0
50
100
150
200
250
300
350
400
450
500
550
600
2005 2010 2015 2020
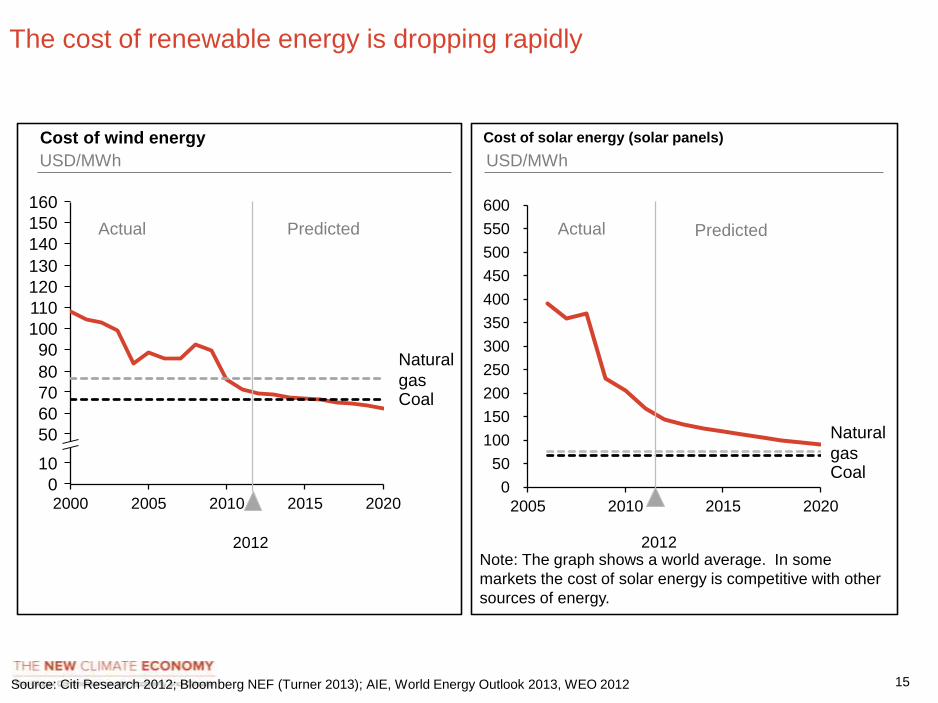
Source: Citi Research 2012; Bloomberg NEF (Turner 2013); AIE, World Energy Outlook 2013, WEO 2012
Cost of wind energy
USD/MWh
2000 2005 2010 2015 2020
150
100
90
160
140
130
120
110
50
70
60
80
10
0
Coal
Natural
gas
Cost of solar energy (solar panels)
USD/MWh
Actual Predicted Actual Predicted
2012 2012Note: The graph shows a world average. In some
markets the cost of solar energy is competitive with other
sources of energy.
The cost of renewable energy is dropping rapidly
Coal
Natural
gas
16
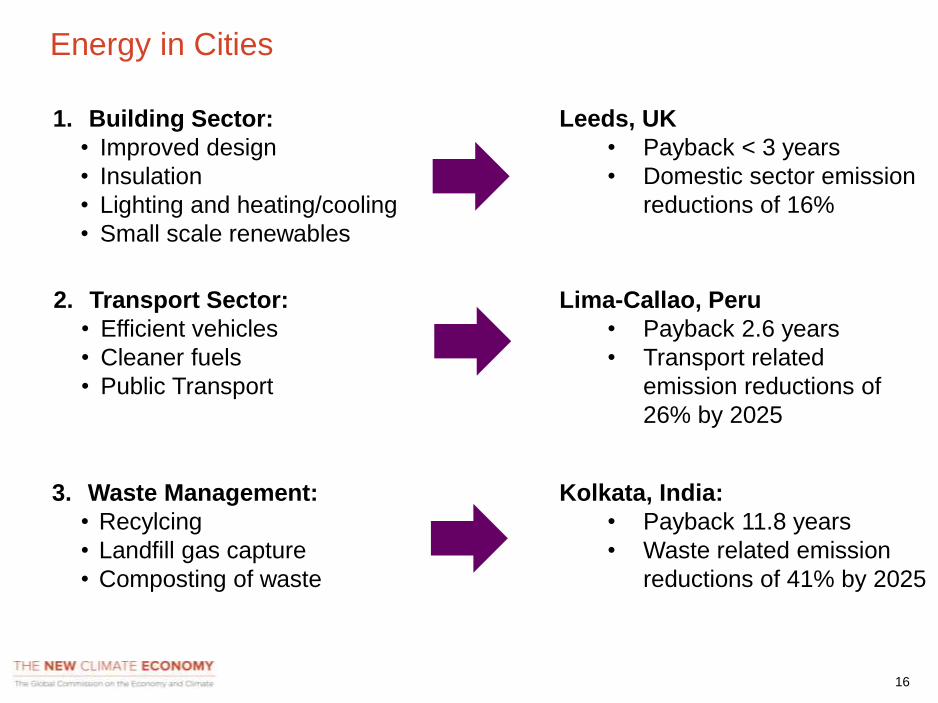
Energy in Cities
1. Building Sector:
• Improved design
• Insulation
• Lighting and heating/cooling
• Small scale renewables
Leeds, UK
• Payback < 3 years
• Domestic sector emission
reductions of 16%
2. Transport Sector:
• Efficient vehicles
• Cleaner fuels
• Public Transport
3. Waste Management:
• Recylcing
• Landfill gas capture
• Composting of waste
Lima-Callao, Peru
• Payback 2.6 years
• Transport related
emission reductions of
26% by 2025
Kolkata, India:
• Payback 11.8 years
• Waste related emission
reductions of 41% by 2025
17
17
2. Land Use
Critical economic systems
18
18
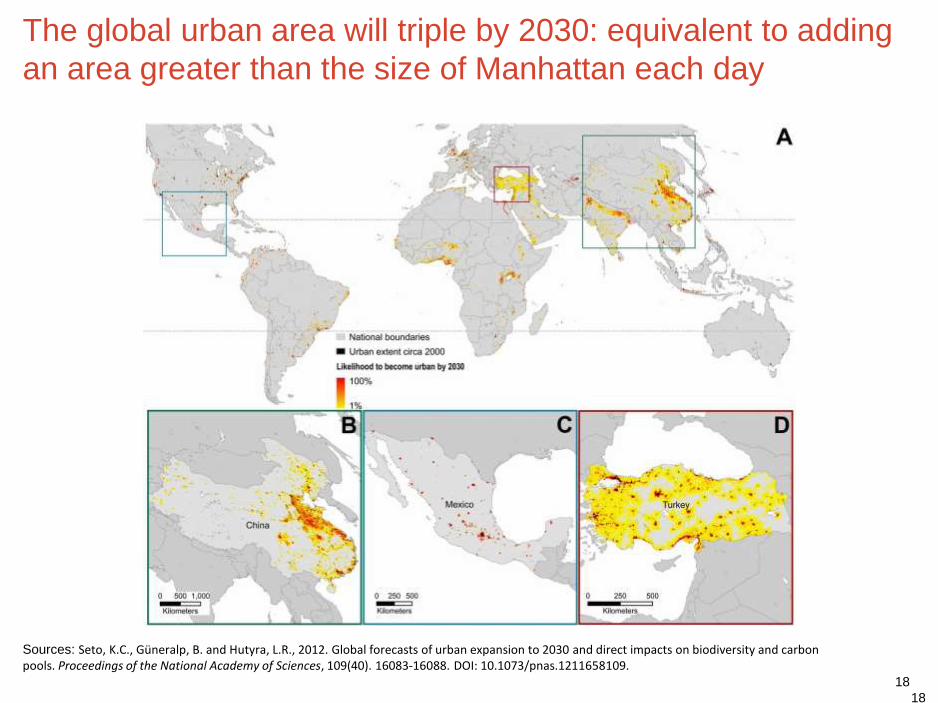
Sources: Seto, K.C., Güneralp, B. and Hutyra, L.R., 2012. Global forecasts of urban expansion to 2030 and direct impacts on biodiversity and carbon pools. Proceedings of the National Academy of Sciences, 109(40). 16083-16088. DOI: 10.1073/pnas.1211658109.
The global urban area will triple by 2030: equivalent to adding
an area greater than the size of Manhattan each day
19
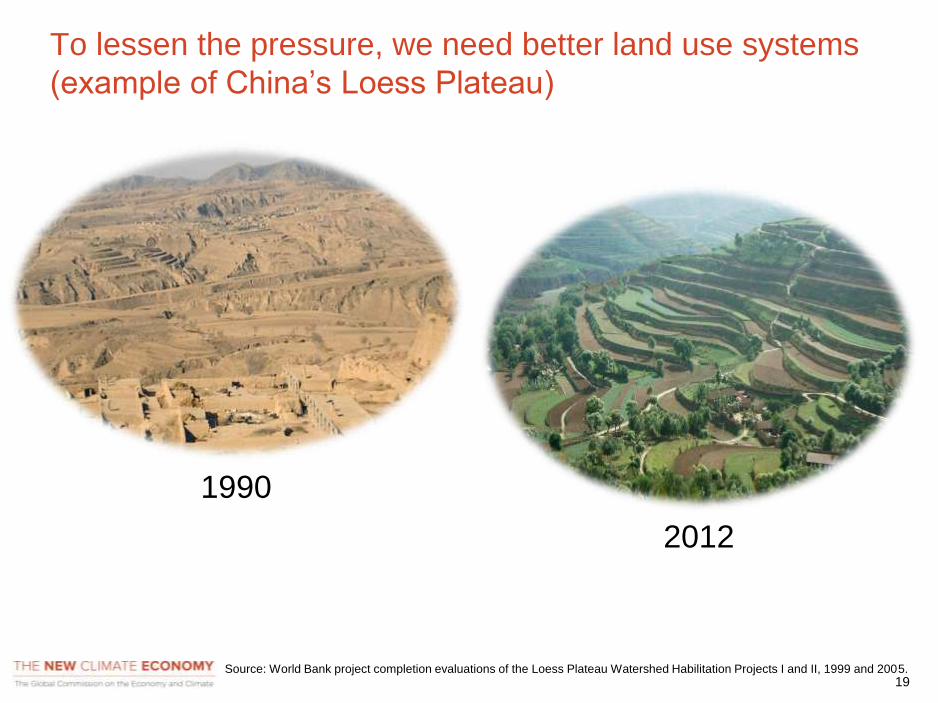
To lessen the pressure, we need better land use systems
(example of China’s Loess Plateau)
1990
2012
Source: World Bank project completion evaluations of the Loess Plateau Watershed Habilitation Projects I and II, 1999 and 2005.
20
20
3. Cities
Moving to a more compact model
Critical economic systems
2121
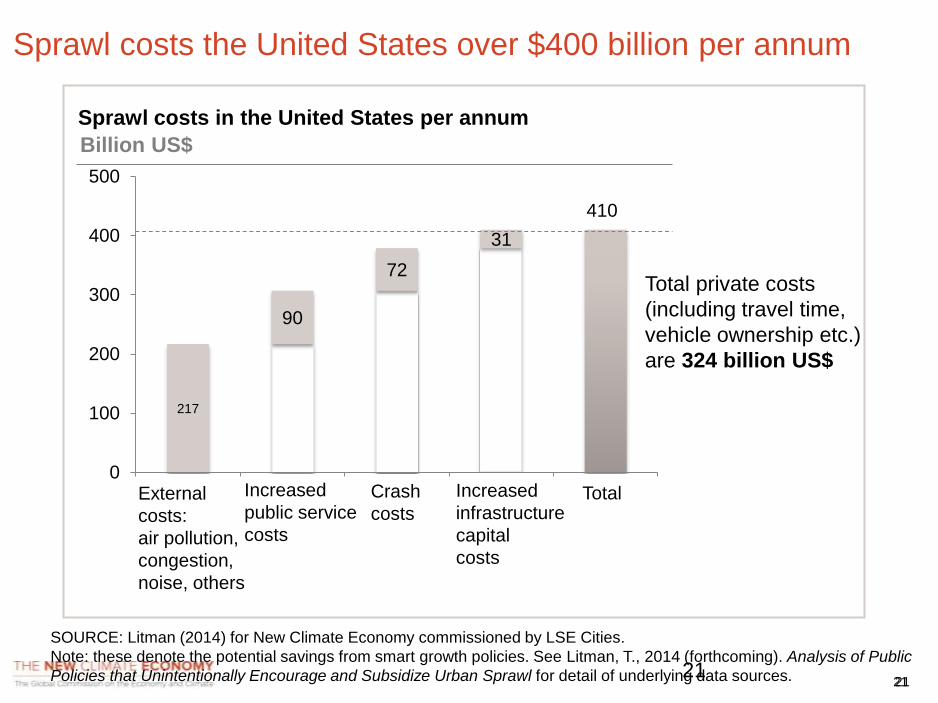
Sprawl costs the United States over $400 billion per annum
21
Sprawl costs in the United States per annum
Billion US$
SOURCE: Litman (2014) for New Climate Economy commissioned by LSE Cities.
Note: these denote the potential savings from smart growth policies. See Litman, T., 2014 (forthcoming). Analysis of Public
Policies that Unintentionally Encourage and Subsidize Urban Sprawl for detail of underlying data sources.
External
costs:
air pollution,
congestion,
noise, others
217
90
72
31
0
100
200
300
400
500
Increased
public service
costs
Crash
costs
Increased
infrastructure
capital
costs
Total
410
Total private costs
(including travel time,
vehicle ownership etc.)
are 324 billion US$
2222
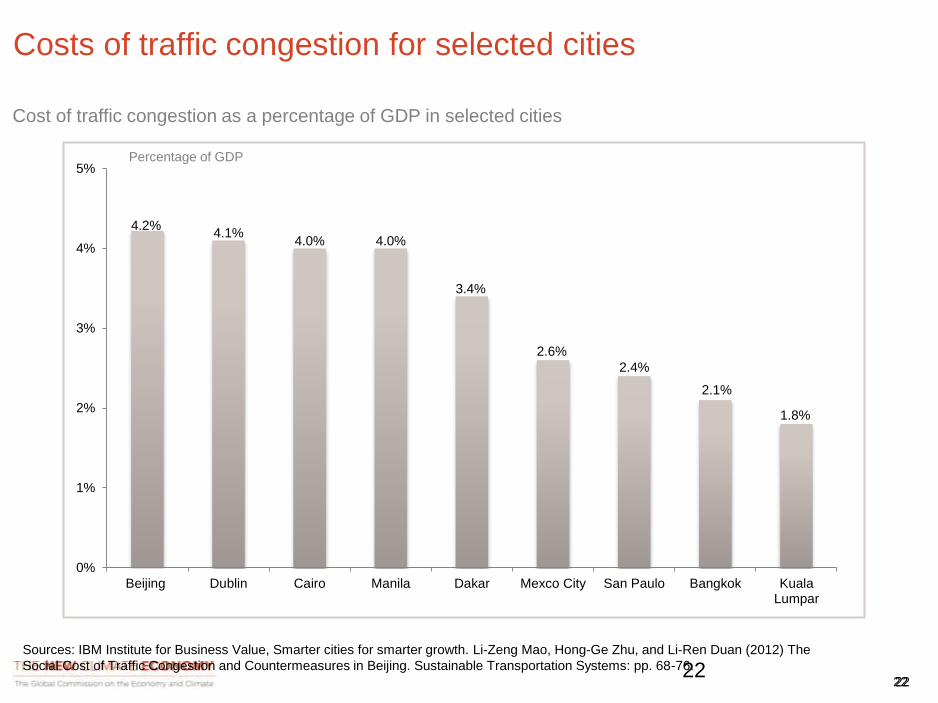
Costs of traffic congestion for selected cities
22
Cost of traffic congestion as a percentage of GDP in selected cities
Sources: IBM Institute for Business Value, Smarter cities for smarter growth. Li-Zeng Mao, Hong-Ge Zhu, and Li-Ren Duan (2012) The
Social Cost of Traffic Congestion and Countermeasures in Beijing. Sustainable Transportation Systems: pp. 68-76.
Percentage of GDP
4.2%4.1%
4.0% 4.0%
3.4%
2.6%
2.4%
2.1%
1.8%
0%
1%
2%
3%
4%
5%
Beijing Dublin Cairo Manila Dakar Mexco City San Paulo Bangkok KualaLumpar
23
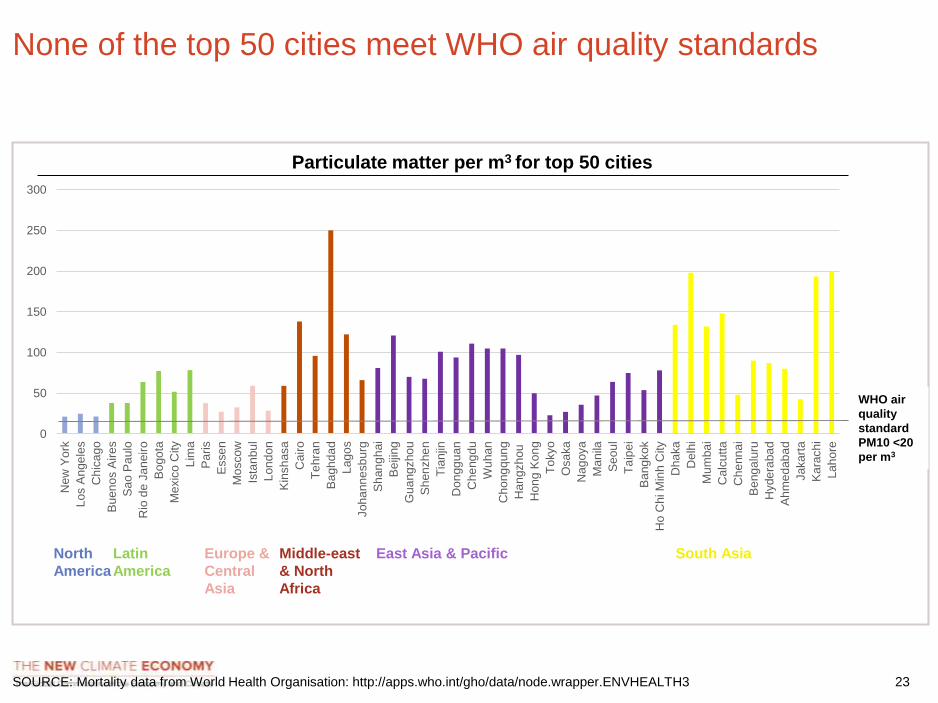
None of the top 50 cities meet WHO air quality standards
0
50
100
150
200
250
300
New
Yo
rk
Los A
nge
les
Ch
ica
go
Bu
en
os A
ire
s
Sa
o P
au
lo
Rio
de
Ja
neir
o
Bo
go
ta
Me
xic
o C
ity
Lim
a
Pa
ris
Esse
n
Mo
sco
w
Ista
nbu
l
Lon
do
n
Kin
sh
asa
Cair
o
Te
hra
n
Ba
gh
da
d
Lag
os
Joh
ann
esb
urg
Sh
an
gh
ai
Be
ijing
Gu
ang
zho
u
Sh
en
zhe
n
Tia
njin
Don
gg
uan
Che
ng
du
Wu
ha
n
Cho
ng
qun
g
Ha
ngzh
ou
Hon
g K
on
g
To
kyo
Osa
ka
Nag
oya
Ma
nila
Se
ou
l
Ta
ipe
i
Ba
ng
kok
Ho C
hi M
inh
City
Dha
ka
Delh
i
Mu
mba
i
Ca
lcu
tta
Che
nn
ai
Be
ng
alu
ru
Hyde
raba
d
Ah
me
dab
ad
Jakart
a
Ka
rach
i
Lah
ore
North
America
Latin
America
Europe &
Central
Asia
Middle-east
& North
Africa
East Asia & Pacific South Asia
WHO air
quality
standard
PM10 <20
per m3
Particulate matter per m3 for top 50 cities
SOURCE: Mortality data from World Health Organisation: http://apps.who.int/gho/data/node.wrapper.ENVHEALTH3
24
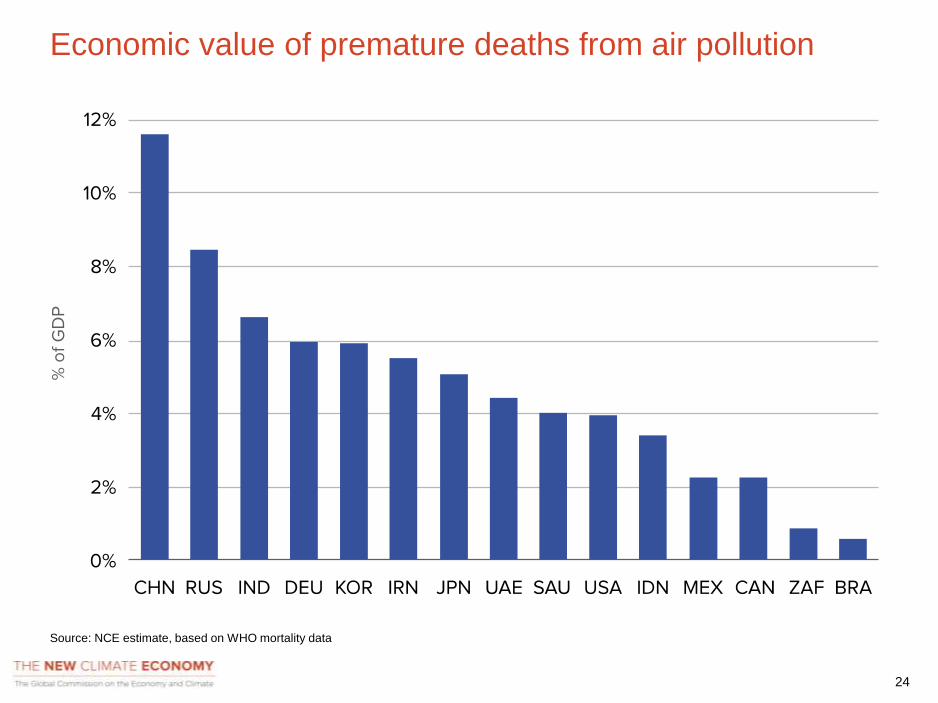
Economic value of premature deaths from air pollution
Source: NCE estimate, based on WHO mortality data
25
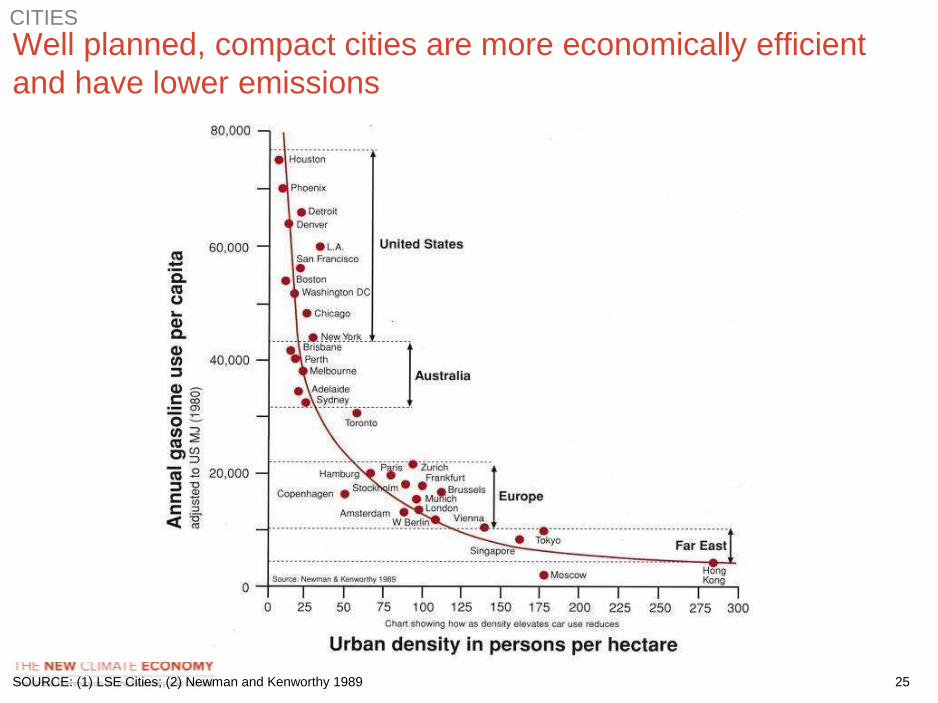
Well planned, compact cities are more economically efficient
and have lower emissions
SOURCE: (1) LSE Cities; (2) Newman and Kenworthy 1989
CITIES
26
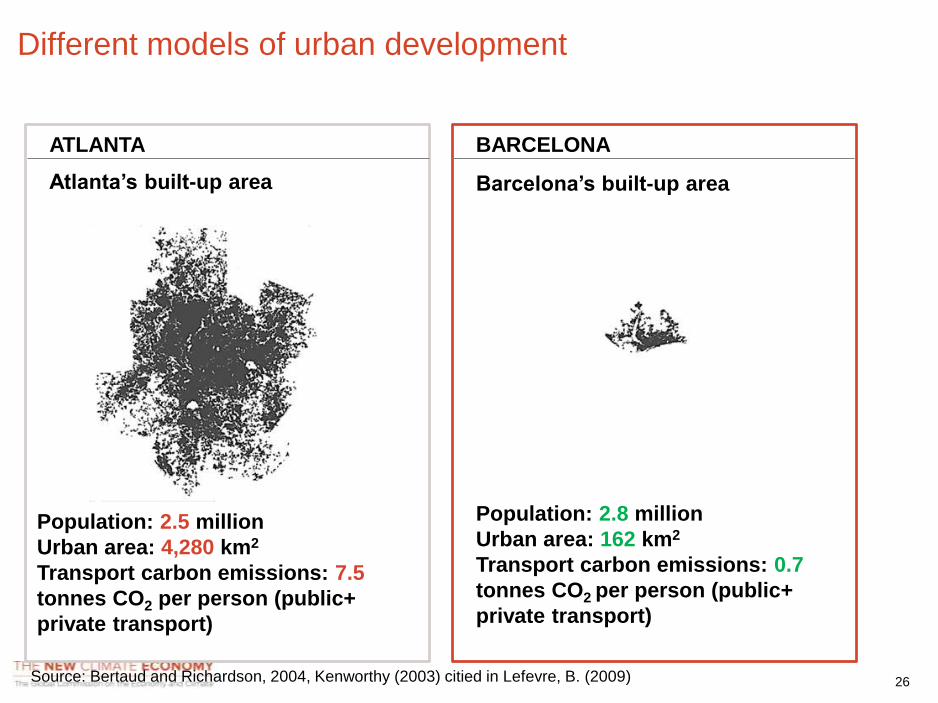
Different models of urban development
Atlanta’s built-up area Barcelona’s built-up area
Population: 2.5 million
Urban area: 4,280 km2
Transport carbon emissions: 7.5
tonnes CO2 per person (public+
private transport)
Population: 2.8 million
Urban area: 162 km2
Transport carbon emissions: 0.7
tonnes CO2 per person (public+
private transport)
ATLANTA BARCELONA
Source: Bertaud and Richardson, 2004, Kenworthy (2003) citied in Lefevre, B. (2009)
27
28
29
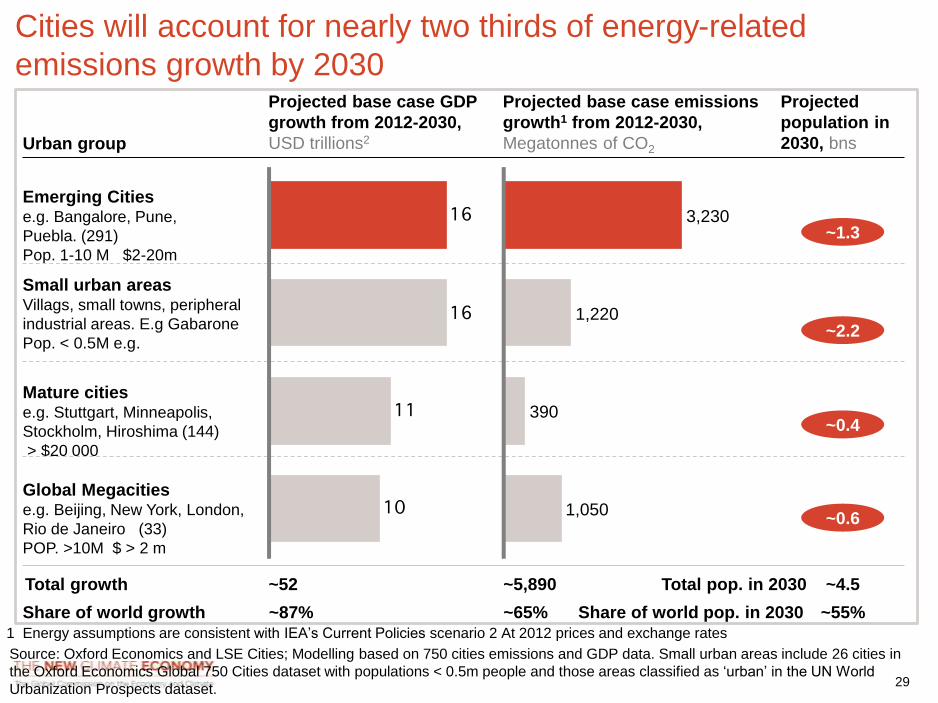
Cities will account for nearly two thirds of energy-related
emissions growth by 2030
Emerging Citiese.g. Bangalore, Pune,
Puebla. (291)
Pop. 1-10 M $2-20m
Global Megacitiese.g. Beijing, New York, London,
Rio de Janeiro (33)
POP. >10M $ > 2 m
Mature citiese.g. Stuttgart, Minneapolis,
Stockholm, Hiroshima (144)
> $20 000
Small urban areasVillags, small towns, peripheral
industrial areas. E.g Gabarone
Pop. < 0.5M e.g.
Projected base case GDP
growth from 2012-2030,
USD trillions2
Projected base case emissions
growth1 from 2012-2030,
Megatonnes of CO2
Projected
population in
2030, bns
~0.6
~0.4
~1.3
~2.2
1 Energy assumptions are consistent with IEA’s Current Policies scenario 2 At 2012 prices and exchange rates
Urban group
Source: Oxford Economics and LSE Cities; Modelling based on 750 cities emissions and GDP data. Small urban areas include 26 cities in
the Oxford Economics Global 750 Cities dataset with populations < 0.5m people and those areas classified as ‘urban’ in the UN World
Urbanization Prospects dataset.
Total growth ~52 ~4.5~5,890 Total pop. in 2030
Share of world growth ~65%~87% ~55%Share of world pop. in 2030
390
1,220
1,050
3,230
30
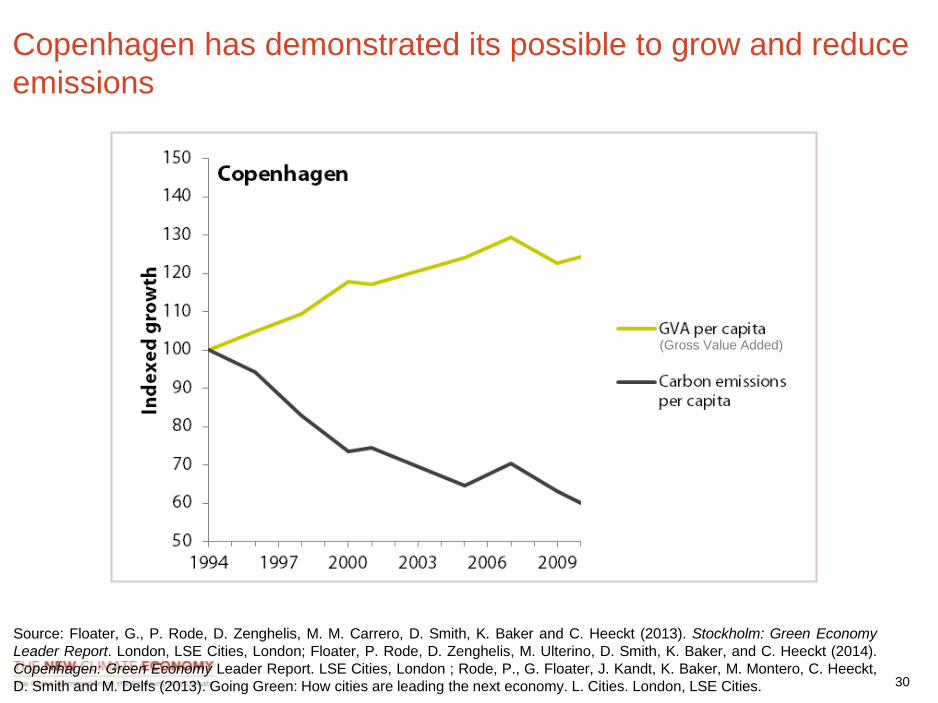
Copenhagen has demonstrated its possible to grow and reduce
emissions
Source: Floater, G., P. Rode, D. Zenghelis, M. M. Carrero, D. Smith, K. Baker and C. Heeckt (2013). Stockholm: Green Economy
Leader Report. London, LSE Cities, London; Floater, P. Rode, D. Zenghelis, M. Ulterino, D. Smith, K. Baker, and C. Heeckt (2014).
Copenhagen: Green Economy Leader Report. LSE Cities, London ; Rode, P., G. Floater, J. Kandt, K. Baker, M. Montero, C. Heeckt,
D. Smith and M. Delfs (2013). Going Green: How cities are leading the next economy. L. Cities. London, LSE Cities.
(Gross Value Added)
31
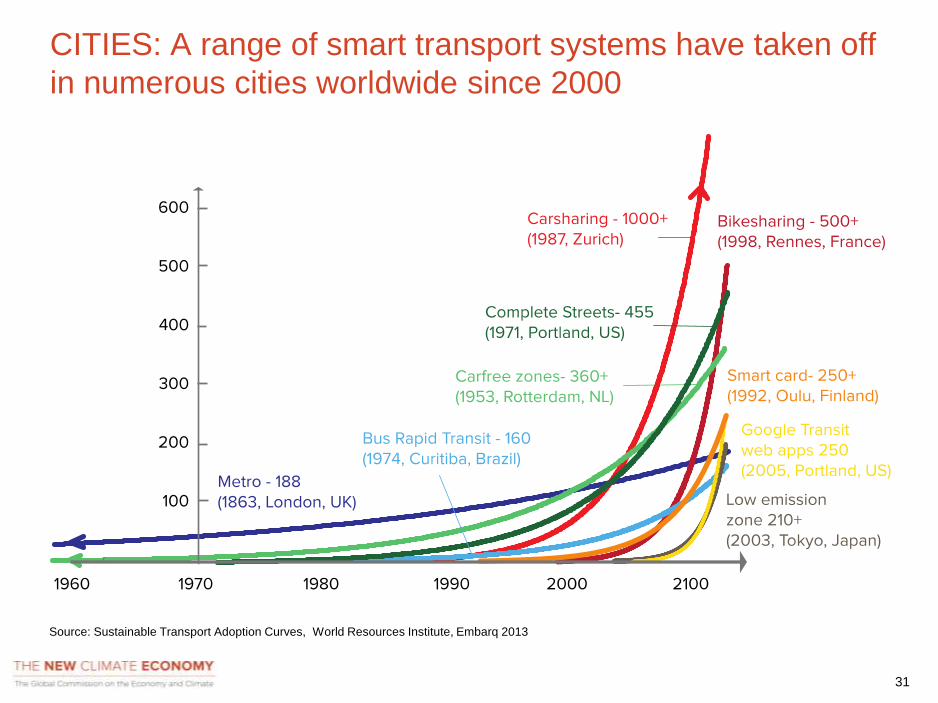
CITIES: A range of smart transport systems have taken off
in numerous cities worldwide since 2000
Source: Sustainable Transport Adoption Curves, World Resources Institute, Embarq 2013
32
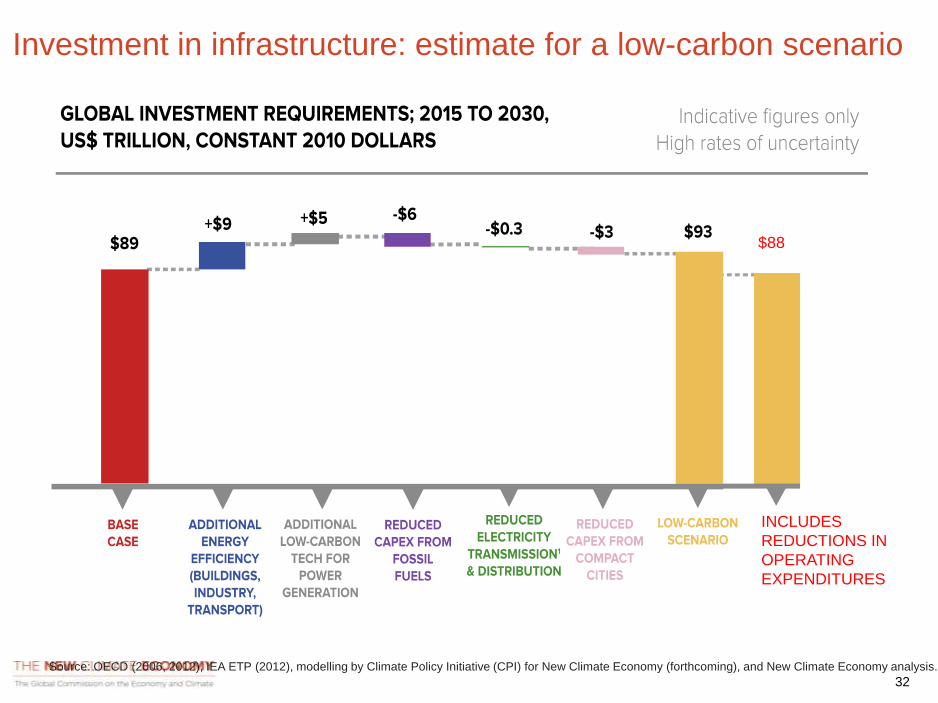
Investment in infrastructure: estimate for a low-carbon scenario
Source: OECD (2006, 2012), IEA ETP (2012), modelling by Climate Policy Initiative (CPI) for New Climate Economy (forthcoming), and New Climate Economy analysis.
$88
INCLUDES
REDUCTIONS IN
OPERATING
EXPENDITURES
33
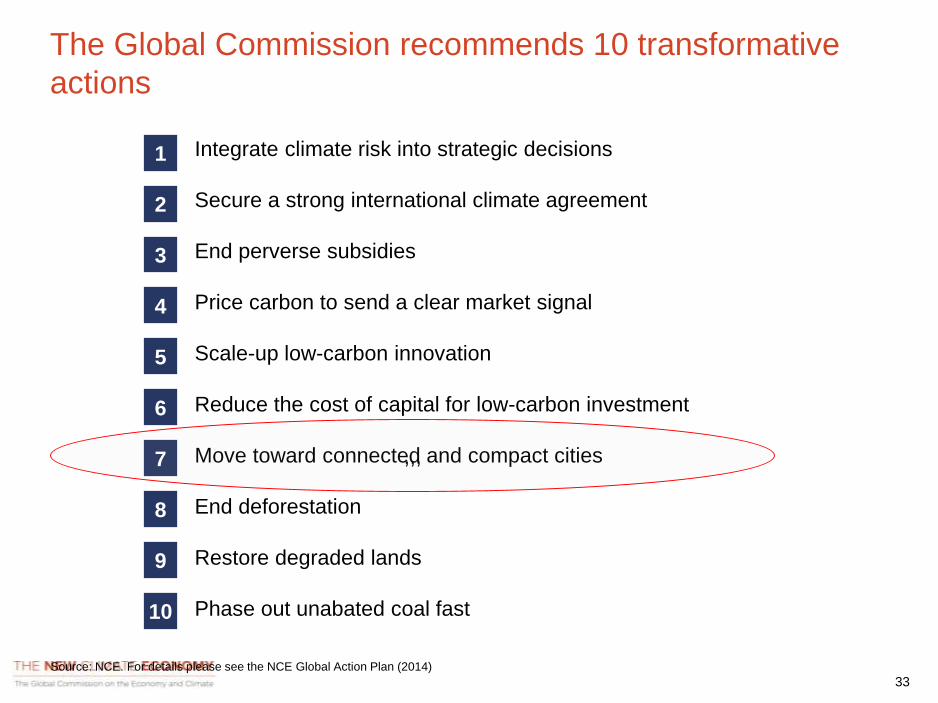
Next stepsThe Global Commission recommends 10 transformative
actions
Source: NCE. For details please see the NCE Global Action Plan (2014)
1 Integrate climate risk into strategic decisions
Secure a strong international climate agreement
End perverse subsidies
Price carbon to send a clear market signal
Scale-up low-carbon innovation
Reduce the cost of capital for low-carbon investment
Move toward connected and compact cities
End deforestation
Restore degraded lands
Phase out unabated coal fast
2
3
4
5
6
7
8
9
10
,,,
34
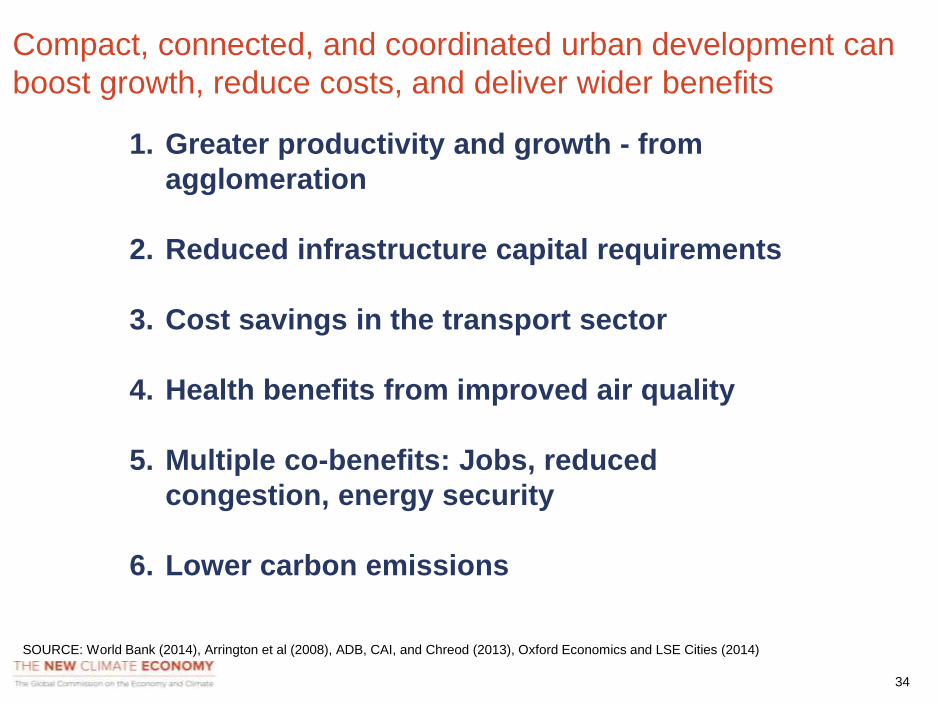
Compact, connected, and coordinated urban development can
boost growth, reduce costs, and deliver wider benefits
SOURCE: World Bank (2014), Arrington et al (2008), ADB, CAI, and Chreod (2013), Oxford Economics and LSE Cities (2014)
1. Greater productivity and growth - from
agglomeration
2. Reduced infrastructure capital requirements
3. Cost savings in the transport sector
4. Health benefits from improved air quality
5. Multiple co-benefits: Jobs, reduced
congestion, energy security
6. Lower carbon emissions
35
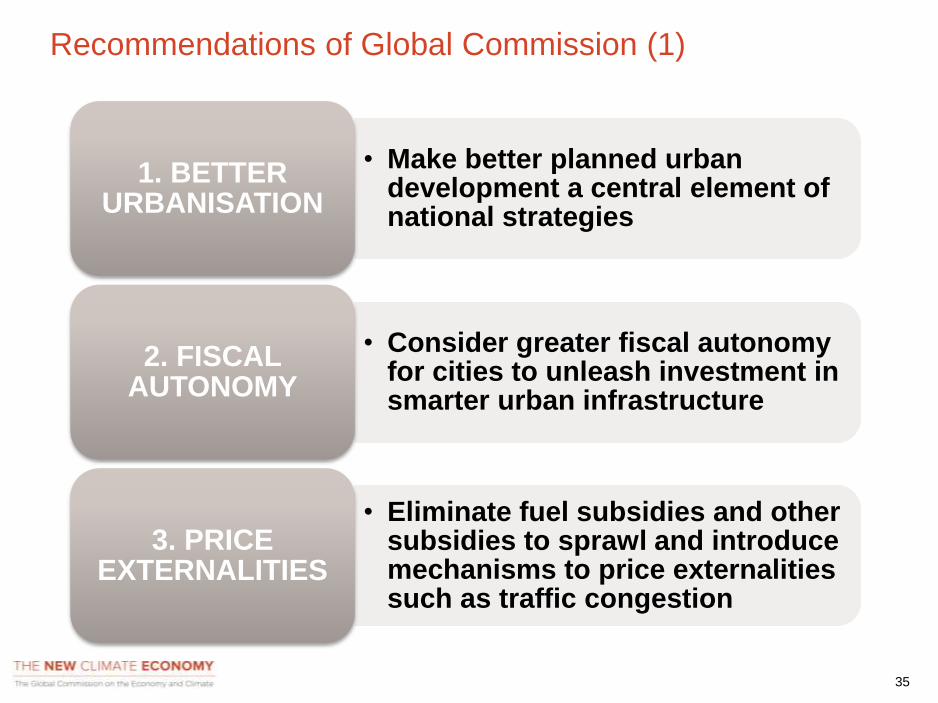
Recommendations of Global Commission (1)
• Make better planned urban development a central element of national strategies
1. BETTER URBANISATION
• Consider greater fiscal autonomy for cities to unleash investment in smarter urban infrastructure
2. FISCAL AUTONOMY
• Eliminate fuel subsidies and other subsidies to sprawl and introduce mechanisms to price externalities such as traffic congestion
3. PRICE EXTERNALITIES
36
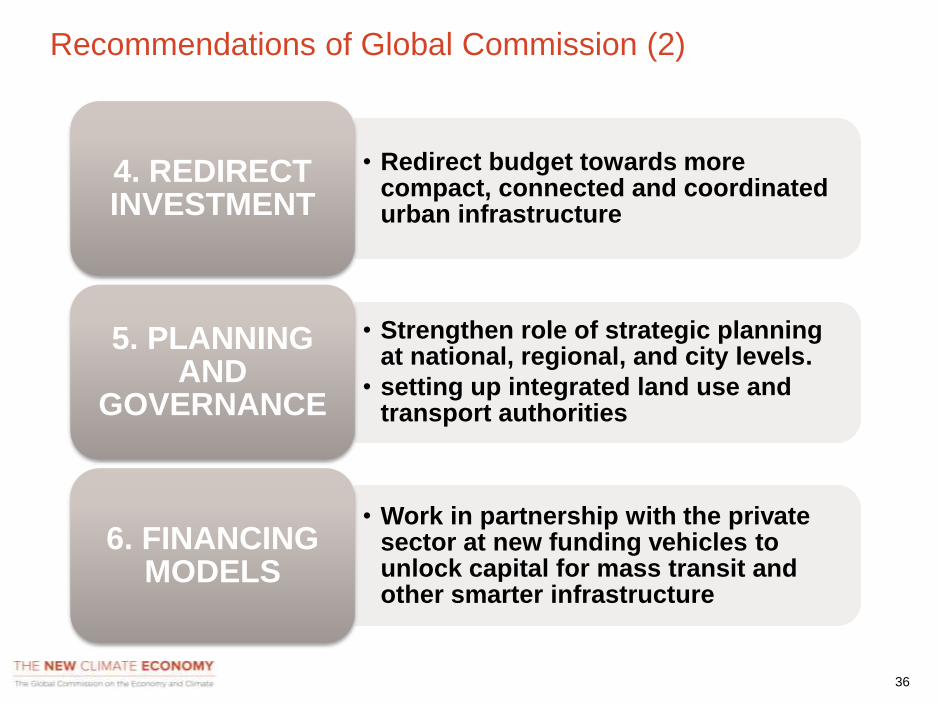
Recommendations of Global Commission (2)
• Redirect budget towards more compact, connected and coordinated urban infrastructure
4. REDIRECT INVESTMENT
• Strengthen role of strategic planning at national, regional, and city levels.
• setting up integrated land use and transport authorities
5. PLANNING AND
GOVERNANCE
• Work in partnership with the private sector at new funding vehicles to unlock capital for mass transit and other smarter infrastructure
6. FINANCING MODELS
37
37
THE GLOBAL COMMISSION ON THE ECONOMY AND CLIMATE
Felipe Calderón, Washington D.C., 15 January 2015
38
38
1. Innovation
Key drivers of change
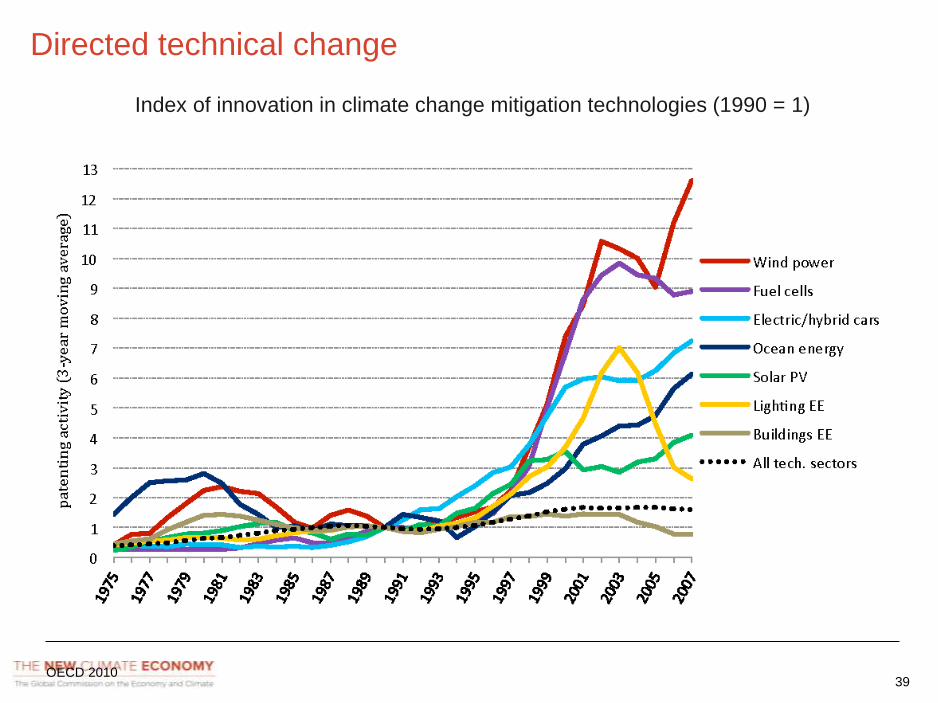
39OECD 2010
Index of innovation in climate change mitigation technologies (1990 = 1)
Directed technical change
40
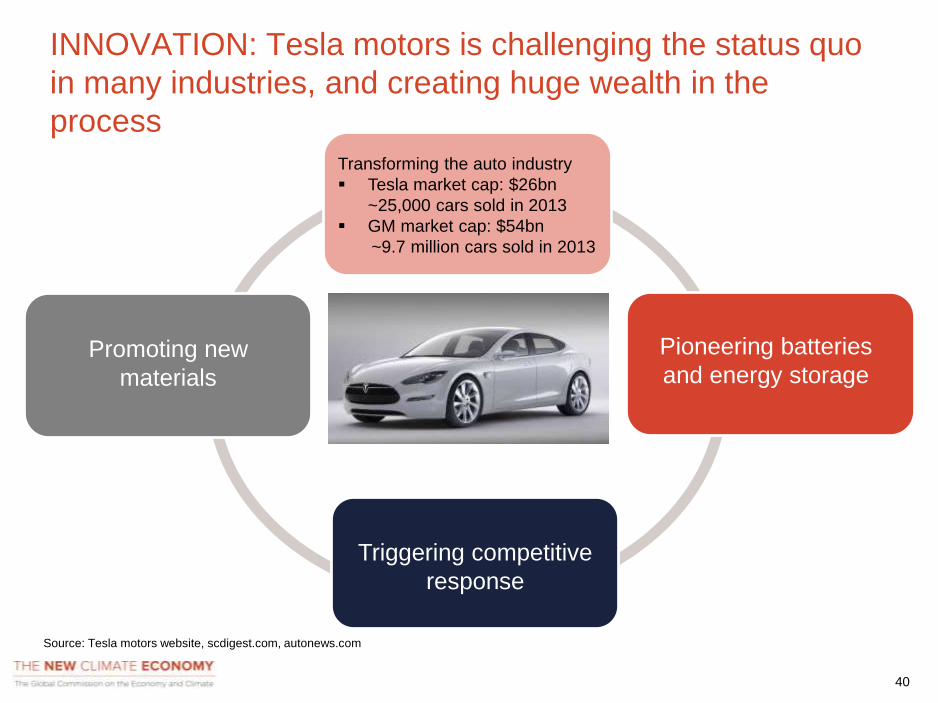
Source: Tesla motors website, scdigest.com, autonews.com
Triggering competitive
response
Transforming the auto industry
Tesla market cap: $26bn
~25,000 cars sold in 2013
GM market cap: $54bn
~9.7 million cars sold in 2013
Promoting new
materials
Pioneering batteries
and energy storage
INNOVATION: Tesla motors is challenging the status quo
in many industries, and creating huge wealth in the
process
41
41
2. Resource efficiency
Key drivers of change
42
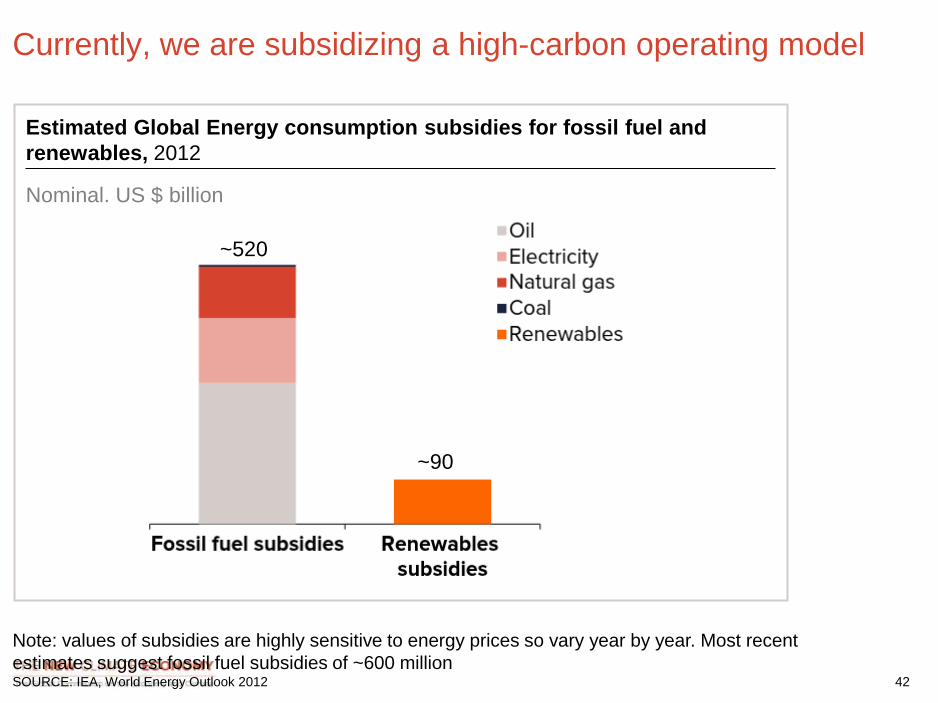
Currently, we are subsidizing a high-carbon operating model
Estimated Global Energy consumption subsidies for fossil fuel and
renewables, 2012
Nominal. US $ billion
Note: values of subsidies are highly sensitive to energy prices so vary year by year. Most recent
estimates suggest fossil fuel subsidies of ~600 millionSOURCE: IEA, World Energy Outlook 2012
~520
~90
43
43
3. Investment in infrastructure
Key drivers of change
44
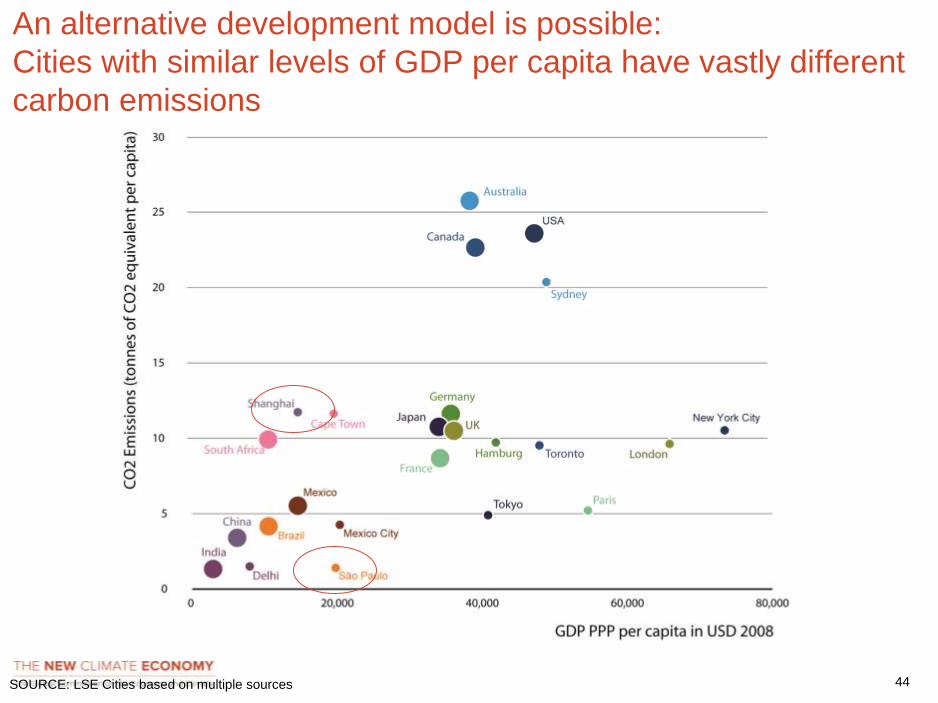
An alternative development model is possible:
Cities with similar levels of GDP per capita have vastly different
carbon emissions
SOURCE: LSE Cities based on multiple sources