Embed Size (px)
Citation preview
Alper Durmus, CAIT Graduate Research Assistant & PhD Student Quang Nguyen, CAIT Graduate Research Assistant & PhD Student Marcus Z. McGrath, NCCHE Graduate Research Assistant & PhD Student Mustafa S. Altinakar, Research Professor and Director NCCHE Waheed Uddin, Professor of Civil Engineering and Director CAIT
The University of Mississippi
Presented at the 94th Annual Meeting of The Transportation Research Board
Washington, DC January 13, 2015
Numerical Modeling and Simulation of Extreme Flood Inundation to Assess Vulnerability of
Transportation Infrastructure Assets
NCCHE
2
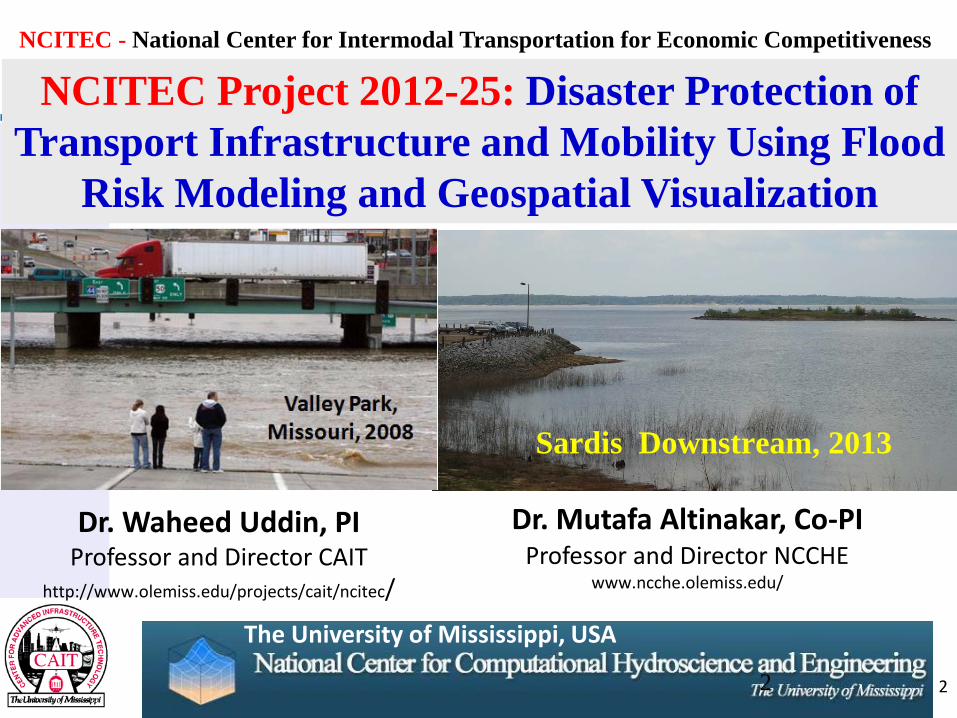
Dr. Waheed Uddin, PI Professor and Director CAIT
http://www.olemiss.edu/projects/cait/ncitec/
NCITEC Project 2012-25: Disaster Protection of Transport Infrastructure and Mobility Using Flood
Risk Modeling and Geospatial Visualization
2
Sardis Downstream, 2013
The University of Mississippi, USA
Dr. Mutafa Altinakar, Co-PI Professor and Director NCCHE
www.ncche.olemiss.edu/
2
NCITEC - National Center for Intermodal Transportation for Economic Competitiveness
3 3
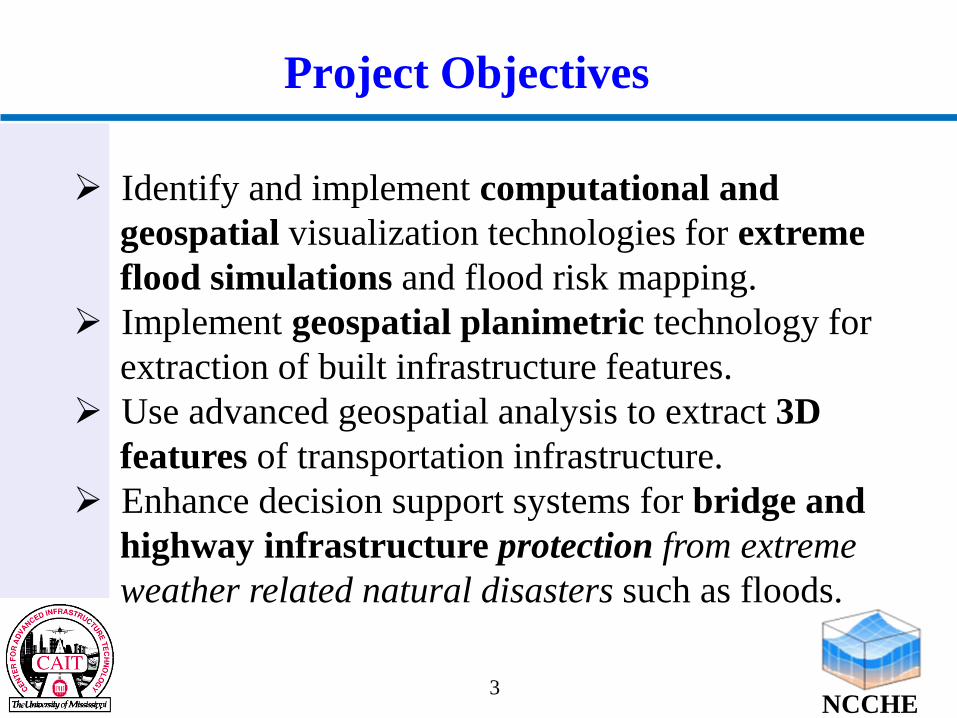
Identify and implement computational and geospatial visualization technologies for extreme flood simulations and flood risk mapping. Implement geospatial planimetric technology for extraction of built infrastructure features. Use advanced geospatial analysis to extract 3D features of transportation infrastructure. Enhance decision support systems for bridge and highway infrastructure protection from extreme weather related natural disasters such as floods.
Project Objectives
NCCHE
4
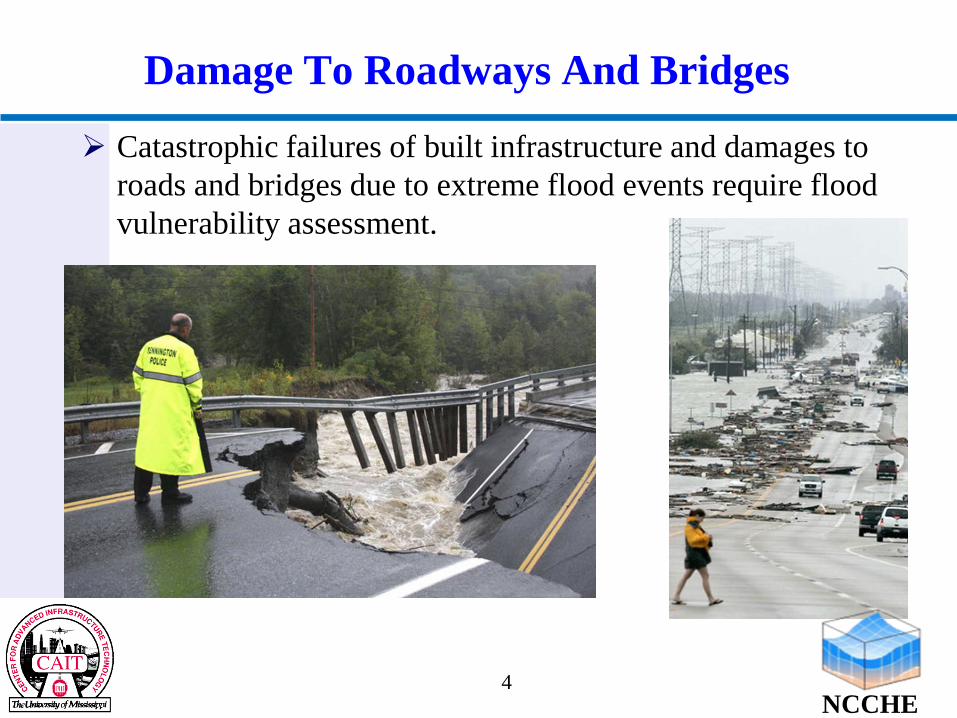
Damage To Roadways And Bridges
Catastrophic failures of built infrastructure and damages to roads and bridges due to extreme flood events require flood vulnerability assessment.
4 NCCHE
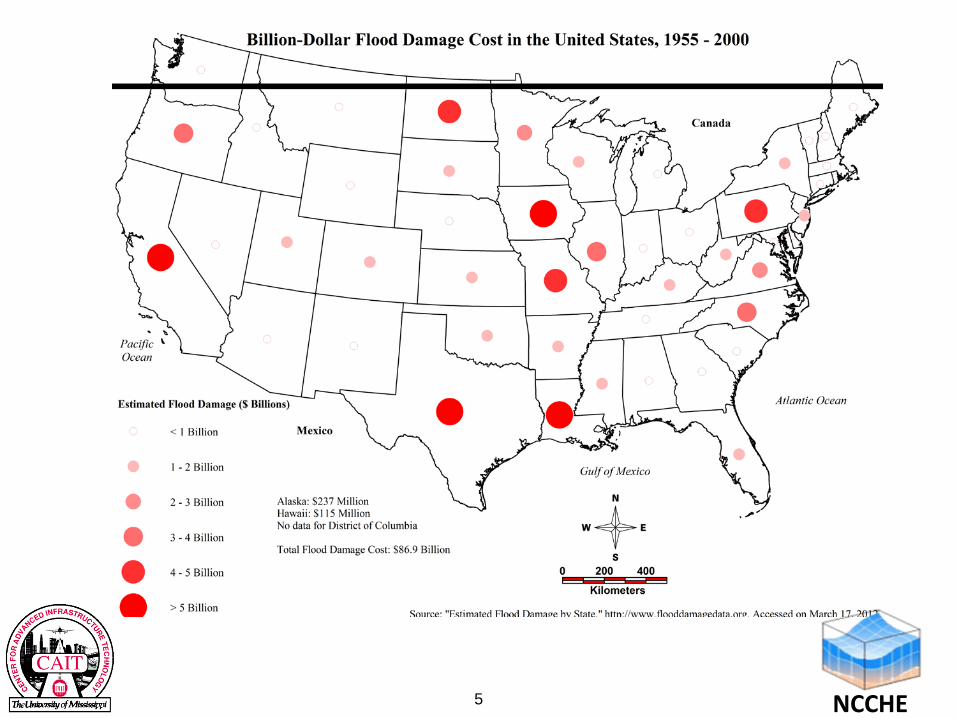
5 NCCHE
6
• About 60% of all disasters costing one billion dollars or more in the United States were related to weather.
• Extreme weather events are occurring at an increasing frequency as experienced by devastating floods in recent years on the East Coast.
• Extreme weather events caused $208 billion of economic cost in the
United States with more than 1,200 casualties between 2011 & 2013.
• 2005 Hurricane Katrina disaster on Louisiana and Mississippi Gulf Coast resulted in more than $100 billion in infrastructure and economic costs.
• Critical transportation infrastructure assets are under a continuous risk of flood hazards and subject to significant damage, such as washing away of pavements and bridges.
Background and Motivation
NCCHE
7
Objectives • Remote sensing and geospatial technologies for modeling and
visualization of terrain and built infrastructure
• Simulation of extreme flood inundation using 2D numerical modeling and flood risk mapping
• Assessment of extreme flood impacts on critical transportation
infrastructure assets
This study addresses the National Center for Intermodal Transportation for Economic Competitiveness (NCITEC) theme of efficient, safe, secure, and sustainable national intermodal transportation network being resilient to disasters.
NCCHE
8
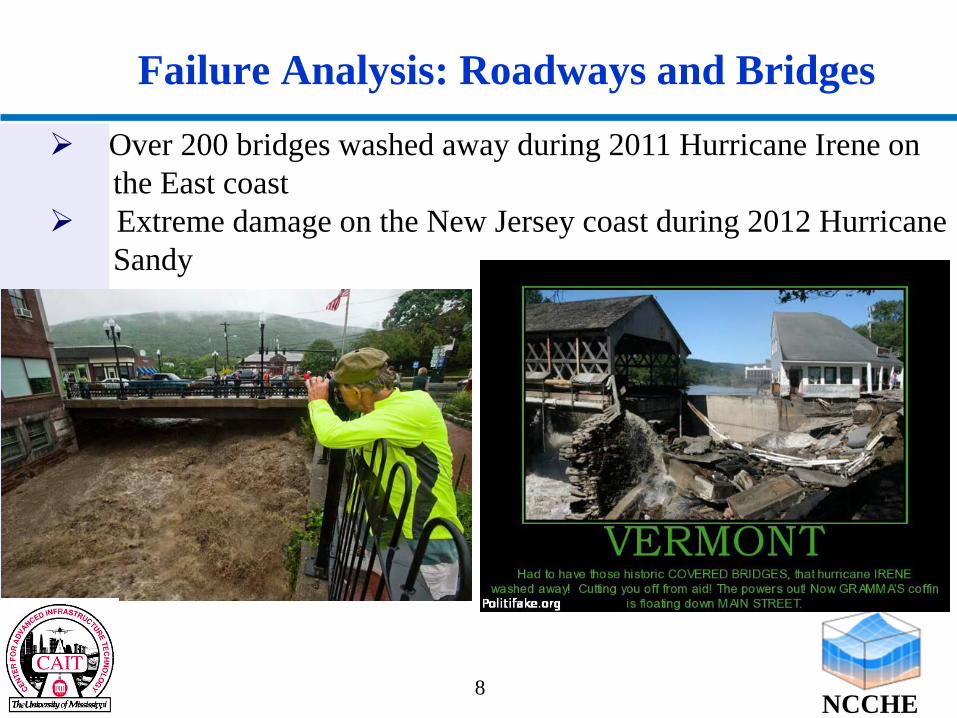
Failure Analysis: Roadways and Bridges
Over 200 bridges washed away during 2011 Hurricane Irene on the East coast Extreme damage on the New Jersey coast during 2012 Hurricane Sandy
8 NCCHE
9
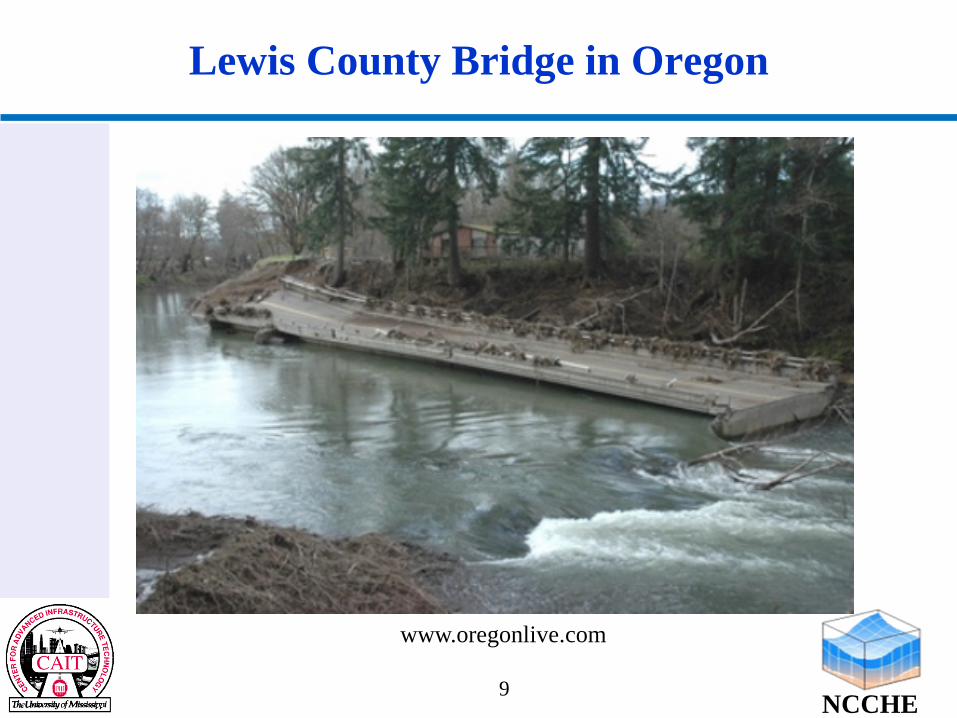
Lewis County Bridge in Oregon
www.oregonlive.com
9 NCCHE
10
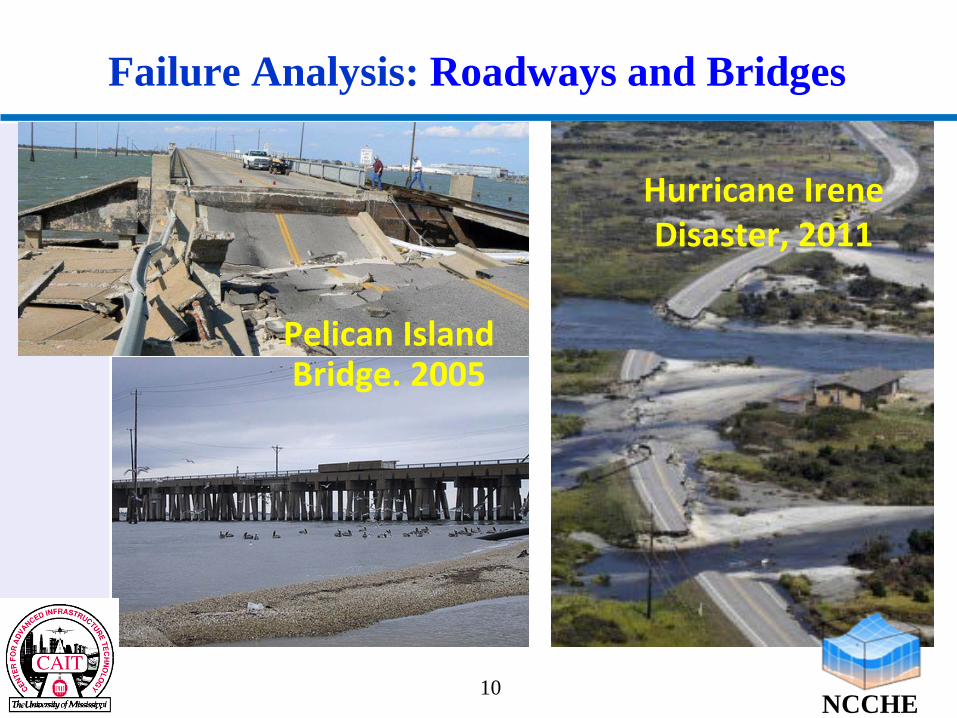
Failure Analysis: Roadways and Bridges
Hurricane Irene Disaster, 2011
Pelican Island Bridge. 2005
10 NCCHE
11
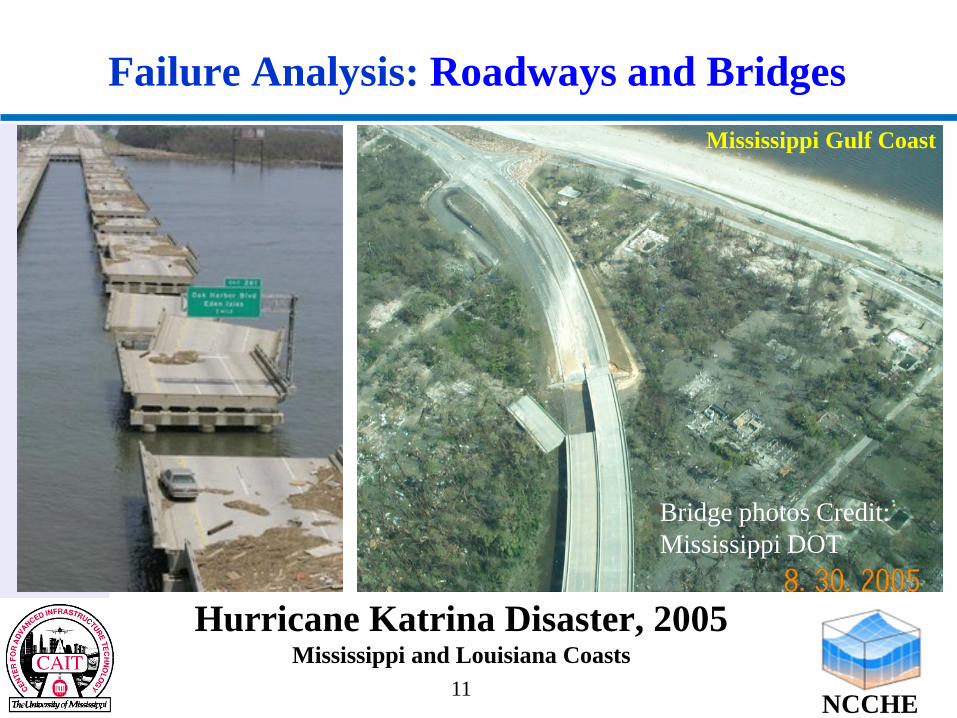
Failure Analysis: Roadways and Bridges
11
Hurricane Katrina Disaster, 2005 Mississippi and Louisiana Coasts
NCCHE
Mississippi Gulf Coast
Bridge photos Credit: Mississippi DOT
12
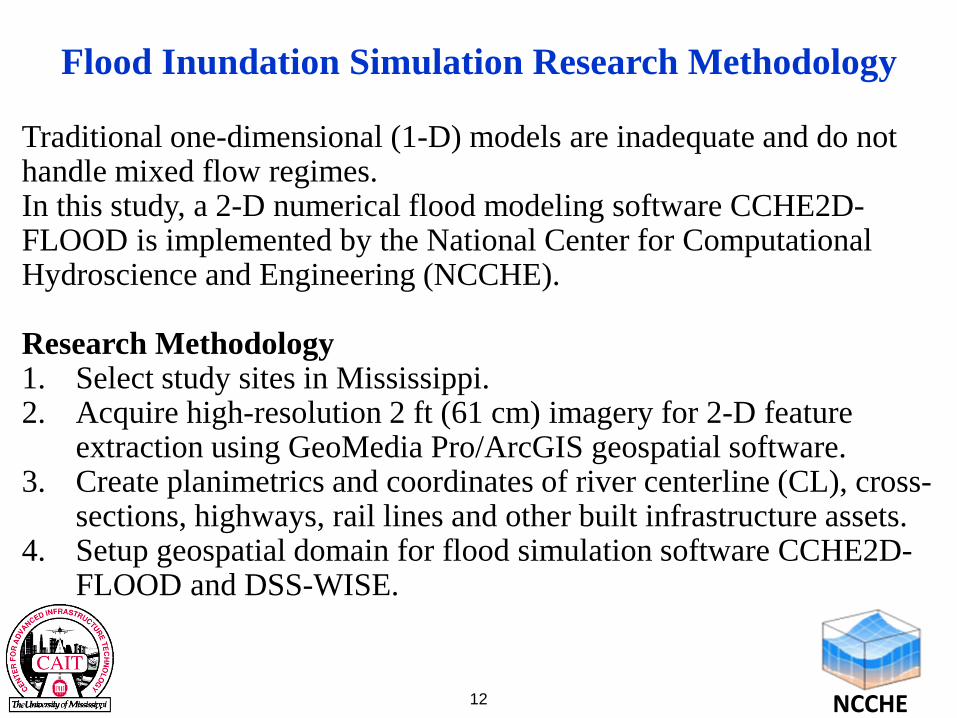
Flood Inundation Simulation Research Methodology
Traditional one-dimensional (1-D) models are inadequate and do not handle mixed flow regimes. In this study, a 2-D numerical flood modeling software CCHE2D-FLOOD is implemented by the National Center for Computational Hydroscience and Engineering (NCCHE). Research Methodology 1. Select study sites in Mississippi. 2. Acquire high-resolution 2 ft (61 cm) imagery for 2-D feature
extraction using GeoMedia Pro/ArcGIS geospatial software. 3. Create planimetrics and coordinates of river centerline (CL), cross-
sections, highways, rail lines and other built infrastructure assets. 4. Setup geospatial domain for flood simulation software CCHE2D-
FLOOD and DSS-WISE.
NCCHE
13
6. Run extreme flood simulations for high-resolution bare ground digital elevation model (DEM).
7. Analyze flood simulation outputs for floodwater vectors and hydrodynamic forces at river CL and cross-sections.
6. Run flood simulations again after incorporating 3D models of
highways, rail, airport, and selected buildings. 7. Compare the flood depths and inundations using simulation results
for 10m, 5m, 3m cell size resolutions.
8. Use floodwater simulation results for structural integrity assessment of bridges and pavements.
This approach can be implemented with any off-the-shelf
geospatial software and NCCHE Flood simulation software.
Research Methodology (continued)
NCCHE
14
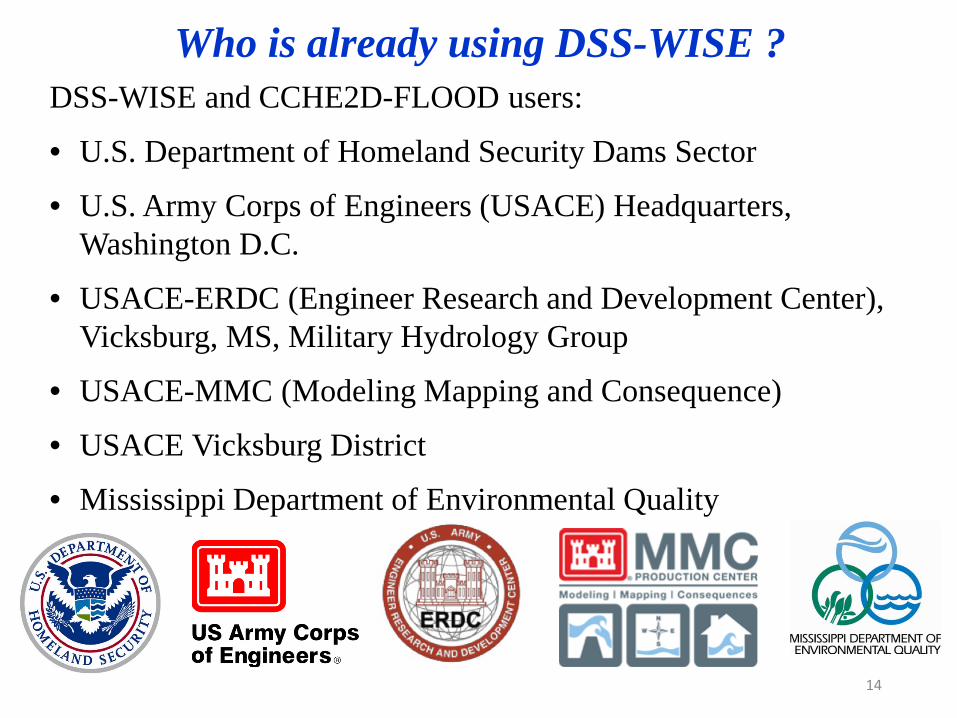
Who is already using DSS-WISE ? DSS-WISE and CCHE2D-FLOOD users:
• U.S. Department of Homeland Security Dams Sector
• U.S. Army Corps of Engineers (USACE) Headquarters, Washington D.C.
• USACE-ERDC (Engineer Research and Development Center), Vicksburg, MS, Military Hydrology Group
• USACE-MMC (Modeling Mapping and Consequence)
• USACE Vicksburg District
• Mississippi Department of Environmental Quality
15
Numerical Modeling and Simulation of Flood Inundation
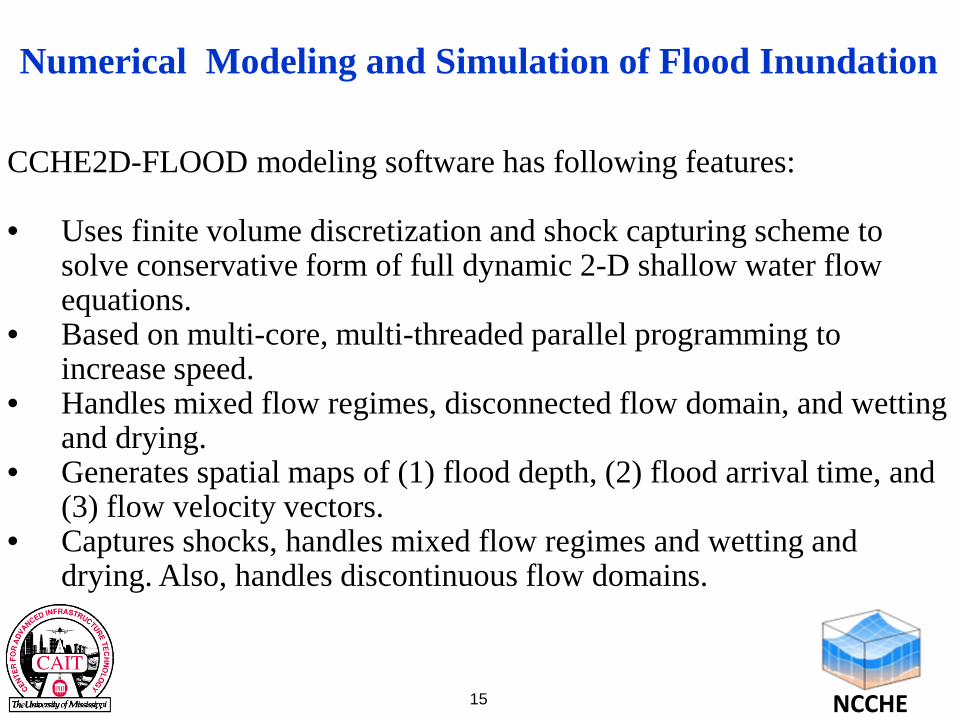
CCHE2D-FLOOD modeling software has following features: • Uses finite volume discretization and shock capturing scheme to
solve conservative form of full dynamic 2-D shallow water flow equations.
• Based on multi-core, multi-threaded parallel programming to increase speed.
• Handles mixed flow regimes, disconnected flow domain, and wetting and drying.
• Generates spatial maps of (1) flood depth, (2) flood arrival time, and (3) flow velocity vectors.
• Captures shocks, handles mixed flow regimes and wetting and drying. Also, handles discontinuous flow domains.
NCCHE
National Center for Computational Hydroscience and Engineering
The University of Mississippi
NCITEC Workshop Extreme Flood Inundation Mapping and Risk Modeling of Transportation Infrastructure Assets
Friday, December, 2014 / NCCHE Conference Room, Brevard Hall Room 319
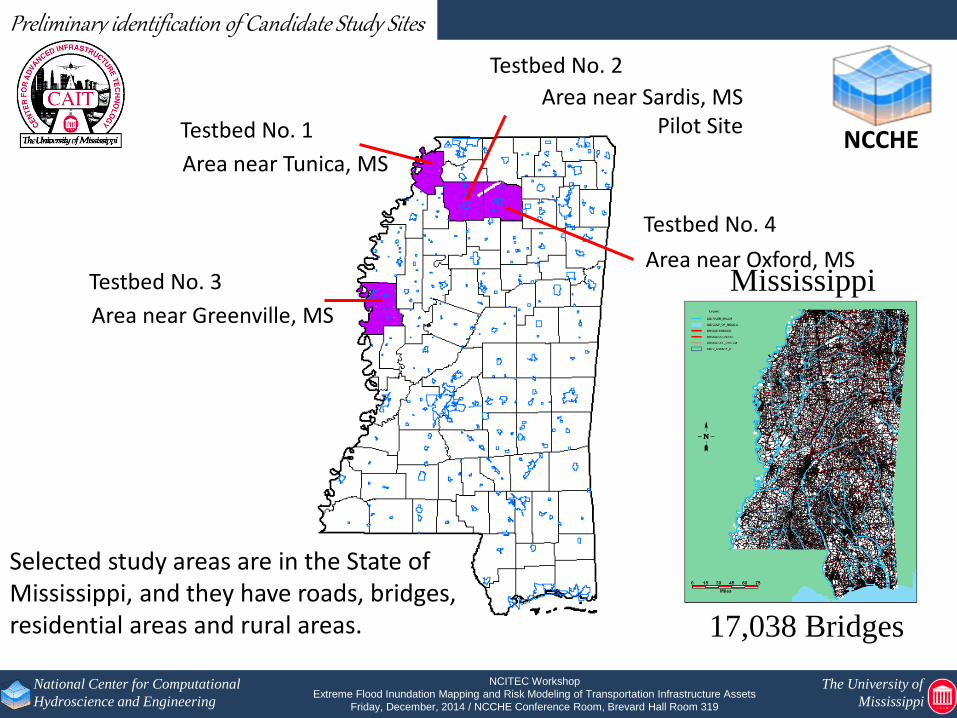
Preliminary identification of Candidate Study Sites
Area near Tunica, MS
Area near Sardis, MS Pilot Site
Area near Greenville, MS
Area near Oxford, MS
Selected study areas are in the State of Mississippi, and they have roads, bridges, residential areas and rural areas.
Testbed No. 4
Testbed No. 1
Testbed No. 2
Testbed No. 3
17,038 Bridges
NCCHE
Mississippi
CAIT / NCCHE
Sardis Site
17
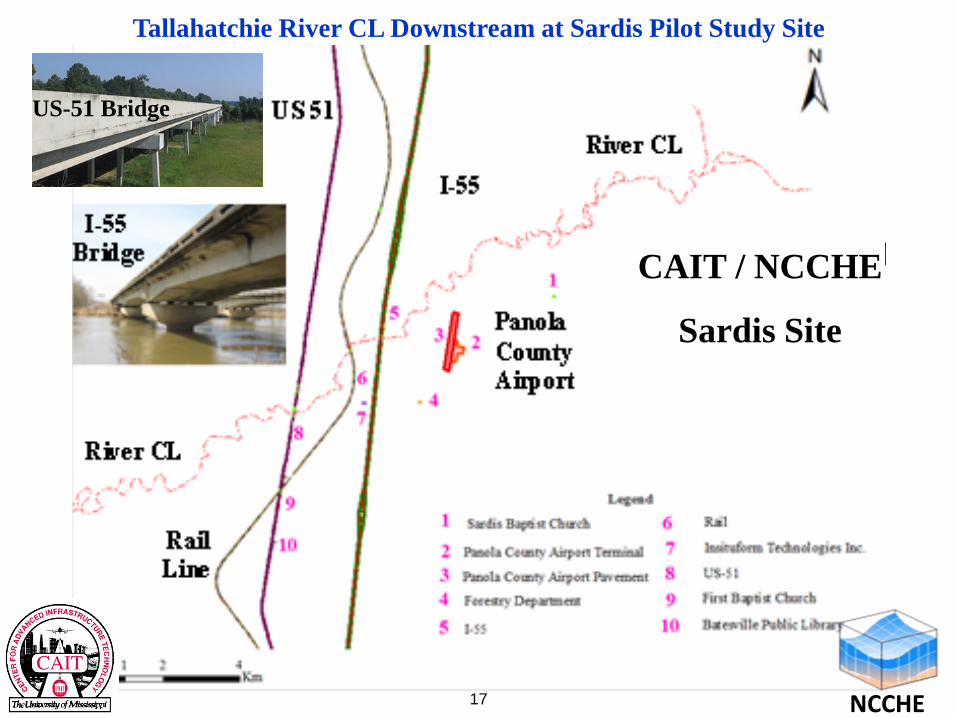
Tallahatchie River CL Downstream at Sardis Pilot Study Site
NCCHE
US-51 Bridge
Rail
I-55
Panola County Airport
Observation Point
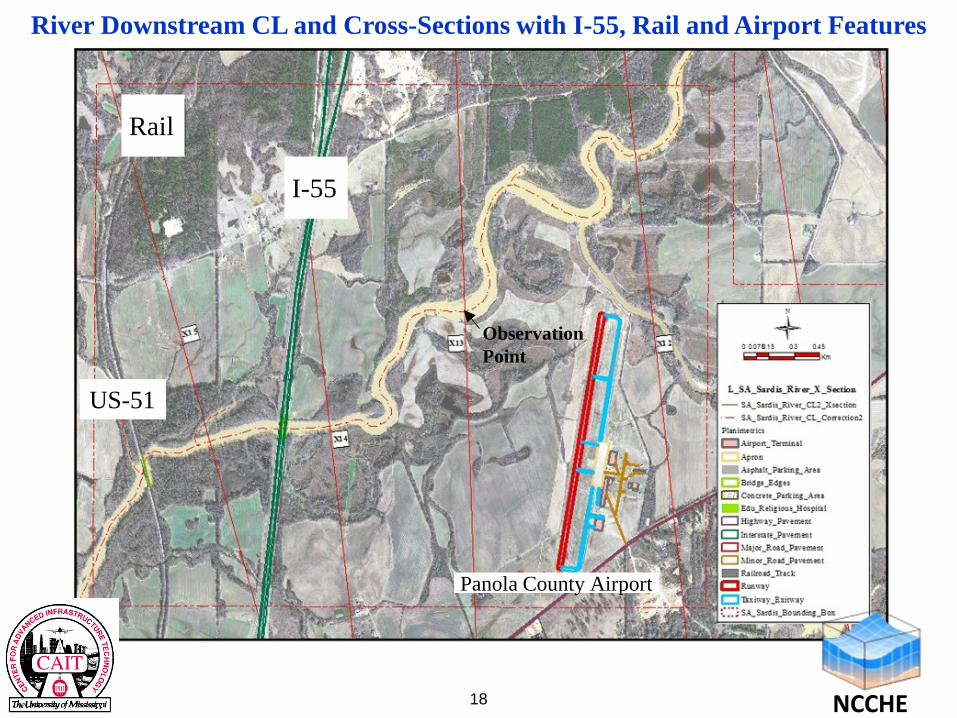
18
River Downstream CL and Cross-Sections with I-55, Rail and Airport Features
NCCHE
US-51
19
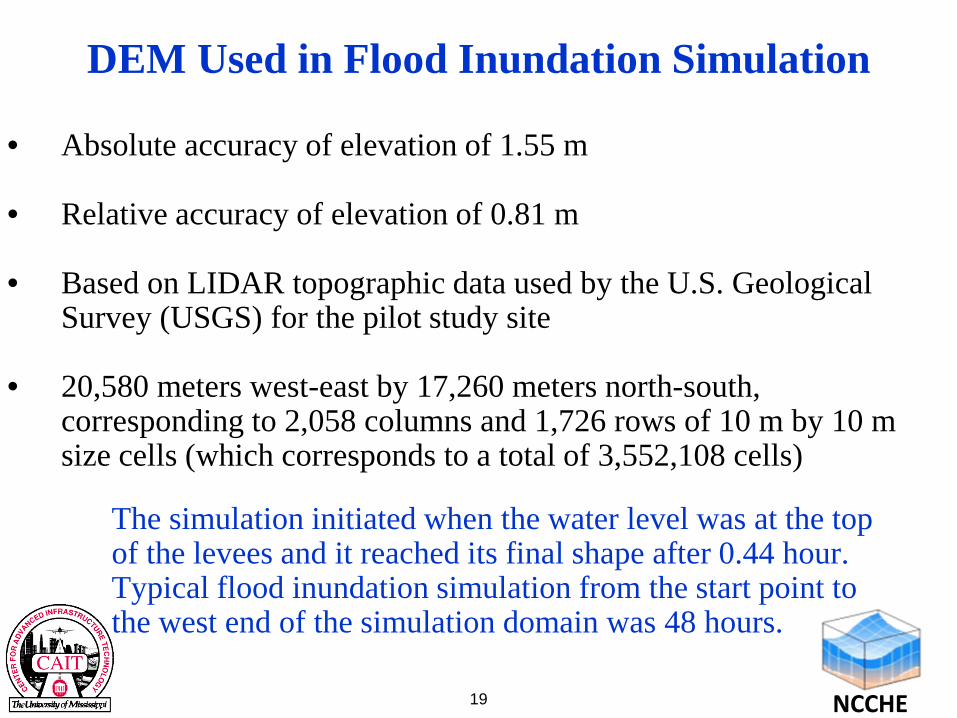
• Absolute accuracy of elevation of 1.55 m
• Relative accuracy of elevation of 0.81 m
• Based on LIDAR topographic data used by the U.S. Geological
Survey (USGS) for the pilot study site
• 20,580 meters west-east by 17,260 meters north-south, corresponding to 2,058 columns and 1,726 rows of 10 m by 10 m size cells (which corresponds to a total of 3,552,108 cells)
DEM Used in Flood Inundation Simulation
NCCHE
The simulation initiated when the water level was at the top of the levees and it reached its final shape after 0.44 hour. Typical flood inundation simulation from the start point to the west end of the simulation domain was 48 hours.
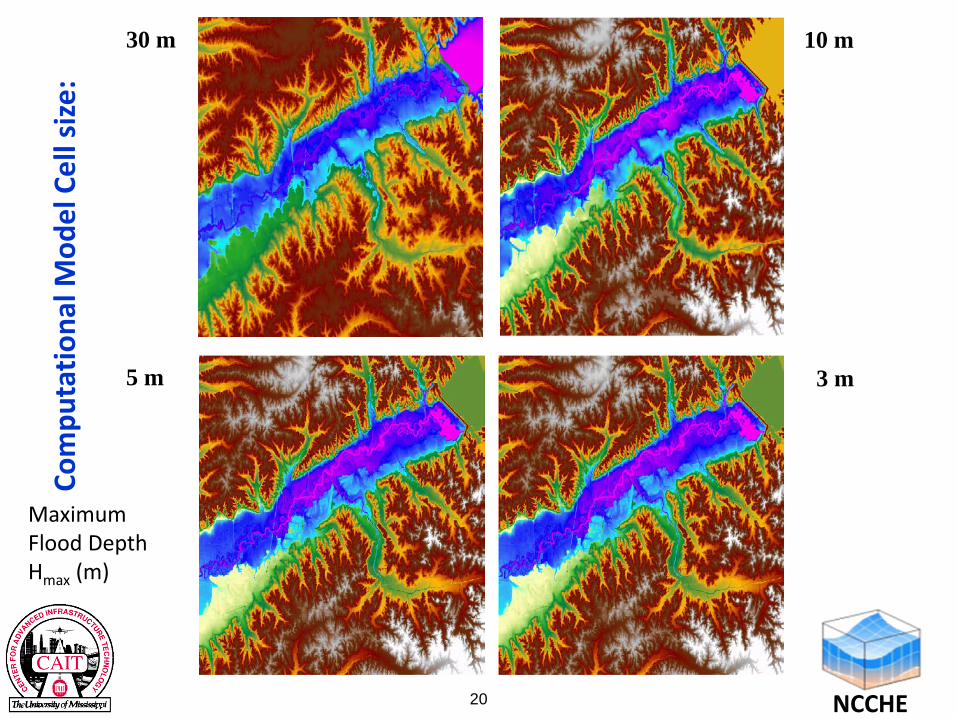
30 m 10 m
5 m 3 m
Maximum Flood Depth Hmax (m)
NCCHE 20
21
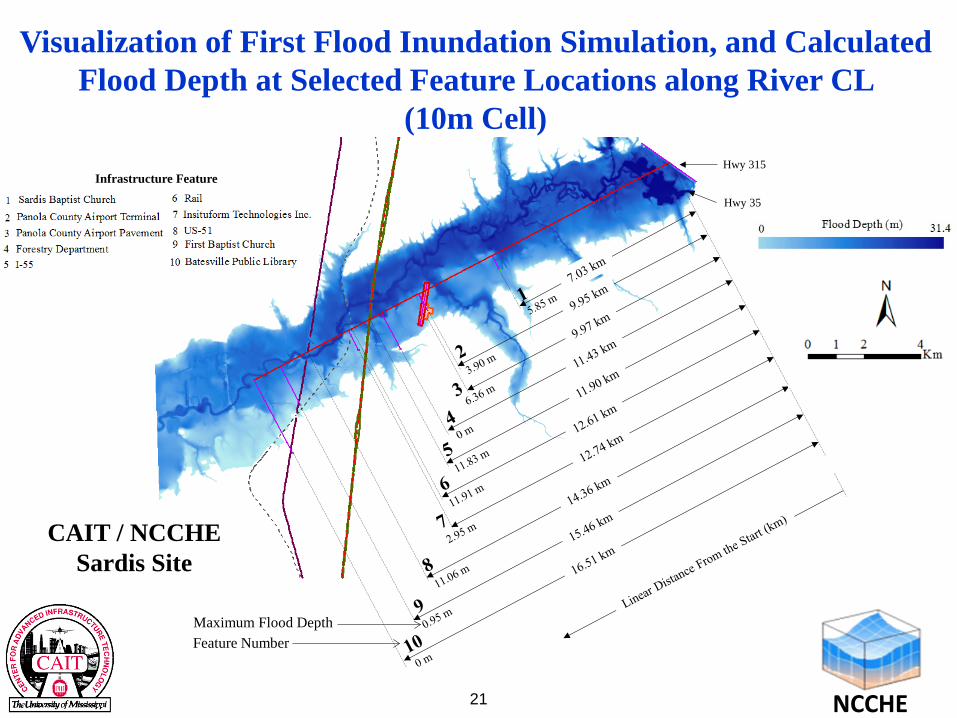
Visualization of First Flood Inundation Simulation, and Calculated Flood Depth at Selected Feature Locations along River CL
(10m Cell)
Maximum Flood DepthFeature Number
Hwy 315
Hwy 35
Infrastructure Feature
CAIT / NCCHESardis Site
NCCHE
22
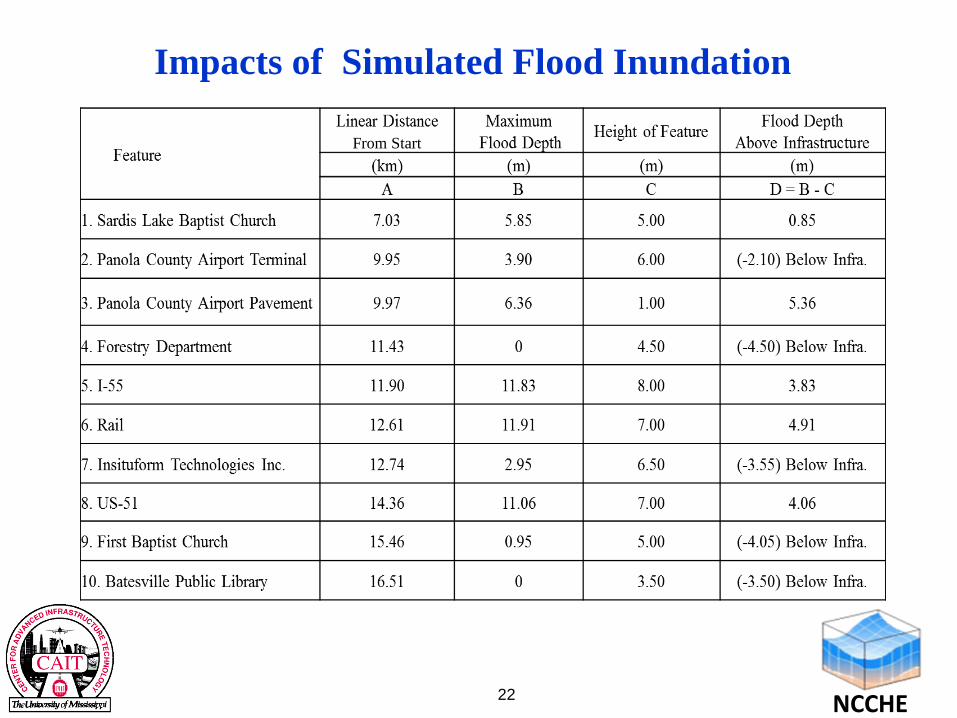
Impacts of Simulated Flood Inundation
NCCHE
From Start
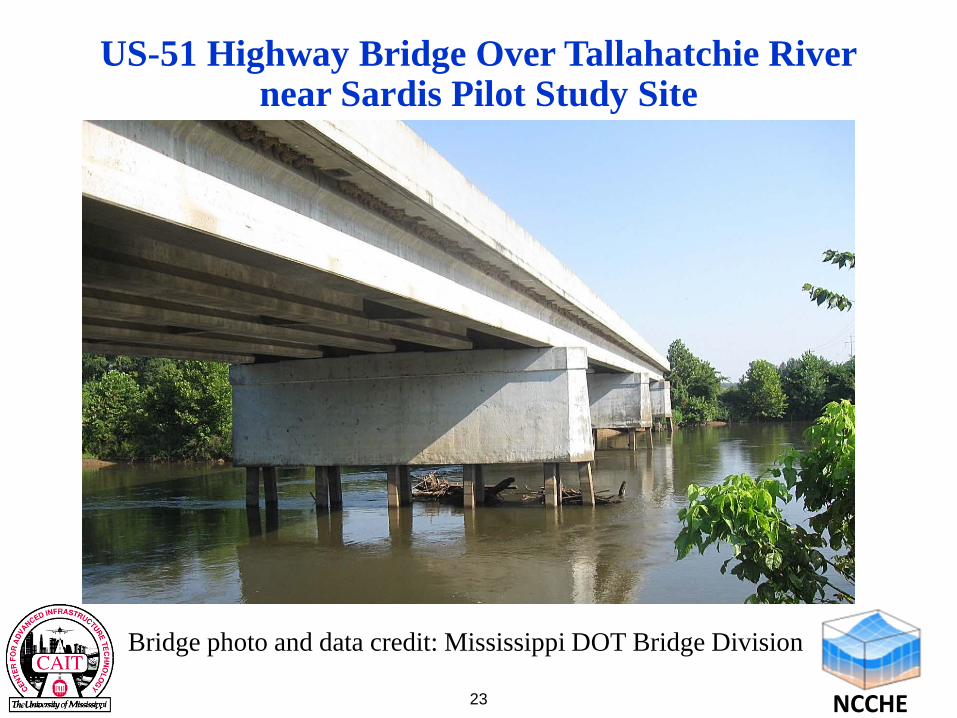
US-51 Highway Bridge Over Tallahatchie River near Sardis Pilot Study Site
NCCHE 23
Bridge photo and data credit: Mississippi DOT Bridge Division
24
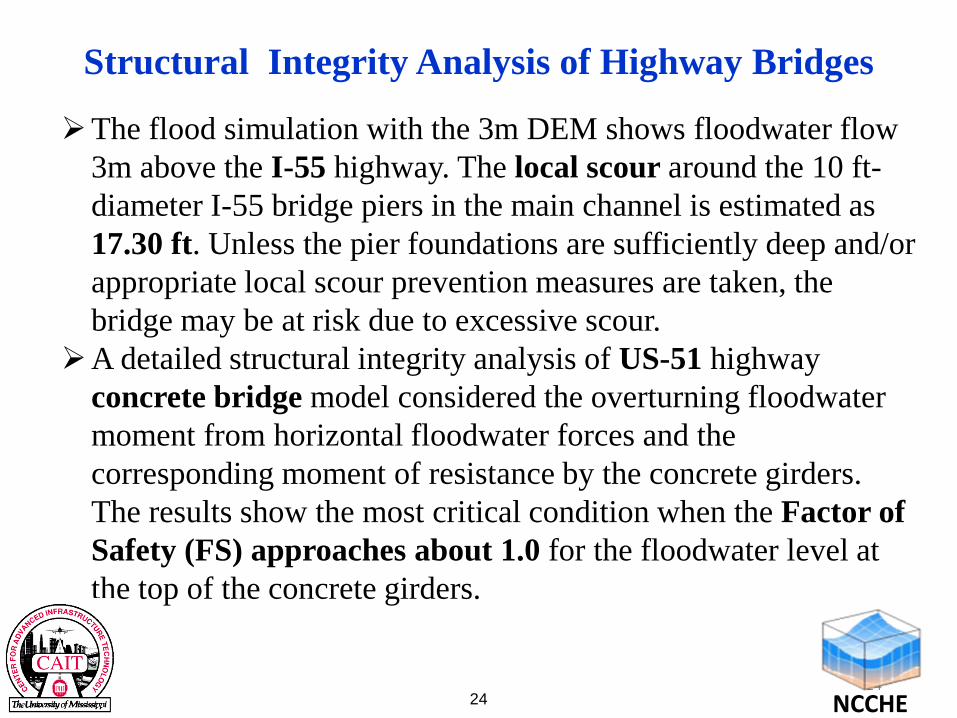
The flood simulation with the 3m DEM shows floodwater flow 3m above the I-55 highway. The local scour around the 10 ft-diameter I-55 bridge piers in the main channel is estimated as 17.30 ft. Unless the pier foundations are sufficiently deep and/or appropriate local scour prevention measures are taken, the bridge may be at risk due to excessive scour.
A detailed structural integrity analysis of US-51 highway concrete bridge model considered the overturning floodwater moment from horizontal floodwater forces and the corresponding moment of resistance by the concrete girders. The results show the most critical condition when the Factor of Safety (FS) approaches about 1.0 for the floodwater level at the top of the concrete girders.
Structural Integrity Analysis of Highway Bridges
NCCHE 24
25
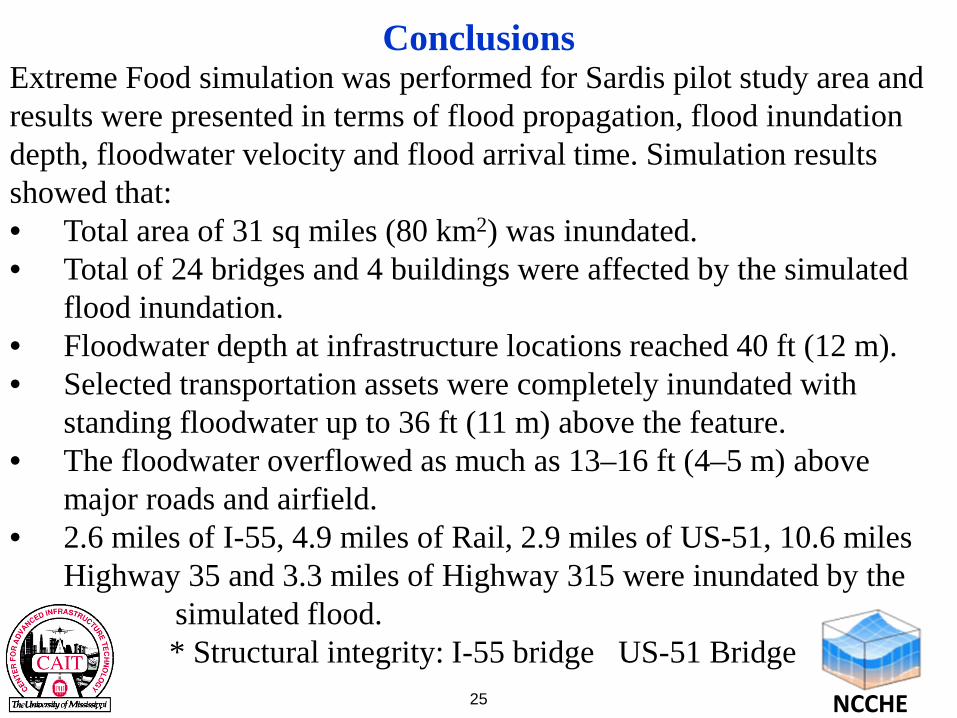
Conclusions Extreme Food simulation was performed for Sardis pilot study area and results were presented in terms of flood propagation, flood inundation depth, floodwater velocity and flood arrival time. Simulation results showed that: • Total area of 31 sq miles (80 km2) was inundated. • Total of 24 bridges and 4 buildings were affected by the simulated
flood inundation. • Floodwater depth at infrastructure locations reached 40 ft (12 m). • Selected transportation assets were completely inundated with
standing floodwater up to 36 ft (11 m) above the feature. • The floodwater overflowed as much as 13–16 ft (4–5 m) above
major roads and airfield. • 2.6 miles of I-55, 4.9 miles of Rail, 2.9 miles of US-51, 10.6 miles
Highway 35 and 3.3 miles of Highway 315 were inundated by the • simulated flood. * Structural integrity: I-55 bridge US-51 Bridge
NCCHE
26
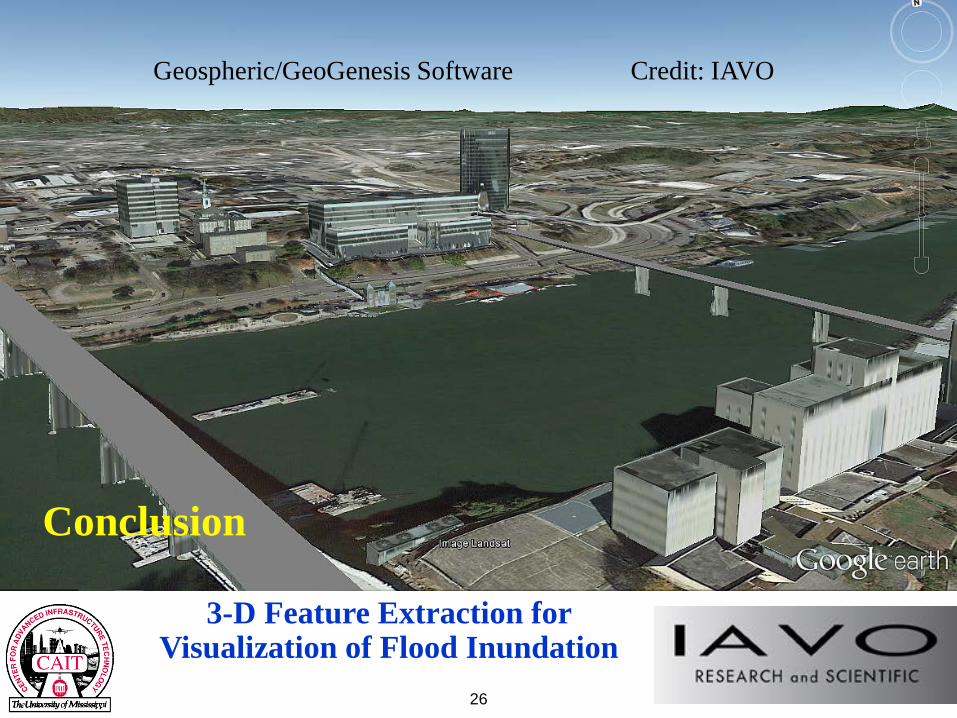
3-D Feature Extraction for Visualization of Flood Inundation
Conclusion
Credit: IAVO Geospheric/GeoGenesis Software


![Flood vulnerability assessment and disaster risk reduction ...article.aascit.org/file/pdf/9240730.pdf · holistic approaches for flood disaster management [5]. ... risk or vulnerable](https://img.pdfslide.us/doc/110x75/5ac177b17f8b9ad73f8cef17/flood-vulnerability-assessment-and-disaster-risk-reduction-approaches-for-flood.jpg)