Embed Size (px)
DESCRIPTION
Citation preview
Federal Democratic Republic of Ethiopia Environment Protection Authority
Ethiopian Environment Outlook: Health and Environment Past, Present and Future Perspectives
Final Report
April 2005 Prepared by: Fikru Tessema Position: Author of the Chapter

2
1 Introduction
1.1 Aim of the Report
This report is for a thematic area: Health and Environment as part of Ethiopian Environment Outlook (EEO) and presents a summary of Health and Environment by describing its sub-thematic areas. The objective of this report is, therefore, to give sufficient information on Health burden from environmental factors and contribute to country Environment Outlook Report.
1.2 Layout of the report
This report is divided into five sections dealing with some important sub thematic areas of health and environment.
2 Sub-thematic Areas
The major selected sub-thematic areas that have importance for public health and environment are, therefore: Water and Sanitation, Physical School Environment, Waste Management, Malaria and HIV/AIDS.
2.1 Water and Sanitation
o Lead indicators
The lead indicators for water and sanitation are the lowest level of water and sanitation coverage of Ethiopia and that the country is stated as having the lowest coverage in Sub-Saharan Africa countries. Coverage of potable water supply and improved sanitation services are thought to be generally proportion of population with access to safe water and basic sanitation and hence meeting millennium development goals and percentage of existing functioning water supply schemes and basic sanitation facilities.
o Drivers/Pressures
Each year in millions of people is in need to tap the earth’s water in Ethiopia and especially rural population (84%) that also containing the greatest number of poor suffering significantly from lower water coverage than urban area. 76% of those that do not receive safe and adequate water supply live in the rural areas and this country’s high rural population makes water supply particularly challenging and complicated, due to having to supply remote and diverse areas and strong regional variation in water coverage. Rural supply is mostly through point sources at present with an urgent need for rehabilitation of non-functional supply schemes about 30 to 45% of existing schemes. The present key challenges in Ethiopia are the predominantly rural population and rapid population growth occurring in urban areas that will have significant impacts on water coverage in years to come. On the other hand the

3
leaking or oozing effect of most sanitation facilities in urban setting is seen to cause public health problems and environmental degradation. The 2015 Millennium Development Goal Target is to halve the proportion of Ethiopians without access to improved sanitation, i.e., for more than 30.53 million people in 15 years (2.04 million people/year) should have to have access to improved sanitation facilities. This high number of people with out improved sanitation facility also makes sanitation MDG of Ethiopia challenging.
o State of water and sanitation in Ethiopia
Safe and adequate water supply and basic sanitation service coverage is extremely low in Ethiopia – currently, population with access to safe water is about 30% and out of which 72% in urban and 24% in rural and access to excreta disposal 29% in which low number of population (11.5%) with access to improved sanitation facilities, out of which 50% in urban and 4% in rural. Water service delivery is particularly poorly managed in rural areas with a lack of community ownership and investment being flagged as key problems with a vicious circle exists between poor service delivery, poor maintenance, lack of ownership and lack of investment. Some regions have abundant, untapped stores of water to support growth well into the future. But others those far from plentiful are in scare of water, with expensive increases in supplies and technology options. In urban areas of Ethiopia, water coverage on the whole is much higher compared with rural areas; however reliability of service is still a problem here. The poor service delivery in urban areas has resulted in an informal supply network (provided through neighbors and public taps – this forms 70% of the urban in these areas and an unwillingness to pay amongst urban stakeholders, who are on the whole more able to pay than their rural counterparts. Tariffs are set at an unsustainably low level with the use of inappropriate technology (too costly or sophisticated given existing funding and capacity levels) is a key issue in the water supply sector.
o Impacts from lack of access to safe water and sanitation
The prevailing health burden as a result of low services coverage of basic sanitation is that more than 250,000 children die every year from sanitation related diseases and about 60% of the disease burden is related to poor sanitation and hygiene in Ethiopia.
4
0.0
1.0
2.0
3.0
4.0
5.0
6.0
7.0
8.0
P
e
r
c
e
n
t
(
%
)
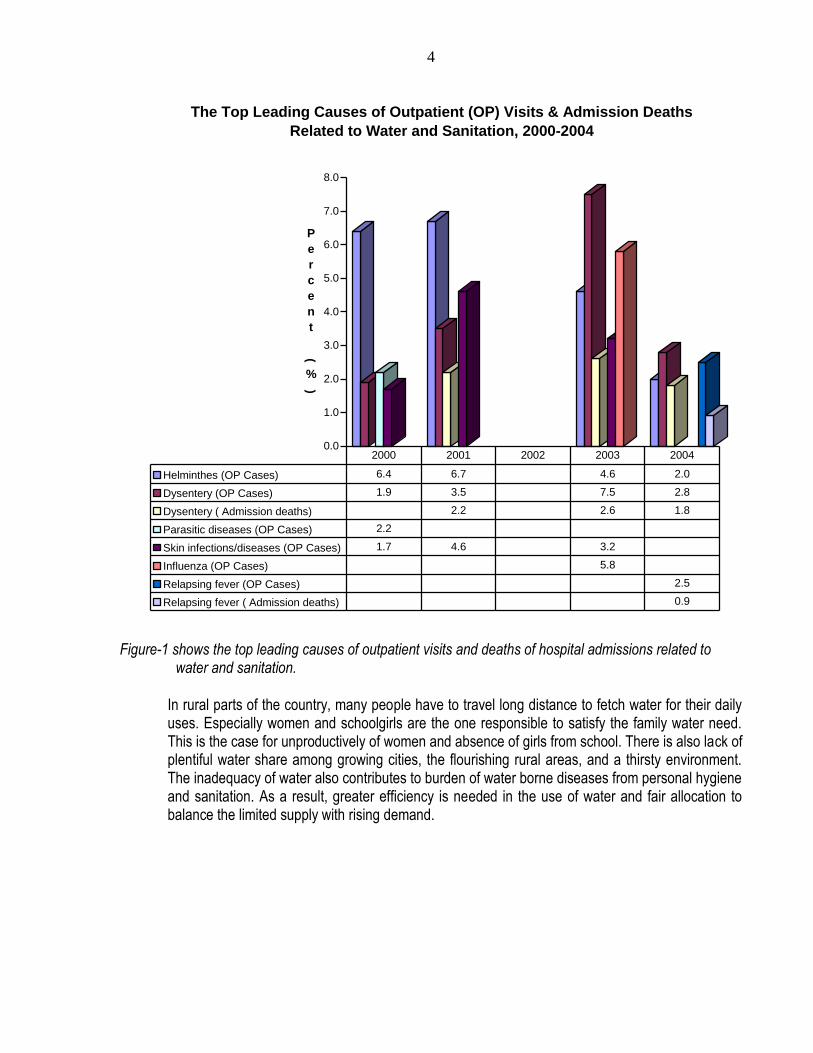
The Top Leading Causes of Outpatient (OP) Visits & Admission Deaths
Related to Water and Sanitation, 2000-2004
Helminthes (OP Cases) 6.4 6.7 4.6 2.0
Dysentery (OP Cases) 1.9 3.5 7.5 2.8
Dysentery ( Admission deaths) 2.2 2.6 1.8
Parasitic diseases (OP Cases) 2.2
Skin infections/diseases (OP Cases) 1.7 4.6 3.2
Influenza (OP Cases) 5.8
Relapsing fever (OP Cases) 2.5
Relapsing fever ( Admission deaths) 0.9
2000 2001 2002 2003 2004
Figure-1 shows the top leading causes of outpatient visits and deaths of hospital admissions related to
water and sanitation.
In rural parts of the country, many people have to travel long distance to fetch water for their daily uses. Especially women and schoolgirls are the one responsible to satisfy the family water need. This is the case for unproductively of women and absence of girls from school. There is also lack of plentiful water share among growing cities, the flourishing rural areas, and a thirsty environment. The inadequacy of water also contributes to burden of water borne diseases from personal hygiene and sanitation. As a result, greater efficiency is needed in the use of water and fair allocation to balance the limited supply with rising demand.

5
0
1000
2000
3000
4000
5000
6000
7000
8000
N
u
m
b
e
r
o
f
C
a
s
e
s
&
D
e
a
t
h
s
The TOP Leading Causes of Epidemics and Deaths from those Epidemics Related to
Water and Sanitation , 2000-2004
Diarrhea (Cases) NA 188
Typhus (Cases)) 758 77 98 226
Typhus (Deaths) 8 NA 4
Relapsing fever (Cases) 1348 444 381 506
Relapsing fever (Deaths) 14 15 6 3
Desentry (Cases) 7662 123 1405 334
Desentry (Deaths) 235 2 46 4
Influenza (Cases) 148 1483
Influenza (Deaths) 2
Food poisoning (Cases) 61
Cholera (Cases) 1146 4670
Cholera (Deaths) 61 35
2000 2001 2002 2003 2004
Figure-2 shows the top leading causes of epidemics and deaths from those epidemics related to water and
sanitation.
o Reponses of the government
Some evidence even suggests that Ethiopia is reversing its progress towards the water and sanitation. The Government of Ethiopia (GoE) has developed a WSDP (Water Sector Development Plan), which looks at organizing capacity building at regional and district (woreda) level throughout Ethiopia. NGOs on the whole tend to fill this funding and capacity gap in the bottom of the rural

6
supply chain currently. Donors also recommend funds to be dedicated for water, sanitation and hygiene in WASH programmes. The Government of Ethiopia (GoE) has dedicated line ministries, the Ministry of Health (MoH) and Ministry of Water Resources (MoWR) that are responsible for developing and implementing the national policy, strategy and subsequent government initiatives. The existence of these specific line ministries gives the issue some prominence in the government. Ethiopia, as already mentioned, is implementing a generic policy of decentralization, which the WSDP follows in terms of plans to devolve decision-making powers to regional and woreda (district) levels. Aadvancing decentralisation is dedicated towards people leading their own development. Positive examples abound from the regions offering lessons which can be taken to scale: For example, Southern Regions have achieved 75% sanitation facilities coverage with its own resources through political (and budget) commitment, inter-sectoral collaboration, and accountability and community ownership.
2.2 Physical School Environment
o Lead indicators
The lead indicator for physical school environment is healthy physical school environment that thought to be generally a contributor to school enrollment rates, especially in girls. Conducive physical school environment is also thought to be supporting children’s health and effective learning and hence contribute to have healthy, skilled and productive members of the future society.
o Drivers/Pressures
Most school environment cannot directly improve children’s health and effective learning and thereby contribute to the development of healthy adults as skilled and productive members of the society. Furthermore, even if schools act as an example for the community, students as members of the school community did not become aware of environmental risks at school and recognize ways to make home and community environments safer. In addition, because of low level of students’ awareness about the link between the environment and health they would not be able to recognize and reduce health threats in their own homes.
o State of physical school environment
The physical school environment encompasses the school building and all its contents including physical structures, infrastructure, the site on which a school is located; and the surrounding environment including the air, water and as well as nearby land uses, roadways and other hazards.

7
The physical school environment in Ethiopia is the one that poorly managed especially in rural settings and even further in primary schools. Currently, it becomes one of the primary determinants of children’s health. The physical school environment has a strong influence on children’s health for several reasons: contaminated water supplies can result in diarrheal disease; air pollution can worsen acute respiratory infectious and trigger asthma attacks; and exposure to heavy metals and pesticides can cause a variety of health effects and even death.
o Impacts from lack of healthy physical school environment
The higher rate of morbidity in schools is primarily due to the high incidence of acute respiratory infections, vector borne diseases (malaria), water and food borne diseases (diarrhea, intestinal parasites) and injuries due to road traffic and poor management of play ground in Ethiopia. High rate of incidence and prevalence rate of infections and diseases and lack of access to toilet facilities, especially girls, in school contributed to increased number of absence of children from school. In urban settings, children are exposed to outdoor air pollution from poor waste disposal, industry, traffic exhaust fumes and dusts on their way to school and home, and outdoor air pollutants may enter into the classroom.
o Reponses of the government
The Government of Ethiopia is promoting school hygiene and sanitation programme in primary schools in both rural and urban settings by coordinating bilateral and multilateral organizations and NGOs and strengthening intersectoral collaboration. The Government of Ethiopia is also standardizing and up-grading school infrastructure and physical structures so as to make conducive school environment. The Government of Ethiopia has also developed education policy to enhance access to education and facilitate private sector involvement.
2.3 Waste Management
o Lead indicators
The lead indicator for waste management is the status of the service coverage, which thought to be currently in a very weak sate in Ethiopia in terms of infrastructure and capacity. The indicators for waste management are, therefore, thought to be generally proportion of population with access to solid waste management services and proportion of environmentally friendly functioning existing solid waste management and treatment facilities. Regarding technology in use, most of the urban centers do not have appropriate type solid waste collection trucks and few municipalities also assigned appropriate type of vehicles to collect waste.

8
Among those who provide a service with appropriate type of vehicle, the coverage is very low, usually being limited to street sweeping and municipal waste management.
o Drivers/Pressures
The majority of the people are suffering from lack of sanitation facilities. Besides, few portion of wastewater not more than 2% of the total produced is treated by the handling system whereas the remaining major portion (99%) of domestic wastewater is simply disposed-off in open fields or simply left in the environment uncollected and/or untreated. The sewerage system is very limited in its coverage, whereas the majority of the urban population use on-site sanitation system, still a significant proportion use open fields for disposal of wastes. The storm water drainage system (both of drain-pipes and open-ditch drains) is mismanaged and abused for wastewater conveyance. Health care facilities in Ethiopia are also lacking standard handling and disposal of infectious wastes. As a result there is high risk of exposure to contamination especially from sharp wastes and surgical wastes. Municipal solid waste management (SWM) is also the one that poorly managed in Ethiopia. The main problems of SWM are due to poor micro routing for collection, lack of standard collection points, lack of equipment and personnel, lack of budget, and poor disposal facility and operational procedure.
o State of waste management in Ethiopia
Municipal SWM service only exists in some urban centers, but in most rural areas there is no SWM function. There is no overall national strategy for SWM improvements in Ethiopia. In most rural areas of Ethiopia solid waste management is not carried out in an organized manner. Many of the people are very poor, and appropriate waste management is not a priority. SWM investments are minimal and there is no formal structure of charging waste generator through out the country and therefore recovery no recovering costs. The weak financial and recovery system are one of the major sources of the poor waste management performances. At present private sector participation in SWM is also limited mainly to informal pre-collection companies in some urban centers. There is a wide variation in performance in relation to waste collection in urban centers of Ethiopia. In many cities there are not enough skips to cover the population and vehicles are typically poorly maintained and out of service for long periods of time. The operational performance at the dumpsite is poor in relation to environmental impacts and health risks in Ethiopia. Wastewater sources are mainly domestic & industrial. Major domestic wastewater sources are residences, public toilets, commercial centers (hotels, restaurants, etc.), hospitals & institutions (GOs, NGOs & private). Industrial wastewater sources are beverage, tanneries (leather & foot

9
wears), textiles, food, pulp & paper, petrochemicals (dying, plastics & related), soap & detergents, iron & steel, non-ferrous metals, rubber, tobacco, pharmaceuticals and wood industries. Industrial wastewater is estimated quantitatively and qualitatively. The average wastewater production per ton of individual products (by industry type) ranges from 0.09 cubic meters for soap & detergents to 87.09 cubic meters for pharmaceuticals. Accordingly, quantity of industrial wastewater produced in Ethiopia between 1990 and 1997 amounts to 35.65 million cubic meters (on average ~ 4.45 + 0.275 Mm3/yr). Its average growth rate is 2.36%. Like some other developing countries, the majority of the population of Ethiopia has a very few toilet facilities and wastewater handling systems. There is no standard handling and disposal of infectious wastes from health care facilities in Ethiopia. Special wastes like sharp and surgical wastes are the one that highly contributing to infections from blood borne pathogens because of lack of segregation at point of their sources.
o Impacts from lack of access to waste management
Since waste management service coverage is low, there are significant environmental and health impacts from poor waste collection and disposal practices in urban setting and low impacts in rural areas since waste generation rate is very low. There is a shortfall in collection points in the urban settings in Ethiopia, and therefore these collection points often overflow with waste. Due to poor operational performance at the dump site there is negative environmental impacts and health risks, for example, because of:
lack of covering of waste, which results in odours, wind-blowing of waste, and leachate run-off and
leachate management, and lining to the landfill, resulting in potential leaching of heavy metals and other toxic pollutants into the ground water, as well as surface run-off of these pollutants.
Unsafe health care waste management highly contributes to risks of exposure to contamination of the workers and the environment and the community at large. Due to lack of proper design and routine maintenance, most of the available facilities and equipment do not serve the intended purpose and are rather acting as sources of health risks. The unsanitary situation created due to mismanagement and lack of facilities for waste disposal is seen to cause public health problems and environmental degradation. For example streams & rivers crossing the city are affected by domestic, industrial and health care wastes and wastewater. Some 96% of industrial wastewater is disposed-off in the environment without any treatment. This shows that there is a potential risk to air, water & soil pollution in areas where untreated industrial wastewater discharges exist.
o Reponses of the government
In some urban settings, they established a responsible body to manage solid waste; decentralized
the management to sub-city level (Kebele) to make them responsible in dealing with their own

10
waste management problems; conducted public awareness programs on television and radio;
planed improving river banks, streets and greenery of open areas, expansion of composting
activities and pre-collectors and strengthening the capacity of informal recyclers.
The Federal Environment Protection Authority has been developed a national framework for private
sector participation and working on developing national solid waste management strategy.
The Federal Ministry of Health intended to have an efficient, safe and environmentally-friendly health care waste management that will be the only means of ensuring of contamination from infectious wastes and disposable syringes and needles are not re-used and does not lead to accidental needle stick injuries. This important activity included:
o Formulation of a policy stating that disposal is part of the syringe lifecycle and that healthcare services have a duty to manage sharps waste
o Assessment of the waste management system, including expressed and real needs o Selection of appropriate waste disposal systems for all levels of healthcare facilities o Implementation of a regulatory framework (enforcement) and human and financial
resources in place. o Implementation of a waste management system and supervision and monitoring
mechanism in place.
2.4 Malaria
o Lead indicators
The lead indicators for malaria are its prevalence rate that lead to high morbidity and mortality rate in Ethiopia. The indicators for prevalence of malaria are, therefore, thought to be generally outpatient visit, hospital admission and death rates of malaria.
o Drivers/Pressures
Malaria accounts for 11 - 15% of the total outpatient morbidity/visits and 18 - 20% of all hospital admissions in Ethiopia. Malaria also accounts for 15% of outpatient visits and 21% hospital admissions for female and 11 - 15% of outpatient visits and 18 - 20% hospital admissions for infants. Malaria is also one of the number one top leading causes of deaths and its case fatality rate in all cases is 27%, in female 27% and in infants 21%.
o State of malaria in Ethiopia
Based on the occurrence of malaria, the country can be divided into malarious and non-malarious areas. The non-malarious zone with an altitude above 2250m is the area where no indigenous transmission occurs. This area comprises 15-20% of the total landmass and is inhabited by about 25% of the total population. The malarious zone, which refers to the land below 2200m makes up 80-85% of the total landmass; roughly a minimum of 35-40% of the population live in this region and are at risk of malaria infection.

11
Anticipated increase in temperature and change in rainfall would have direct and indirect impact on the health sector. It will in particular influence weather and climate sensitive diseases by increasing population of vectors such as misquotes, by increasing heat stress, etc. Climatic, altitudinal and topographic diversities in Ethiopia create micro and macroclimatic conditions that result in a discontinuous and widespread malaria distribution. Malaria in Ethiopia is a major public health problem. It occurs in most parts of the country and is unstable in its nature mainly due to topographical and climatological conditions. The transmission of malaria is dependent on temperature, rainfall and humidity. Since 1958, major epidemics of malaria occurred at intervals of approximately 5-8 years, but recently there is a trend of more frequent small or large scale epidemics occurring in the same or different parts of the country. Currently, there are number of epidemics precipitating factors in addition to natural environmental or climatological factors including drug resistance of malaria, high-scale population movement (due to resettlement and labor forces in agro-industrial development areas) and expansion of development activities such ad irrigation schemes.
o Impacts from malaria
The environmental and temperature changes in the country led to the spread of malaria, which could also, led the morbidity and mortality rates reaching epidemic proportion in the past. People living in the malarious area were suffering from the disease and brought an economic burden because of the decrease of the population in the productive age. These communities are especially vulnerable to climate change as most of the mitigation measures are beyond their resources.
Figure-3 shows malaria epidemics and deaths from those epidemics. The emergence/occurrence of malaria in new areas; for example, in 1998, large-scale and severe malaria epidemics occurred in most highland areas in the country. The outpatient visits, hospital
1887419 110 3 474822
269453
220
0
50000
100000
150000
200000
250000
300000
No
of
Cases &
Death
s
2000 2001 2002 2003 2004
Y e a r
Malaria Epidemics and Deaths from those Epidemics, 2000-2004
Malaria(Epidemics)
Malaria(Epidemicdeaths)

12
admissions and deaths rates are increasing from time to time in the country and hence put socio-economic burden from the treatment of malaria on the health services.
o Reponses of the government
The Federal Ministry of Health has formulated different intervention mechanisms for the prevention and control of malaria: - Establish surveillance system and integrated vector control approach; - Conduct awareness raising programme on malaria prophylaxes, environmental control, and
treatment; - Encourage the use of malaria bed net and developed guideline on environmental health
management for settlements and during disasters, which includes the control of malaria.
2.5 HIV/ADIS
o Lead indicators
The lead indicators for HIV/AIDS are morbidity and mortality rates from its high prevalence rate and impacts on Ethiopia’s society and economy. The indicators for prevalence of the HIV/AIDS are, therefore, thought to be generally sero-positive cases, hospital admission and death rates of HIV/AIDS.
o Drivers/Pressures
The cumulative numbers of population lived with HIV/AIDS and orphaned children needing care and support will be taxing, to say the least. So will the demand on the limited social services, particularly the health care delivery system. The other socio-economic impacts are also expected to be daunting and require special attention if we were to continue and succeed on the present mode of economic development and poverty alleviation efforts. On the other hand, given the magnitude of the impact, the disturbing picture of the after effects and the poverty level of the country, the positive trends are not satisfactory enough to give respite.
o State of HIV/AIDS in Ethiopia
HIV was first detected in Ethiopia in 1984 in stored sera. The first two AIDS cases were reported to the Federal Ministry of Health (MOH) in 1986. HIV/AIDS surveillance activities began in 1989 and since then the HIV epidemic appears to have steadily increased in Ethiopia. There are many cultural factors that promote the spread of the disease. Known risk factors include the presence of sexually transmitted infections (STIs), multiple sexual partners, and harmful traditional practices such as female genital mutilation, uvulectomy, blood letting, skin cutting, and piercing practices. The estimated national adult HIV prevalence in 2003 is 4.4%, of which 12.6% are urban and 2.6% rural. Trend analysis of prevalence from 1982-2003 showed an urban epidemic that rose sharply to a peak, and that has plateaued over the last 7 years; a steady rise of rural prevalence with consistent decrease inn the rate of progression; and a continuing gradual rise in national prevalence but with beginning signs of levelling at relatively low level.

13
The rate of new infections (incidence), which is usually the most reliable in indicating the progression of an epidemic, showed an urban incidence that rose sharply until 1990/91, declined over the following 7 years and plateaued there after albeit at a high level; rural incidence rose slowly until 2000 and levelled off at a much lower rate than the urban; and although national incidence parallels both the urban and rural trends, it is closer to the rural incidence. The cumulative number of people living with HIV/AIDS is about 1.5 million (3.8% male and 5% female; 12.6% urban & 2.6% rural) out of which about 96,000 are children under 15 years. The estimated number of new AIDS cases in the adult population in 2003 was 98,000 (46% male & 54% female) while that in children was 25,000. Some 245,000 people living with HIV/AIDS were in need of antiretroviral treatment (ART) in 2003 and some 90,000 adults and 25,000 children had died of AIDS also in 2003. Although the behavioural surveys to date indicate some encouraging signs, the limited impact surveys and socio-economic impact analysis on blood sample results such as life expectancy, orphaned children, trained workforce and the social services, indicate a grave situation requiring an immediate scaled up and focused intervention. The national HIV incidence rate in Ethiopia is levelling off and the rate at which it is progressing is declining over the last few years and the epidemic appears to be stabilizing, particularly in urban areas, indicating some behavioural change in the population. This is also supported by the level of awareness about the disease, the tremendous increase in condom distribution and the increasing utilization of voluntary counselling and testing services by different social groups. We need to capitalize on these achievements and do more.
0.00%
2.00%
4.00%
6.00%
8.00%
10.00%
12.00%
14.00%
16.00%
18.00%
20.00%
HIV
Pre
vale
nce R
ate
15-24 25-34 35-49 Total
Age Group
HIV Prevalence by Age Group and Site Setting, 2003
Urban
Rural
Urban+Rural
Figur-4 shows HIV prevalence (%) by age group and site setting.

14
o Impacts from HIV/AIDS
Possible impact analysis on different variables shows that HIV/AIDS has a variable effect and detrimental impact on Ethiopia’s society and economy. Therefore the impact of HIV:
1. On annual TB cases accounted for an estimated 38% or 54,000 of all TB case in incidence in 2003.
2. On total population size is that the population lost to AIDS was about 900,000 by 2003 and is projected to reach 1.8 million by 2008 if present trends continue.
3. On young adult deaths account for about a third of all young adult deaths in the country. 4. On life expectancy (LE) on average is expected to reduce LE in Ethiopia by 4.6 years in
2003. 5. On number of orphans is causing an increase of the number of AIDS orphans in the past.
There were an estimated 539,000 AIDS orphans in 2003 and would also lead to 332,000 fewer AIDS orphans by 2008 with anti-retroviral treatment (ART).
Estimated and Projected Adult HIV Prevalence (%) by Sex and Setting
Selected Years, 1982 - 2008.
0.0
2.0
4.0
6.0
8.0
10.0
12.0
14.0
16.0
1982 1985 1990 1995 2000 2001 2002 2003 2008
Year
Perc
en
tag
e (
%)
National
Male
Female
Urban
Rural
Figur-5 shows estimated and projected adult HIV prevalence (%) by sex and setting selected years,
1982 - 2008.

15
The National HIV/AIDS taskforce was established in 1985 as a national response to the epidemic. The National AIDS Control Program (NACP) was later established at a Department level at the Ministry of Health in 1987. Two medium-term prevention & control plans were designed and implemented in 1989 and 1996 respectively. Currently, a team under the Disease Prevention and Control Department functions as the focal point of the health sector's response to HIV/AIDS and has representation from the federal to the district levels of health care management.
The HIV/AIDS Policy was formulated by MOH and adopted by the Council of Ministers in 1998. This created an enabling environment for HIV/AIDS prevention and control. The policy supplemented several policies such as the Health Policy, Women's Policy, and the Education and Training Policy calling for a multisectoral response; guaranteeing rights for PLWHA; and facilitation the development of policies on the supply and use of antiretroviral (ARV) drugs, amongst other things. The HIV/AIDS Prevention & Control Office (HAPCO) was established in 2002, under the Prime Minister's Office. It is responsible for resource mobilization, advocacy, and for the coordination of the sectoral responses. HAPCO developed the National Strategic Framework as a national response to HIV/AIDS.
The priority interventions implemented in the country include: information education and communication/ behaviour change communication (IEC/BCC); condom promotion & distribution; voluntary counselling and testing (VCT); management of sexually transmitted infection (STI); blood safety; universal precaution; prevention of mother-to-child transmission (PMTCT) of HIV; care and support to the infected and affected; legislation and human rights; surveillance; and research.
References
1. MoWR WSDP (2002-2016), Executive Summarry,2002 2. MoWR, WSDP, Water Supply and Sanitation Programme, 2002 3. WB & MoH, Ethiopia Sanitation Strategy, 2004 4. WB, Regulatory and Institutional Reform in the Municipal Solid Waste management Sector,
Ethiopia: Strategy for the development of a framework for PSP in SWM in Ethiopia, July 2004 5. MoWR, WSDP, Projects Profiles, 2002 6. MoH. Health & Health Related Indicators, 2002 – 2004 7. UNDP, Ethiopian Water Millennium Development Goals Need Assessment, 2004. 8. CSA, Population & Housing Census, Statistical Report for Ethiopia, 2003 9. MoFED, Development and Poverty Profile of Ethiopia, March 2002 10. www.ethiopia.net 11. NMSA, Initial National Communication of Ethiopia to the UNFCCC, June 2001 12. WHO & UNICEF, Creating an Environment for Emotional and Social Well-being: An Important
Responsibility for a Health Promoting and Child-Friendly School, 2003 13. UN Commission on Sustainable Development, A gender Perspective on Water Resources and
Sanitation, April 2005 14. WHO & UNICEF, Skills for Health: Skills-Based Health Education Including Life Skills, 2003 15. WHO, The Physical School Environment: An Essential Component of a Health-Promoting School,
2004 16. UN, United Nation Millennium Development Goals Declaration, 2000 17. WB, World Bank Information on Environment Millennium Development Goals, September 2004 18. UN-Wate/Africa, African Water Journal, December 2003

16
19. UN-Water/Africa, Africa Water Vision 2025 20. UN-ECA, Integrated Water Resources Management, Nov. 2003 21. EPA, State of Environment Report for Ethiopia, August 2003 22. MoH, AIDS in Ethiopia, Fifth Report , June 2004


![18599925 1 Final EEO-1 Pay Data Webinar PPT.PPTX [Read-Only] · use the EEO-1 Report to collect data from private employers and government contractors about their women and minority](https://img.pdfslide.us/doc/110x75/601fee9358f2d245ea212868/18599925-1-final-eeo-1-pay-data-webinar-pptpptx-read-only-use-the-eeo-1-report.jpg)