Embed Size (px)
Citation preview

Joel O. Paz, Mary Love M. Tagert, Jonathan W. Pote, and Charles L. Wax
USDA NIFAProject Directors Meeting
Greensboro, NCJuly 27-28, 2015
Downstream Water Quality and Quantity Impacts of Water Storage Systems in
Porter Bayou Watershed
Grant Agreement Number: 2011-51130-31168
Introduction Since the 1970’s,
groundwater levels in the MS Alluvial Aquifer have decreased (100,000 to 300,000 acre-feet/year) due to an increase in irrigated acres (YMD Water Management Plan, 2006; USDA-NRCS, 1998).
Increasing hypoxic zone (Rabalais and Turner, 2010).
Sunflower County

Motivation Two main impediments to sustainability of
agroecosystems in the MS Delta: 1. Declining groundwater levels in the MS Delta
Alluvial Aquifer2. Nutrient loads to the MS River and the Gulf of
Mexico
Goal: Determine the impacts of water storage systems on water quality and quantity
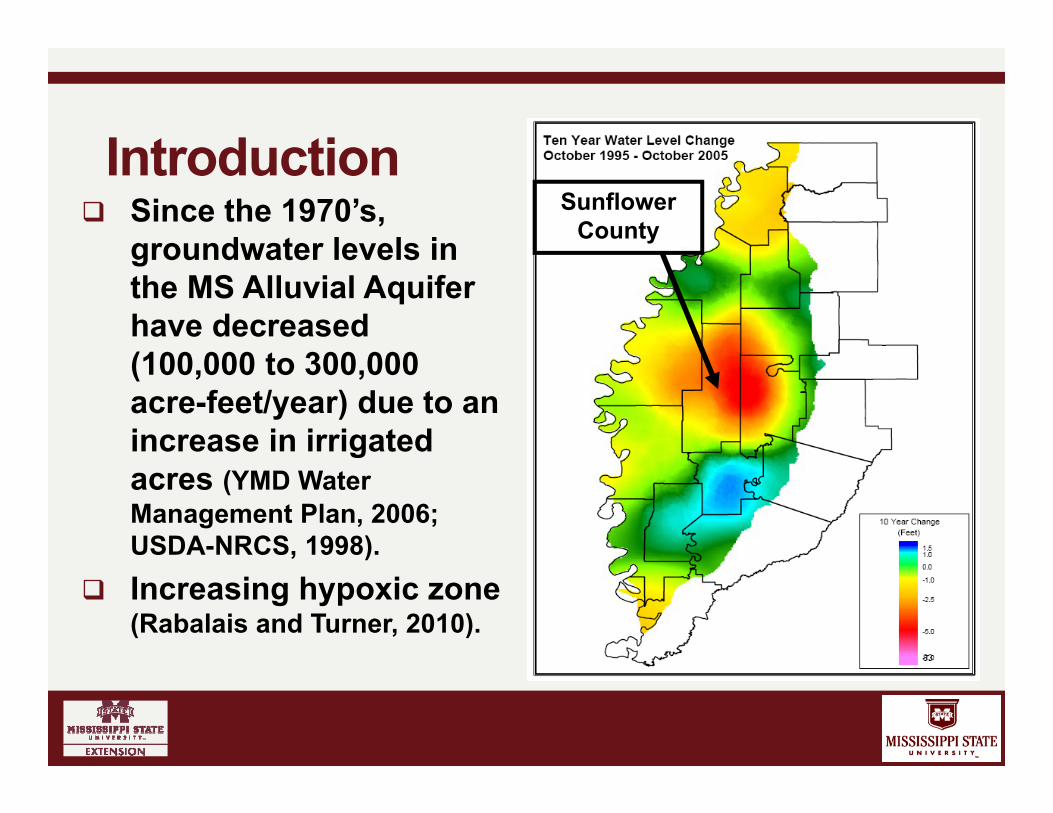
Study Area Porter Bayou drains into
Big Sunflower River EPA Priority Watershed
(HUC 08030207) MRBI focus area watershed 2008 TMDL report indicated
reduction of nutrients could be accomplished with the installation of BMPs (MDEQ)
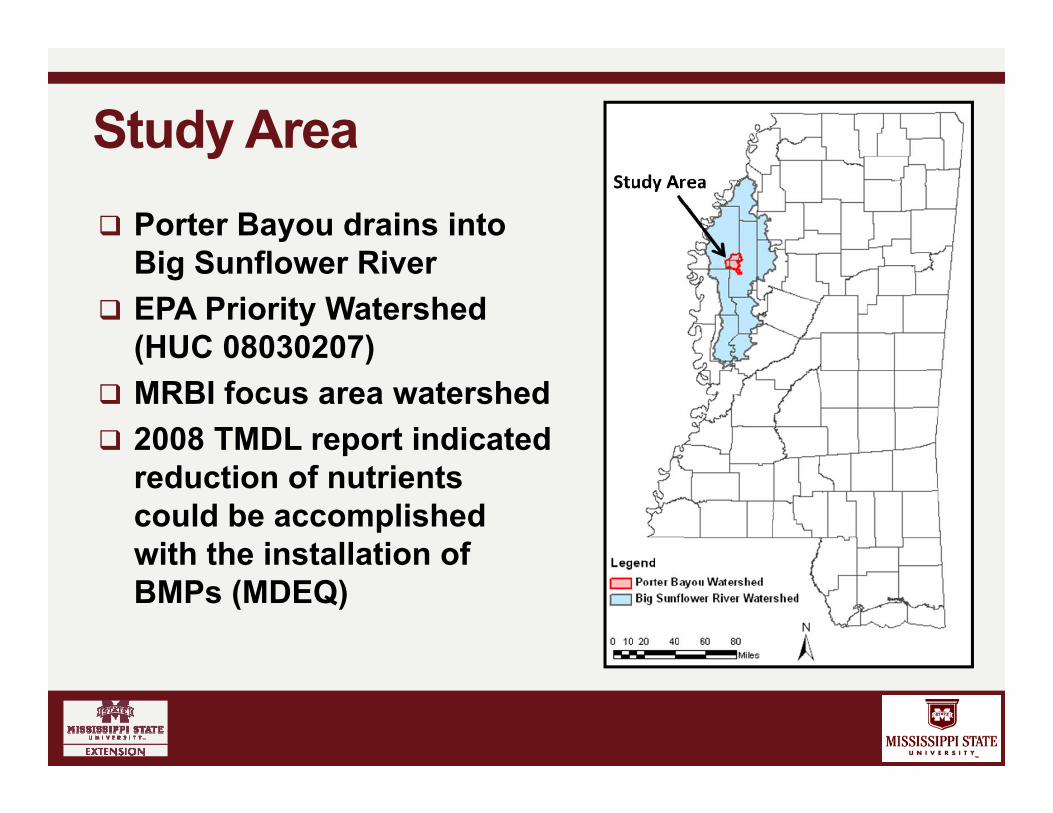
Main Objectives1. Determine the downstream nitrogen and
phosphorus concentrations of effluent from water storage systems.
2. Quantify the effects of water storage systems on downstream flow levels through a watershed.
3. Increase the adoption of on-farm water storage technology and dissemination of potential benefits.
4. Enhance the science education of middle and high school students by promoting the benefits of water conservation and environmental stewardship.

Tailwater Recovery DitchStorage Pond
On-Farm Storage Water System
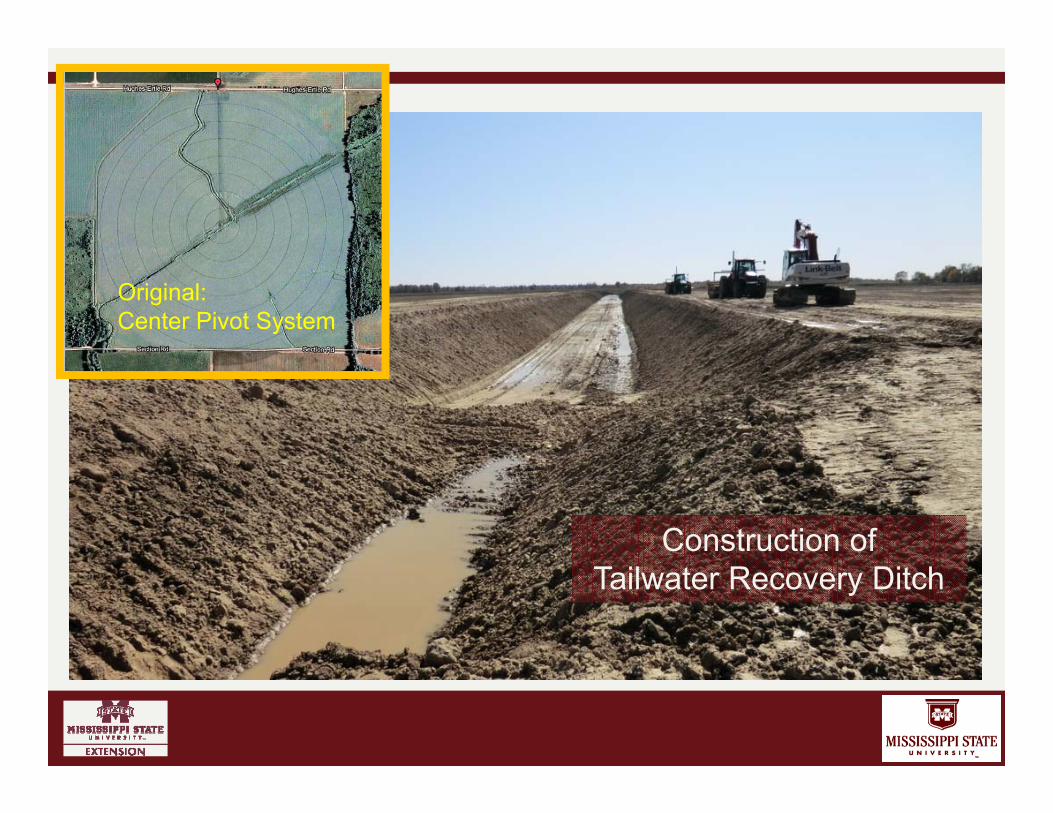
Original:Center Pivot System
Construction of Tailwater Recovery Ditch
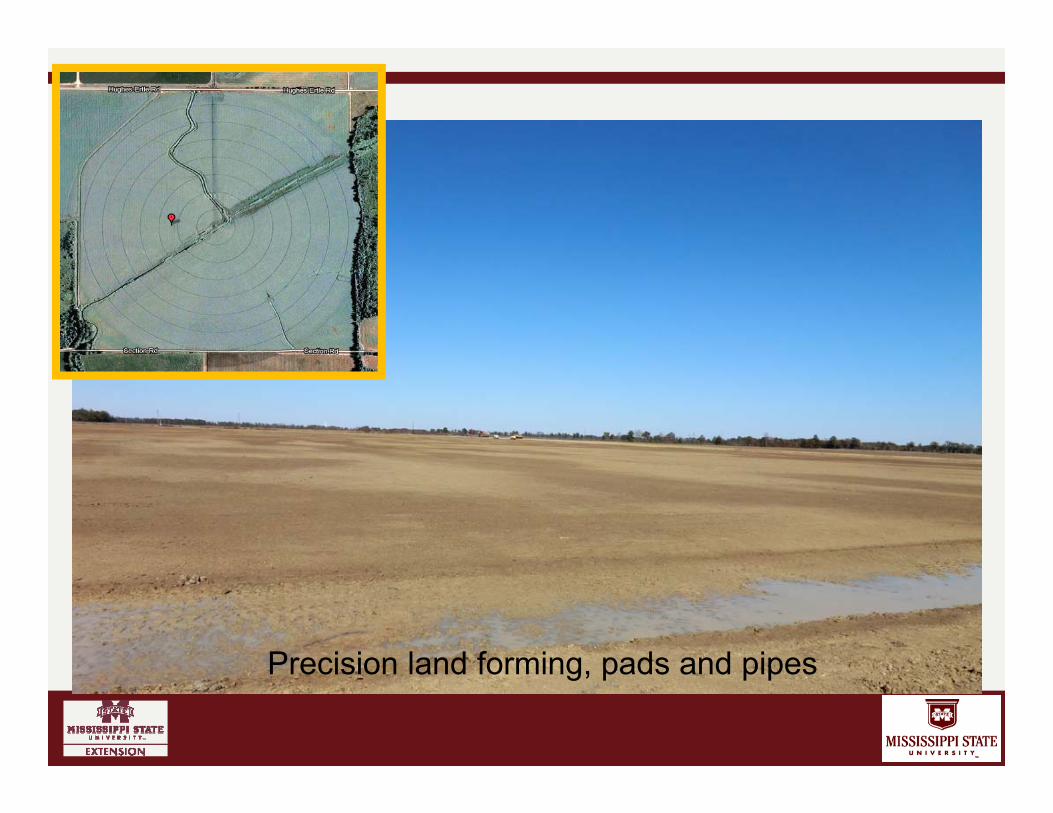
Precision land forming, pads and pipes

After Precision Land Forming and Construction of OFWS
• Switched from center pivot to furrow irrigation with poly-pipe• Capturing all runoff from rainfall and irrigation tailwater
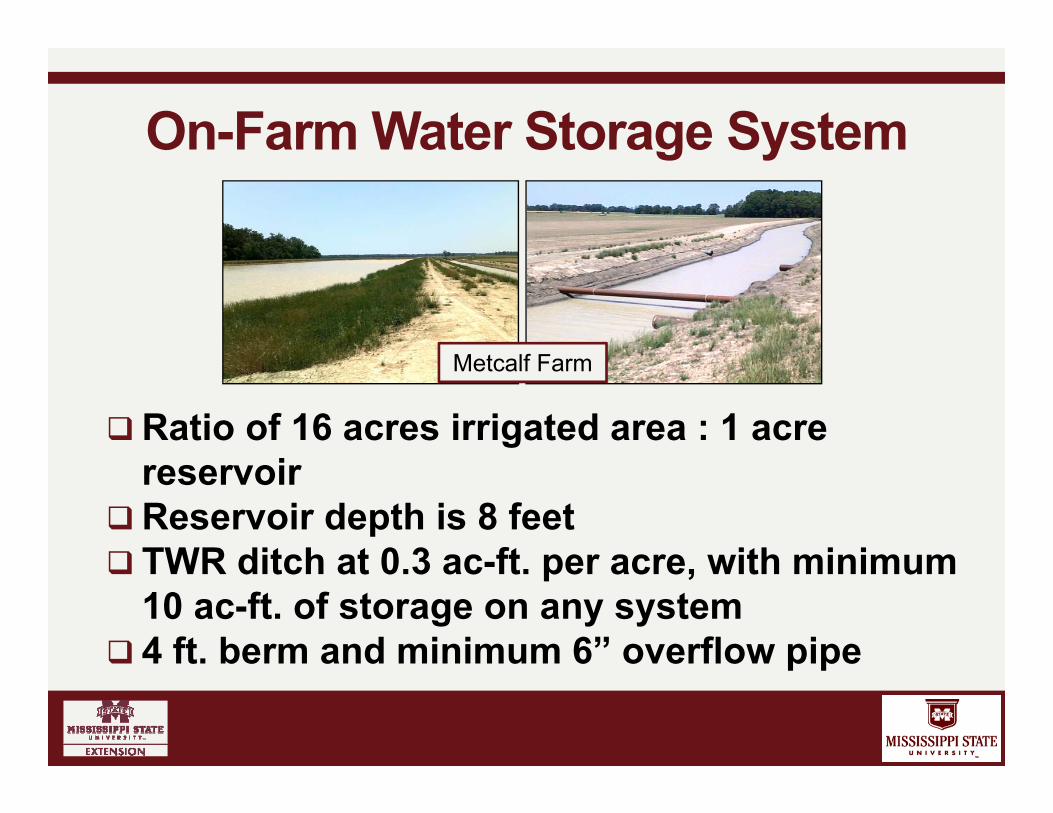
On-Farm Water Storage System
Ratio of 16 acres irrigated area : 1 acre reservoir
Reservoir depth is 8 feet TWR ditch at 0.3 ac-ft. per acre, with minimum
10 ac-ft. of storage on any system 4 ft. berm and minimum 6” overflow pipe
Metcalf Farm

Pitts Farm
On-Farm Water Storage System
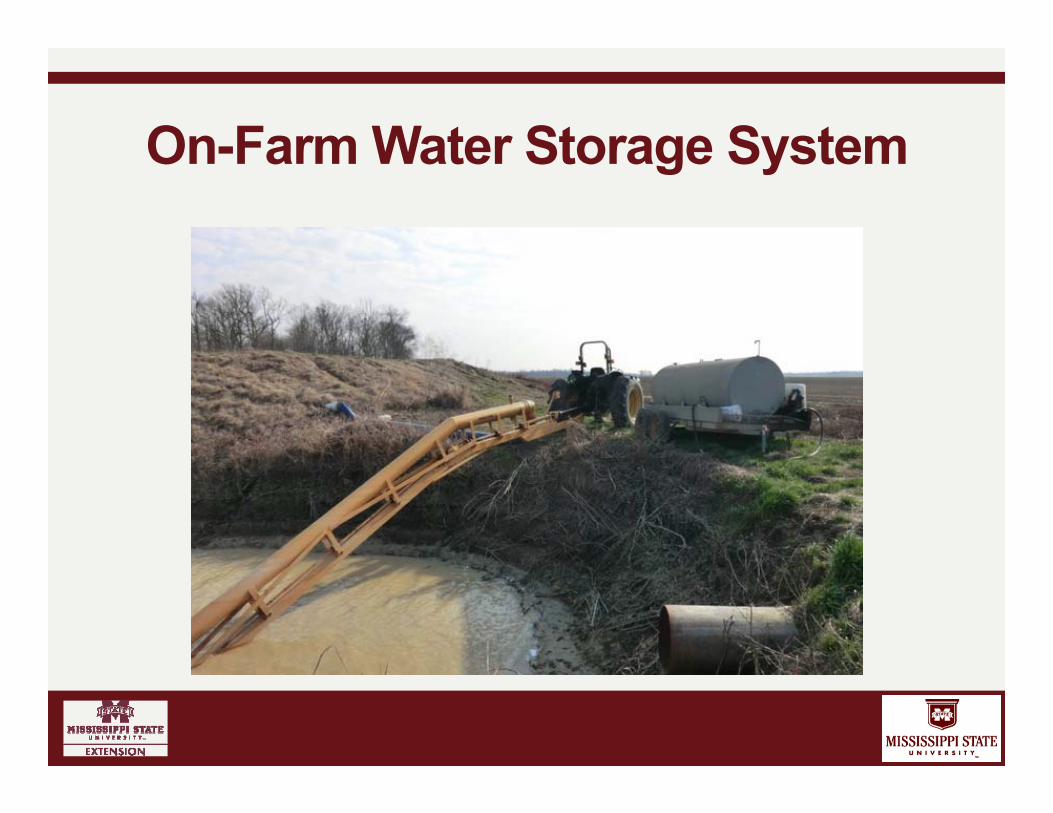
On-Farm Water Storage System
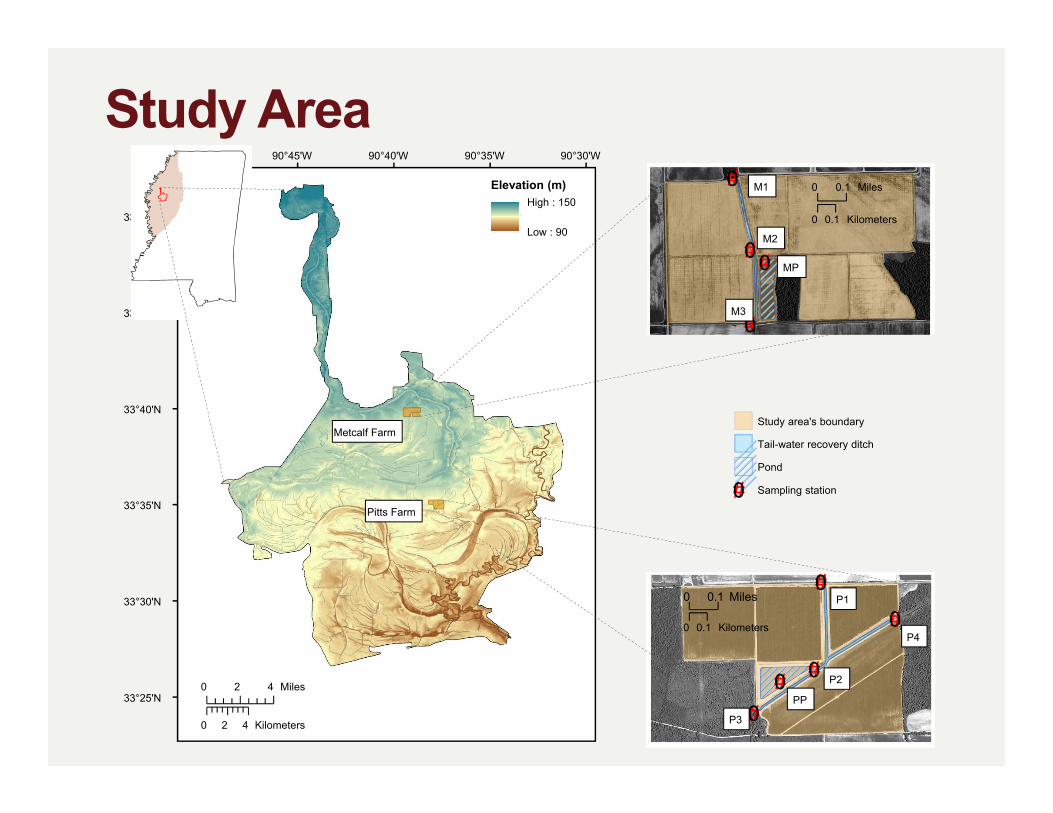
Study Area90°30'W90°35'W90°40'W90°45'W90°50'W
33°50'N
33°45'N
33°40'N
33°35'N
33°30'N
33°25'N
Elevation (m)High : 150
Low : 90
#0
#0#0
#0
#0#0
#0
#0
#0
Study area's boundary
Tail-water recovery ditch
Pond
#0 Sampling station
0 0.1 Miles
0 0.1 Kilometers
0 2 4 Kilometers
0 2 4 Miles
0 0.1 Miles
0 0.1 Kilometers
M3
MP
M2
M1
P1
P4
P2
PP
P3
Pitts Farm
Metcalf Farm

Methods: Grab samples Samples were collected
from inlet(s), TWR canal, outlet, and storage pond on both farms.
Samples were collected every three weeks during growing season, and every six weeks during winter.
Samples were analyzed for pH, electrical conductivity, dissolved oxygen, nitrogen and phosphorus species, and suspended solids.

Methods: Automated stormwater samples Samples were collected at
mid-point of recovery channel.
Samples were collected using ISCO automatic samplers set to sample based on a rise in channel water level.
Samples were analyzed for the same nutrient species as grab samples.
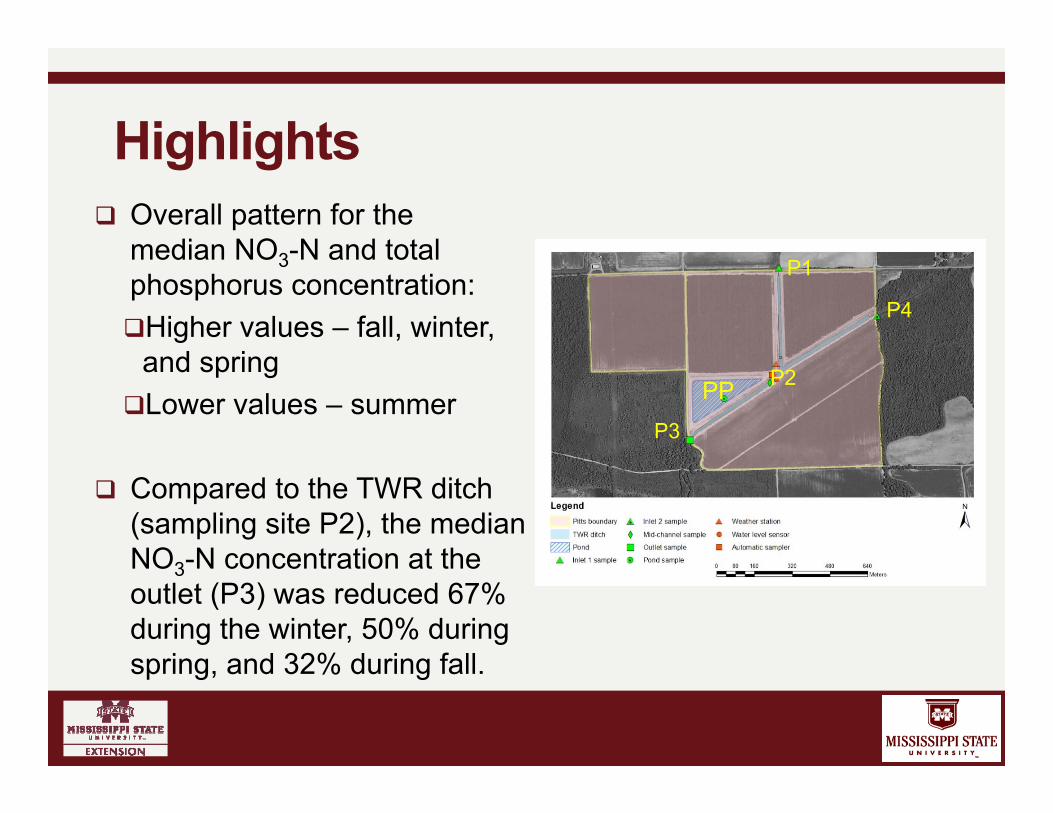
Highlights Overall pattern for the
median NO3-N and total phosphorus concentration:Higher values – fall, winter,
and springLower values – summer
Compared to the TWR ditch (sampling site P2), the median NO3-N concentration at the outlet (P3) was reduced 67% during the winter, 50% during spring, and 32% during fall.
P1
P2
P3
P4
PP

Seasonal Variability of NO3-N ConcentrationPitts Farm
S1-Winter; S2-Spring; S3-Summer; S4-Fall

Summary of hypothesis test results for detecting statistically significant changes in NO3-N concentration
Sampling StationSeason S1 S2 S3 S4 S1 S2 S3 S4 S1 S2 S3 S4 S1 S2 S3 S4
S1 0.86 - - - 0.36 - - - 0.19 - - - 1 - - -S2 - 0.44 - - - 0.19 - - - 0.1 - - - 0.99 - -S3 - - 0.06 - - - 0.76 - - - 0.57 - - - 1 -S4 - - - 0.96 - - - 1 - - - 0.004 - - - 0.37
S1 - - - - 0.1 - - - 0.98 - - - 1 - - -S2 - - - - - 0.1 - - - 0.99 - - - 0.99 - -S3 - - - - - - 1 - - - 0.05 - - - 1 -S4 - - - - - - - 0.1 - - - 0.71 - - - 0.98
S1 - - - - 0.78 - - - 1 - - -S2 - - - - - 0.98 - - - 1 - -S3 - - - - - - 0.36 - - - 1 -S4 - - - - - - - 0.25 - - - 0.98S1 - - - - 1 - - -S2 - - - - - 0.99 - -S3 - - - - - - 1 -S4 - - - - - - - 0.99
P1
P2
P3
P4
P2* P3* P4** PP***
(* right-tailed, ** two-tailed, and *** left-tailed p-values; bold-faced values indicate evidence against the null hypothesis)

Seasonal Variability of Total Phosphorus ConcentrationPitts Farm
S1-Winter; S2-Spring; S3-Summer; S4-Fall

Summary of hypothesis test results for detecting statistically significant changes in TP concentration
(* right-tailed, ** two-tailed, and *** left-tailed p-values; bold-faced values indicate evidence against the null hypothesis)
Sampling StationSeason S1 S2 S3 S4 S1 S2 S3 S4 S1 S2 S3 S4 S1 S2 S3 S4
S1 0.39 - - - 0.5 - - - 0.55 - - - 0.98 - - -S2 - 0.23 - - - 0.23 - - - 0.65 - - - 0.98 - -S3 - - 0.19 - - - 0.27 - - - 0.52 - - - 0.99 -S4 - - - 0.63 - - - 0.58 - - - 0.45 - - - 0.980
S1 - - - - 0.5 - - - 0.2 - - - 1 - - -S2 - - - - - 0.64 - - - 0.27 - - - 0.98 - -S3 - - - - - - 0.7 - - - 0.07 - - - 0.98 -S4 - - - - - - - 0.35 - - - 0.48 - - - 0.99
S1 - - - - 0.45 - - - 0.98 - - -S2 - - - - - 0.3 - - - 0.98 - -S3 - - - - - - 0.22 - - - 0.98 -S4 - - - - - - - 0.18 - - - 0.99S1 - - - - 1 - - -S2 - - - - - 0.99 - -S3 - - - - - - 0.99 -S4 - - - - - - - 0.99
P4**
P1
PP***
P2
P3
P4
P2* P3*
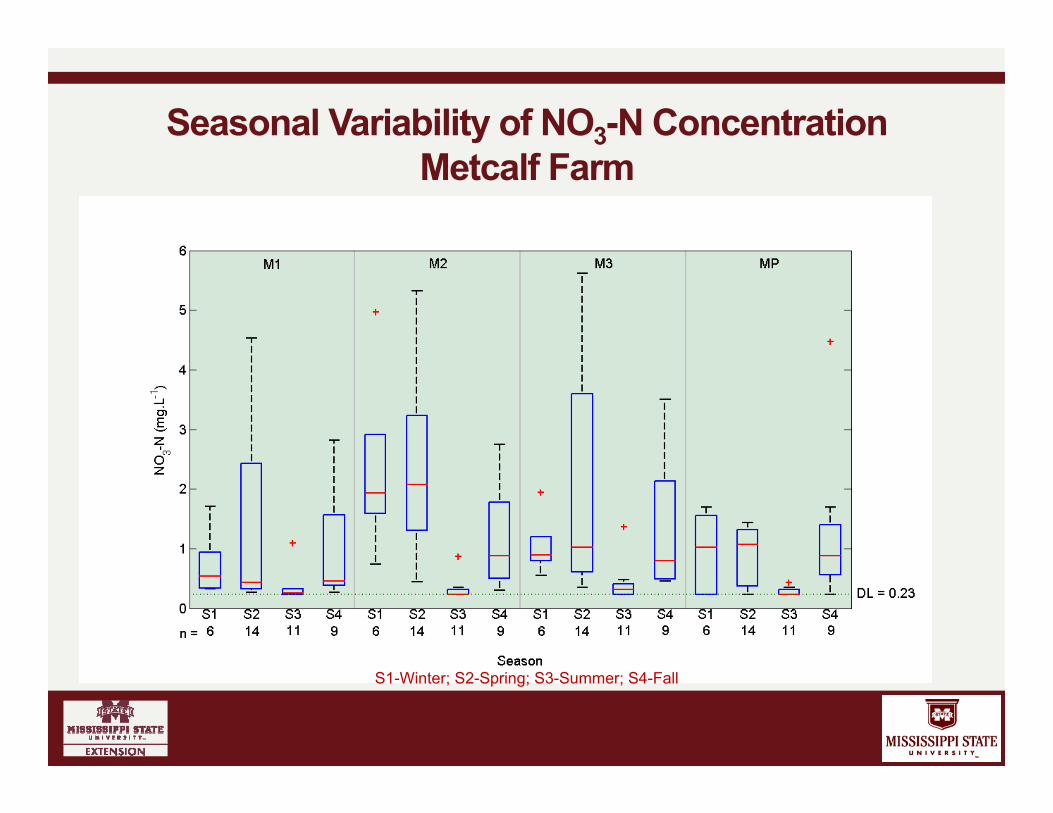
Seasonal Variability of NO3-N ConcentrationMetcalf Farm
S1-Winter; S2-Spring; S3-Summer; S4-Fall
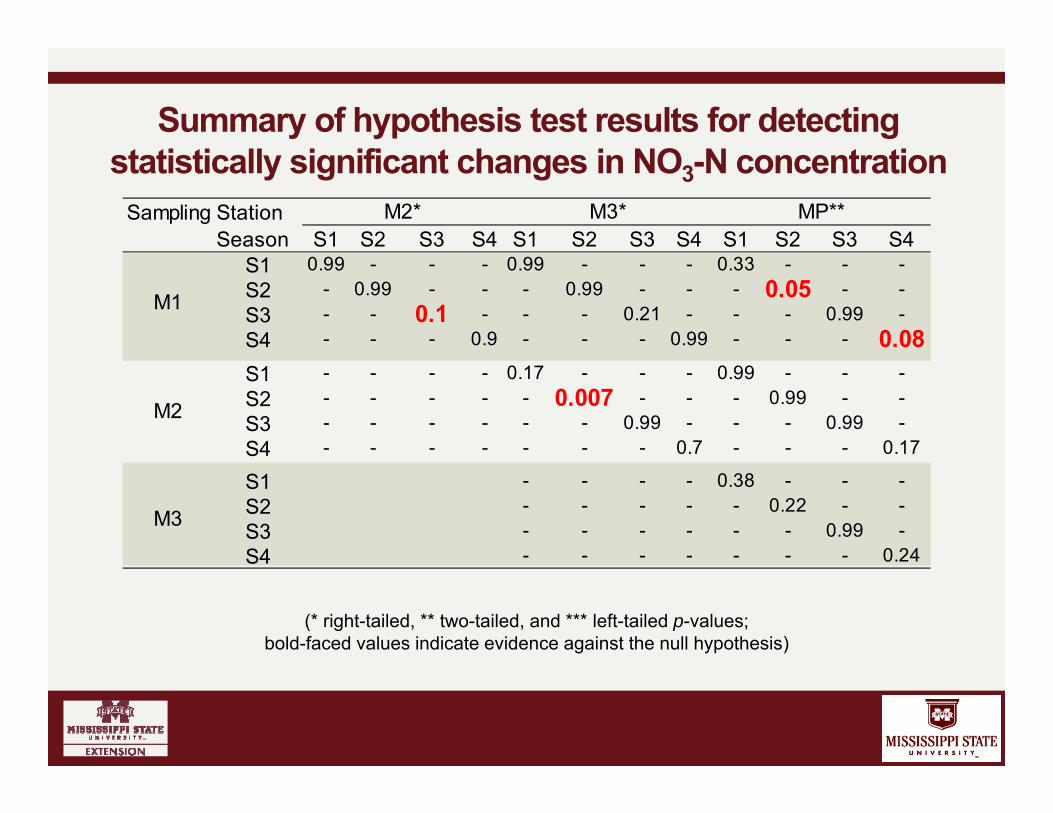
Summary of hypothesis test results for detecting statistically significant changes in NO3-N concentration
(* right-tailed, ** two-tailed, and *** left-tailed p-values; bold-faced values indicate evidence against the null hypothesis)
Sampling StationSeason S1 S2 S3 S4 S1 S2 S3 S4 S1 S2 S3 S4
S1 0.99 - - - 0.99 - - - 0.33 - - -S2 - 0.99 - - - 0.99 - - - 0.05 - -S3 - - 0.1 - - - 0.21 - - - 0.99 -S4 - - - 0.9 - - - 0.99 - - - 0.08S1 - - - - 0.17 - - - 0.99 - - -S2 - - - - - 0.007 - - - 0.99 - -S3 - - - - - - 0.99 - - - 0.99 -S4 - - - - - - - 0.7 - - - 0.17
S1 - - - - 0.38 - - -S2 - - - - - 0.22 - -S3 - - - - - - 0.99 -S4 - - - - - - - 0.24
M1
M2
M3
M2* M3* MP**

Seasonal Variability of Total Phosphorus ConcentrationMetcalf Farm
S1-Winter; S2-Spring; S3-Summer; S4-Fall

Summary of hypothesis test results for detecting statistically significant changes in Total Phosphorus concentration
(* right-tailed, ** two-tailed, and *** left-tailed p-values; bold-faced values indicate evidence against the null hypothesis)
Sampling StationSeason S1 S2 S3 S4 S1 S2 S3 S4 S1 S2 S3 S4
S1 0.99 - - - 0.77 - - - 0.13 - - -S2 - 0.98 - - - 0.91 - - - 0.81 - -S3 - - 0.42 - - - 0.44 - - - 0.99 -S4 - - - 0.78 - - - 0.94 - - - 0.09S1 - - - - 0.03 - - - 0.97 - - -S2 - - - - - 0.1 - - - 0.99 - -S3 - - - - - - 0.7 - - - 0.99 -S4 - - - - - - - 0.87 - - - 0.17S1 - - - - 0.10 - - -S2 - - - - - 0.99 - -S3 - - - - - - 0.99 -S4 - - - - - - - 0.3
M3
M3* MP**
M1
M2
M2*
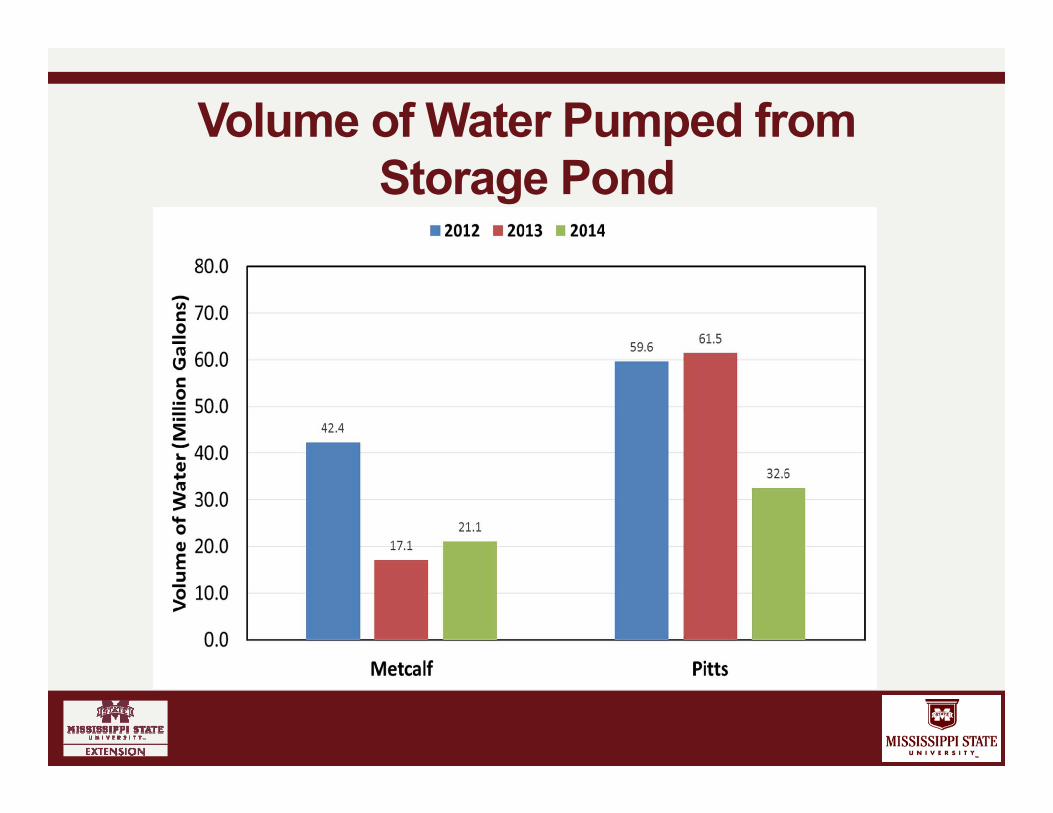
Volume of Water Pumped from Storage Pond
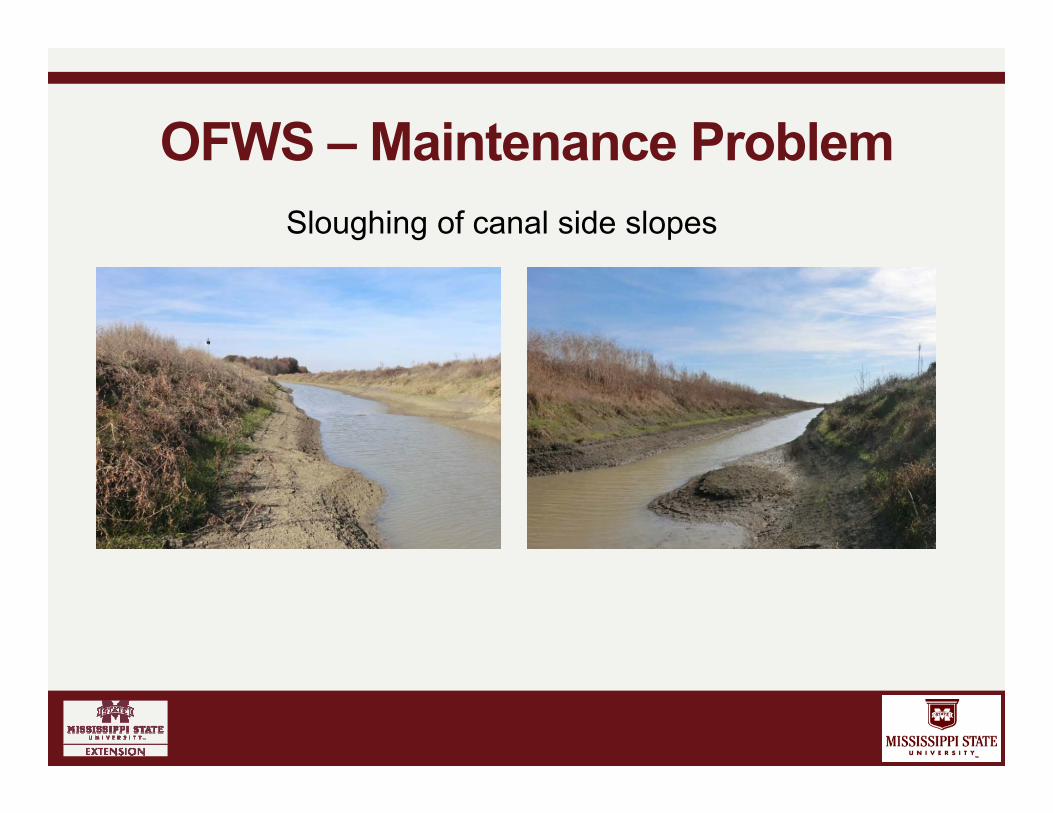
OFWS – Maintenance ProblemSloughing of canal side slopes
Conclusions Overall pattern for the median NO3-N and total phosphorus
concentrations: Higher values – fall, winter, and spring Lower values – summer
Assessment of nutrient changes through the system at Pitts Farm showed a reduction of 67% in nitrate nitrogen concentration during winter, 50% during spring, and 32% during fall.
Total phosphorus was reduced by 22% during the fall season. Water savings potential of OFWS systems is substantial Metcalf Farm : 80.6 million gallons (247.3 acre-ft) Pitts Farm : 153.7 million gallons (471.7 acre-ft)
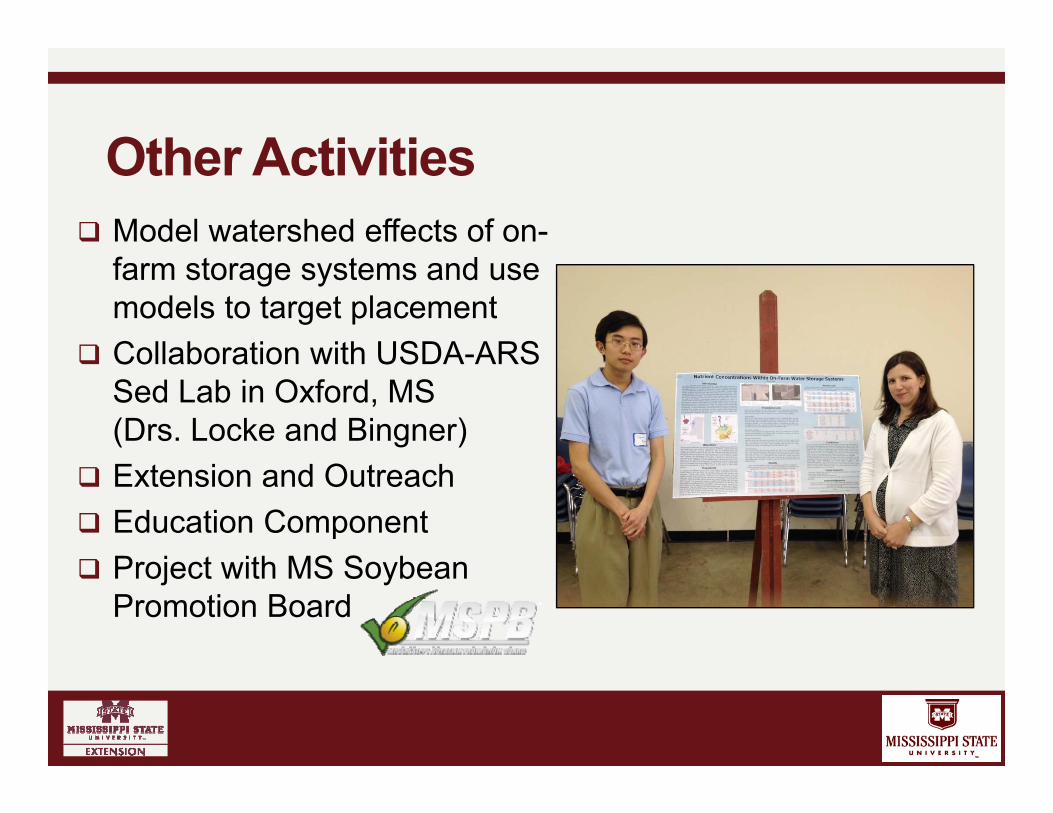
Other Activities Model watershed effects of on-
farm storage systems and use models to target placement
Collaboration with USDA-ARS Sed Lab in Oxford, MS (Drs. Locke and Bingner)
Extension and Outreach Education Component Project with MS Soybean
Promotion Board

Acknowledgments This project is funded by USDA NIFA under the National
Integrated Water Quality Program. Mississippi Agricultural and Forestry Experiment Station
Partners
Mr. Boyer Britt and Mr. Walter Pitts Delta F.A.R.M. MS Department of Environmental Quality MS Wildlife Federation USDA-NRCS Yazoo MS Delta Joint Water Management District