Embed Size (px)
Citation preview
Joint GFOI/GOFC-GOLD Expert Workshop 2: Approaches to monitoring forest degradation for REDD+
Characterizing Forest Degradation and Carbon Biomass Assessment in Tropical Peatlands
using Multi Remote Sensing Approaches
Arief WijayaCenter for International Forestry Research (CIFOR), Indonesia
Contributors: Ari Susanti, Oka Karyanto, Wahyu Wardhana, Lou Verchot, Daniel Murdiyarso, Richard Gloaguen, Martin Herold, Ruandha Sugardiman, Budiharto,
Anna Tosiani, Prashanth Reddy Marpu and Veraldo Liesenberg
Wageningen, The Netherlands
1-3 October, 2014
2
Project Background
• This work is part of CIFOR projects – Global Comparative Study on REDD+ (GCS REDD) –
work in 6 countries– Sustainable Wetlands Adaptation and Mitigation
Project (SWAMP) – work in > 20 countries• CIFOR is an international research organization
working based on three pillars – research, capacity building and media outreach

3
Background
• The presentation focuses on mapping of tropical peatlands in Indonesia using SAR and optical sensors
• Tested various classification approaches and SAR features combined with reflectance of optical data to improve image classification
4
Importance of Peatlands Ecosystem
• The GoI is preparing FREL submission to UNFCCC – emissions from deforestation, peat decomposition and peat fires
• Indonesia covers >80% (~20 Mha in 1990 out of 24 Mha) of tropical peatlands in SE Asia
• 1.1 Mha of intact peat swamp forests and 6.8 Mha of secondary peatlands forest were deforested from 1990 – 2012
5
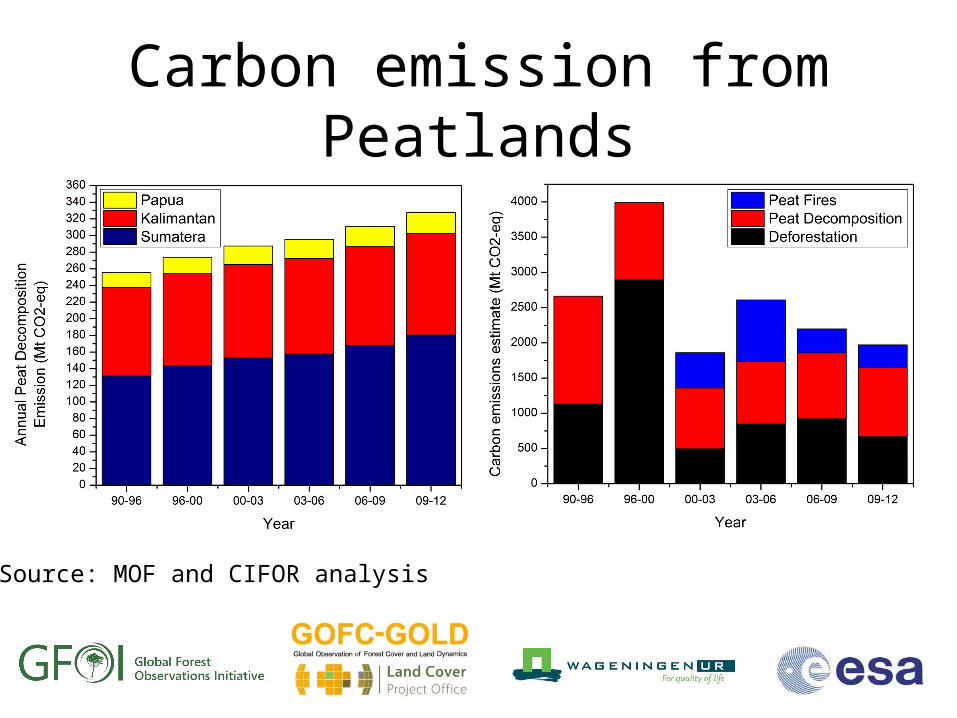
Carbon emission from Peatlands
Source: MOF and CIFOR analysis
6
National Forest Degradation Mapping
• Most likely based on national land cover change map from 1990 – 2013
• 23 land cover types – primary and secondary forests
• Degradation is change of primary to secondary forests – upland, mangrove, peat swamp ecosystems

7
Land Cover Classification SystemLanduse/cover classification of Indonesia for the years 1990, 1996, 2000, 2003, 2006, 2009, 2011, 2012 and 2013. Data source: LANDSAT satellite data (30 m resolution) (MOF, 2014)
No Classification
1 Primary Upland Forest2 Secondary Upland Forest/Logged Forest3 Primary Swamp Forest4 Secondary Swamp Forest/Logged Area5 Primary Mangrove Forest6 Secondary Mangrove Forest/Logged7 Crop Forest8 Oil Palm and Estate Crops9 Bushes/Shrubland10 Swampy Bush11 Savanna12 Upland Farming
No Classification
13 Upland Farming Mixed with Bush 14 Rice field15 Cultured Fisheries/Fishpond16 Settlement/Developed Land17 Transmigration18 Open Land19 Mining/mines20 Water Body21 Swamp22 Cloud 23 Airport/Harbor
8
• Characteristics: maps based on visual interpretation of Landsat data, MMU 6.25 ha, need to assess the consistency
• Not yet included in any national reporting – FREL submissions to UNFCCC during COP in Lima – issues of FD definition, REDD activity degradation/carbon stock enhancement
National Forest Degradation Mapping

9
Deforestation Drivers Analysis
What about drivers of forest degradation?
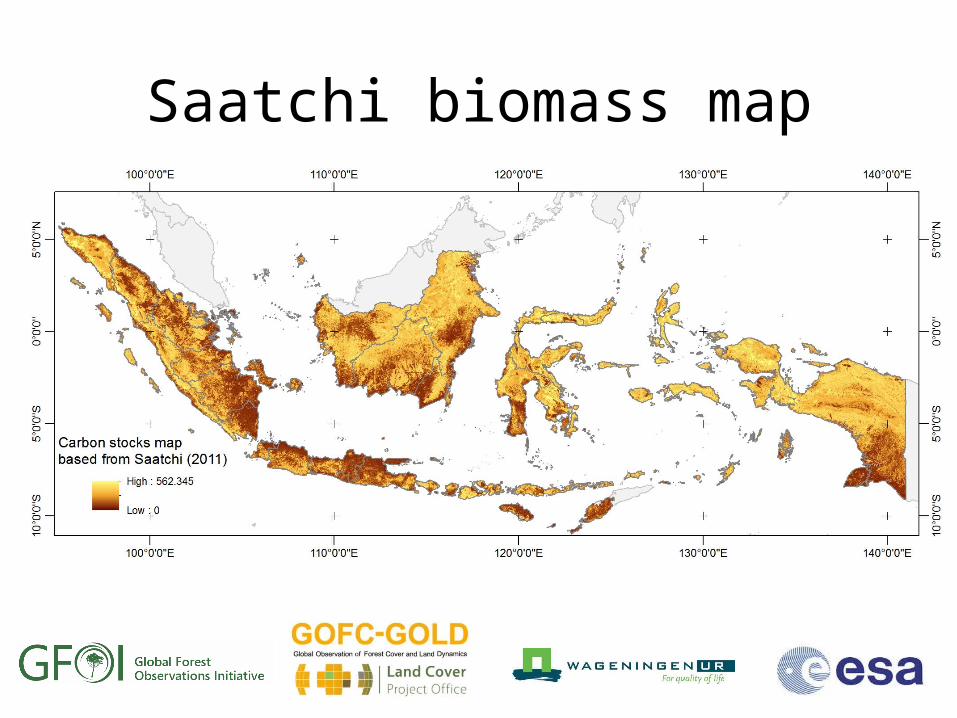
Saatchi biomass map
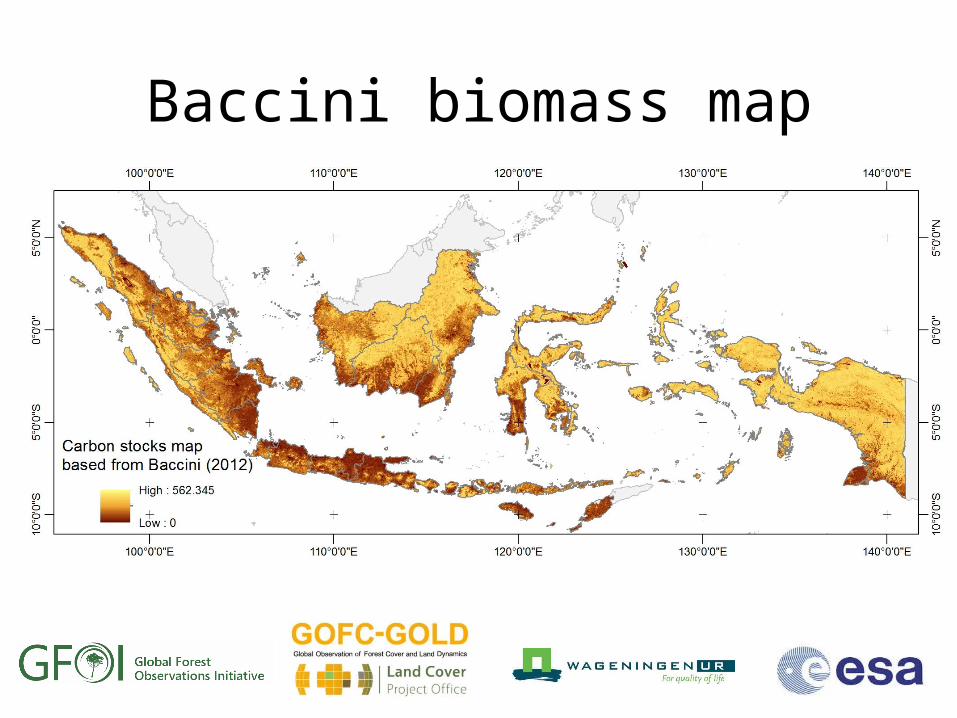
Baccini biomass map
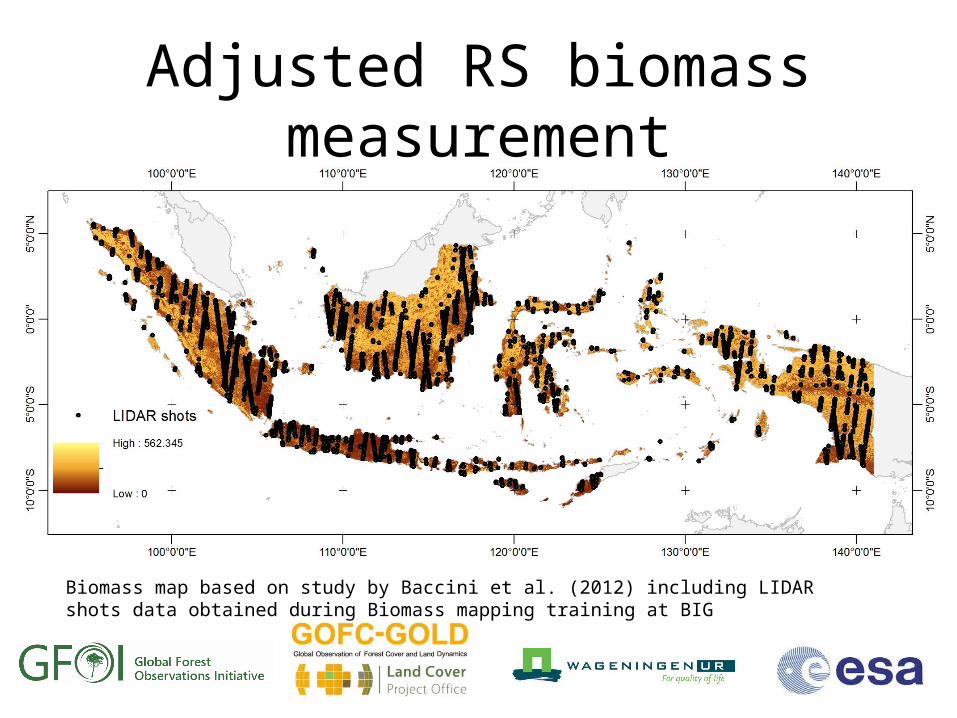
Adjusted RS biomass measurement
Biomass map based on study by Baccini et al. (2012) including LIDAR shots data obtained during Biomass mapping training at BIG
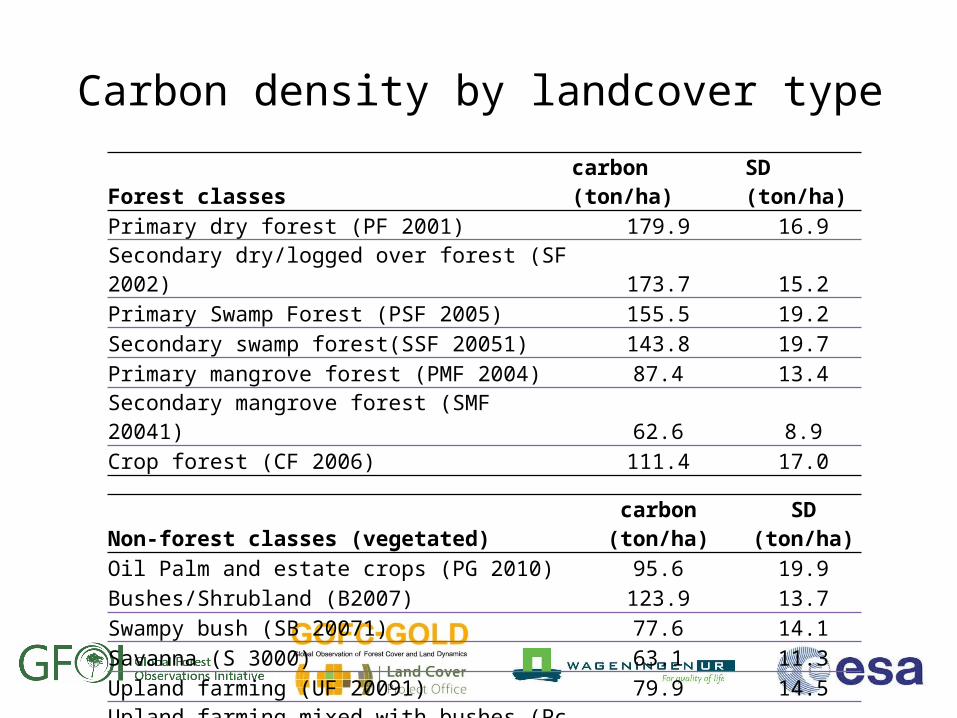
Carbon density by landcover typeForest classes carbon (ton/ha) SD (ton/ha)Primary dry forest (PF 2001) 179.9 16.9Secondary dry/logged over forest (SF 2002) 173.7 15.2Primary Swamp Forest (PSF 2005) 155.5 19.2Secondary swamp forest(SSF 20051) 143.8 19.7Primary mangrove forest (PMF 2004) 87.4 13.4Secondary mangrove forest (SMF 20041) 62.6 8.9Crop forest (CF 2006) 111.4 17.0
Non-forest classes (vegetated) carbon (ton/ha) SD (ton/ha)Oil Palm and estate crops (PG 2010) 95.6 19.9Bushes/Shrubland (B2007) 123.9 13.7Swampy bush (SB 20071) 77.6 14.1Savanna (S 3000) 63.1 11.3Upland farming (UF 20091) 79.9 14.5Upland farming mixed with bushes (Pc 20092) 115.2 17.2Rice field (Sw 20093) 62.8 12.0
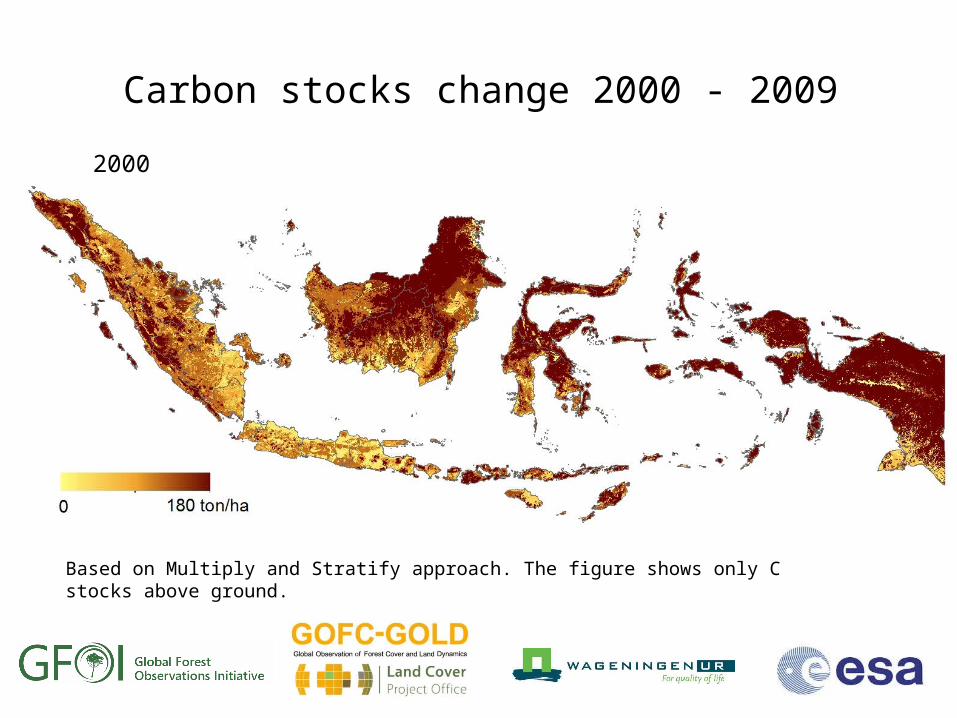
Carbon stocks change 2000 - 2009
Based on Multiply and Stratify approach. The figure shows only C stocks above ground.
2000
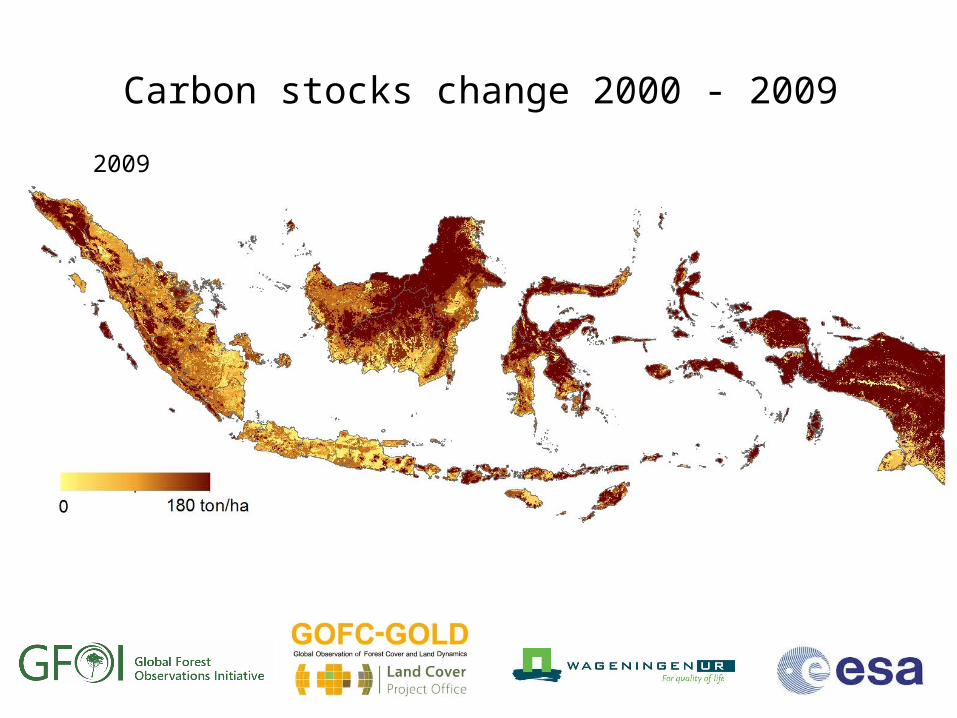
Carbon stocks change 2000 - 2009
2009
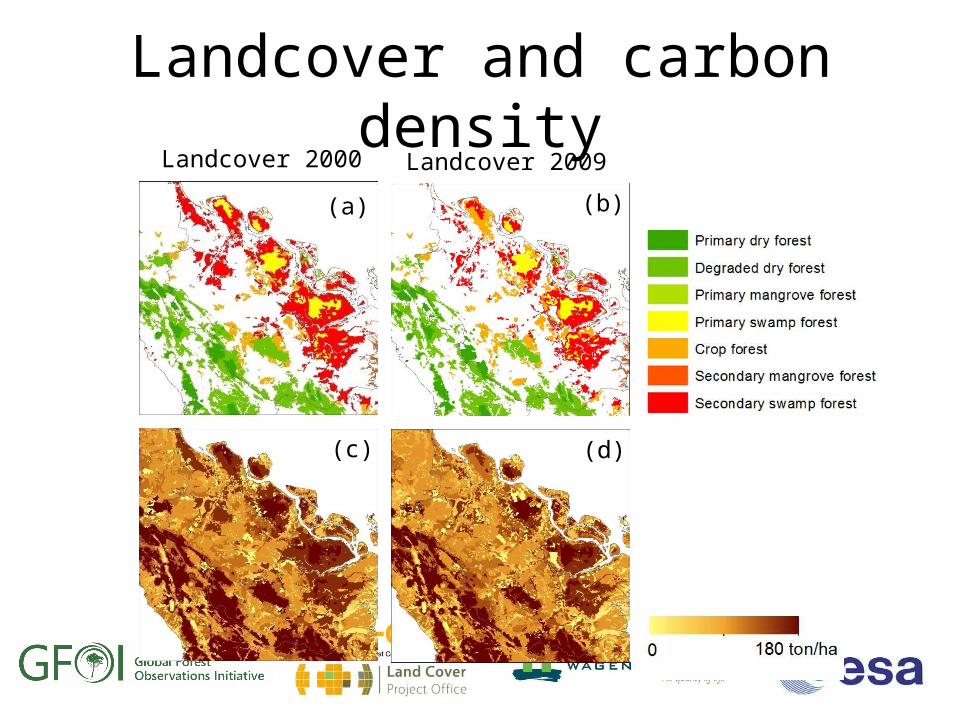
Landcover and carbon densityLandcover 2000 Landcover 2009
(a) (b)
(c) (d)
17
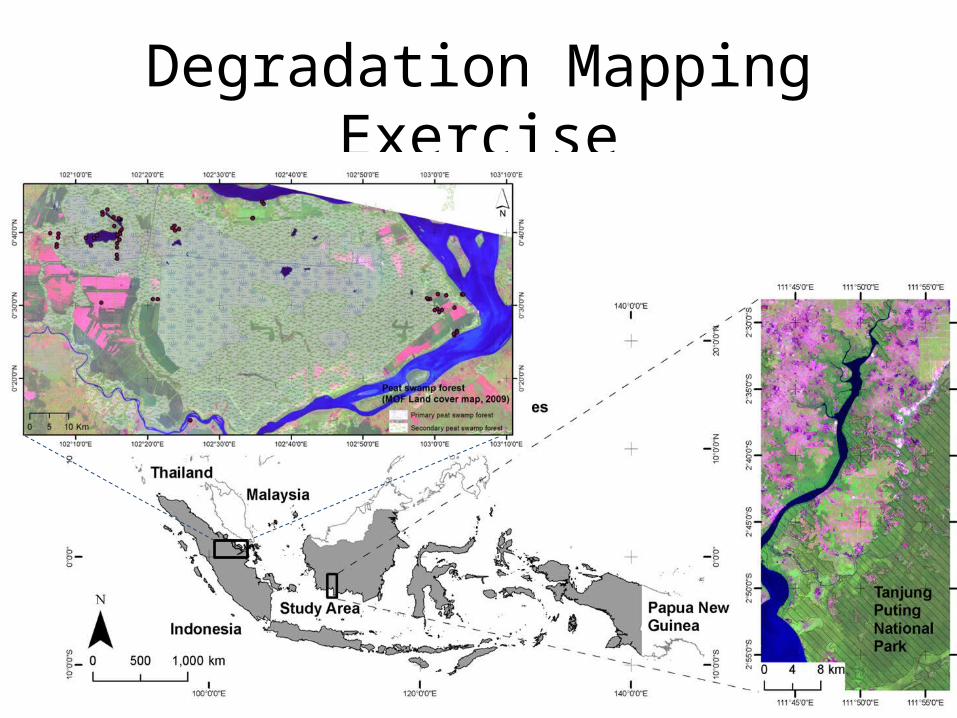
Degradation Mapping Exercise

18
Data
• Dual-polarimetry TerraSAR X data (2008)• PLR data of ALOS Palsar (2007-2009)• Landsat data• Peatland maps from Wetland International • Land use/land cover map from MoF
19
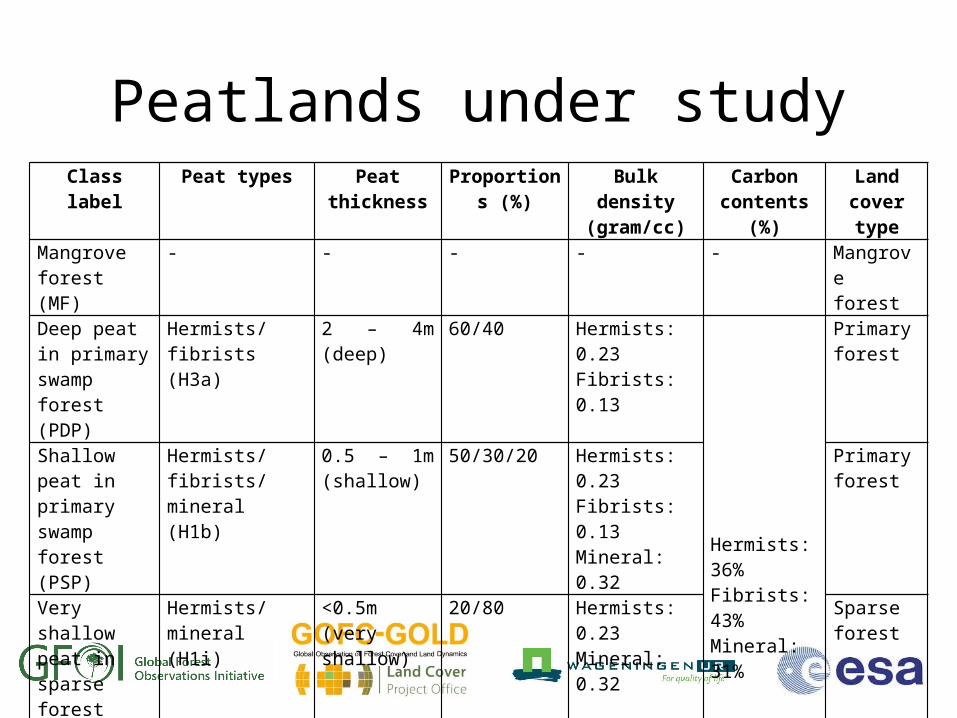
Peatlands under studyClass label Peat types Peat
thicknessProportions
(%)Bulk density
(gram/cc)Carbon
contents (%)Land
cover type
Mangrove forest (MF)
- - - - - Mangrove forest
Deep peat in primary swamp forest (PDP)
Hermists/fibrists (H3a)
2 – 4m (deep) 60/40 Hermists: 0.23Fibrists: 0.13
Hermists: 36%Fibrists: 43%Mineral: 31%
Primary forest
Shallow peat in primary swamp forest (PSP)
Hermists/fibrists/mineral (H1b)
0.5 – 1m (shallow)
50/30/20 Hermists: 0.23Fibrists: 0.13Mineral: 0.32
Primary forest
Very shallow peat in sparse forest (PVSp)
Hermists/mineral (H1i)
<0.5m (very shallow)
20/80 Hermists: 0.23Mineral: 0.32
Sparse forest
Shallow peat in secondary swamp forest (PSS)
Hermists/fibrists/mineral (H1b)
0.5–1m (shallow)
50/30/20 Hermists: 0.23Fibrists: 0.13Mineral: 0.32
Secondary forest
21
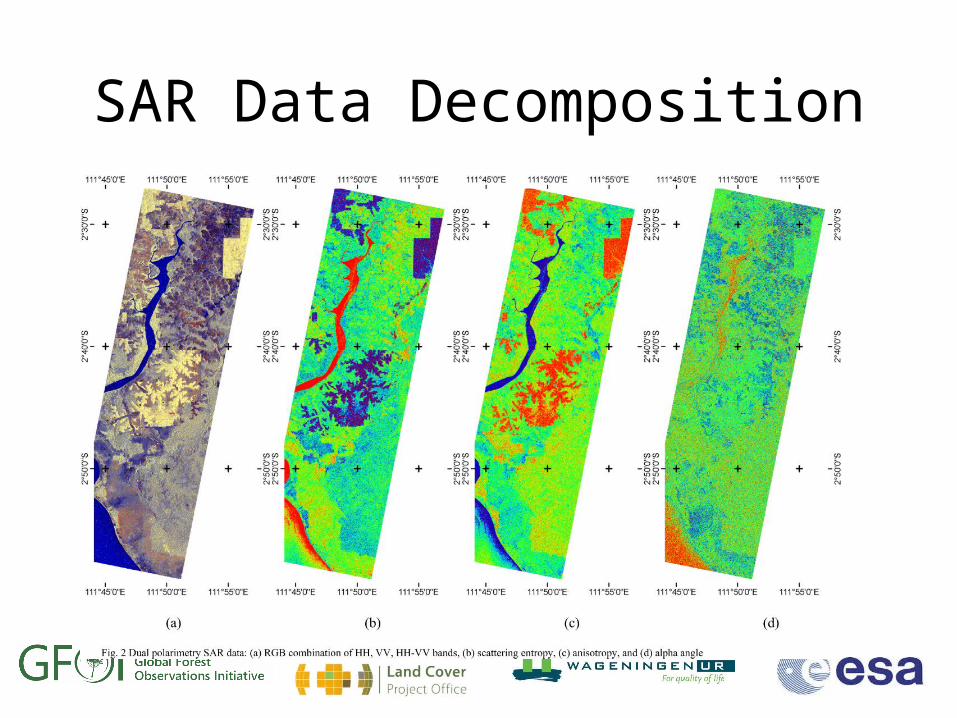
SAR Data Decomposition
22
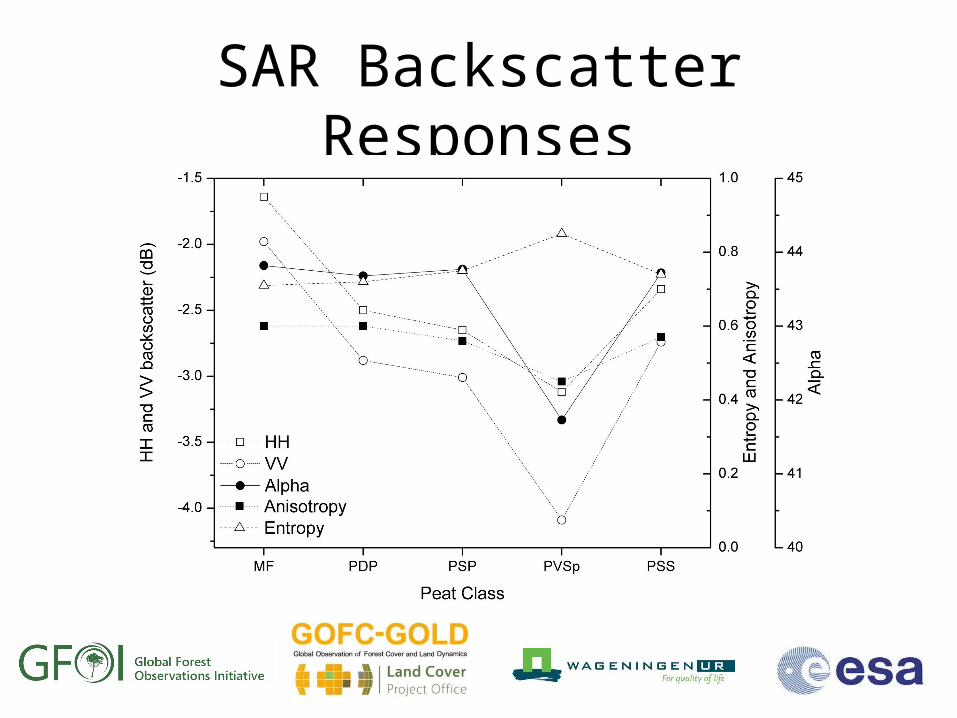
SAR Backscatter Responses
23
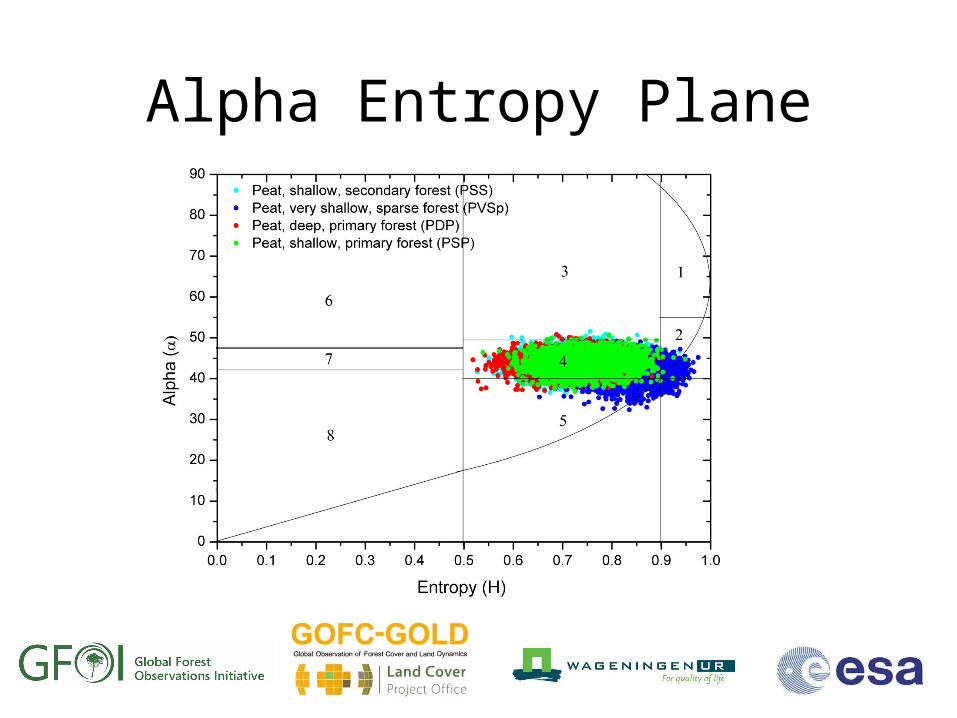
Alpha Entropy Plane

26
Land Cover Map
28
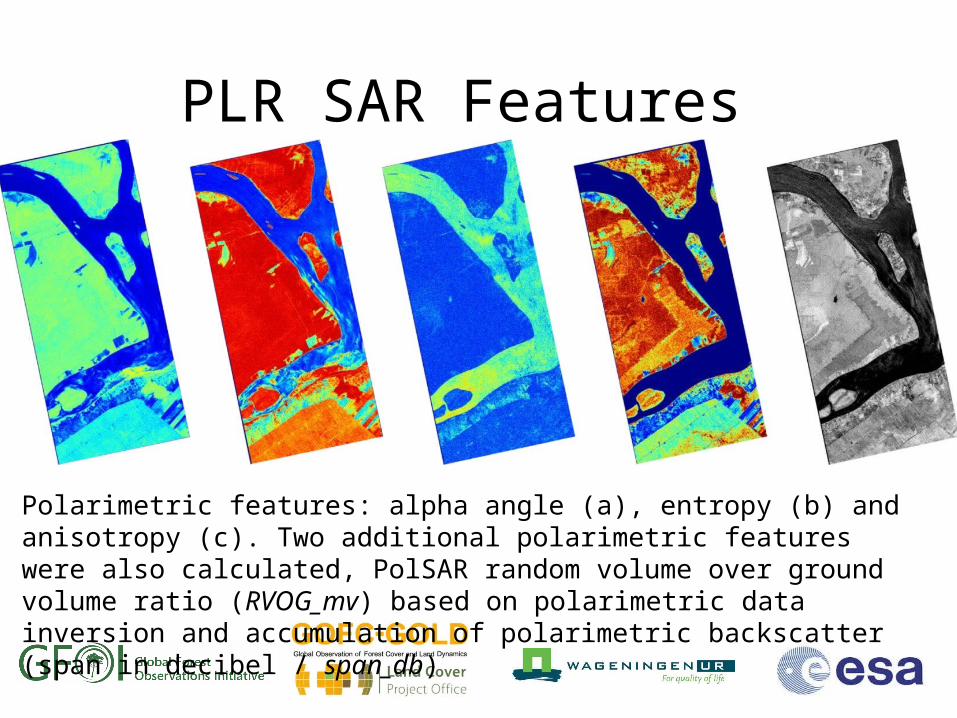
PLR SAR Features
Polarimetric features: alpha angle (a), entropy (b) and anisotropy (c). Two additional polarimetric features were also calculated, PolSAR random volume over ground volume ratio (RVOG_mv) based on polarimetric data inversion and accumulation of polarimetric backscatter (span in decibel / span_db)

29
Alpha Entropy Plane
1
2
3
4
5
6
7
8
9
30
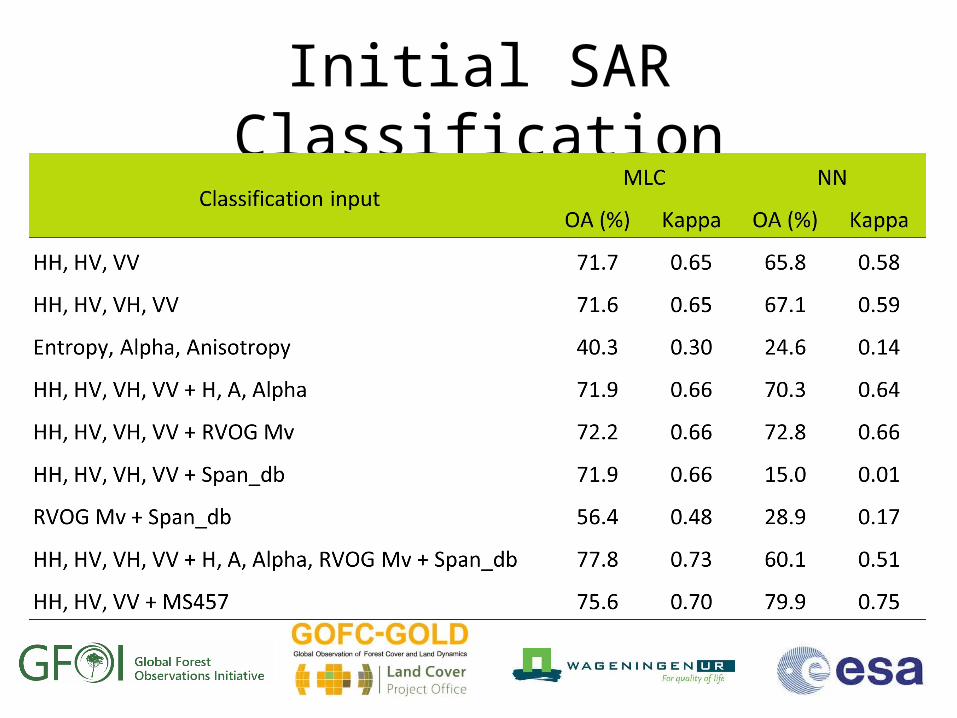
Initial SAR Classification
31
Technical Challenges/Opportunities• Needs to upgrade technical competence in the
country – ground station is available• Access to data might not be major concern –
various donors/bilateral cooperations continuously comes – JICA, EU, USAID, Norway
• Methods for merging SAR and optical need good knowledge of RS data pre-processing
• Relatively good IT infrastructure and facilities
32
R&D Challenge/Opportunity
• More difficult to accept modeling approach• Proposed methods should fit in with existing
national capacity• Multi-stakeholders discussion and
involvement in various meetings• Inform country about international
guidelines/standards/conventions which can be applied