Embed Size (px)
Citation preview
Brine Disposal Tamar OttolenghiPaula Barmaimon
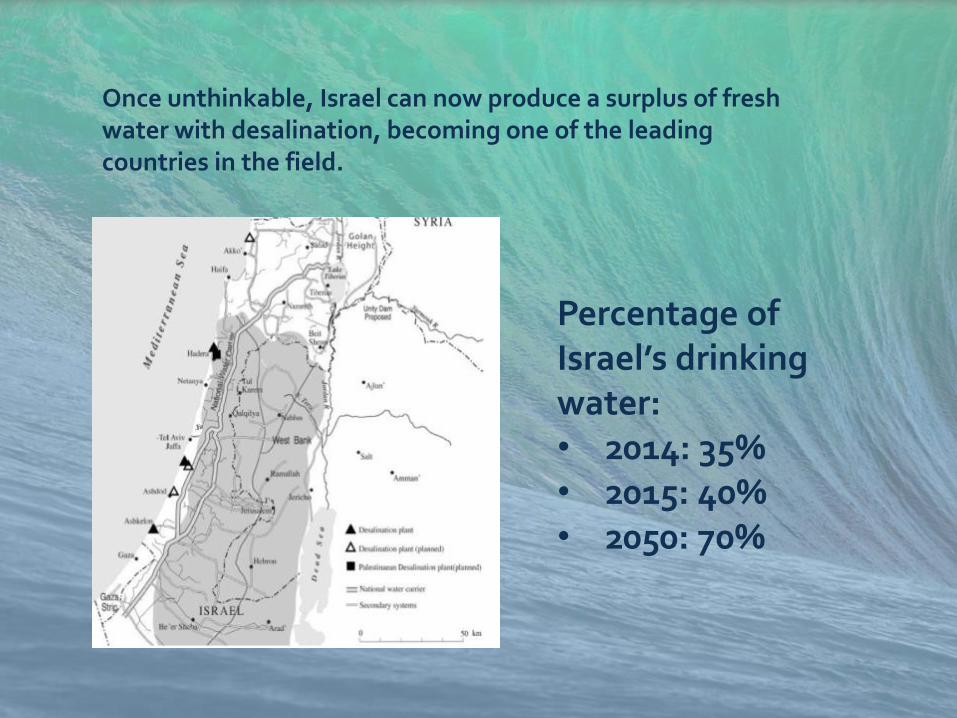
Percentage of Israel’s drinking water:• 2014: 35% • 2015: 40% • 2050: 70%
Once unthinkable, Israel can now produce a surplus of fresh water with desalination, becoming one of the leading countries in the field.
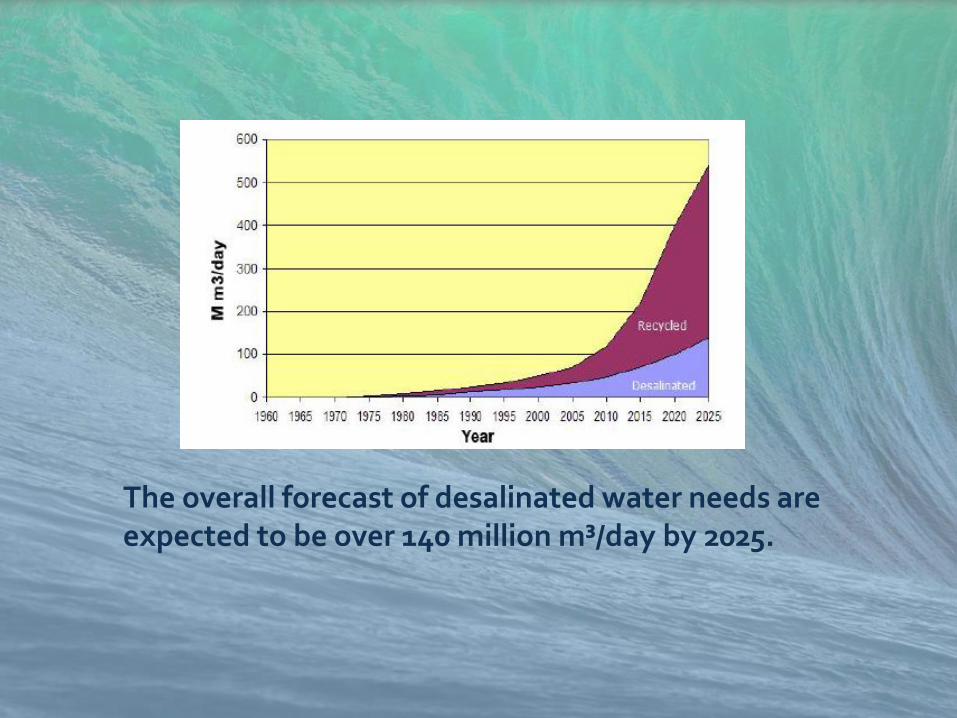
The overall forecast of desalinated water needs are expected to be over 140 million m³/day by 2025.
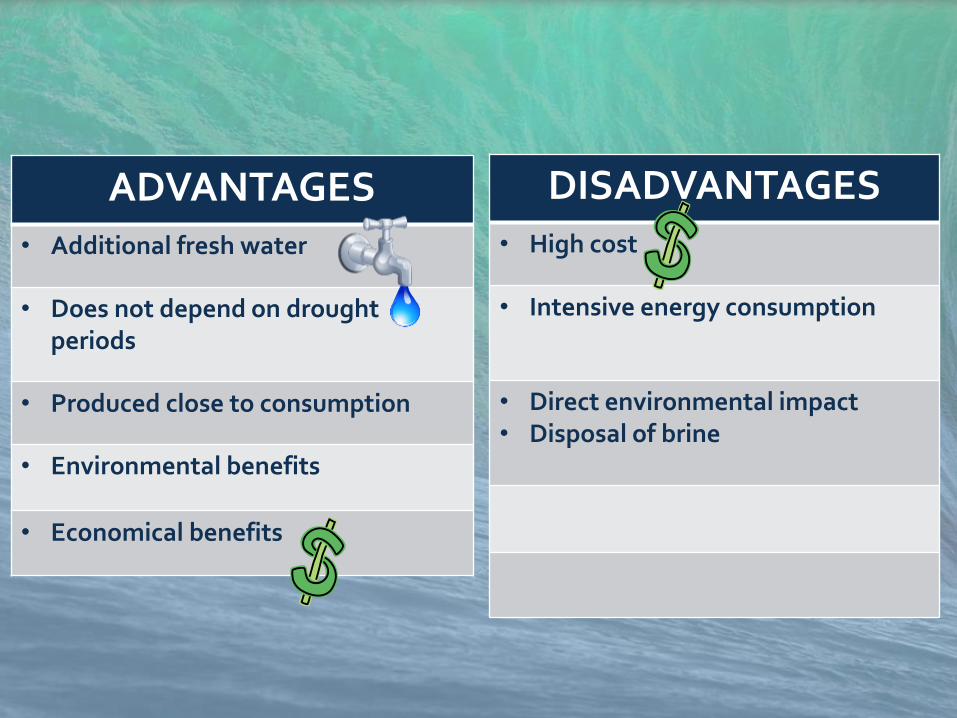
DISADVANTAGES
• High cost
• Intensive energy consumption
• Direct environmental impact• Disposal of brine
ADVANTAGES
• Additional fresh water
• Does not depend on drought periods
• Produced close to consumption
• Environmental benefits
• Economical benefits
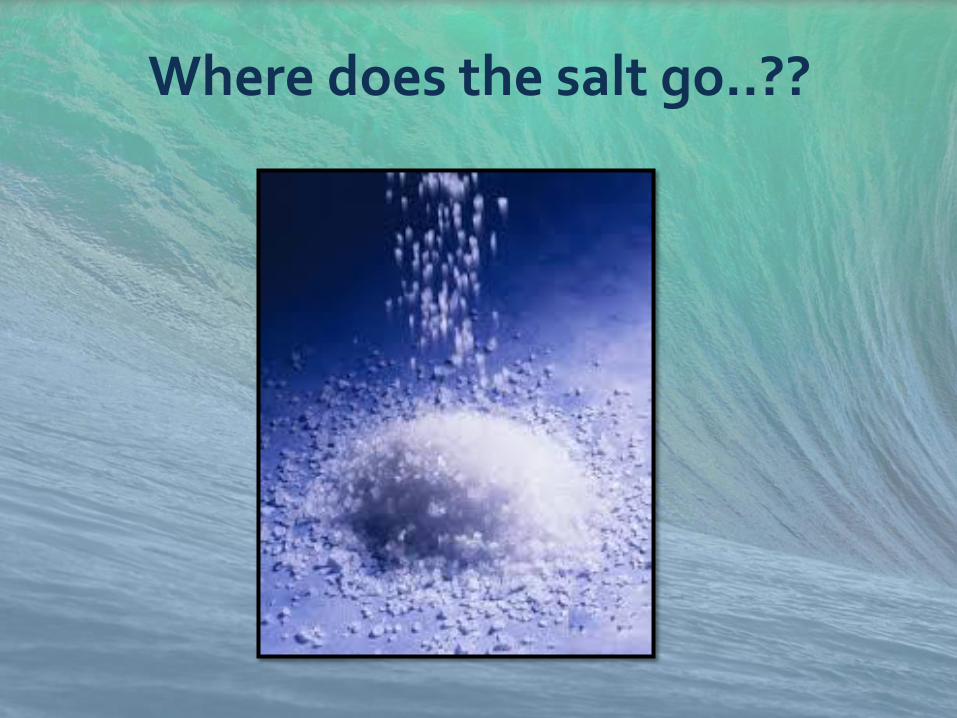
Where does the salt go..??
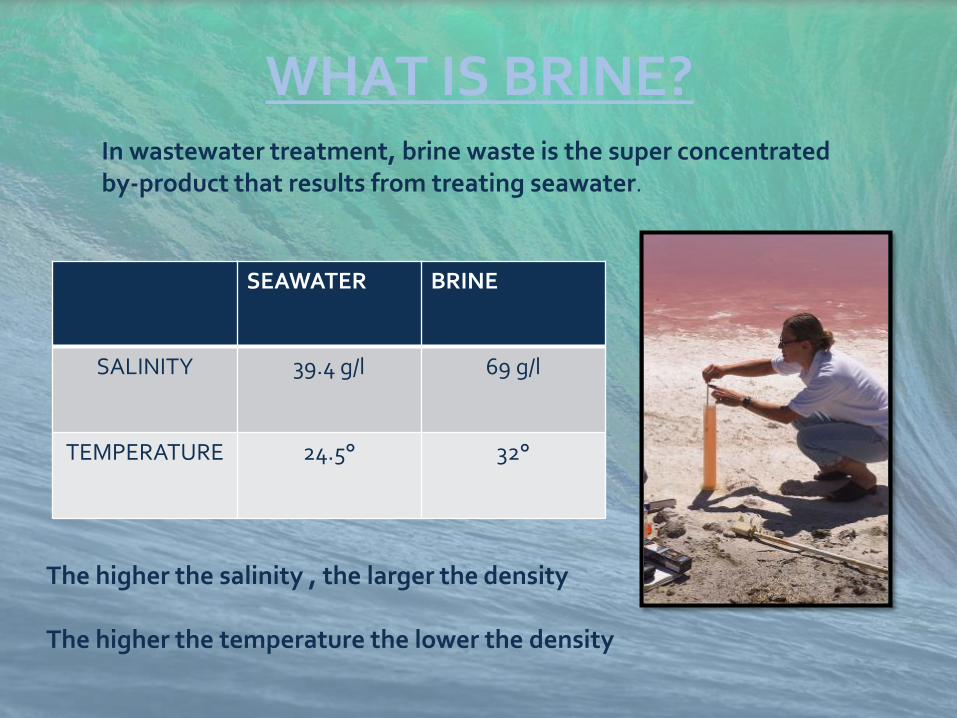
In wastewater treatment, brine waste is the super concentrated by-product that results from treating seawater.
WHAT IS BRINE?
SEAWATER BRINE
SALINITY 39.4 g/l 69 g/l
TEMPERATURE 24.5° 32°
The higher the salinity , the larger the density
The higher the temperature the lower the density
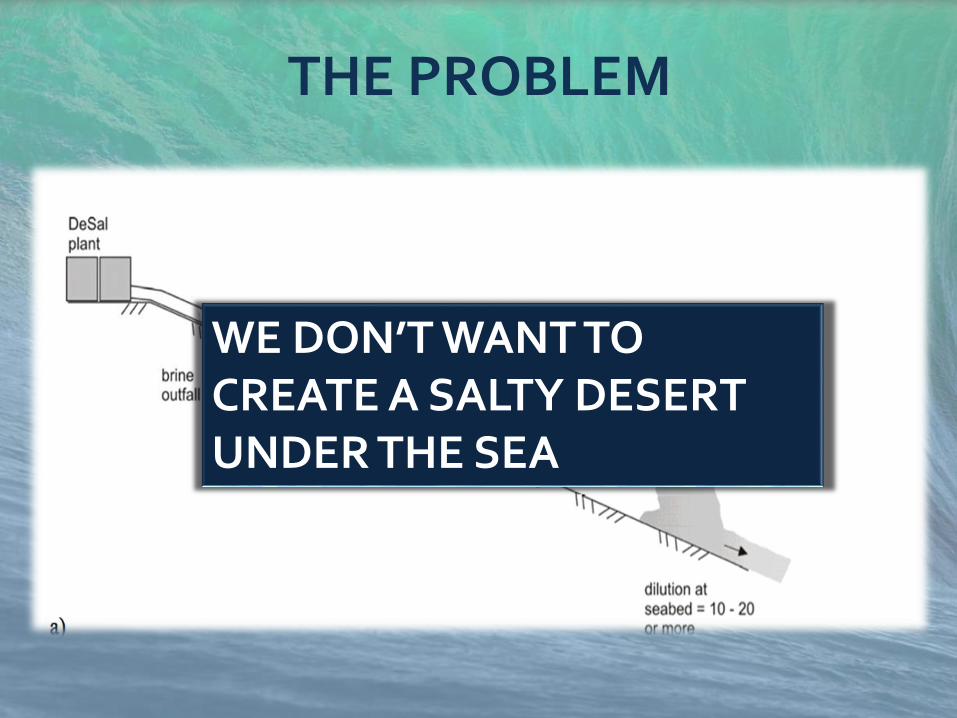
THE PROBLEM
WE DON’T WANT TO CREATE A SALTY DESERT UNDER THE SEA
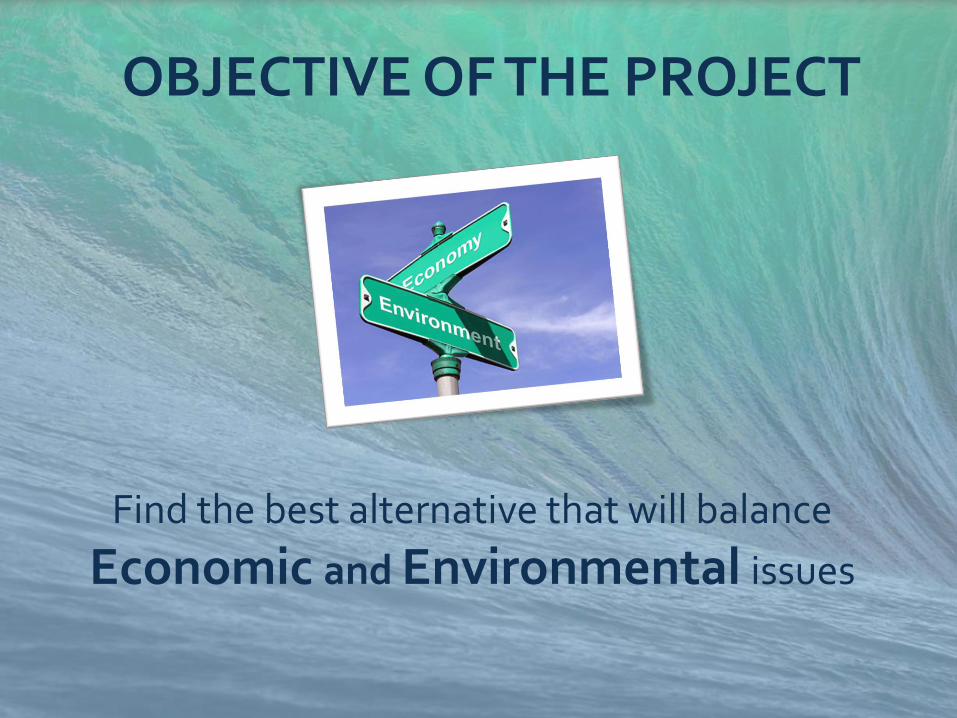
Find the best alternative that will balance
Economic and Environmental issues
OBJECTIVE OF THE PROJECT
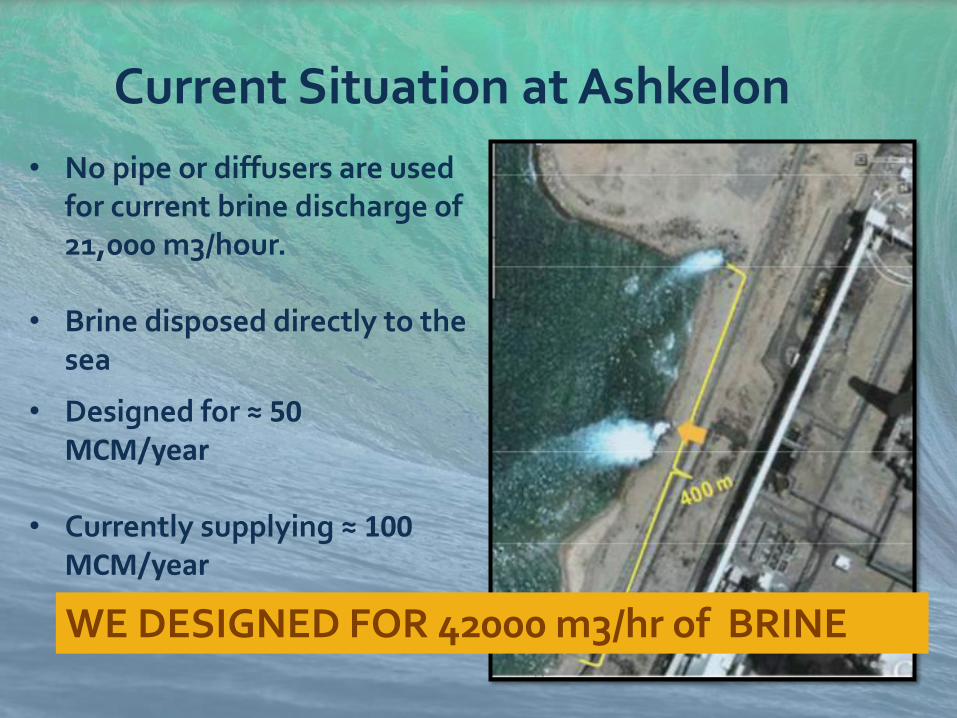
Current Situation at Ashkelon
• No pipe or diffusers are used for current brine discharge of 21,000 m3/hour.
• Brine disposed directly to the sea
• Designed for ≈ 50 MCM/year
• Currently supplying ≈ 100 MCM/year
WE DESIGNED FOR 42000 m3/hr of BRINE
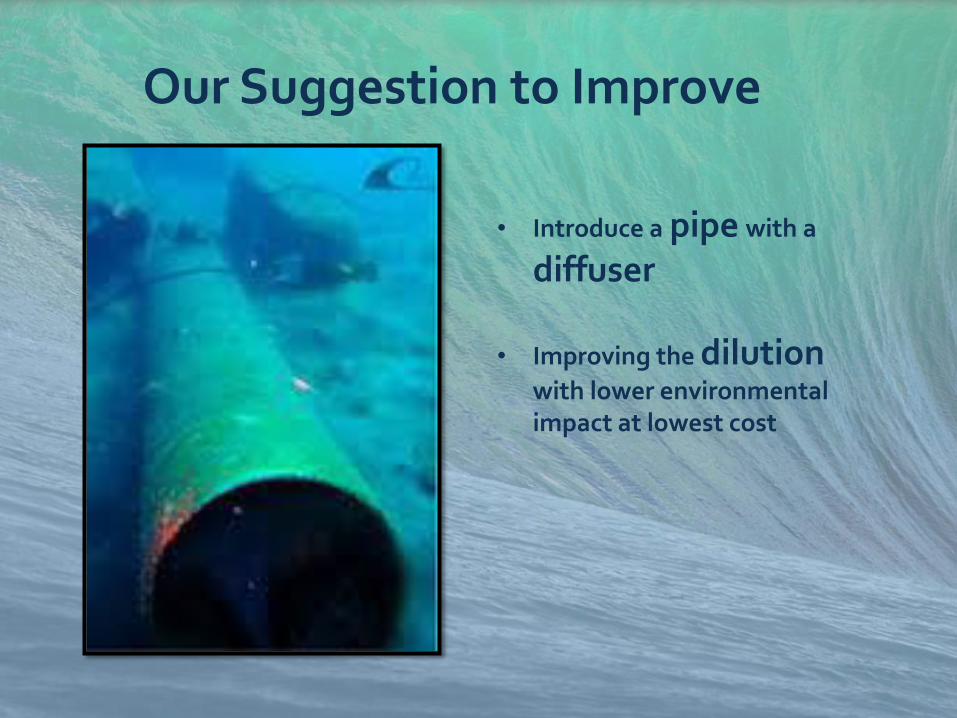
Our Suggestion to Improve
• Introduce a pipe with a
diffuser
• Improving the dilutionwith lower environmental impact at lowest cost
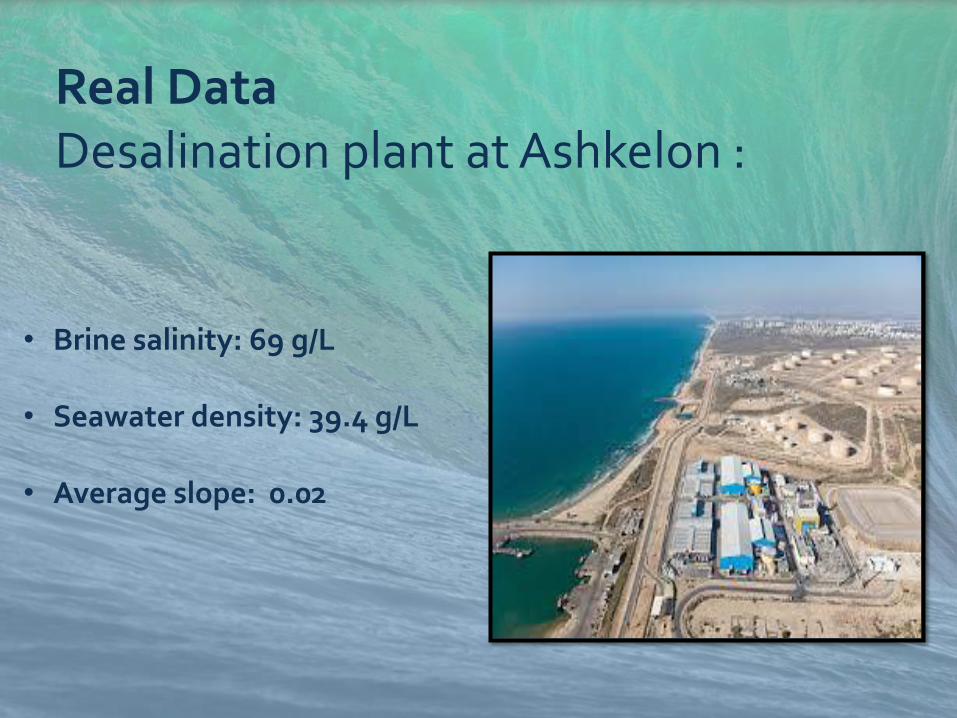
Real Data Desalination plant at Ashkelon :
• Brine salinity: 69 g/L
• Seawater density: 39.4 g/L
• Average slope: 0.02
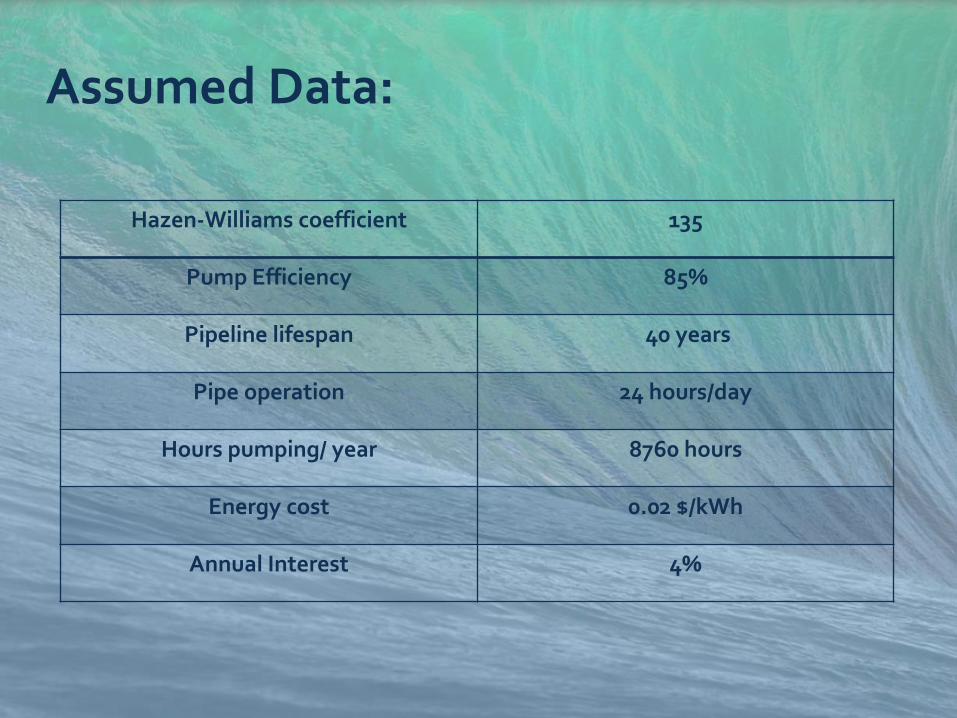
Assumed Data:
Hazen-Williams coefficient 135
Pump Efficiency 85%
Pipeline lifespan 40 years
Pipe operation 24 hours/day
Hours pumping/ year 8760 hours
Energy cost 0.02 $/kWh
Annual Interest 4%
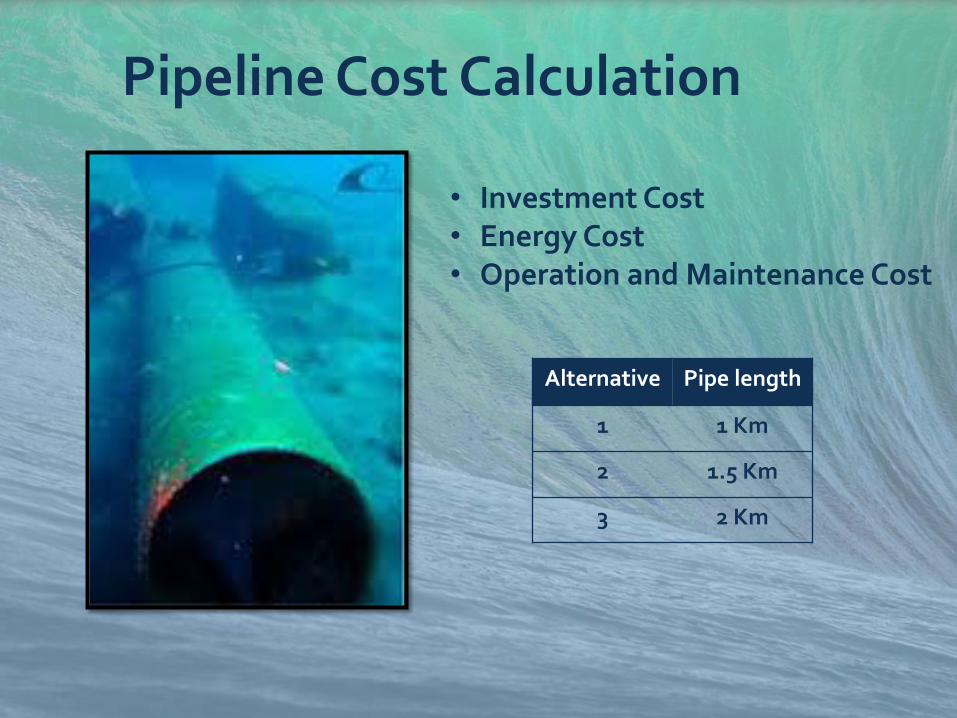
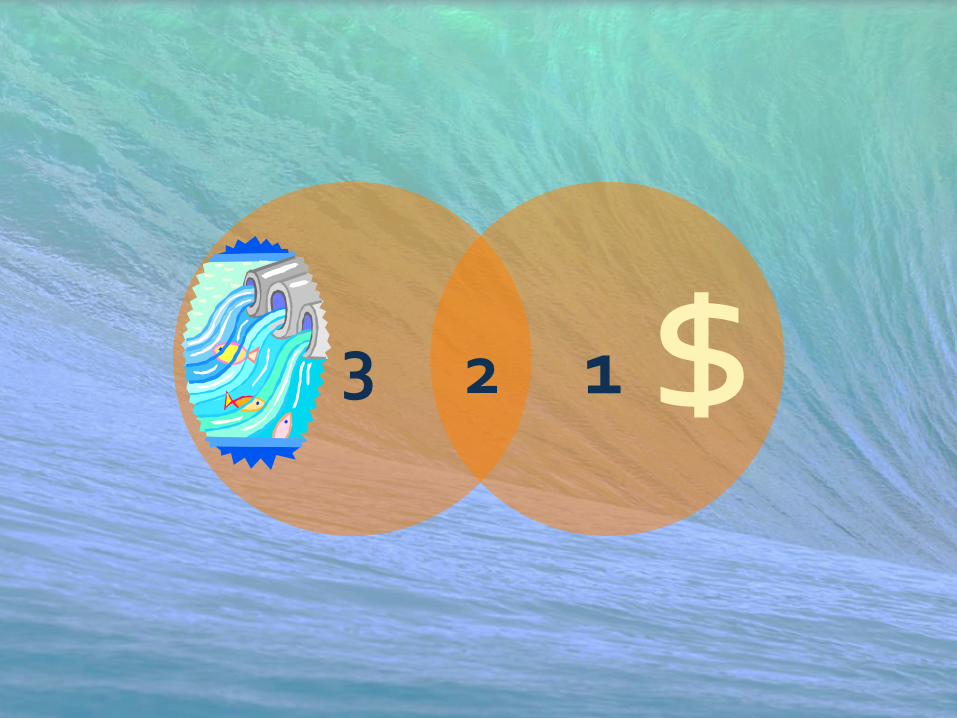
Alternative Pipe length
1 1 Km
2 1.5 Km
3 2 Km
Pipeline Cost Calculation
• Investment Cost• Energy Cost• Operation and Maintenance Cost
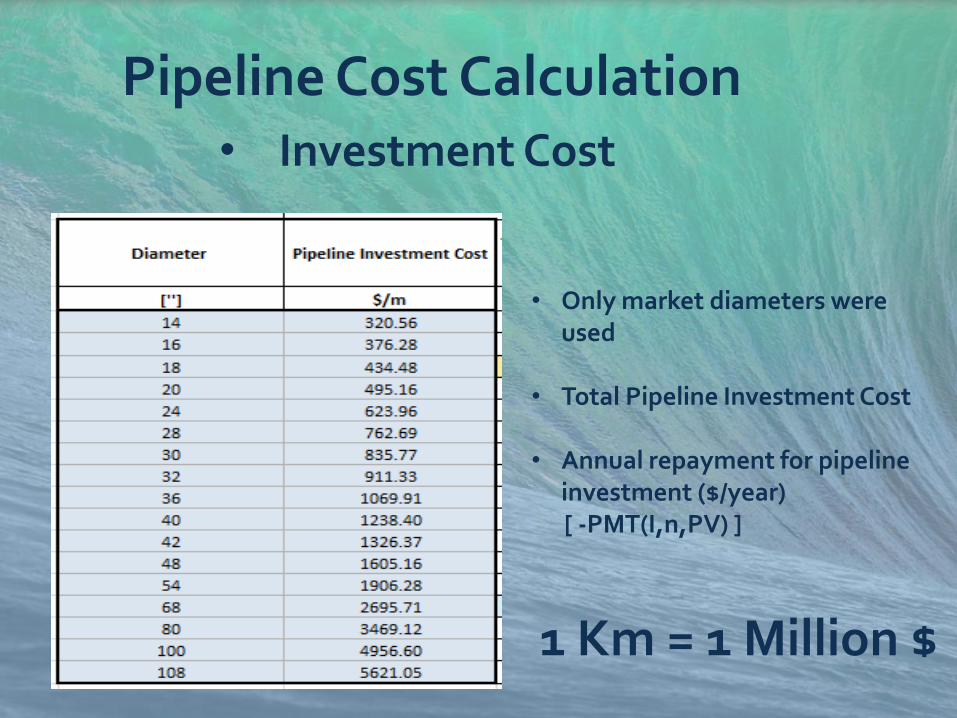
Pipeline Cost Calculation• Investment Cost
• Only market diameters were used
• Total Pipeline Investment Cost
• Annual repayment for pipeline investment ($/year)[ -PMT(I,n,PV) ]
1 Km = 1 Million $
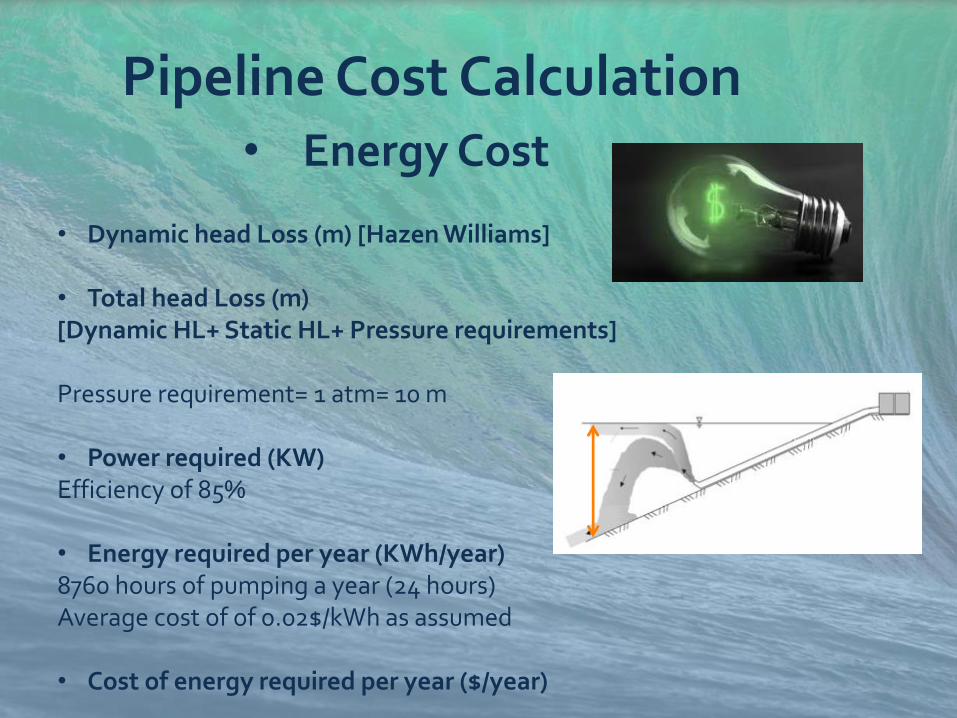
Pipeline Cost Calculation• Energy Cost
• Dynamic head Loss (m) [Hazen Williams]
• Total head Loss (m)[Dynamic HL+ Static HL+ Pressure requirements]
Pressure requirement= 1 atm= 10 m
• Power required (KW)Efficiency of 85%
• Energy required per year (KWh/year)8760 hours of pumping a year (24 hours)Average cost of of 0.02$/kWh as assumed
• Cost of energy required per year ($/year)
Pipeline Cost Calculation• O&M
0.75* Total Pipeline investment cost ($/year)
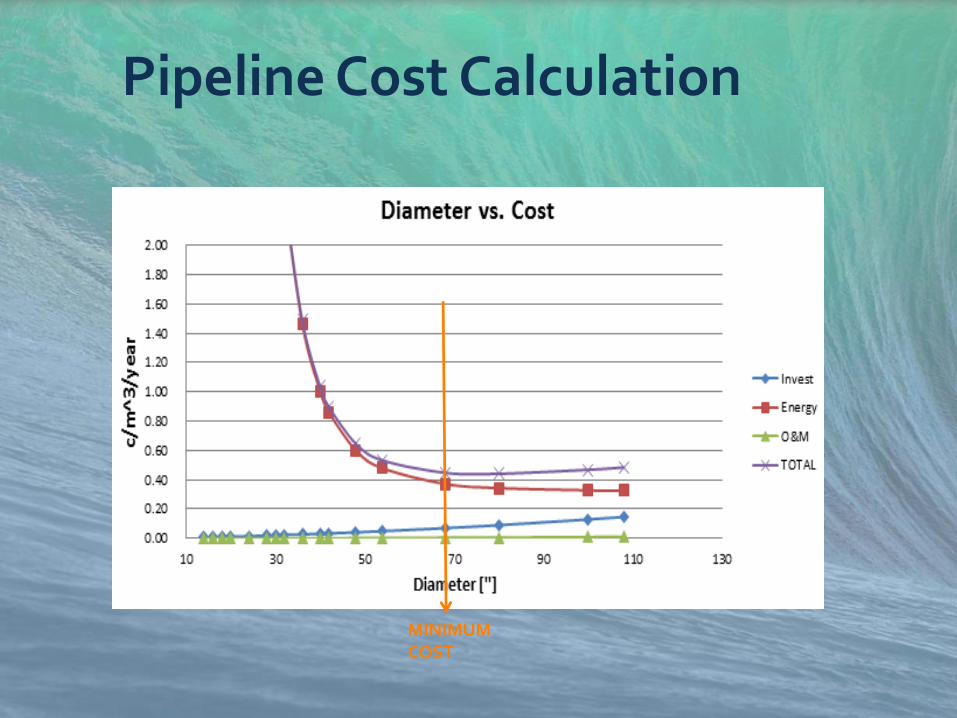
Pipeline Cost Calculation
MINIMUM COST
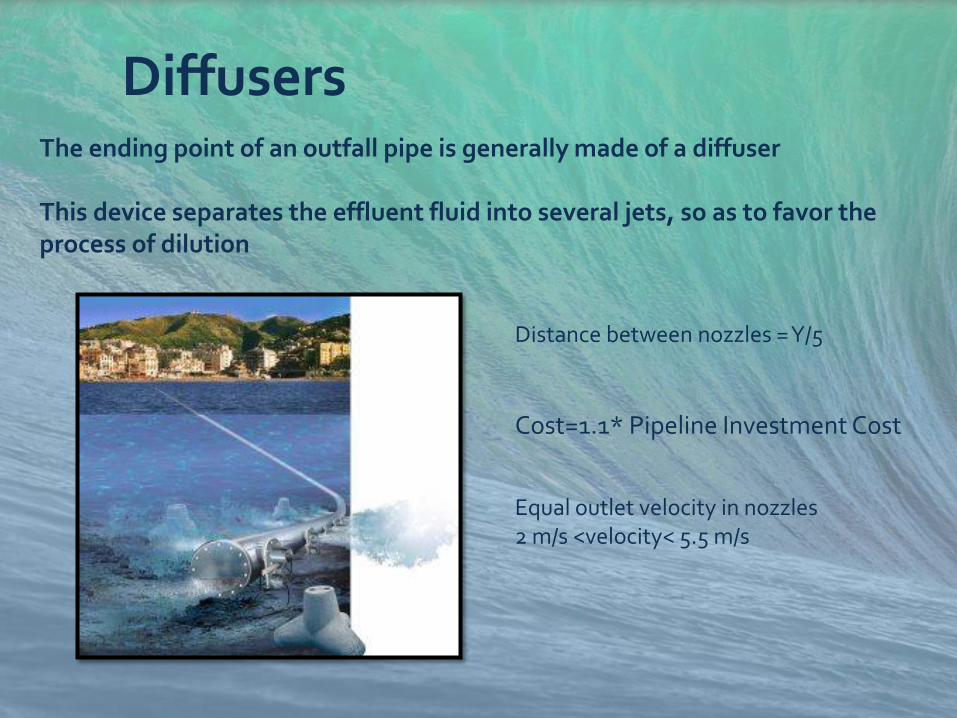
DiffusersThe ending point of an outfall pipe is generally made of a diffuser
This device separates the effluent fluid into several jets, so as to favor the process of dilution
Cost=1.1* Pipeline Investment Cost
Equal outlet velocity in nozzles2 m/s <velocity< 5.5 m/s
Distance between nozzles = Y/5
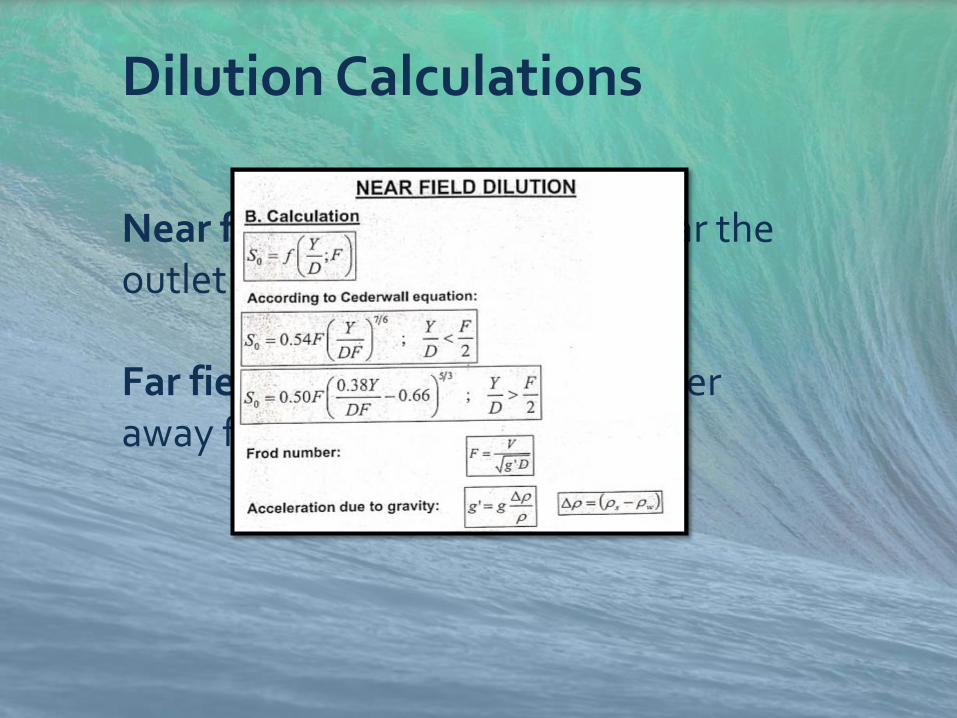
Dilution Calculations
Near field dilution: It occurs near the outlet into the sea.
Far field dilution: It occurs further away from the effluent outlet.
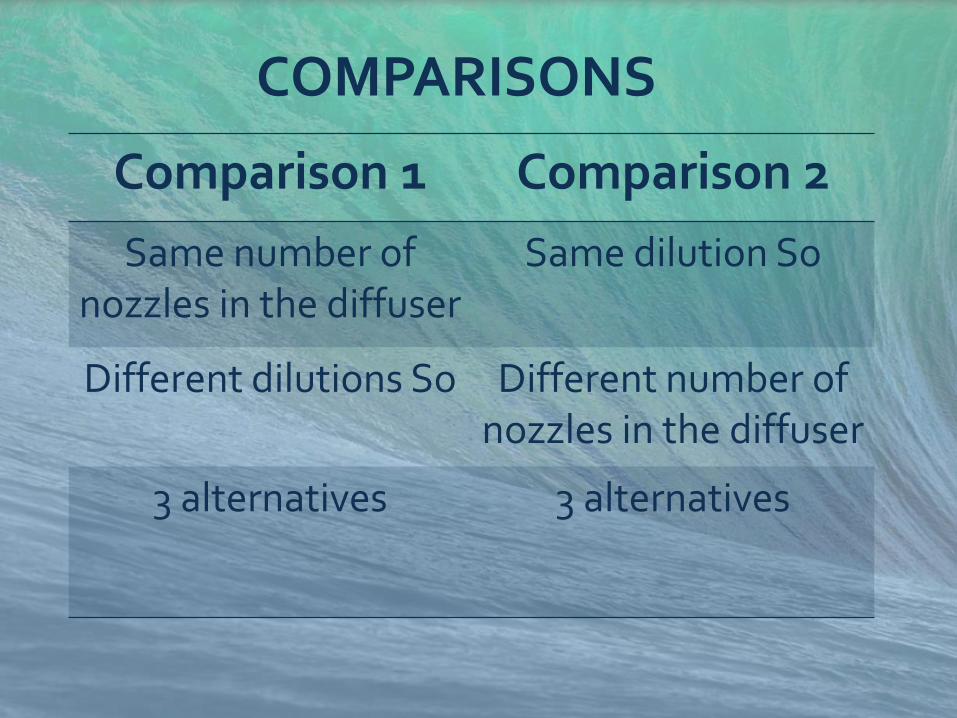
Comparison 1 Comparison 2
Same number of nozzles in the diffuser
Same dilution So
Different dilutions So Different number of nozzles in the diffuser
3 alternatives 3 alternatives
COMPARISONS
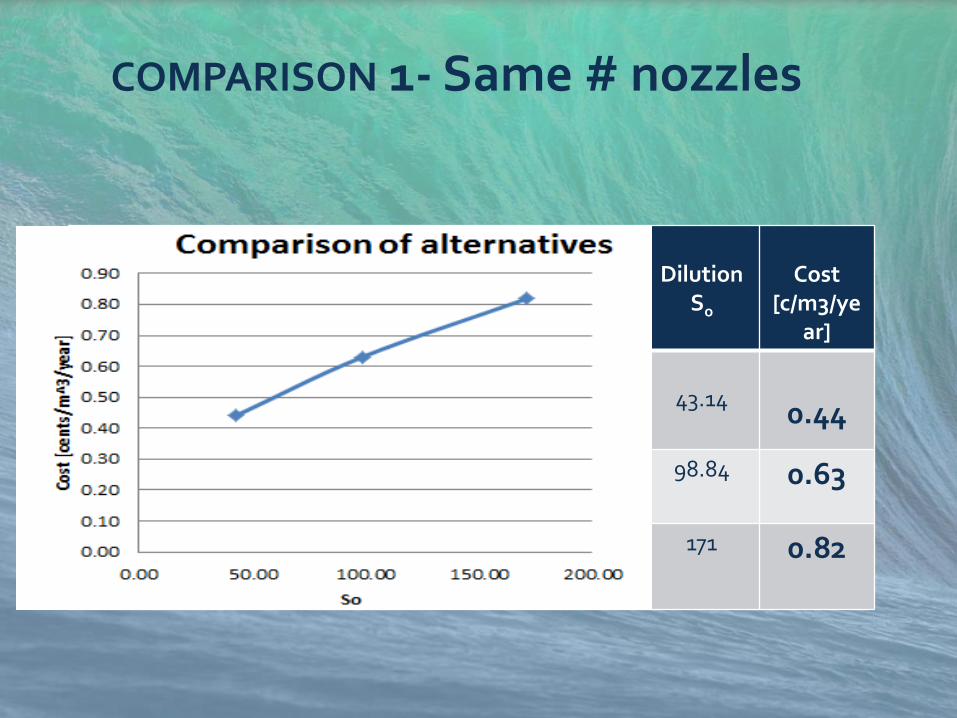
COMPARISON 1- Same # nozzles
Alternative Lengthpipe[Km]
# nozzles
Outletvelocity
Ratio Diffuser/
main pipeline
Dilution So
Cost[c/m3/ye
ar]
1 1200
5.16 m/s 0.81 43.140.44
2 1.5 200 5.16 m/s 0.81 98.84 0.63
3 2 200 5.16 m/s 0.81 171 0.82
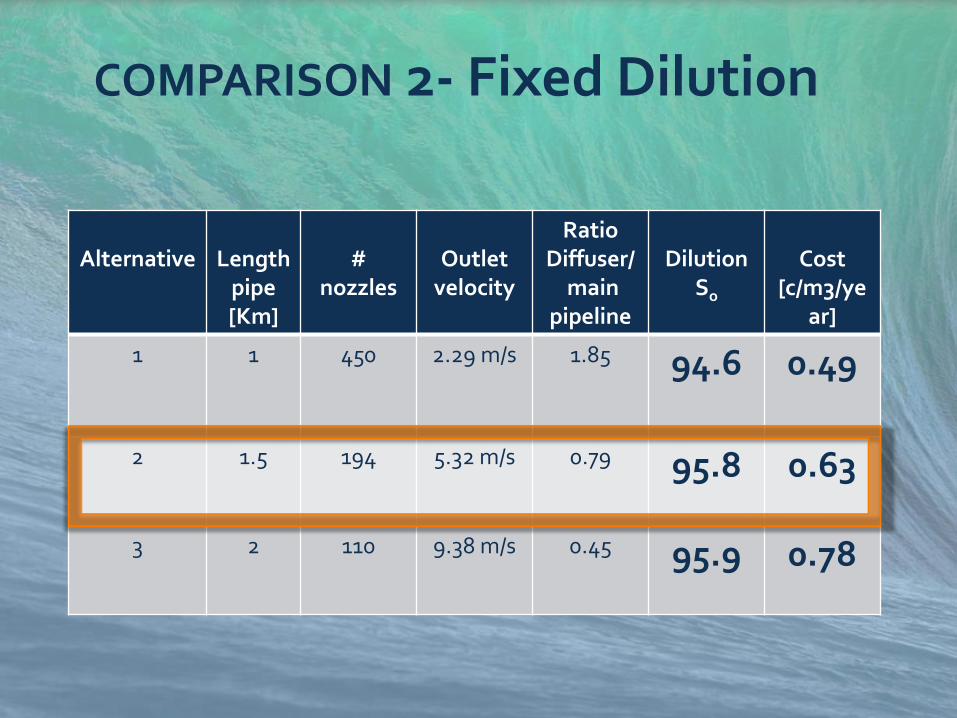
Alternative Lengthpipe[Km]
# nozzles
Outletvelocity
RatioDiffuser/
main pipeline
Dilution So
Cost[c/m3/ye
ar]
1 1 450 2.29 m/s 1.85 94.6 0.49
2 1.5 194 5.32 m/s 0.79 95.8 0.63
3 2 110 9.38 m/s 0.45 95.9 0.78
COMPARISON 2- Fixed Dilution
13 $2
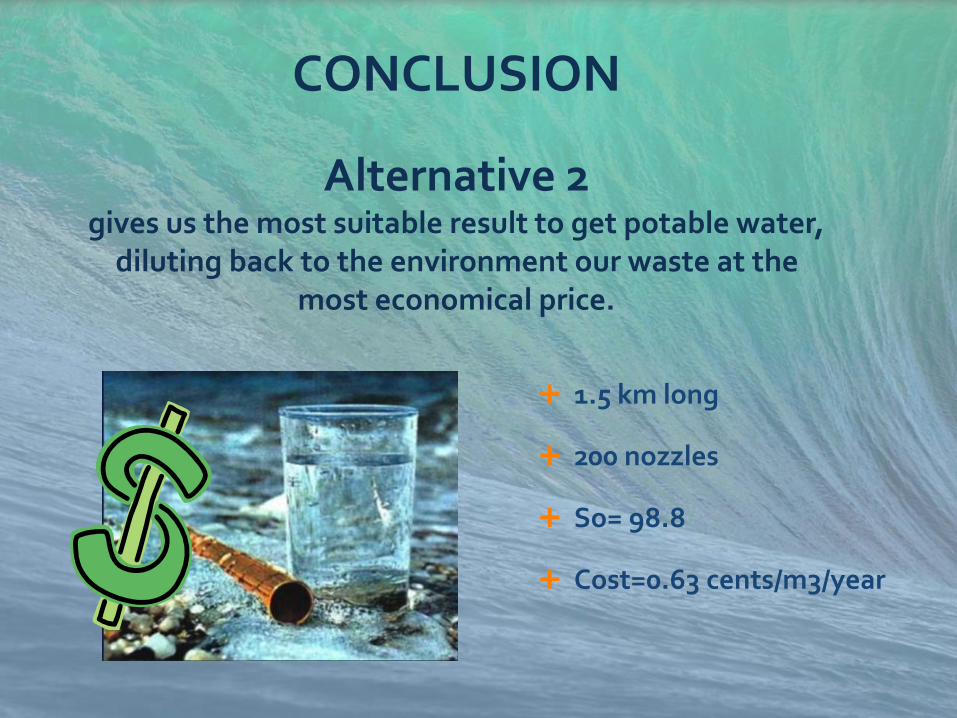
CONCLUSION
Alternative 2 gives us the most suitable result to get potable water,
diluting back to the environment our waste at the most economical price.
1.5 km long
200 nozzles
So= 98.8
Cost=0.63 cents/m3/year
THANK YOU