Embed Size (px)
Citation preview
Sunmao Chen, Clint Truman, Mark White, Dan Campbell, Jerry Wells
Syngenta Crop Protection, LLC, Greensboro, North Carolina, USA
Atrazine Ecological Monitoring Program
2
Outline
● History of Atrazine Ecological Monitoring Program (AEMP)
● Objectives
● Site Selection
● Methods
● Results
● Summary and Conclusions
Classification: Public
3
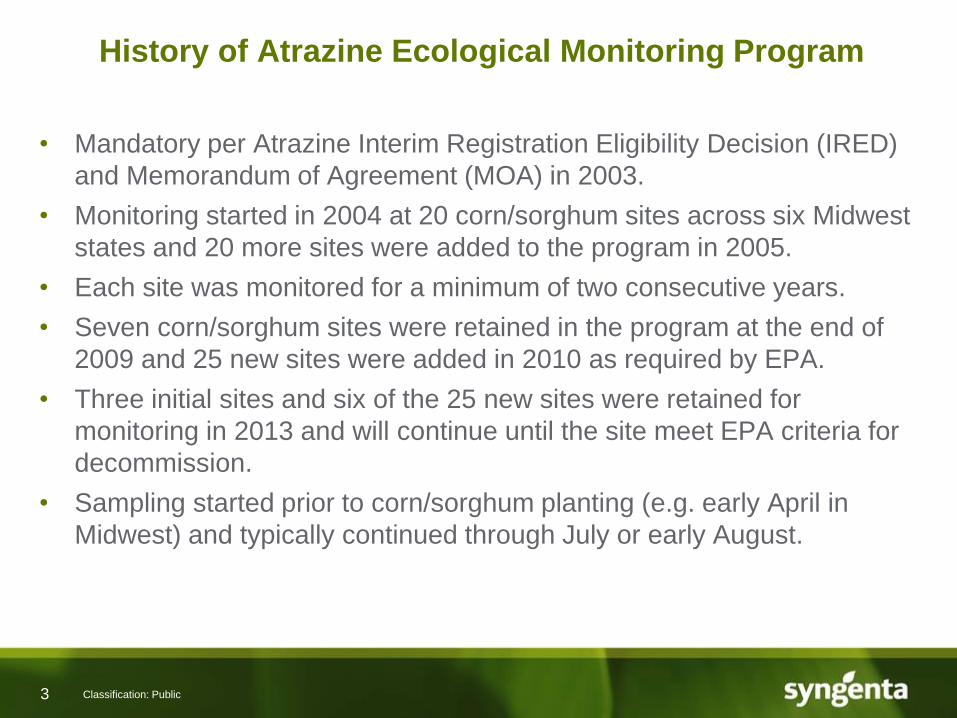
History of Atrazine Ecological Monitoring Program
• Mandatory per Atrazine Interim Registration Eligibility Decision (IRED)
and Memorandum of Agreement (MOA) in 2003.
• Monitoring started in 2004 at 20 corn/sorghum sites across six Midwest
states and 20 more sites were added to the program in 2005.
• Each site was monitored for a minimum of two consecutive years.
• Seven corn/sorghum sites were retained in the program at the end of
2009 and 25 new sites were added in 2010 as required by EPA.
• Three initial sites and six of the 25 new sites were retained for
monitoring in 2013 and will continue until the site meet EPA criteria for
decommission.
• Sampling started prior to corn/sorghum planting (e.g. early April in
Midwest) and typically continued through July or early August.
Classification: Public
4
Objectives
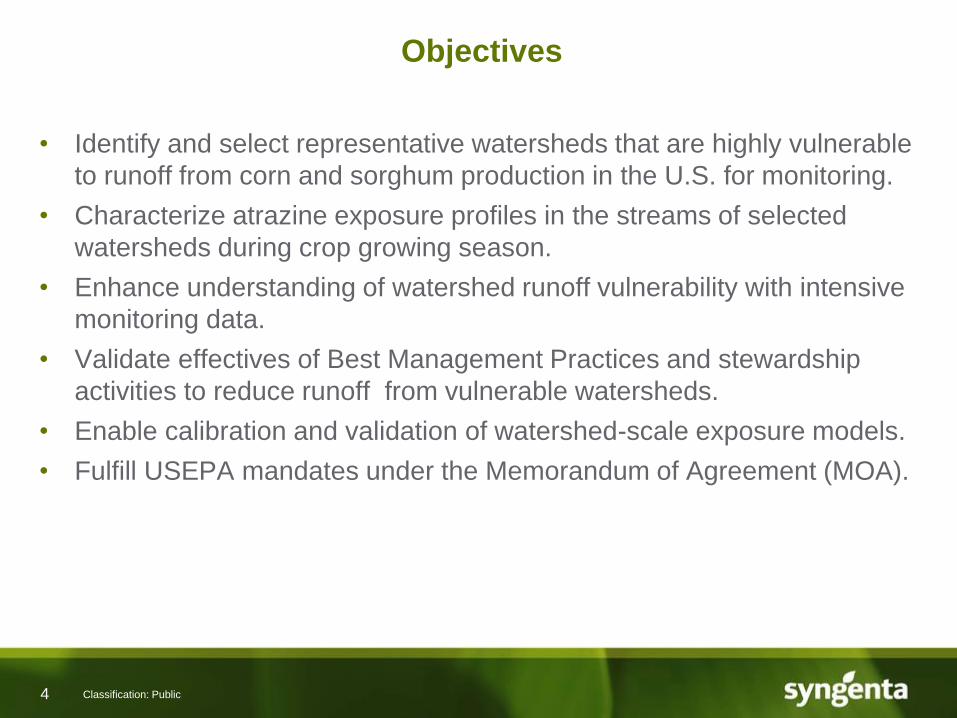
• Identify and select representative watersheds that are highly vulnerable
to runoff from corn and sorghum production in the U.S. for monitoring.
• Characterize atrazine exposure profiles in the streams of selected
watersheds during crop growing season.
• Enhance understanding of watershed runoff vulnerability with intensive
monitoring data.
• Validate effectives of Best Management Practices and stewardship
activities to reduce runoff from vulnerable watersheds.
• Enable calibration and validation of watershed-scale exposure models.
• Fulfill USEPA mandates under the Memorandum of Agreement (MOA).
Classification: Public
5
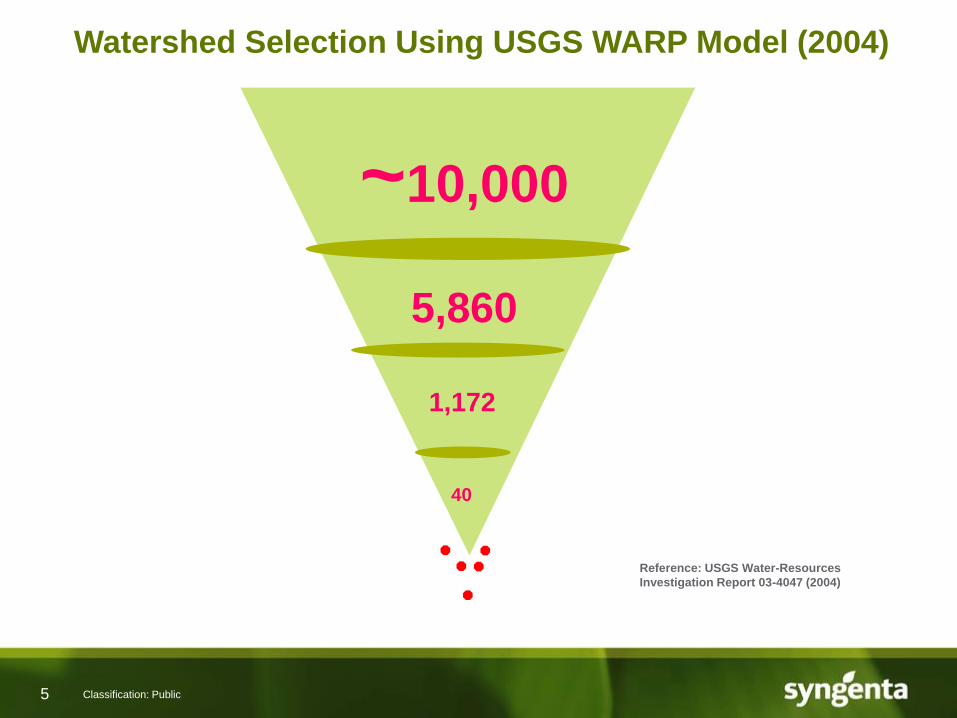
Watershed Selection Using USGS WARP Model (2004)
~10,000
40
1,172
5,860
Classification: Public
Reference: USGS Water-Resources
Investigation Report 03-4047 (2004)
6
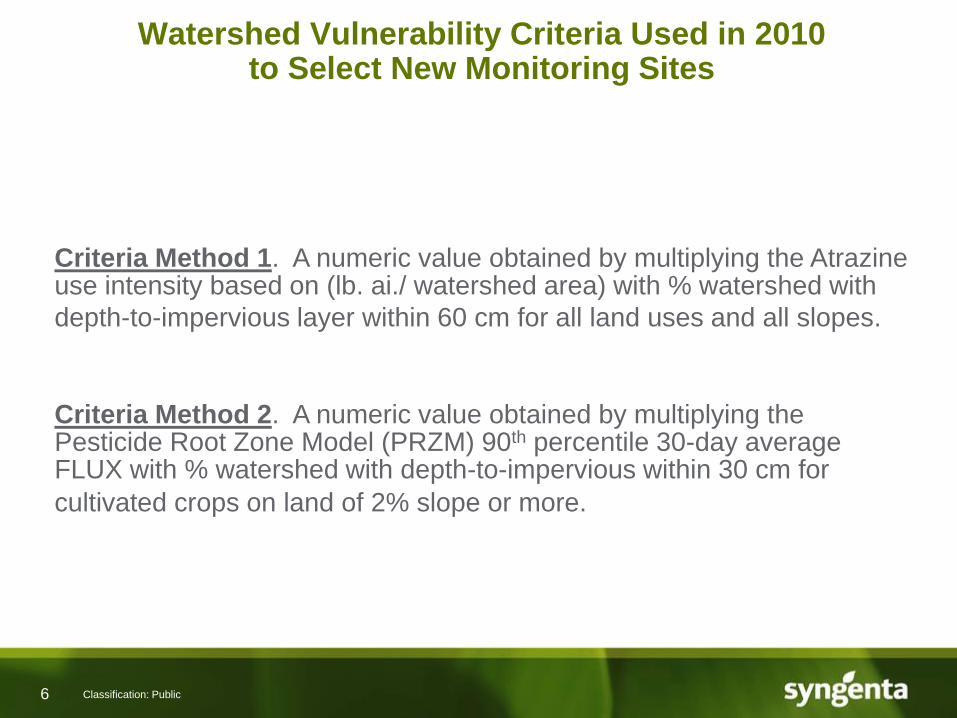
Watershed Vulnerability Criteria Used in 2010 to Select New Monitoring Sites
Criteria Method 1. A numeric value obtained by multiplying the Atrazine use intensity based on (lb. ai./ watershed area) with % watershed with
depth-to-impervious layer within 60 cm for all land uses and all slopes.
Criteria Method 2. A numeric value obtained by multiplying the Pesticide Root Zone Model (PRZM) 90th percentile 30-day average FLUX with % watershed with depth-to-impervious within 30 cm for
cultivated crops on land of 2% slope or more.
Classification: Public
7
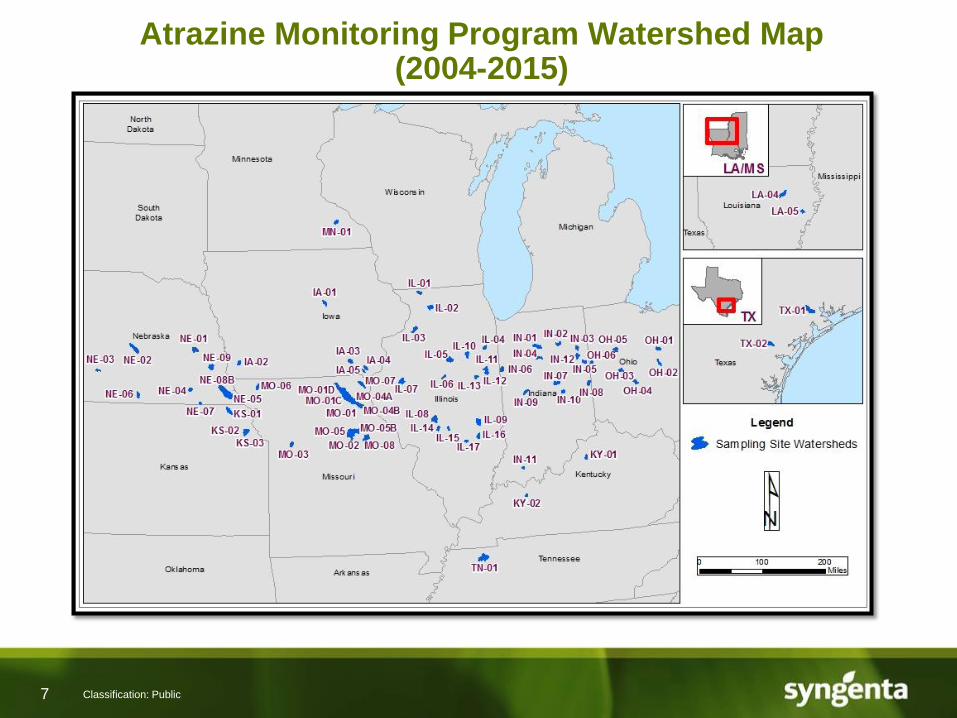
Atrazine Monitoring Program Watershed Map (2004-2015)
Classification: Public
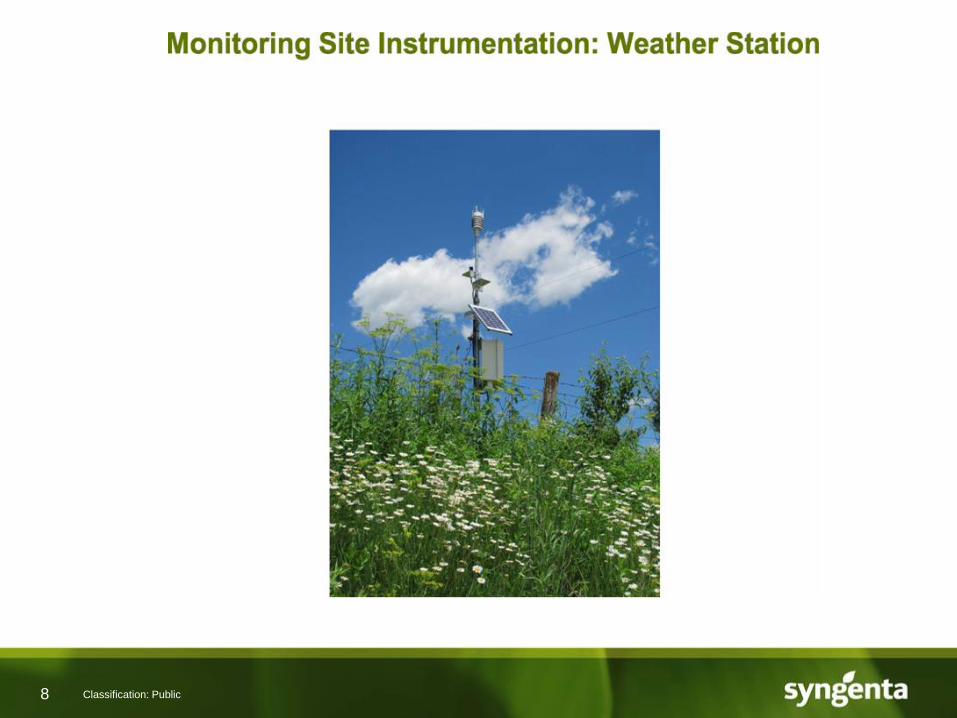
8 Classification: Public
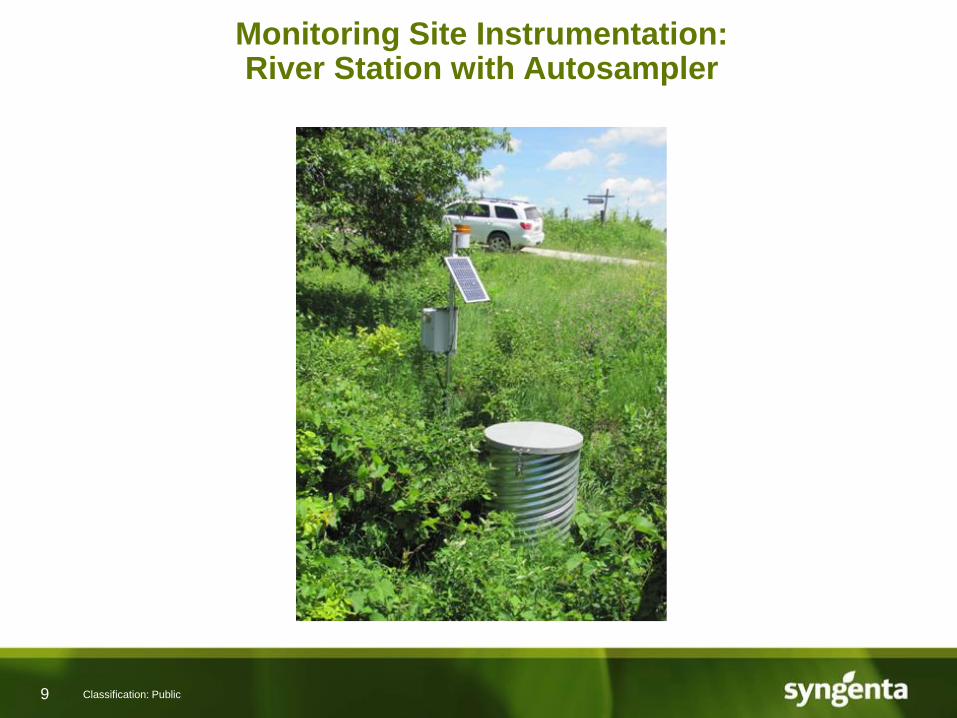
9
Monitoring Site Instrumentation: River Station with Autosampler
Classification: Public
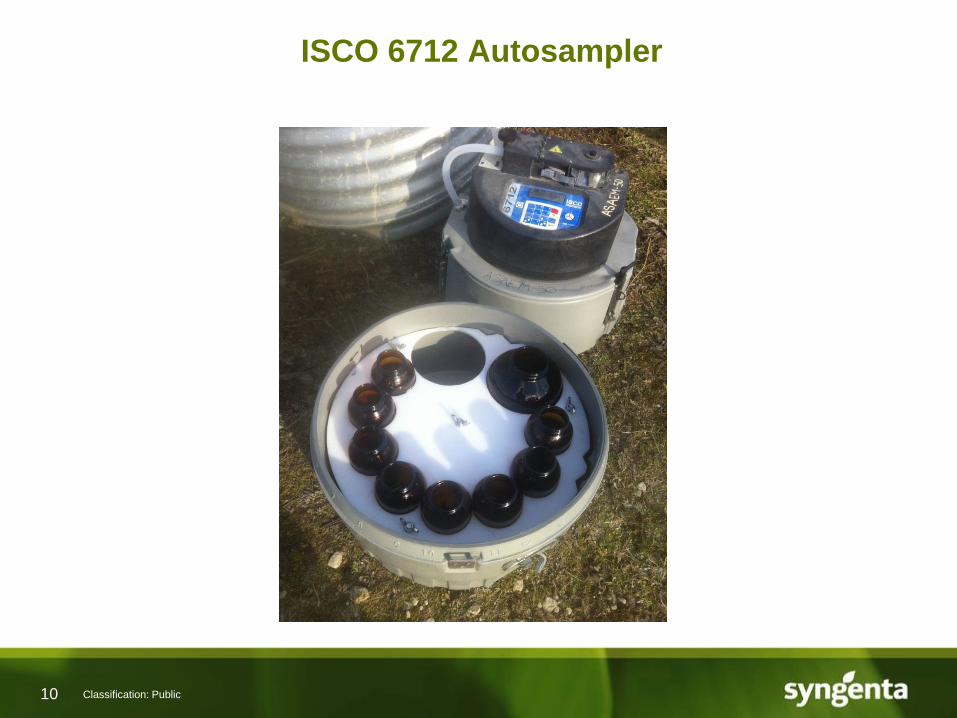
10
ISCO 6712 Autosampler
Classification: Public
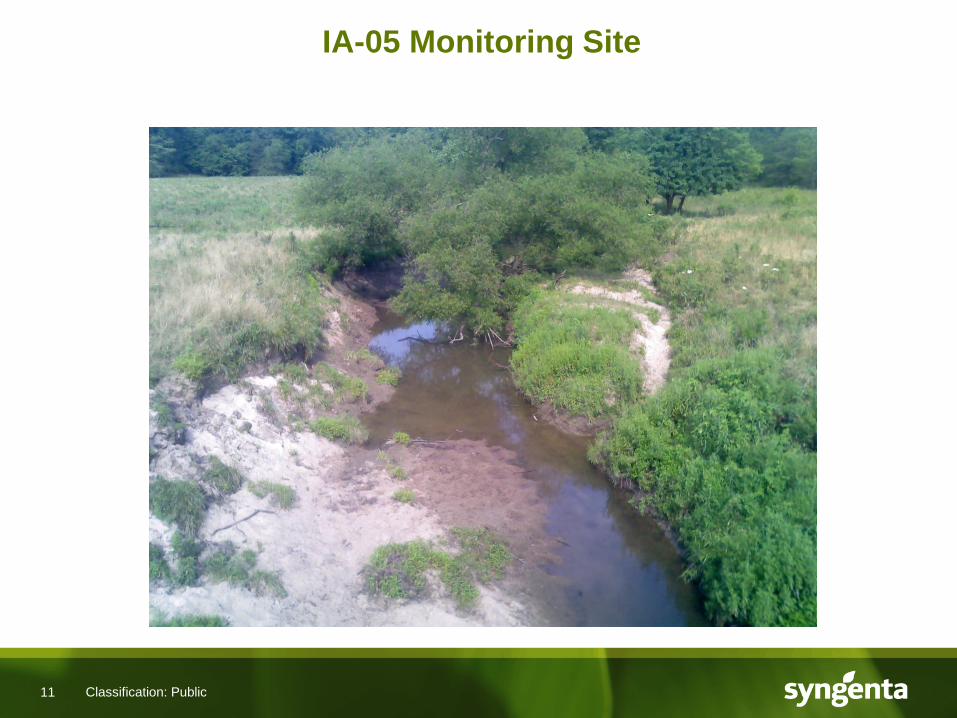
11
IA-05 Monitoring Site
Classification: Public
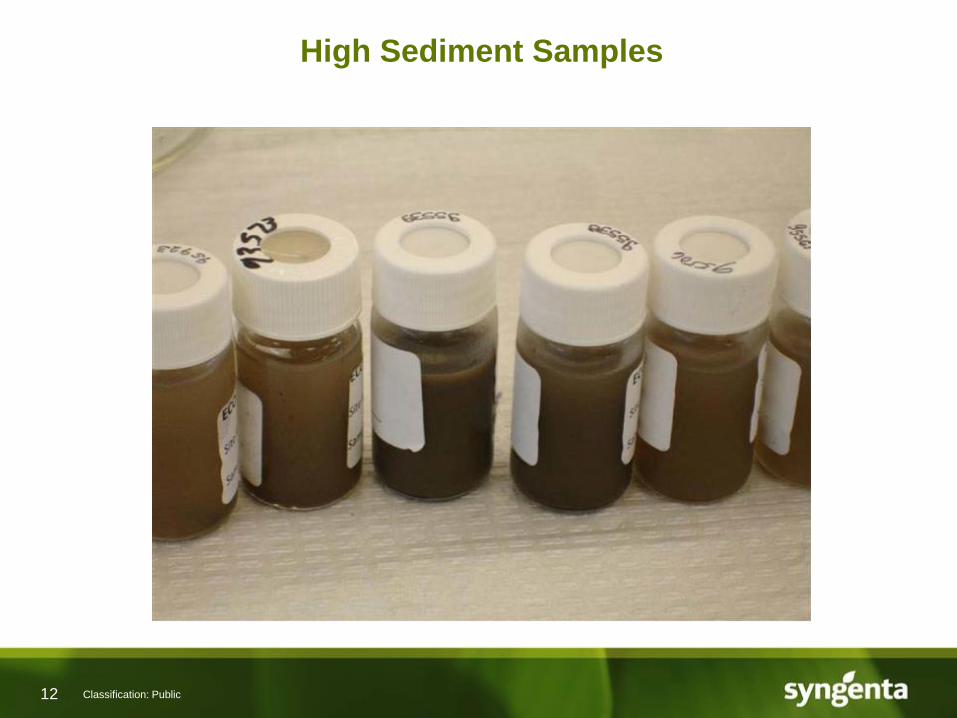
12
High Sediment Samples
Classification: Public
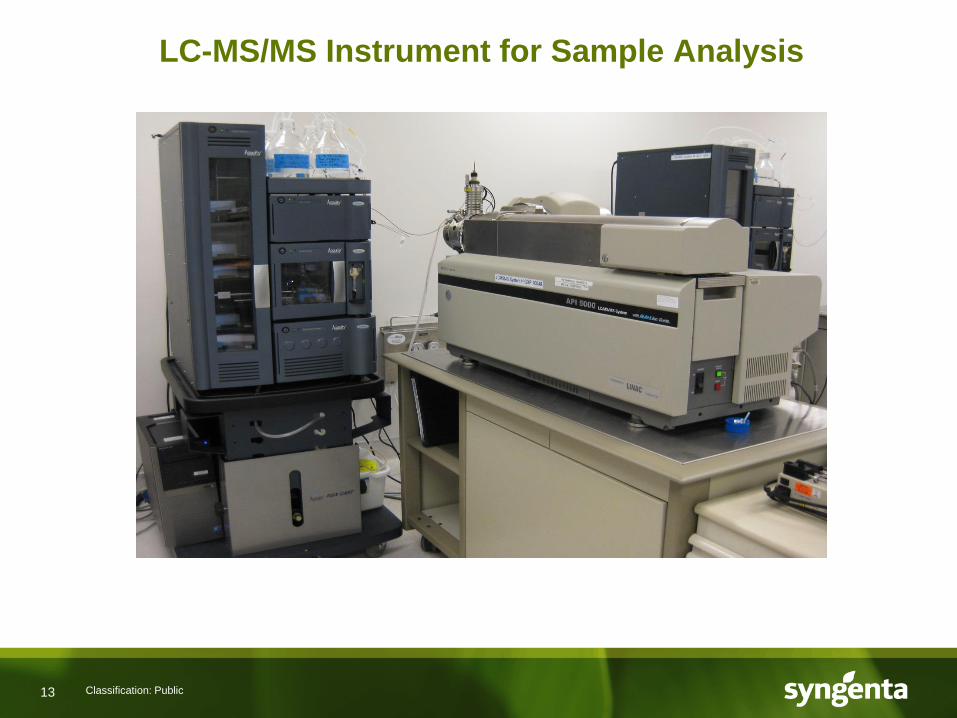
13
LC-MS/MS Instrument for Sample Analysis
Classification: Public
14 Classification: Public
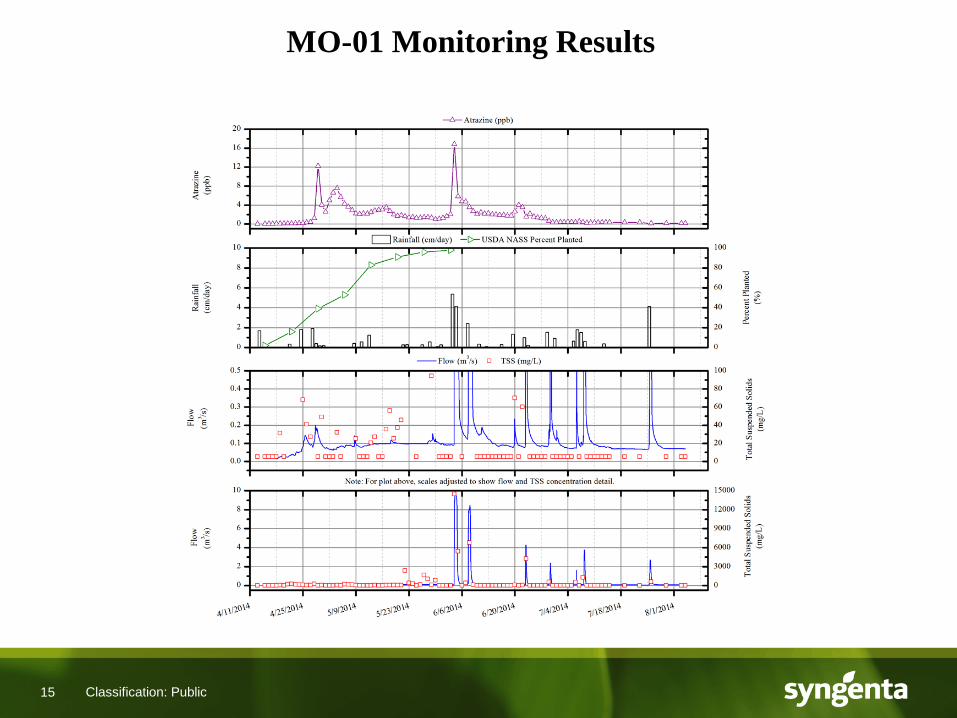
15
MO-01 Monitoring Results
Classification: Public
16
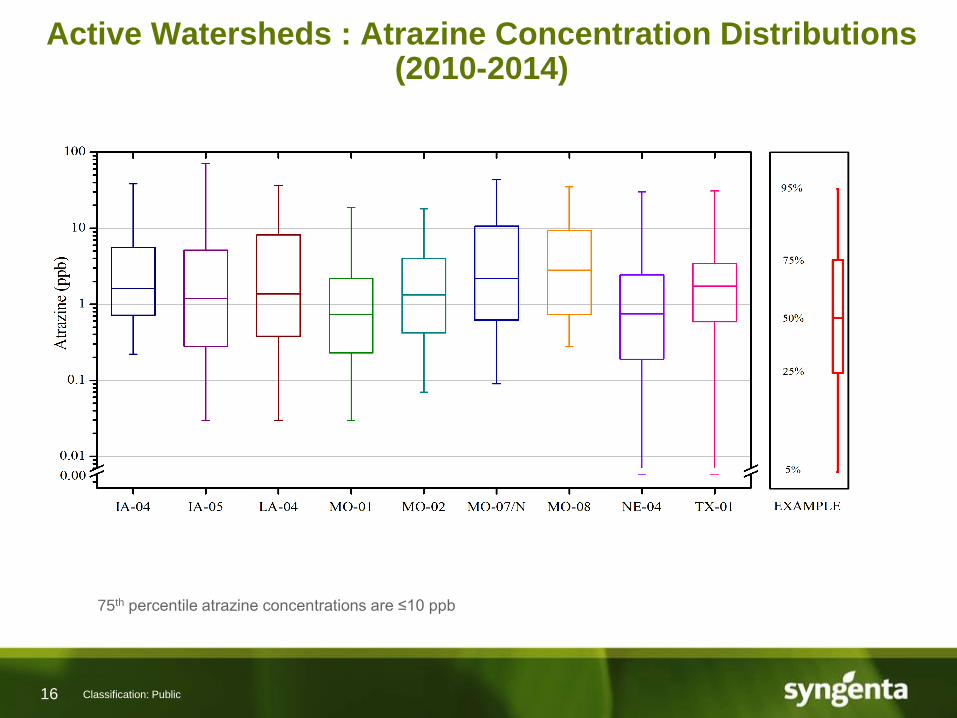
Active Watersheds : Atrazine Concentration Distributions (2010-2014)
Classification: Public
75th percentile atrazine concentrations are ≤10 ppb
17
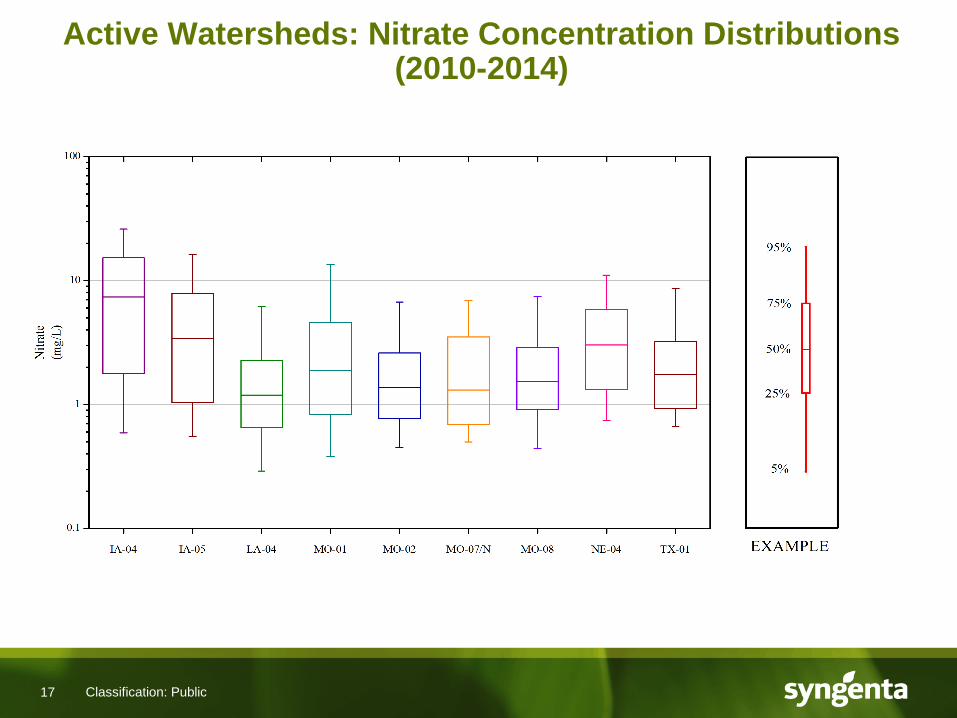
Active Watersheds: Nitrate Concentration Distributions (2010-2014)
Classification: Public
18
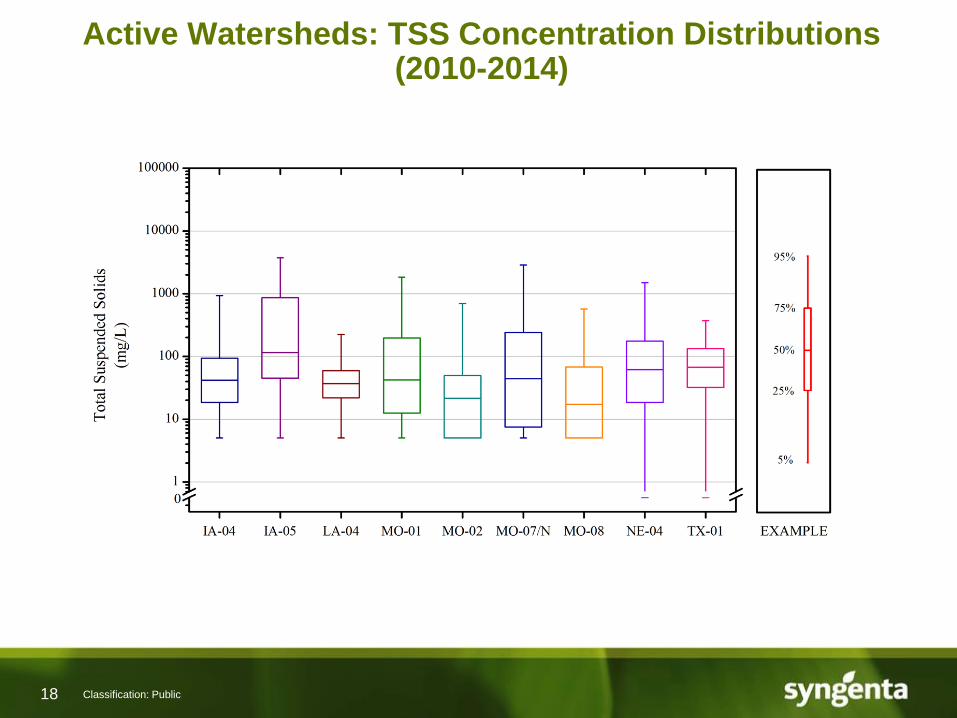
Active Watersheds: TSS Concentration Distributions (2010-2014)
Classification: Public
19
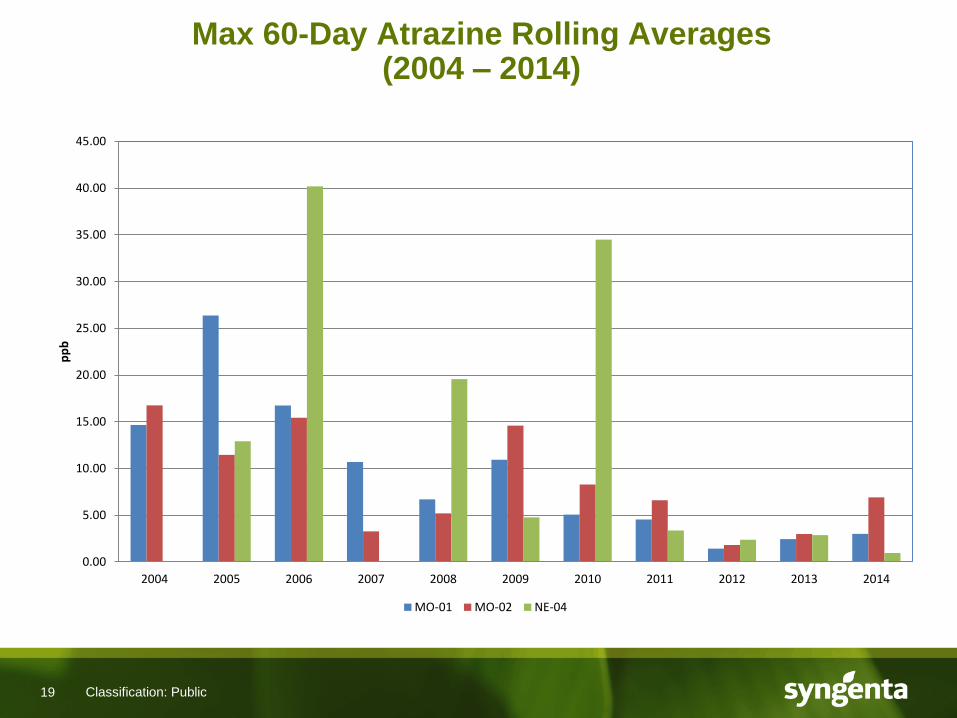
Max 60-Day Atrazine Rolling Averages (2004 – 2014)
0.00
5.00
10.00
15.00
20.00
25.00
30.00
35.00
40.00
45.00
2004 2005 2006 2007 2008 2009 2010 2011 2012 2013 2014
pp
b
MO-01 MO-02 NE-04
Classification: Public

20
MO-01 Atrazine Maximum 60-Day Rolling Averages
R² = 0.7215
0.00
5.00
10.00
15.00
20.00
25.00
30.00
2004 2005 2006 2007 2008 2009 2010 2011 2012 2013 2014
Pp
b
Year
Classification: Public
21
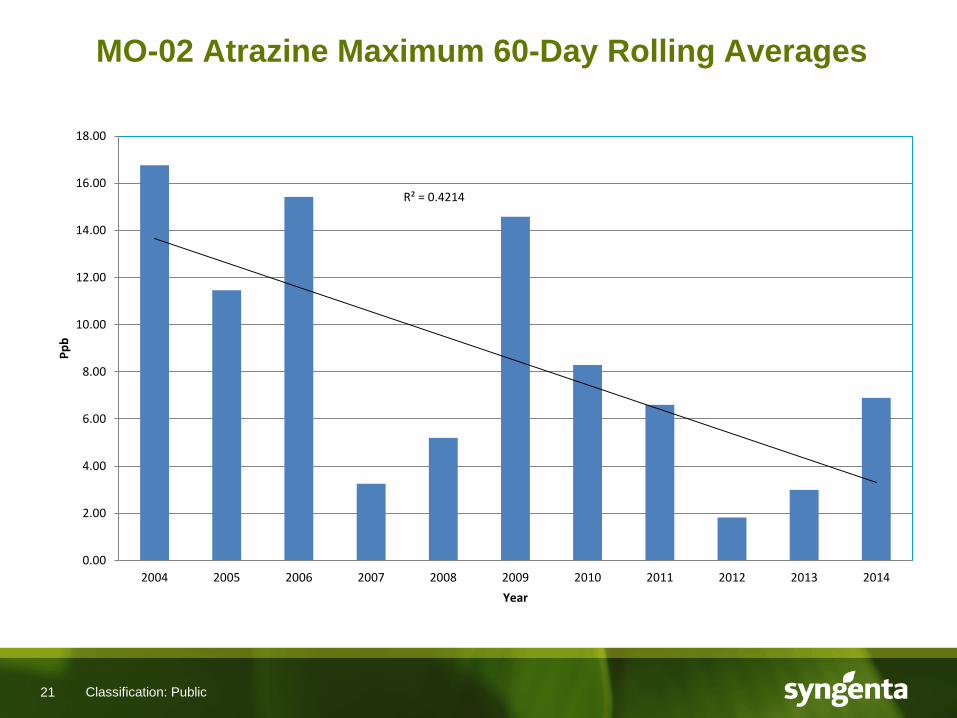
MO-02 Atrazine Maximum 60-Day Rolling Averages
R² = 0.4214
0.00
2.00
4.00
6.00
8.00
10.00
12.00
14.00
16.00
18.00
2004 2005 2006 2007 2008 2009 2010 2011 2012 2013 2014
Pp
b
Year
Classification: Public
22
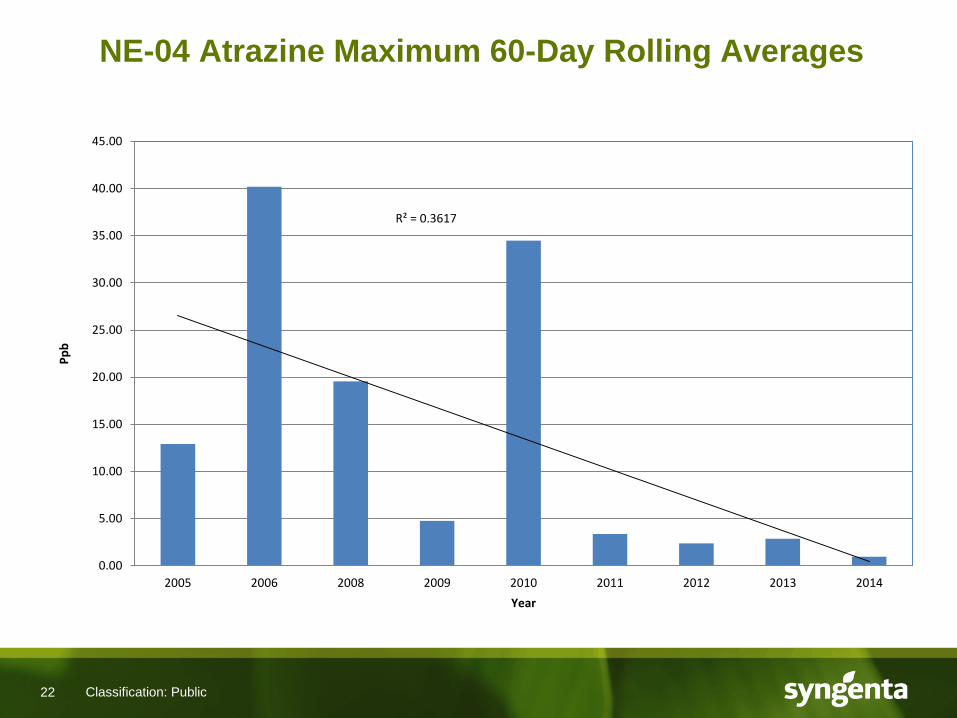
NE-04 Atrazine Maximum 60-Day Rolling Averages
R² = 0.3617
0.00
5.00
10.00
15.00
20.00
25.00
30.00
35.00
40.00
45.00
2005 2006 2008 2009 2010 2011 2012 2013 2014
Pp
b
Year
Classification: Public
23
Summary and Conclusions
● More than 21,000 data points have been generated from 250 site-years
of monitoring across all major US corn, sorghum and sugarcane
producing states since 2004.
● The science-based approach successfully identified high runoff potential
watersheds for this monitoring program.
● Daily composite samples and weather data were collected during crucial
crop growing seasons (e.g., April – July in Midwest states).
● Elevated levels of atrazine were detected in some watersheds when
significant rainfall followed shortly after cumulative applications.
● However, elevated detections were short-lived and dissipated quickly
after major runoff event.
● Atrazine residue declining trend was noticed in those watersheds where
BMP had been successfully implemented.
Classification: Public

24
THANK YOU!
Classification: Public