Embed Size (px)
Citation preview

Sun Power MinnesotaJoining the International Solar Fiesta
John Farrell, DirectorEnergy Self-Reliant States and Communities program
[email protected] x210
Presentation on Oct. 13, 2011
ILSR’s Unique Perspective
Centralized PowerYesterday Tomorrow
Transmission network
Distribution network
House
Storage
Local CHP plant
Commercialbuilding
Factory
Storage
Storage
Storage
Solar PV power plant
Windpowerplant
House with domestic CHP
Clean, local power
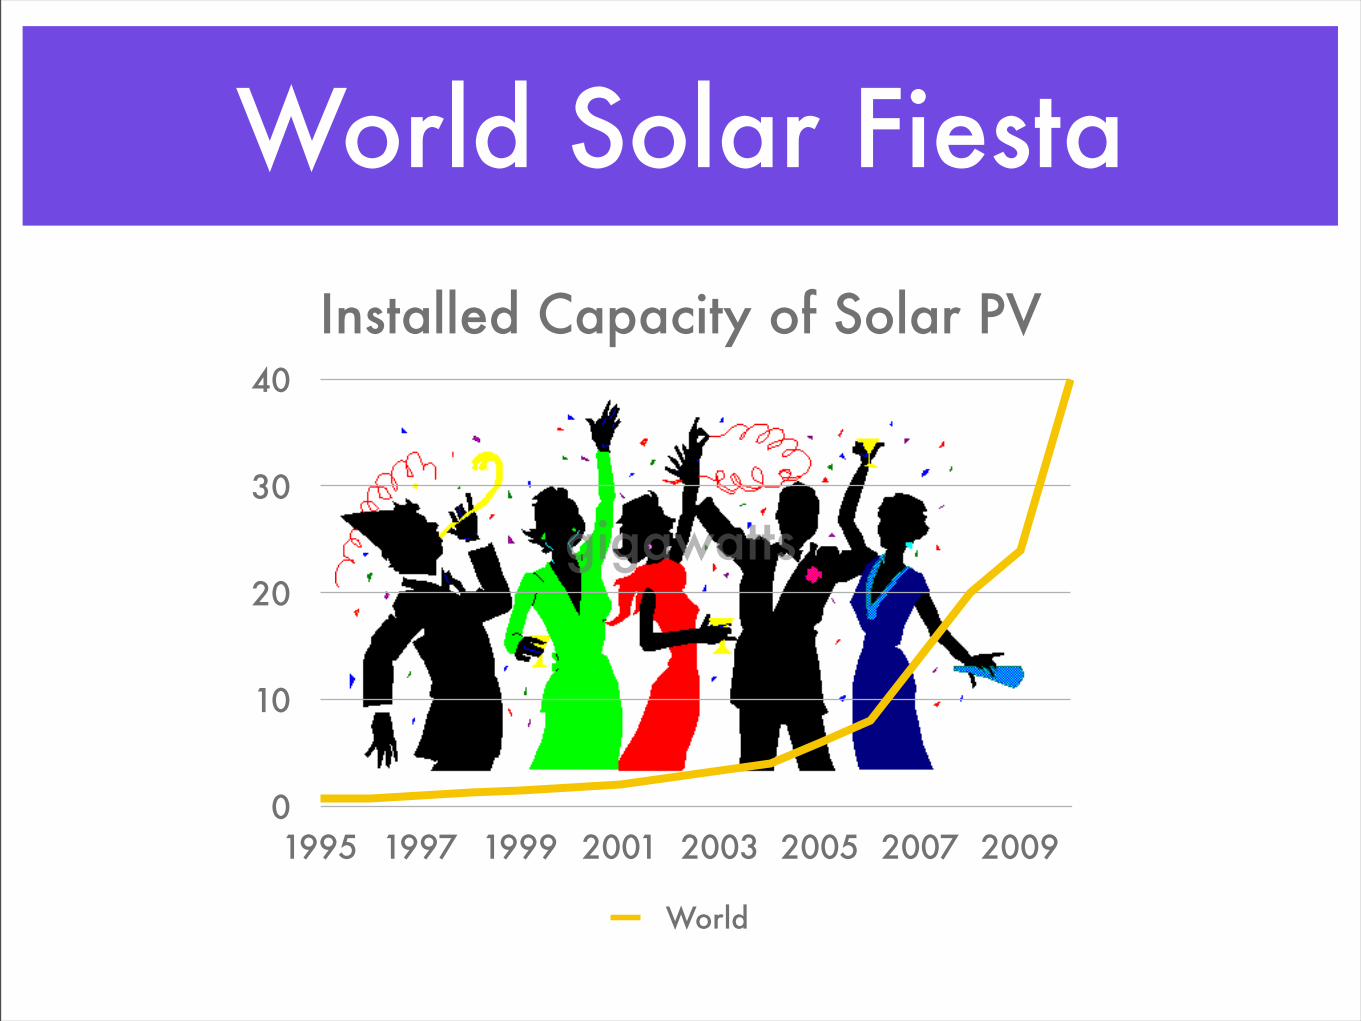
World Solar Fiesta
0
10
20
30
40
1995 1997 1999 2001 2003 2005 2007 2009
gigawatts
World
Installed Capacity of Solar PV
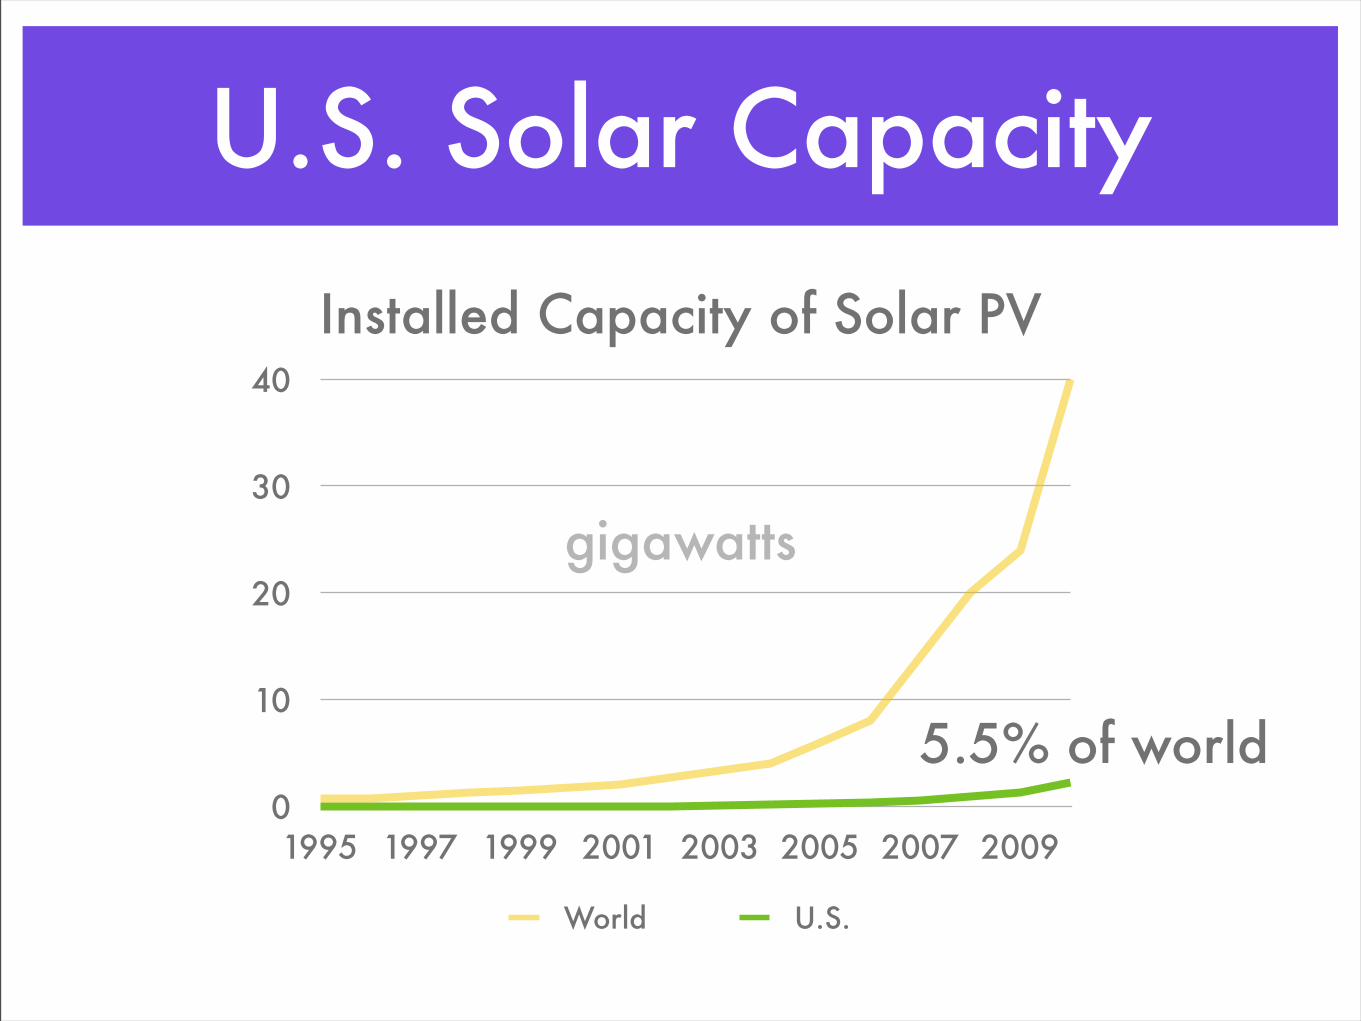
U.S. Solar Capacity
0
10
20
30
40
1995 1997 1999 2001 2003 2005 2007 2009
gigawatts
World U.S.
5.5% of world
Installed Capacity of Solar PV
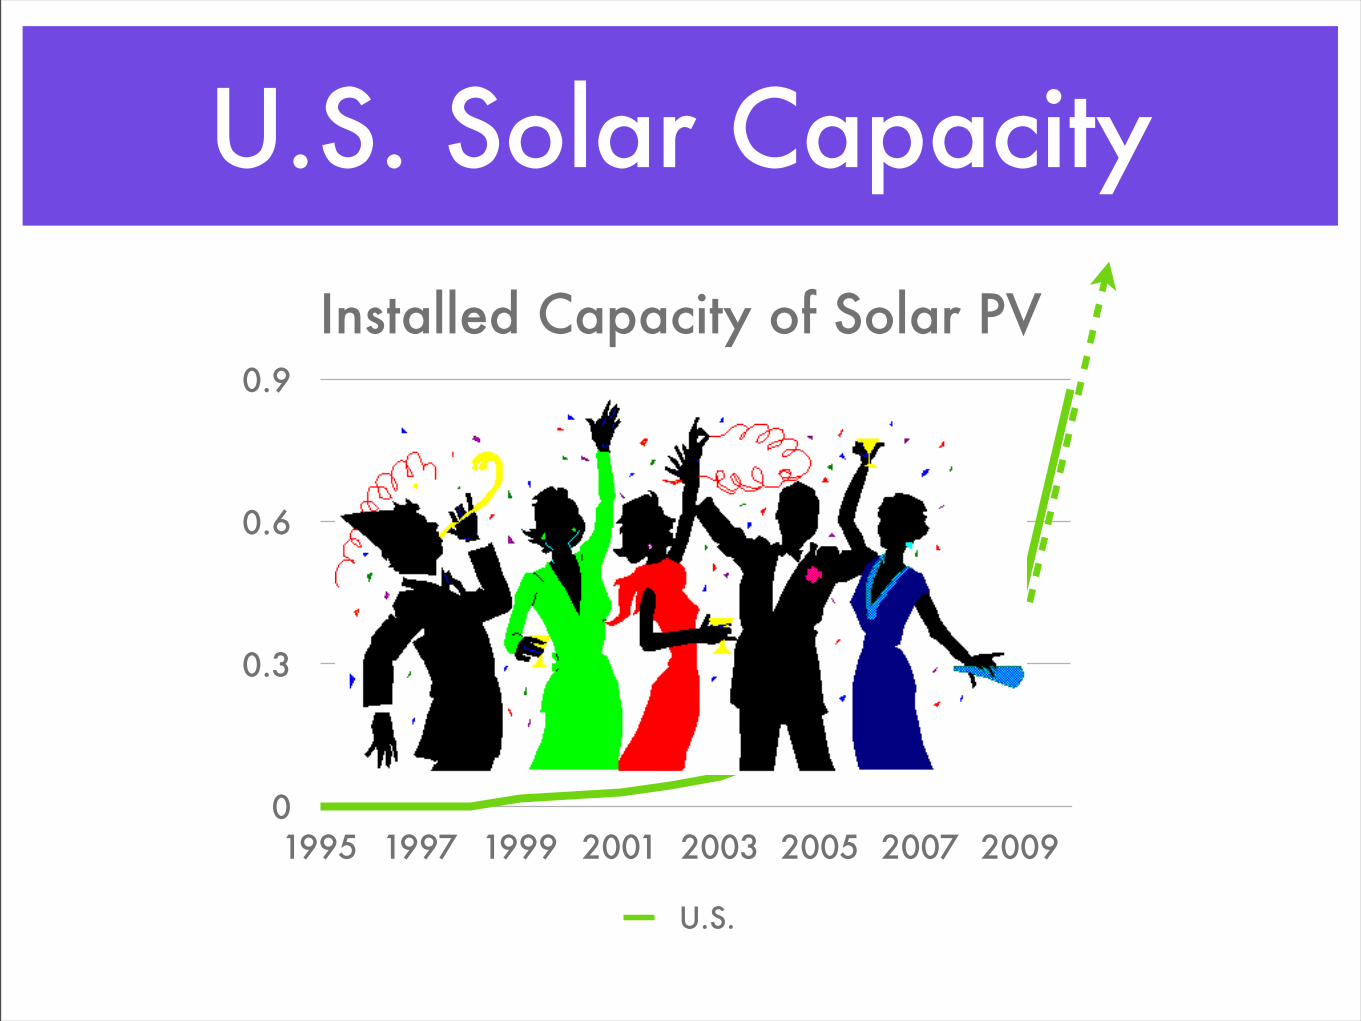
U.S. Solar Capacity
0
0.3
0.6
0.9
1995 1997 1999 2001 2003 2005 2007 2009
gigawatts
U.S.
Installed Capacity of Solar PV
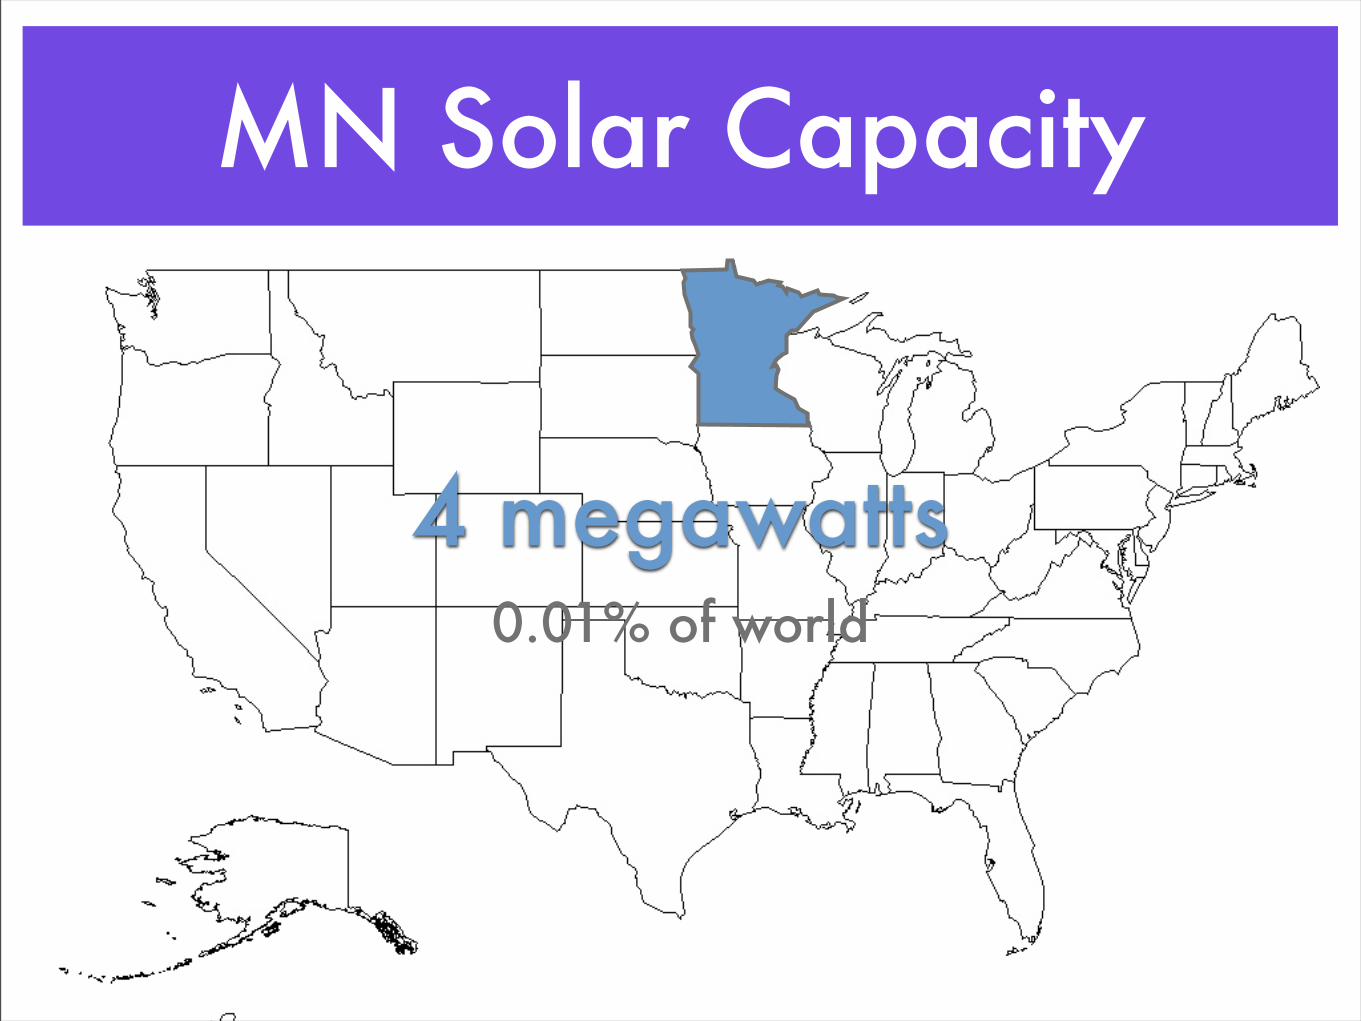
MN Solar Capacity
4 megawatts0.01% of world
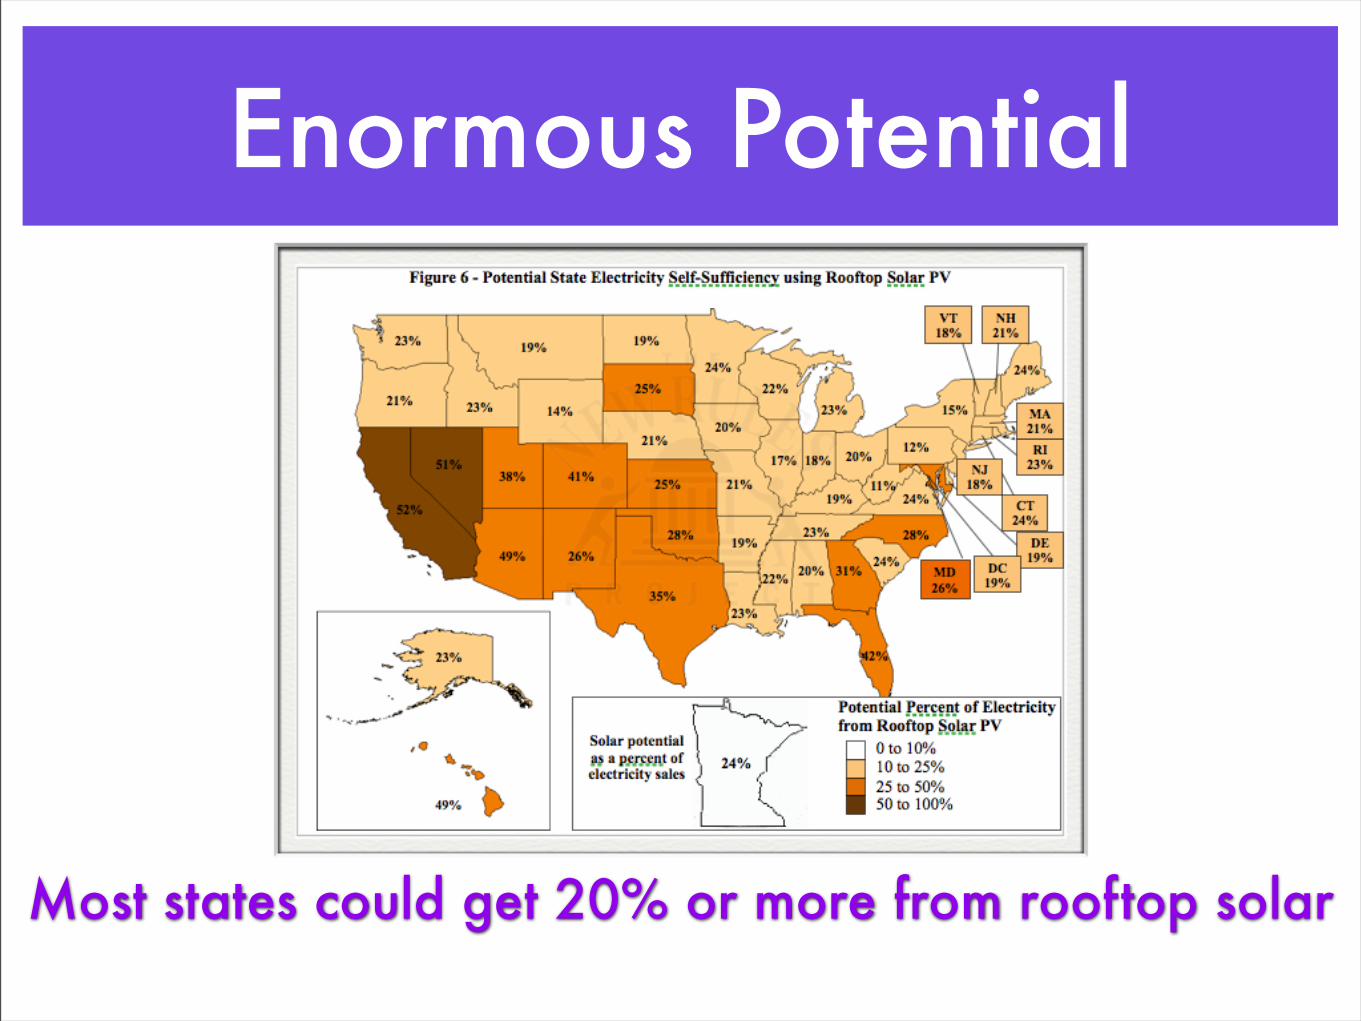
Enormous Potential
Most states could get 20% or more from rooftop solar

Enormous Potential
24%
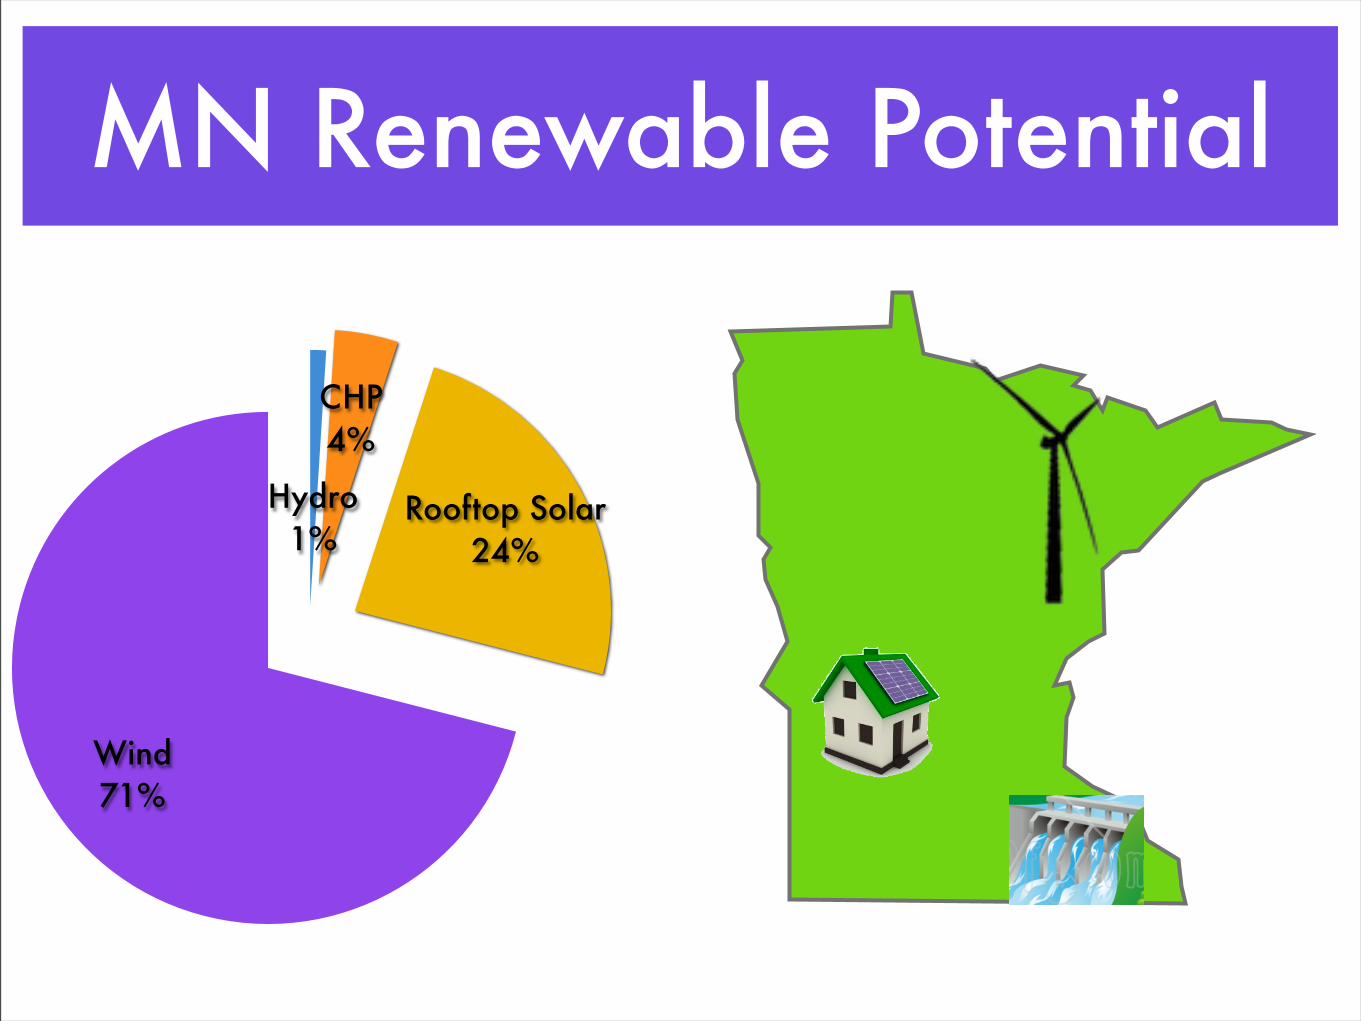
MN Renewable Potential
Wind71%
Rooftop Solar24%
CHP4%
Hydro1%
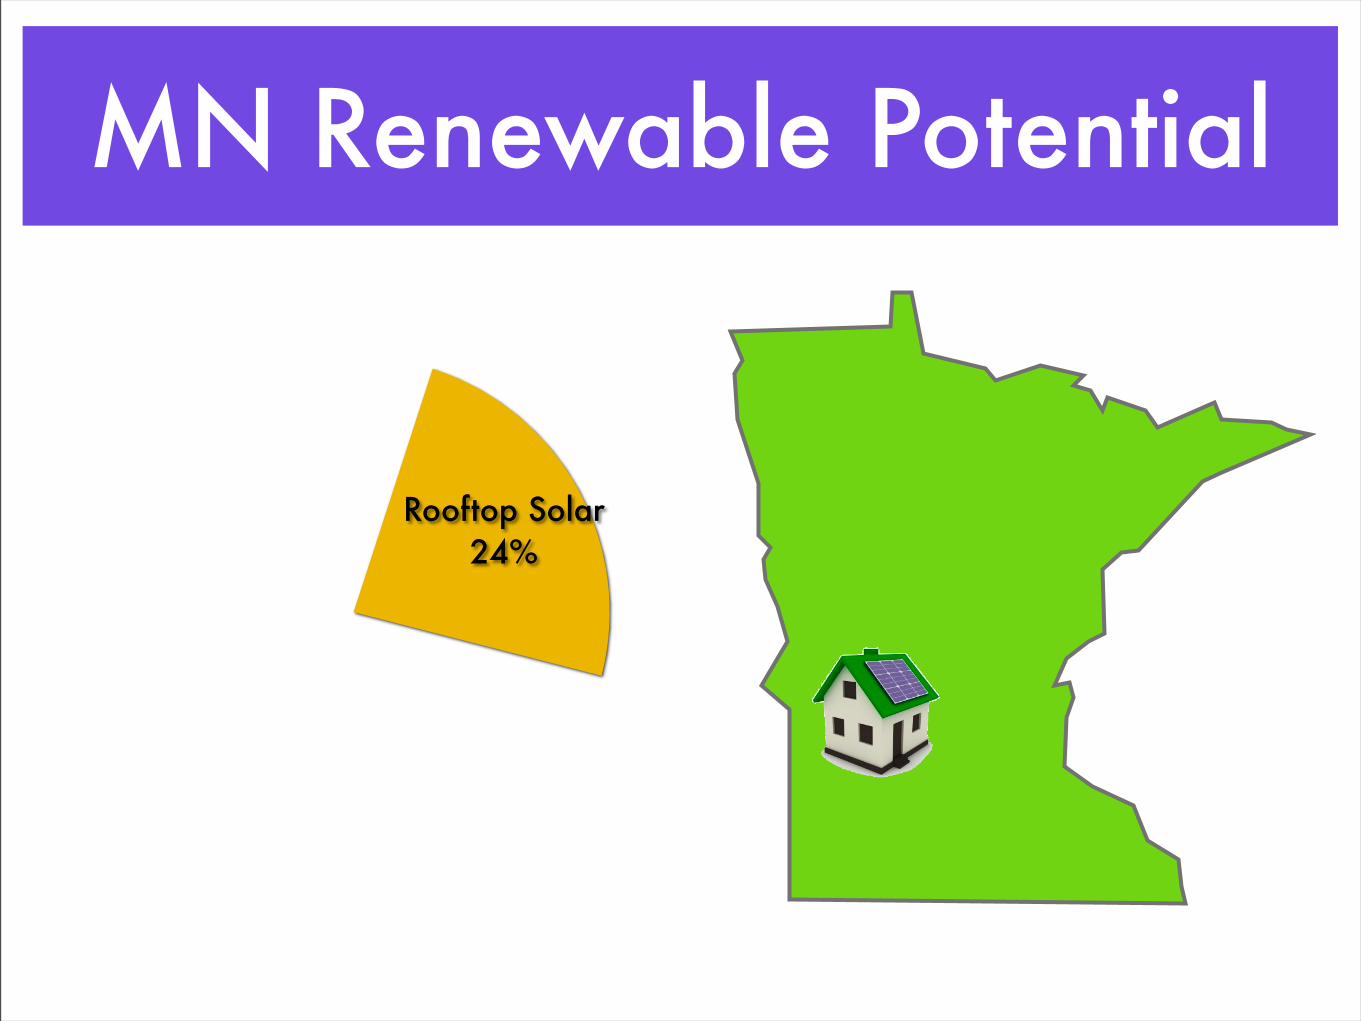
MN Renewable Potential
71%
Rooftop Solar24%
4%
1%
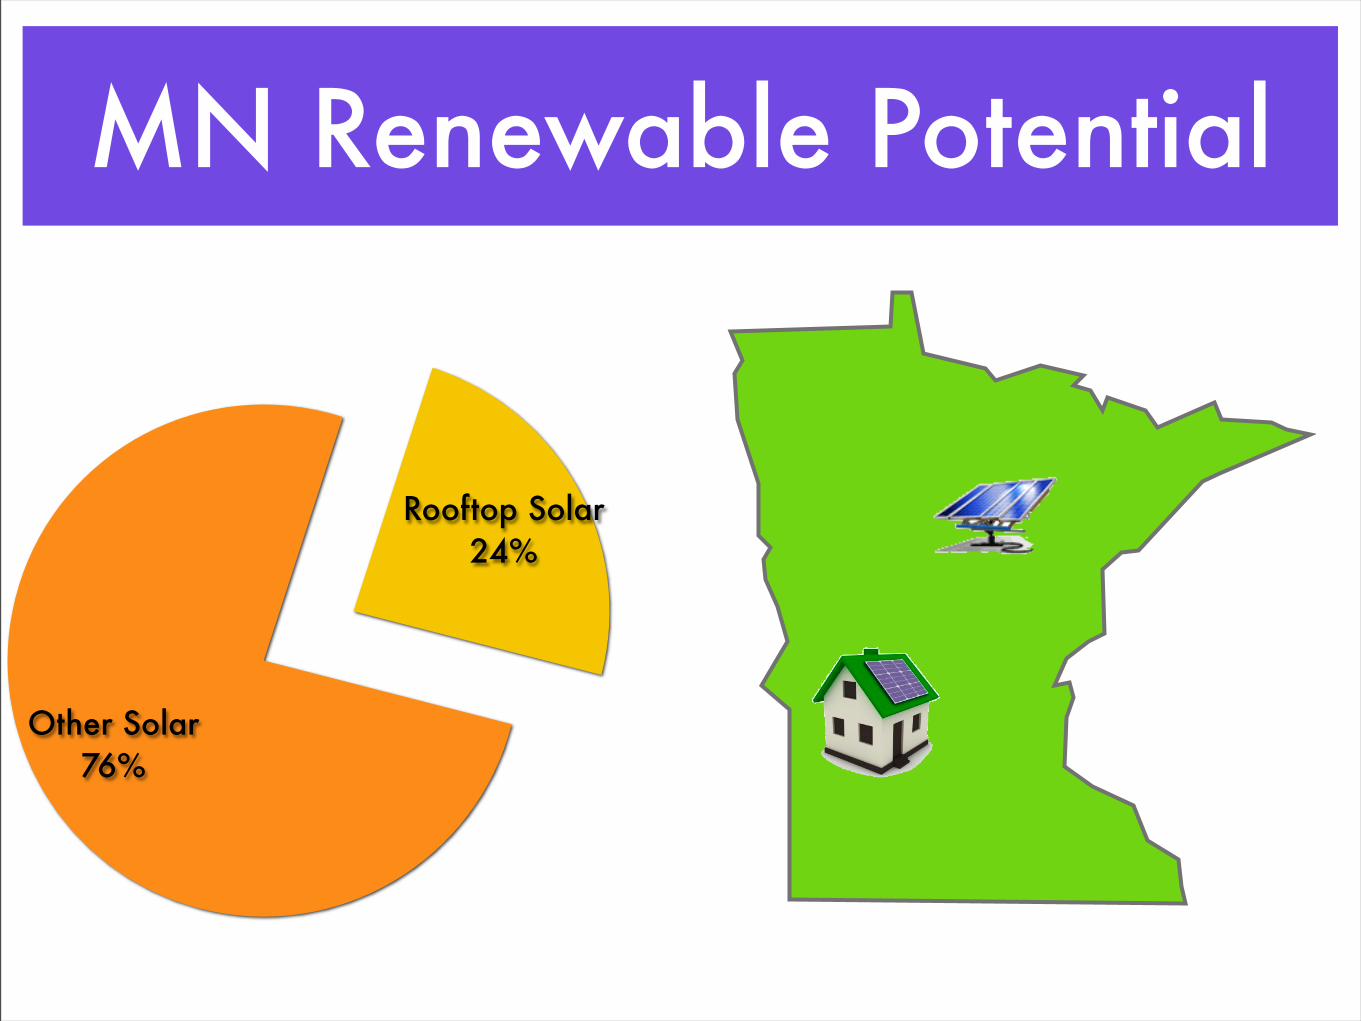
MN Renewable Potential
Other Solar76%
Rooftop Solar24%
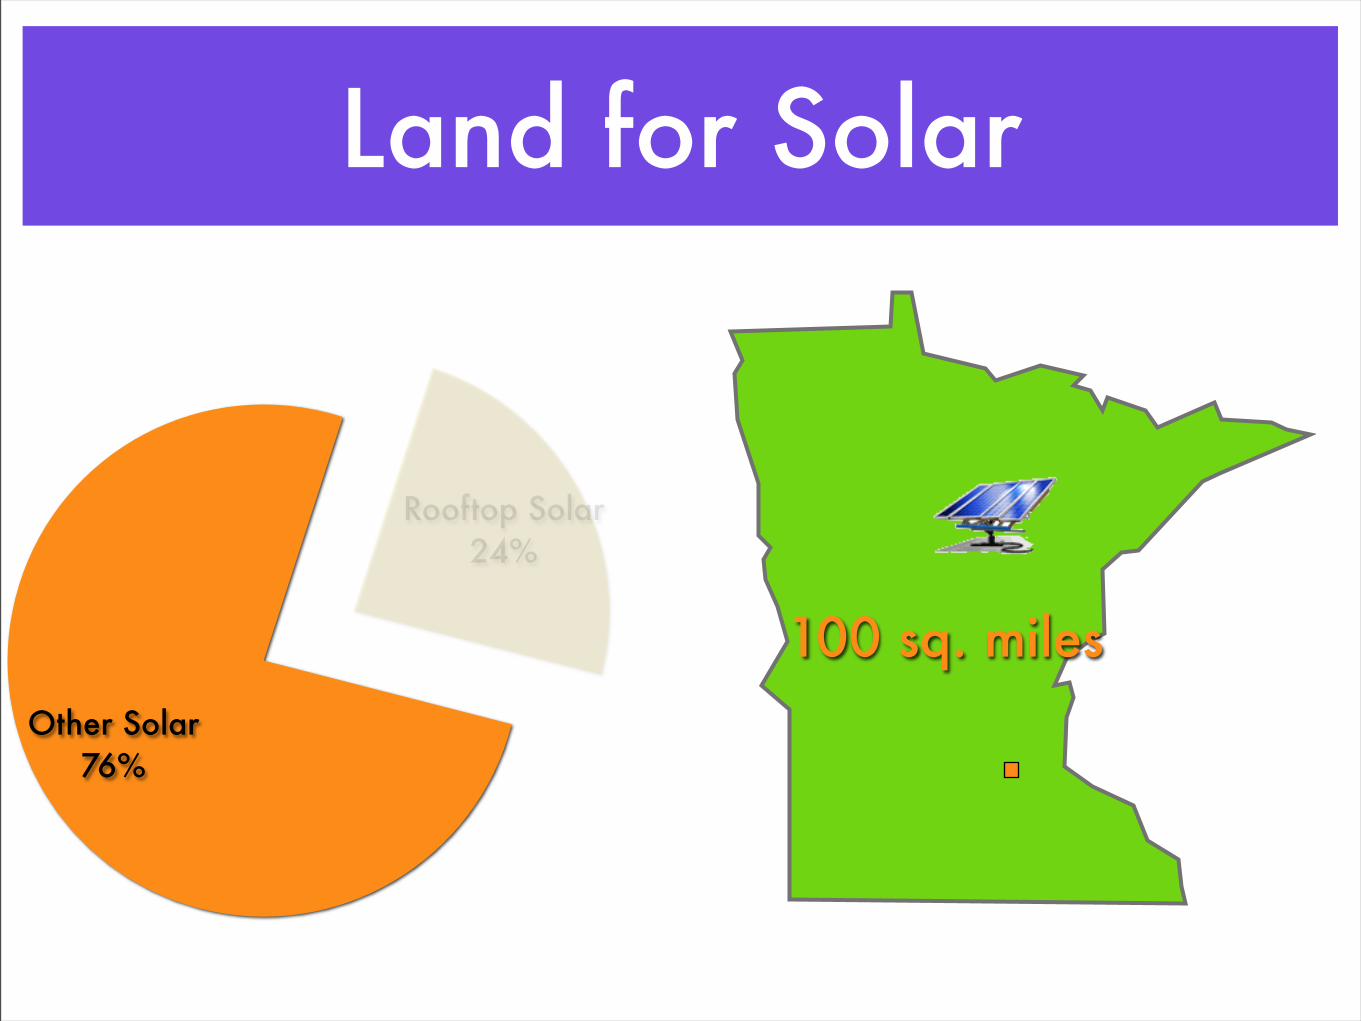
Land for Solar
Other Solar76%
Rooftop Solar24%
100 sq. miles
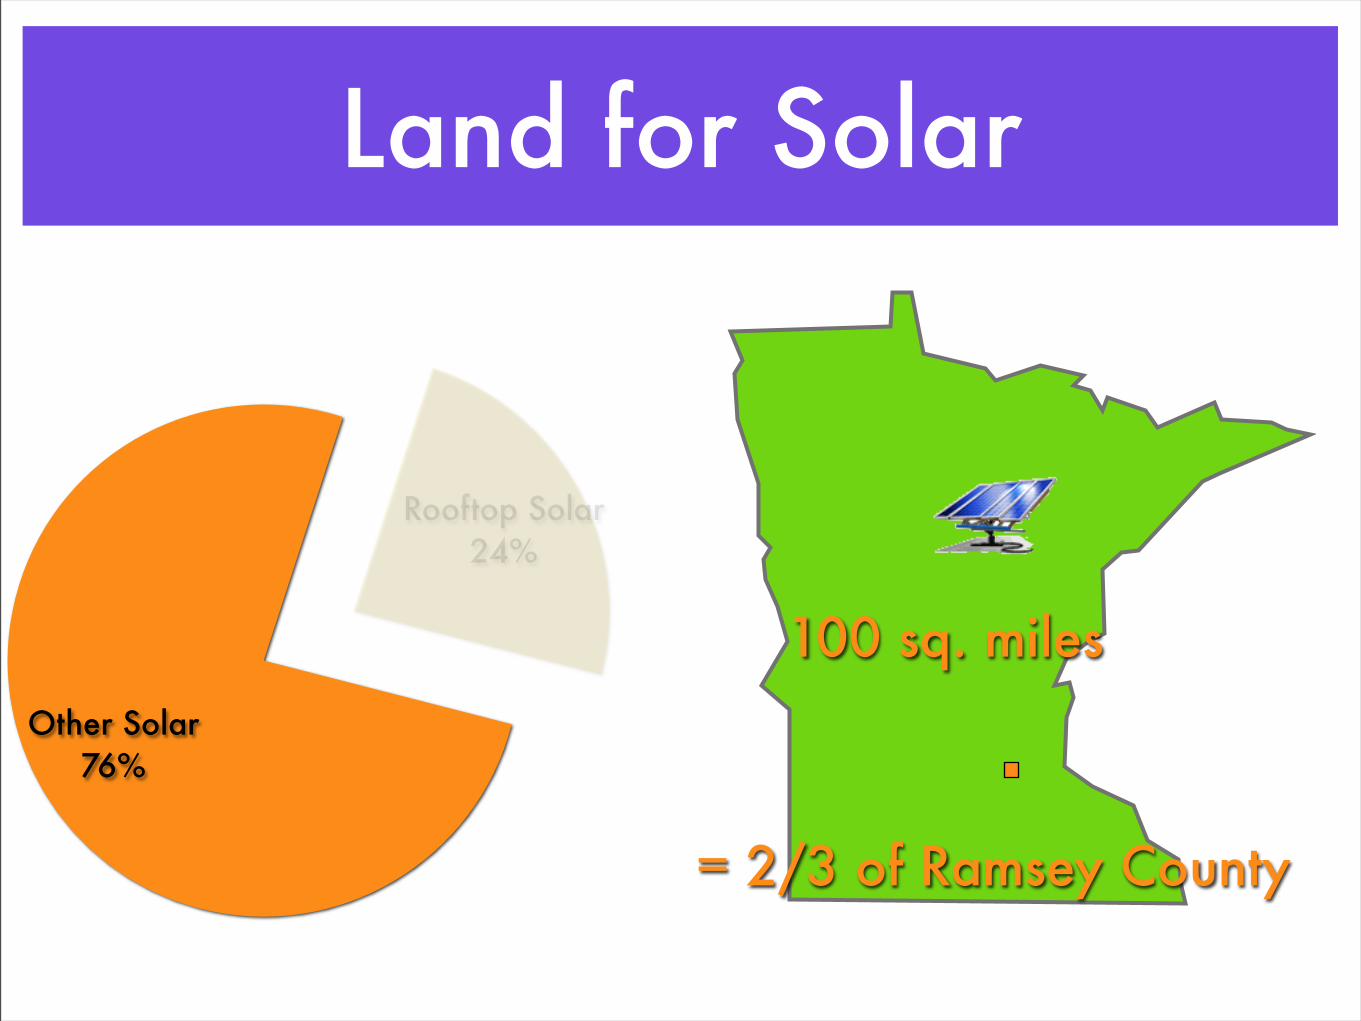
Land for Solar
100 sq. miles
= 2/3 of Ramsey County
Other Solar76%
Rooftop Solar24%
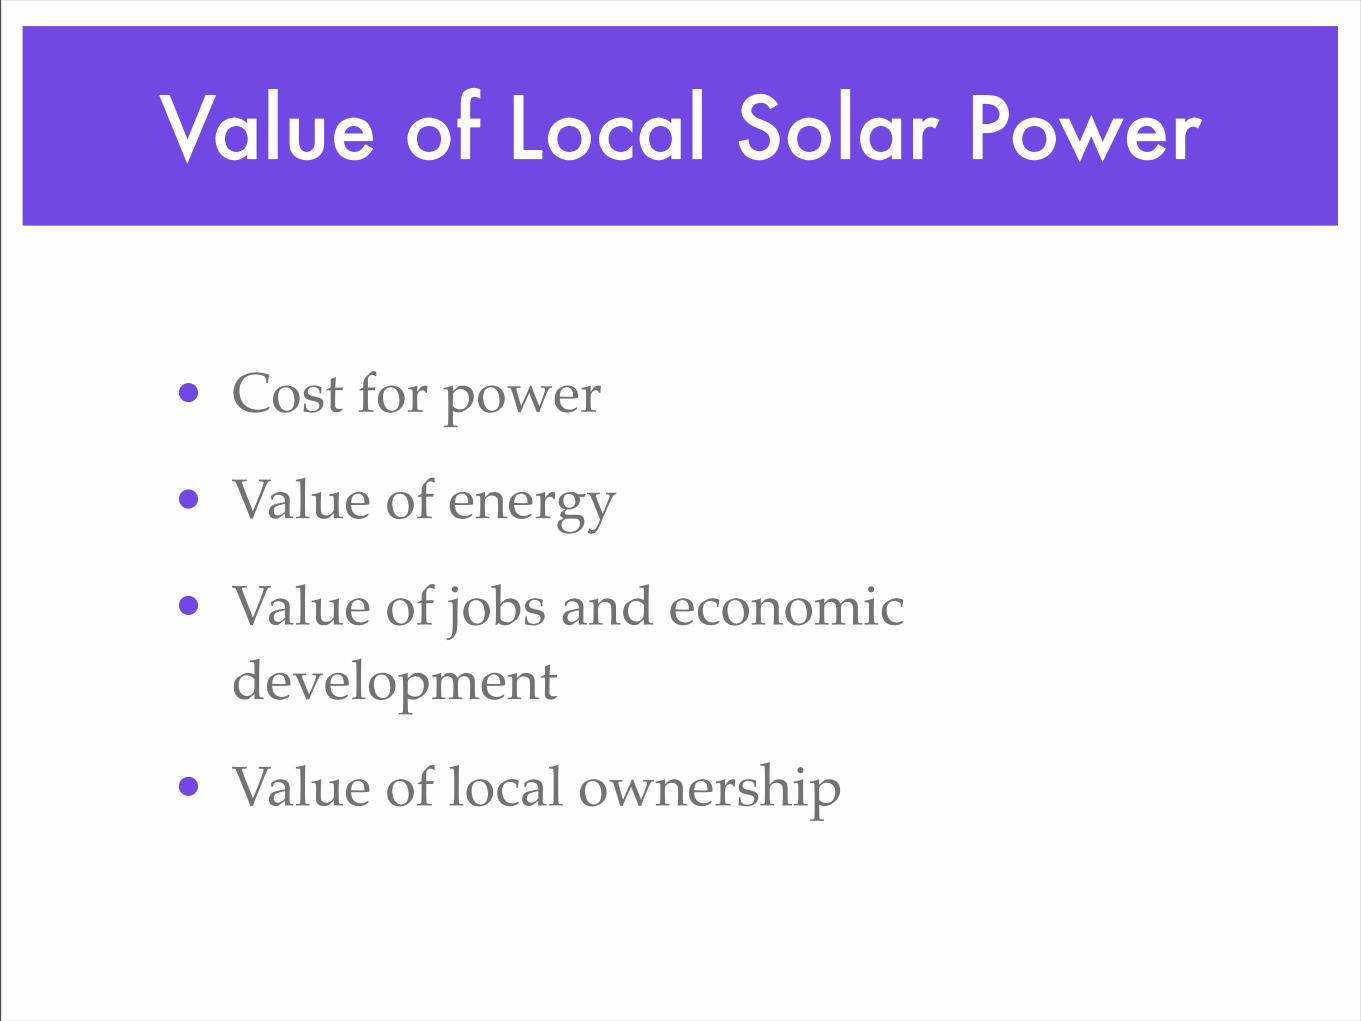
Value of Local Solar Power
• Cost for power
• Value of energy
• Value of jobs and economic development
• Value of local ownership
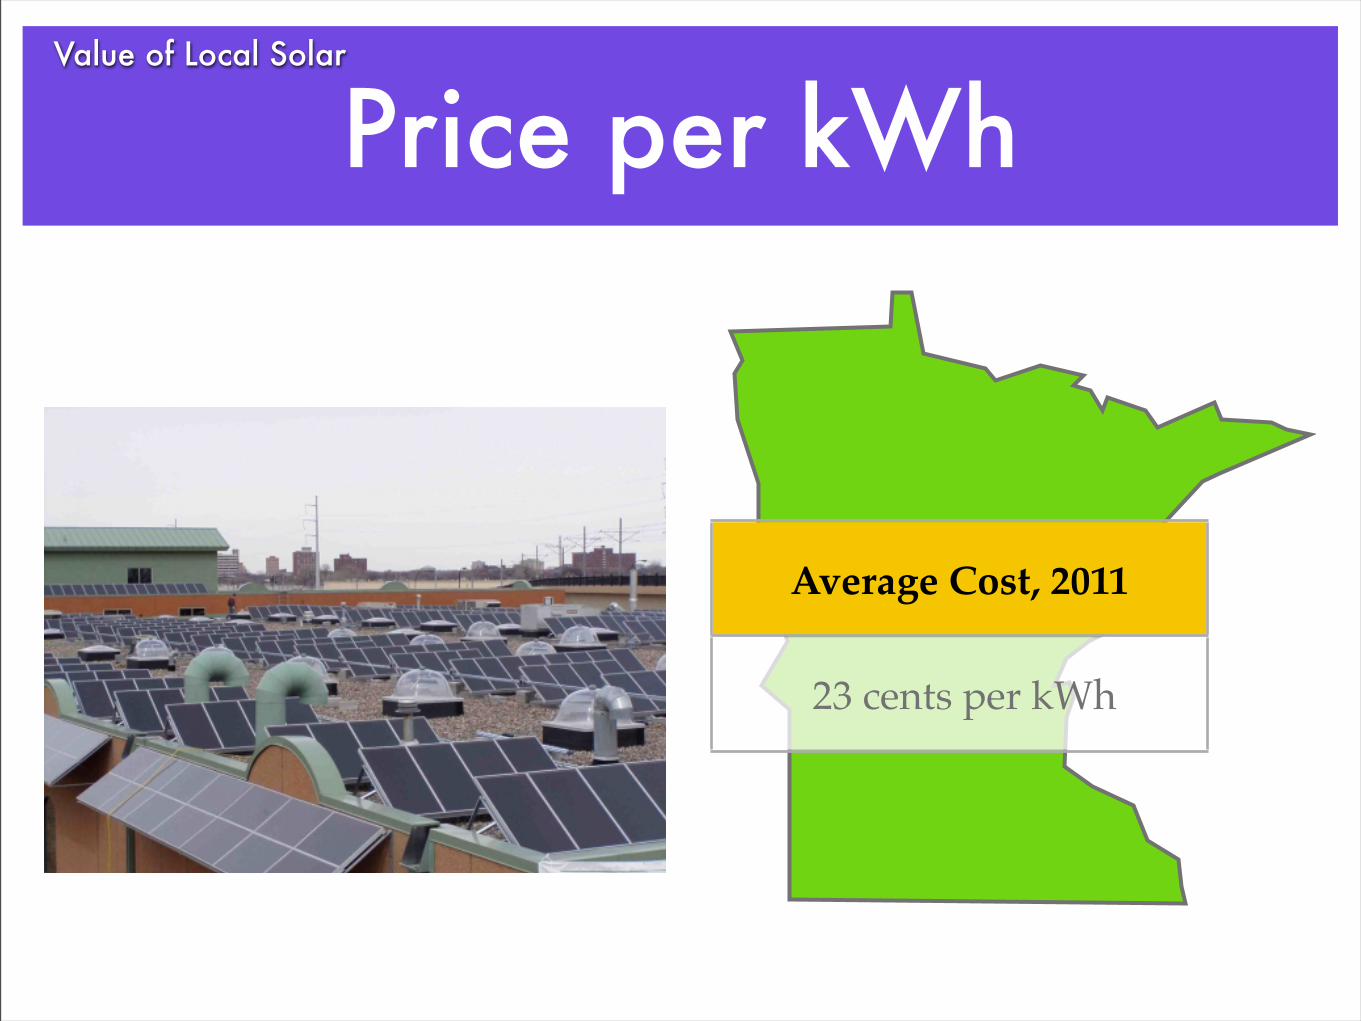
Price per kWhValue of Local Solar
Average Cost, 2011
23 cents per kWh
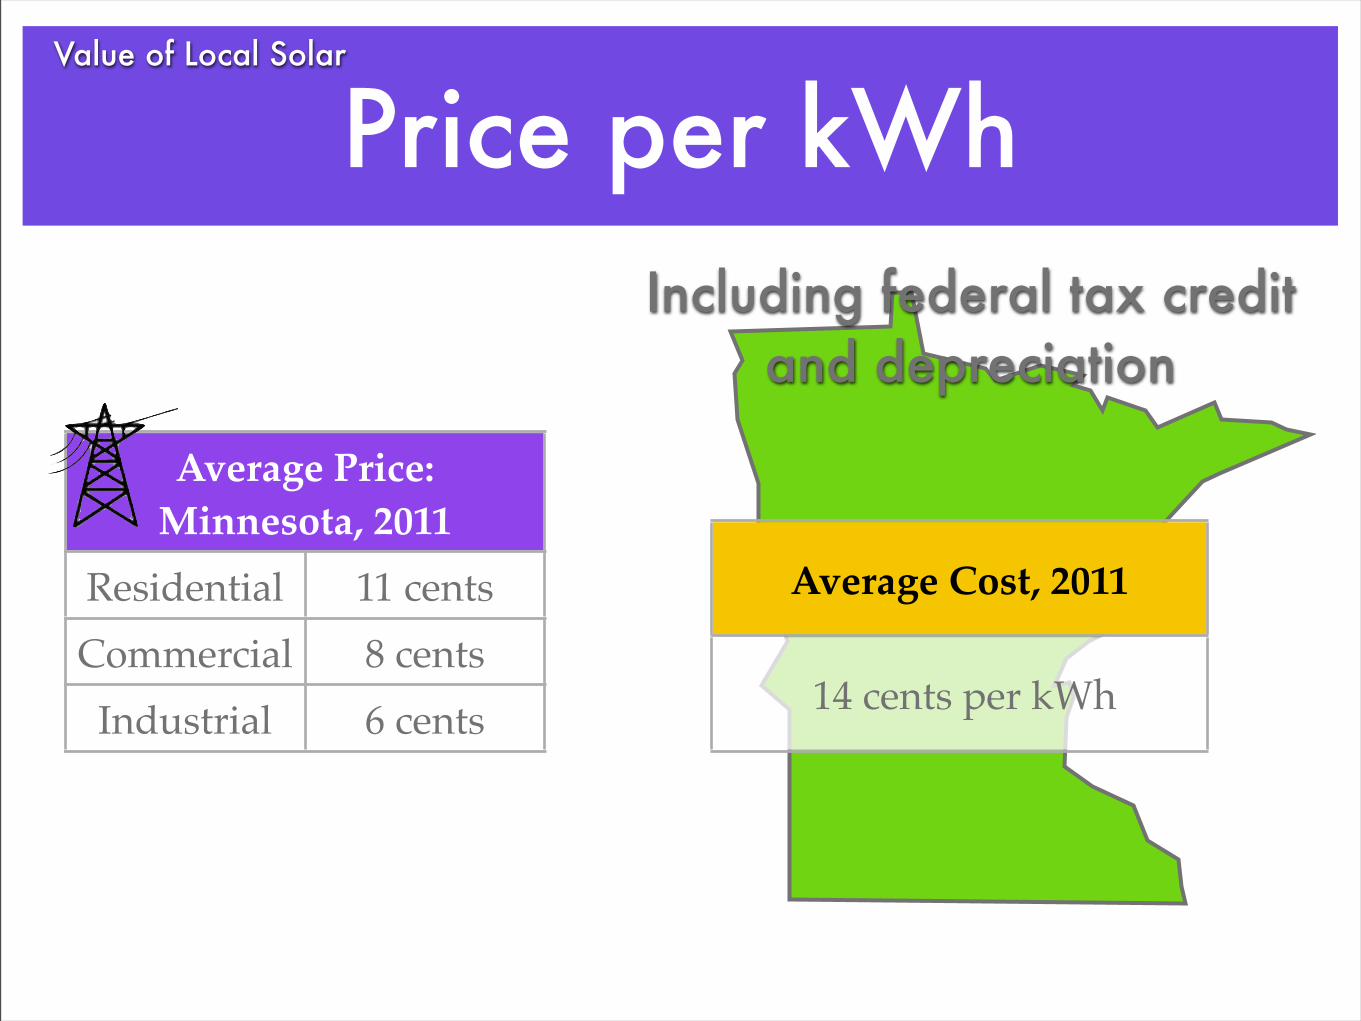
Price per kWhIncluding federal tax credit
and depreciation
Average Cost, 2011
14 cents per kWh
Average Price: Minnesota, 2011Average Price:
Minnesota, 2011Residential 11 centsCommercial 8 cents
Industrial 6 cents
Value of Local Solar
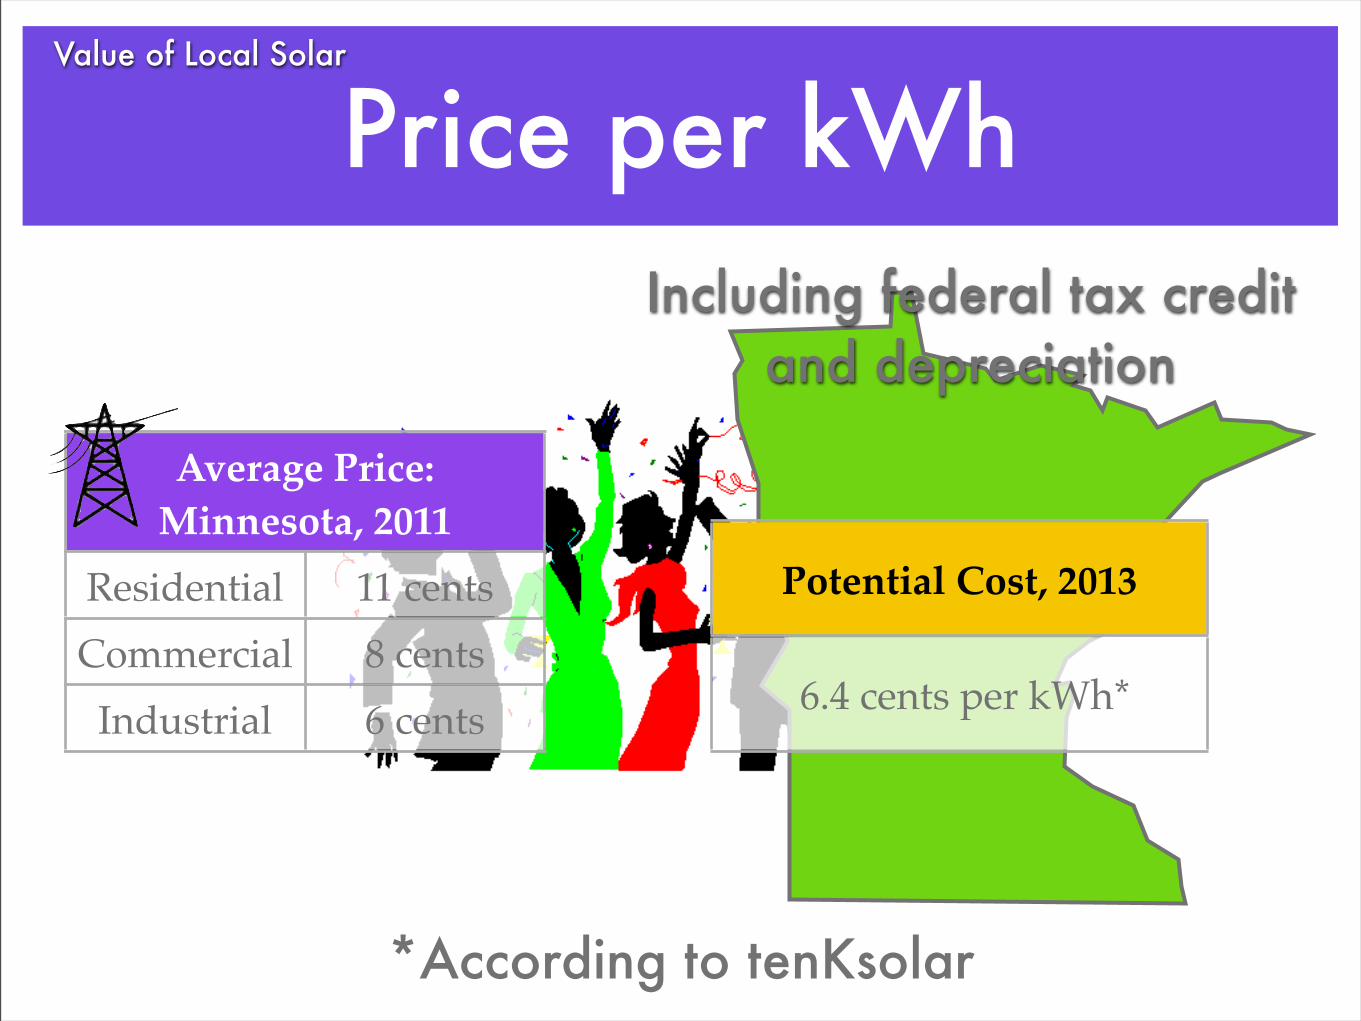
Price per kWhIncluding federal tax credit
and depreciation
Potential Cost, 2013
6.4 cents per kWh*
*According to tenKsolar
Average Price: Minnesota, 2011Average Price:
Minnesota, 2011Residential 11 centsCommercial 8 cents
Industrial 6 cents
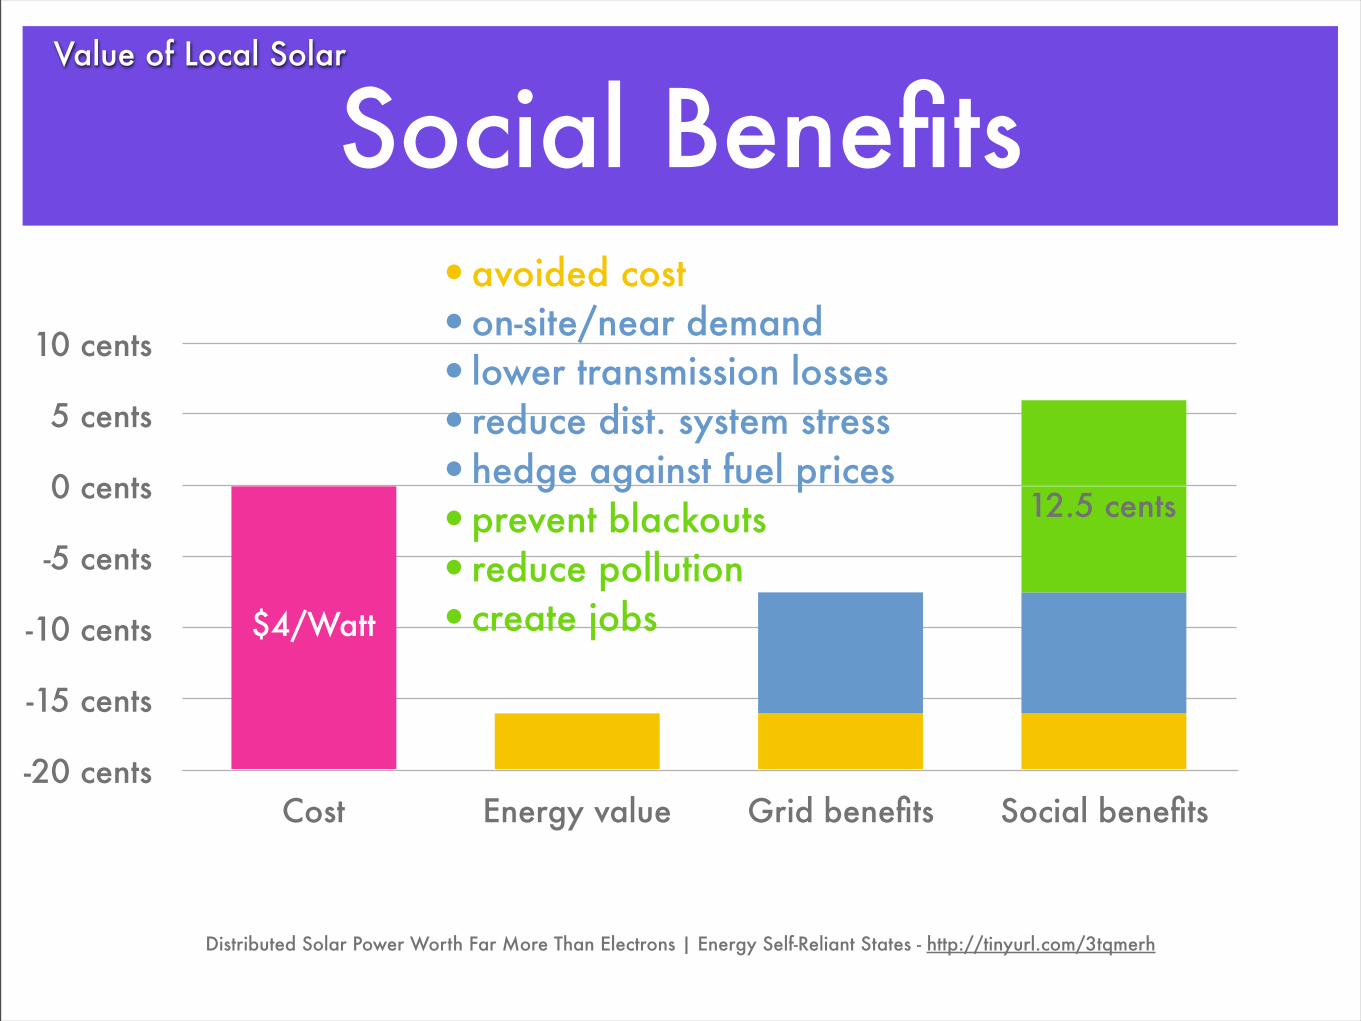
Value of Local Solar
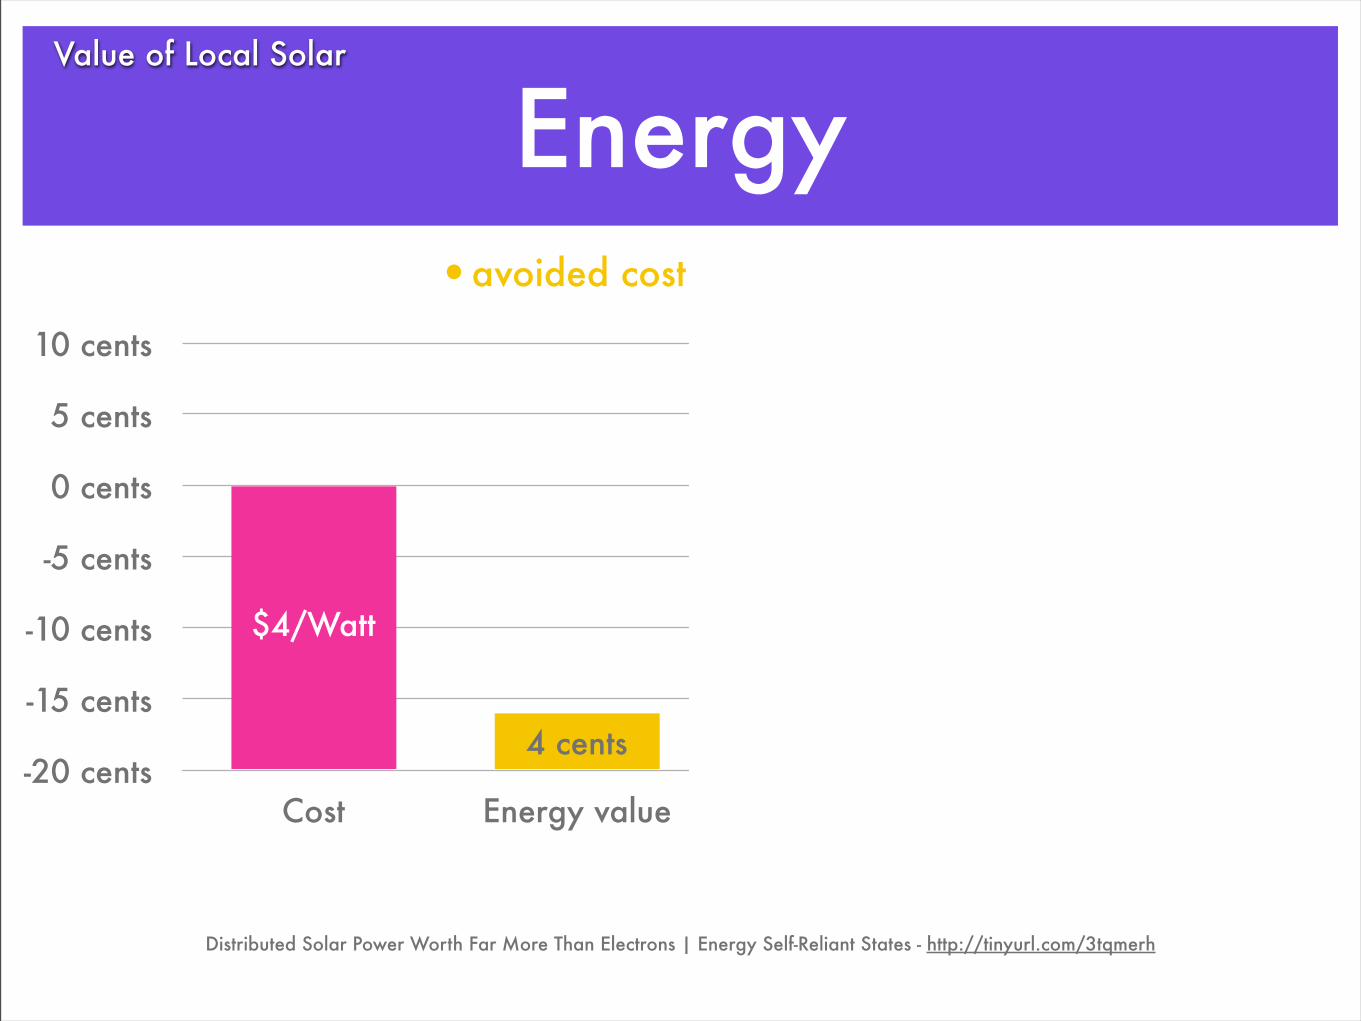
•avoided cost•on-site/near demand•lower transmission losses•reduce dist. system stress•hedge against fuel prices•prevent blackouts•reduce pollution•create jobs
-20 cents
-15 cents
-10 cents
-5 cents
0 cents
5 cents
10 cents
Cost Energy value Grid benefits Social benefits
Energy
Distributed Solar Power Worth Far More Than Electrons | Energy Self-Reliant States - http://tinyurl.com/3tqmerh
4 cents
$4/Watt
Value of Local Solar
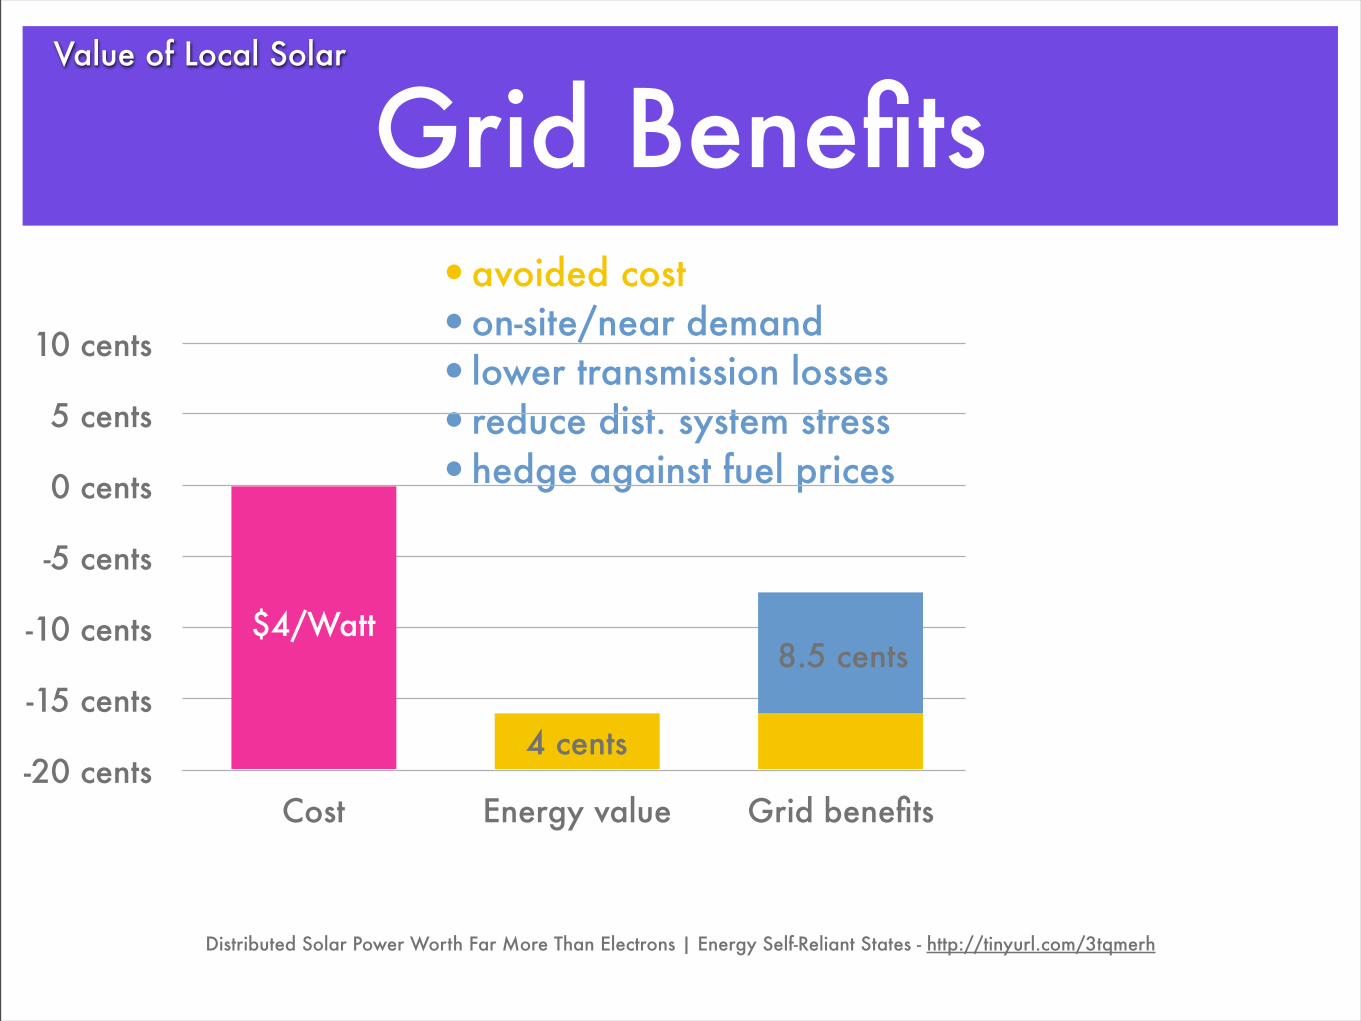
•avoided cost•on-site/near demand•lower transmission losses•reduce dist. system stress•hedge against fuel prices•prevent blackouts•reduce pollution•create jobs
-20 cents
-15 cents
-10 cents
-5 cents
0 cents
5 cents
10 cents
Cost Energy value Grid benefits Social benefits
Grid Benefits
Distributed Solar Power Worth Far More Than Electrons | Energy Self-Reliant States - http://tinyurl.com/3tqmerh
4 cents
8.5 cents$4/Watt
Value of Local Solar
-20 cents
-15 cents
-10 cents
-5 cents
0 cents
5 cents
10 cents
Cost Energy value Grid benefits Social benefits
Social Benefits
Distributed Solar Power Worth Far More Than Electrons | Energy Self-Reliant States - http://tinyurl.com/3tqmerh
•avoided cost•on-site/near demand•lower transmission losses•reduce dist. system stress•hedge against fuel prices•prevent blackouts•reduce pollution•create jobs
12.5 cents
$4/Watt
Value of Local Solar
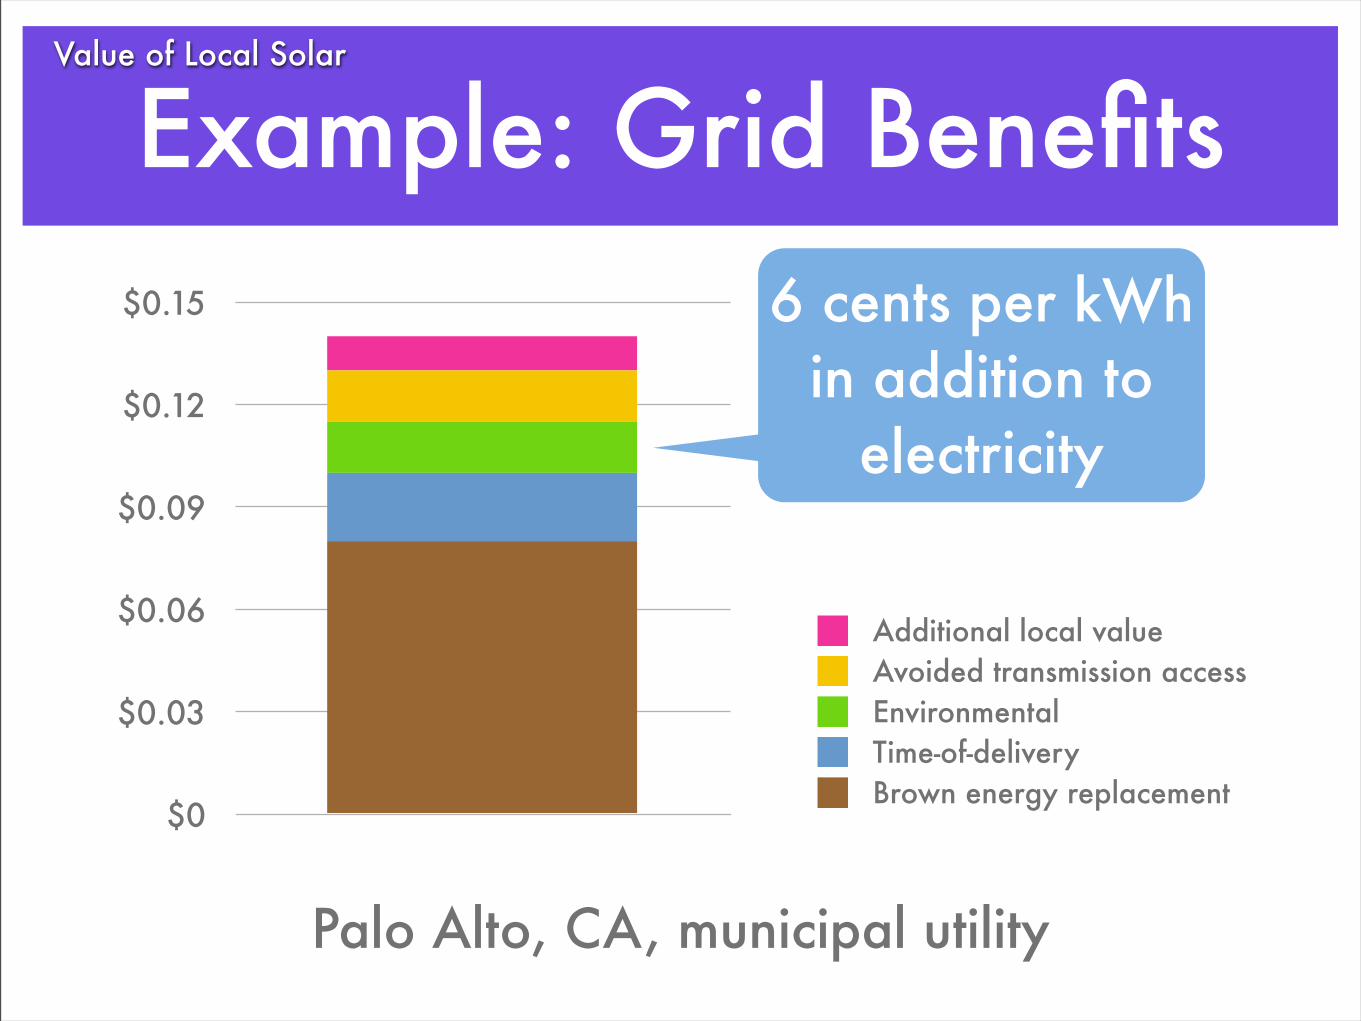
Example: Grid Benefits6 cents per kWh
in addition to electricity
Palo Alto, CA, municipal utility
$0
$0.03
$0.06
$0.09
$0.12
$0.15
Brown energy replacementTime-of-deliveryEnvironmentalAvoided transmission accessAdditional local value
Value of Local Solar
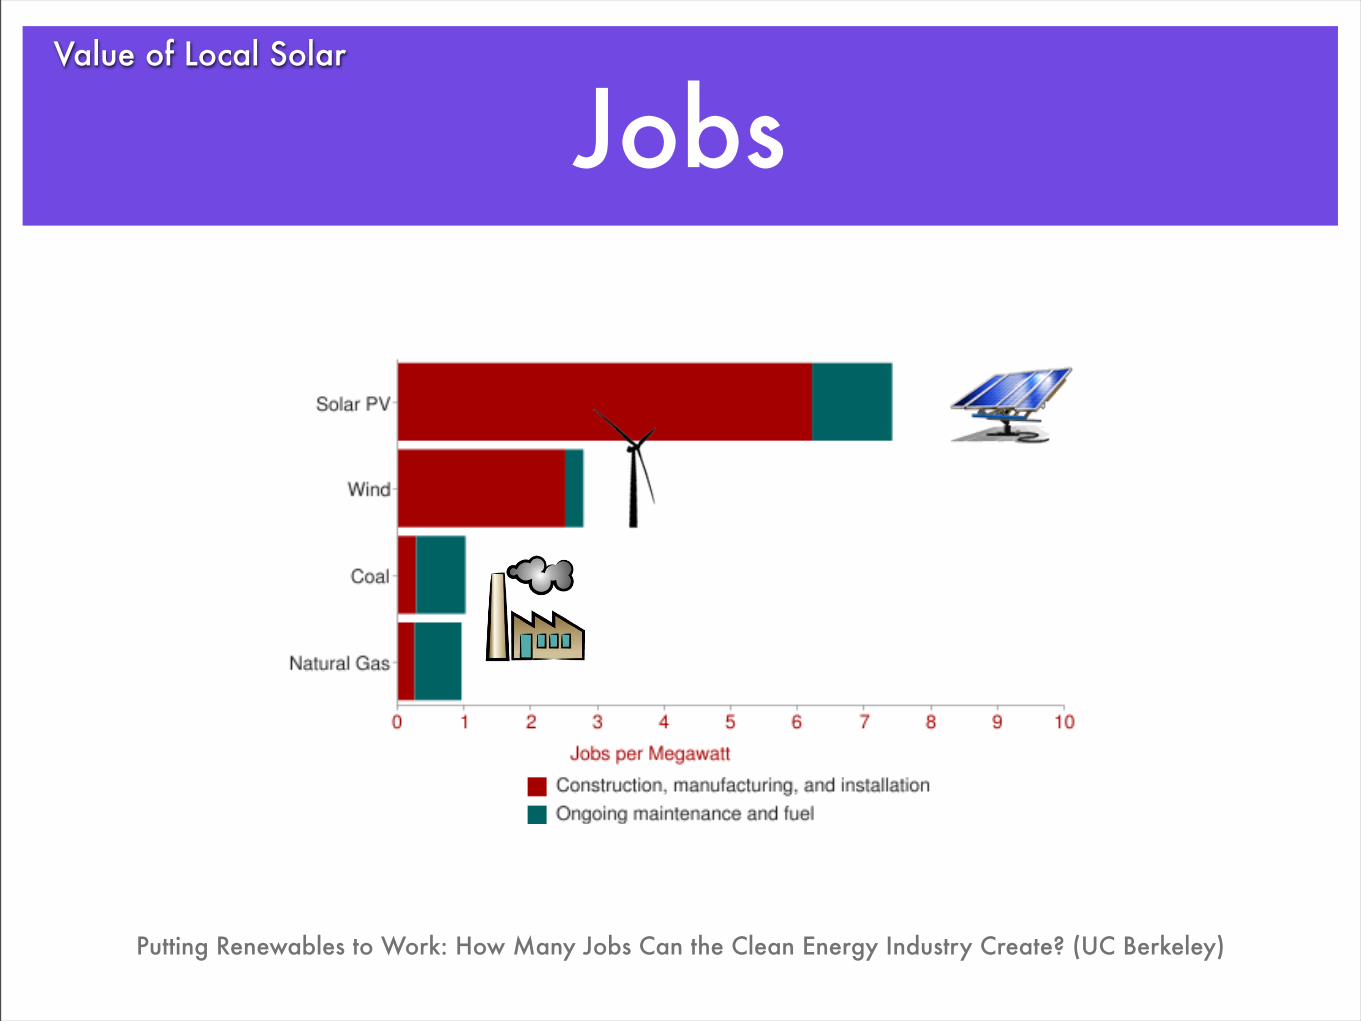
Jobs
Putting Renewables to Work: How Many Jobs Can the Clean Energy Industry Create? (UC Berkeley)
Value of Local Solar
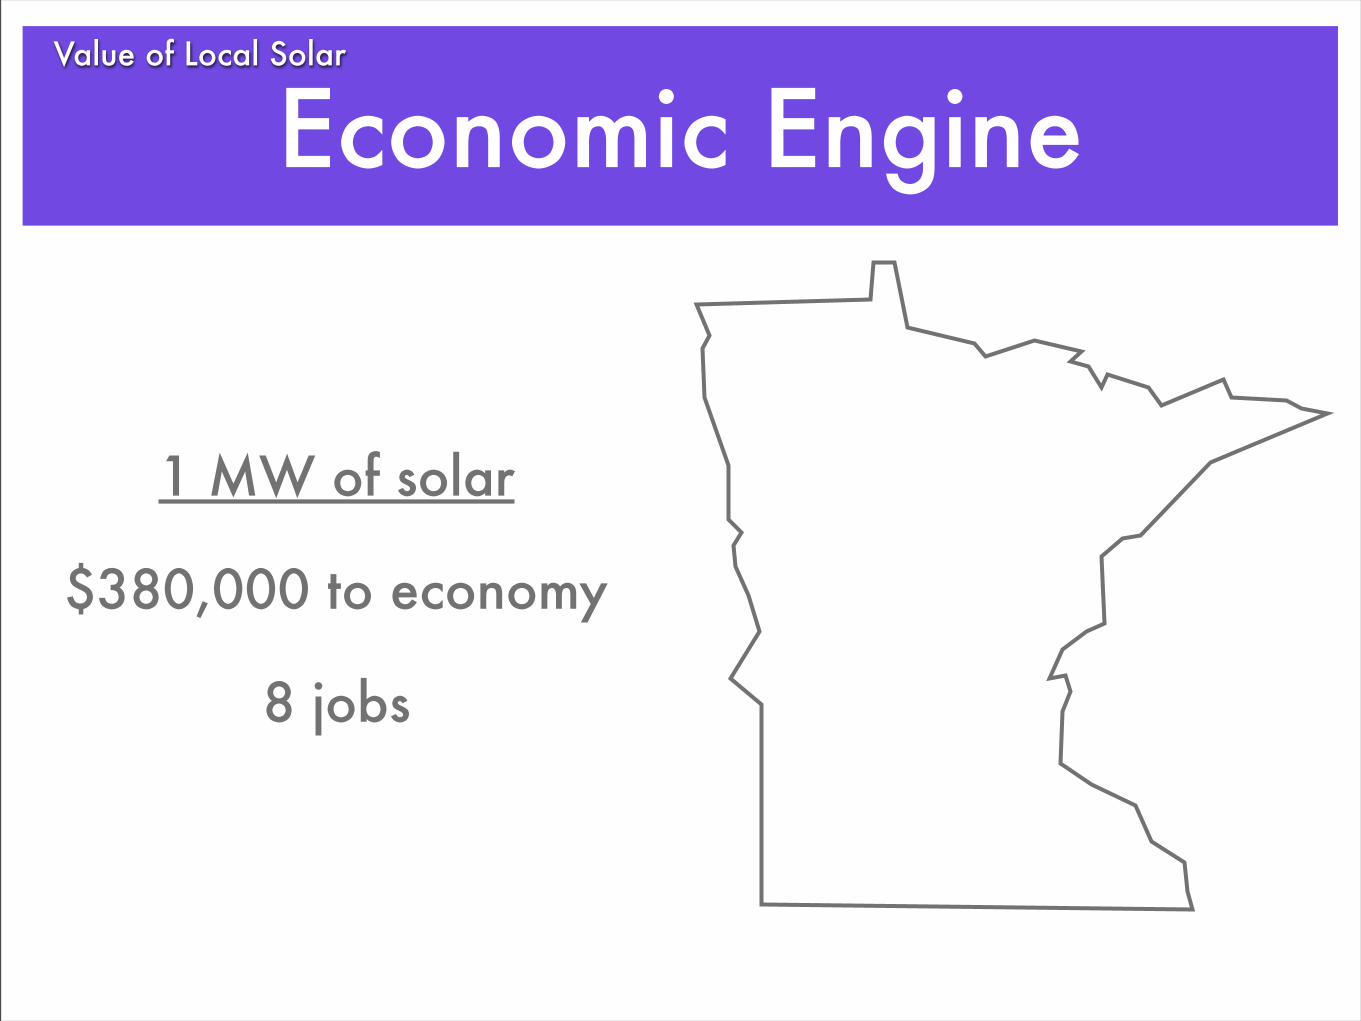
Economic Engine
$380,000 to economy
8 jobs
1 MW of solar
Value of Local Solar
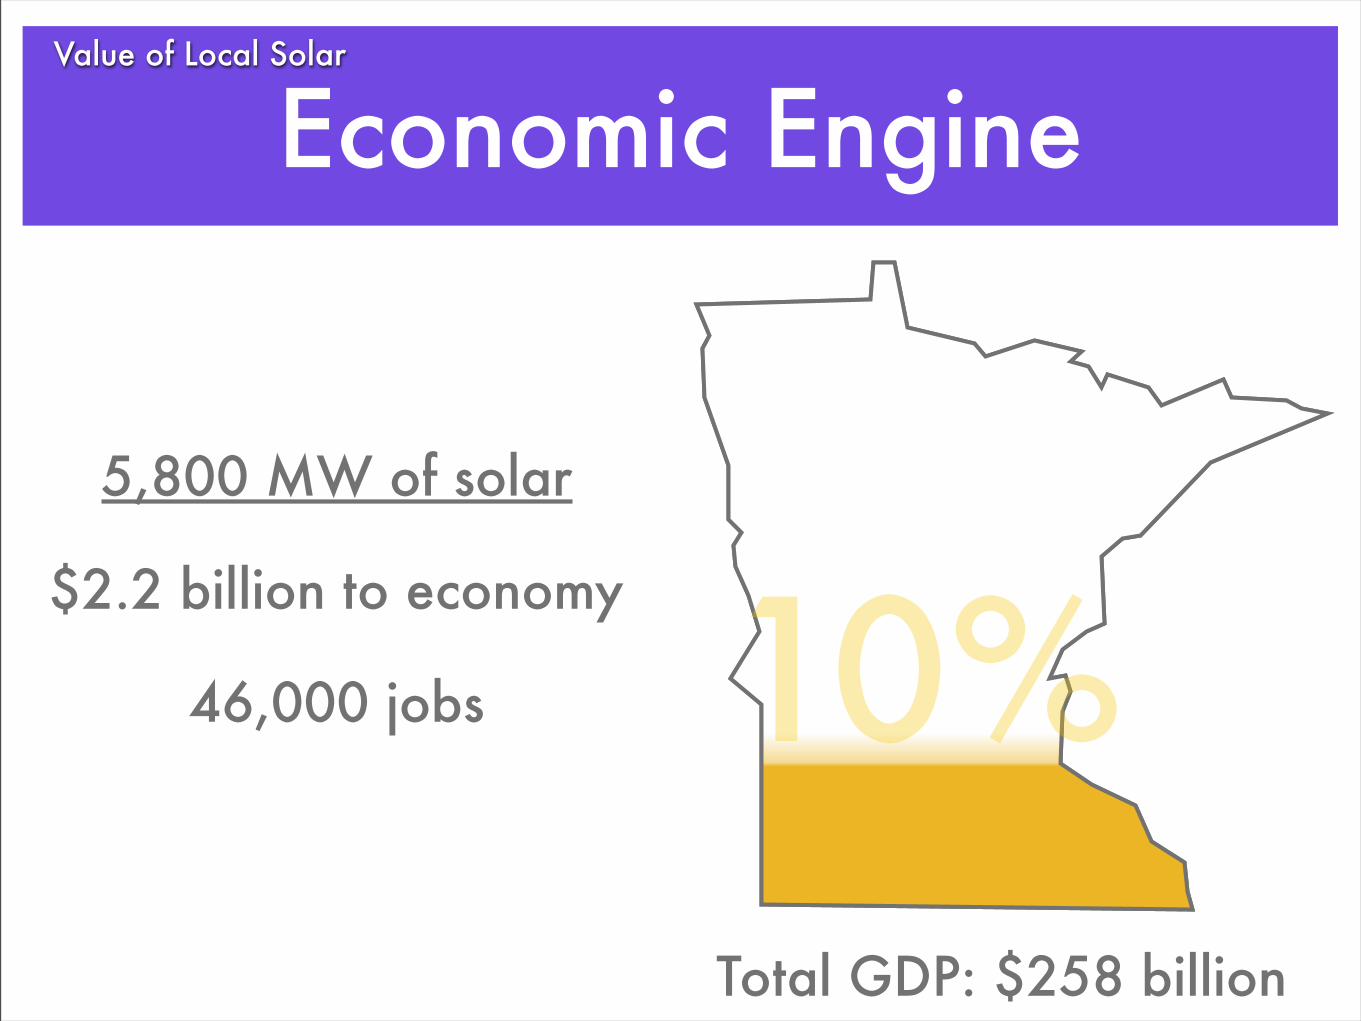
Economic Engine
Total GDP: $258 billion
$2.2 billion to economy
46,000 jobs
5,800 MW of solar
10%
Value of Local Solar
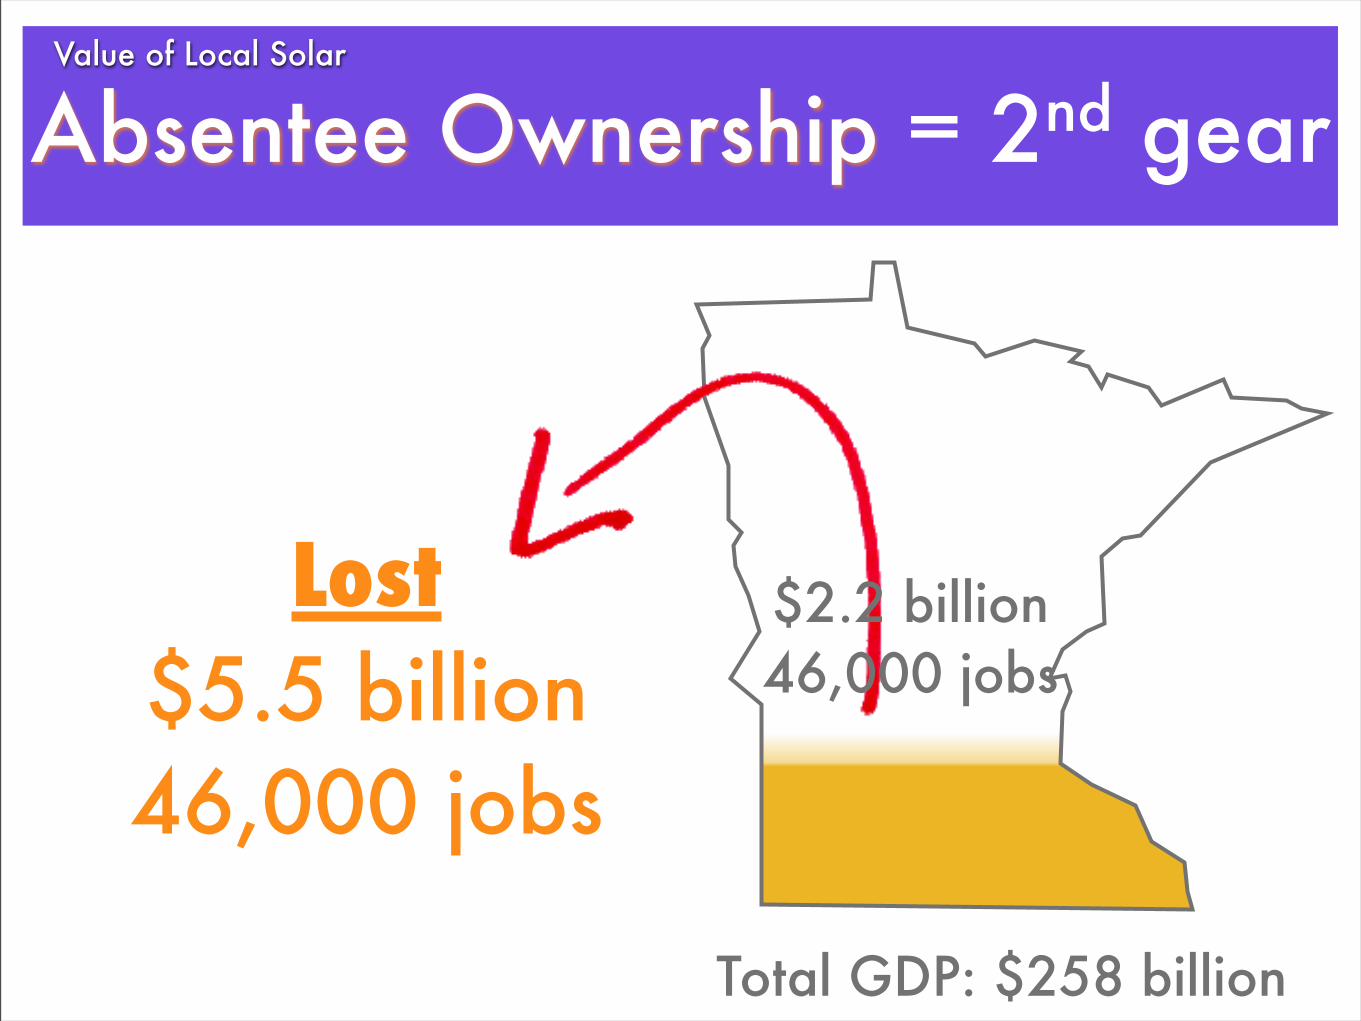
Absentee Ownership = 2nd gear
Lost $5.5 billion46,000 jobs
Total GDP: $258 billion
$2.2 billion46,000 jobs
Value of Local Solar
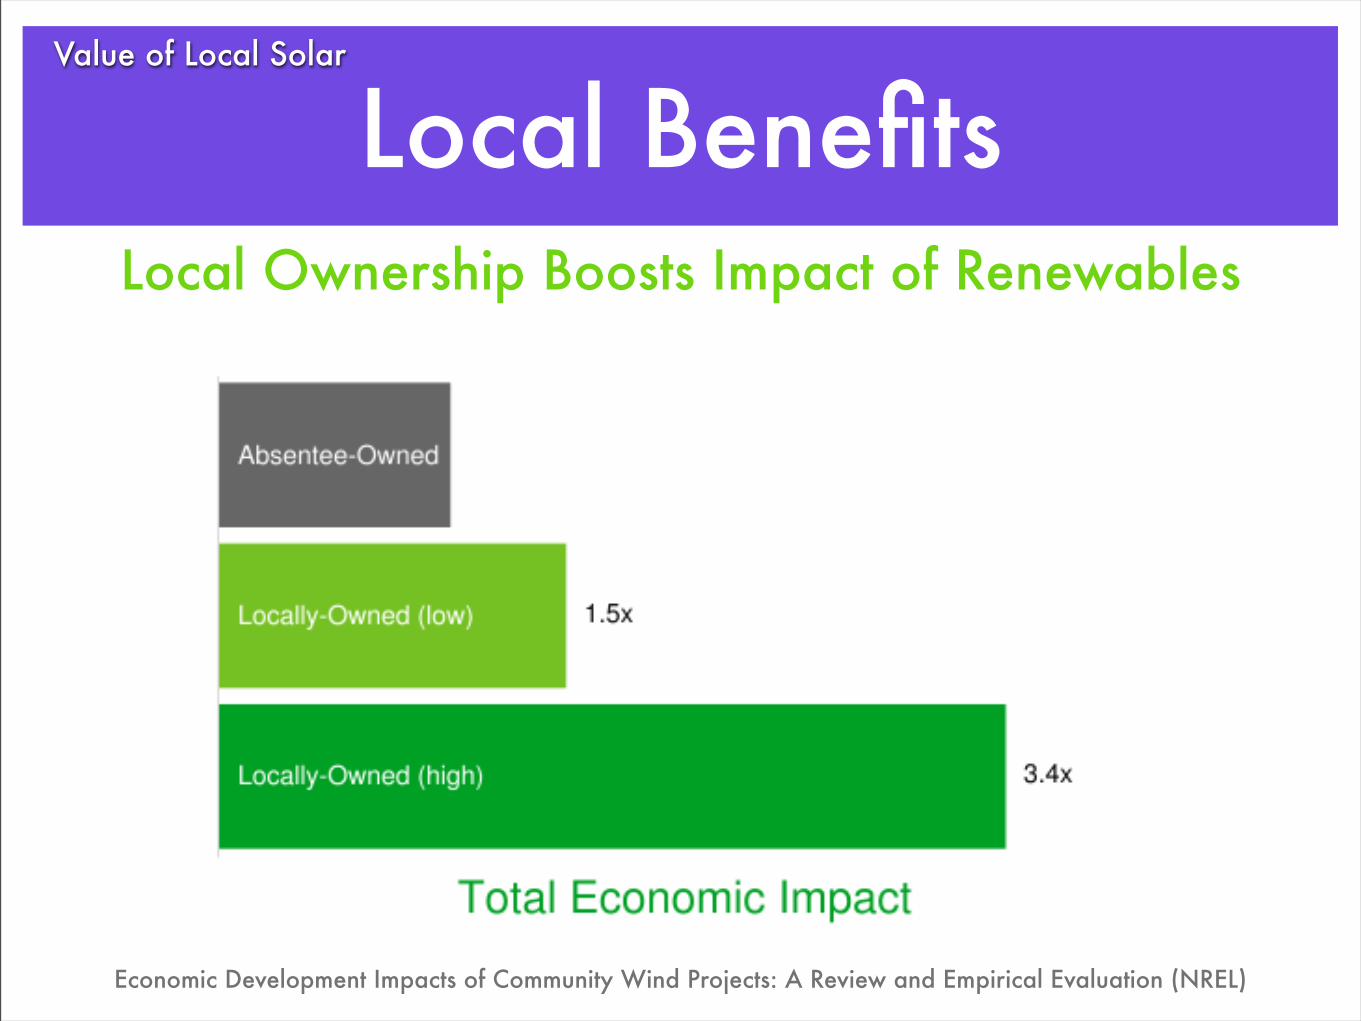
Local BenefitsLocal Ownership Boosts Impact of Renewables
Economic Development Impacts of Community Wind Projects: A Review and Empirical Evaluation (NREL)
Value of Local Solar
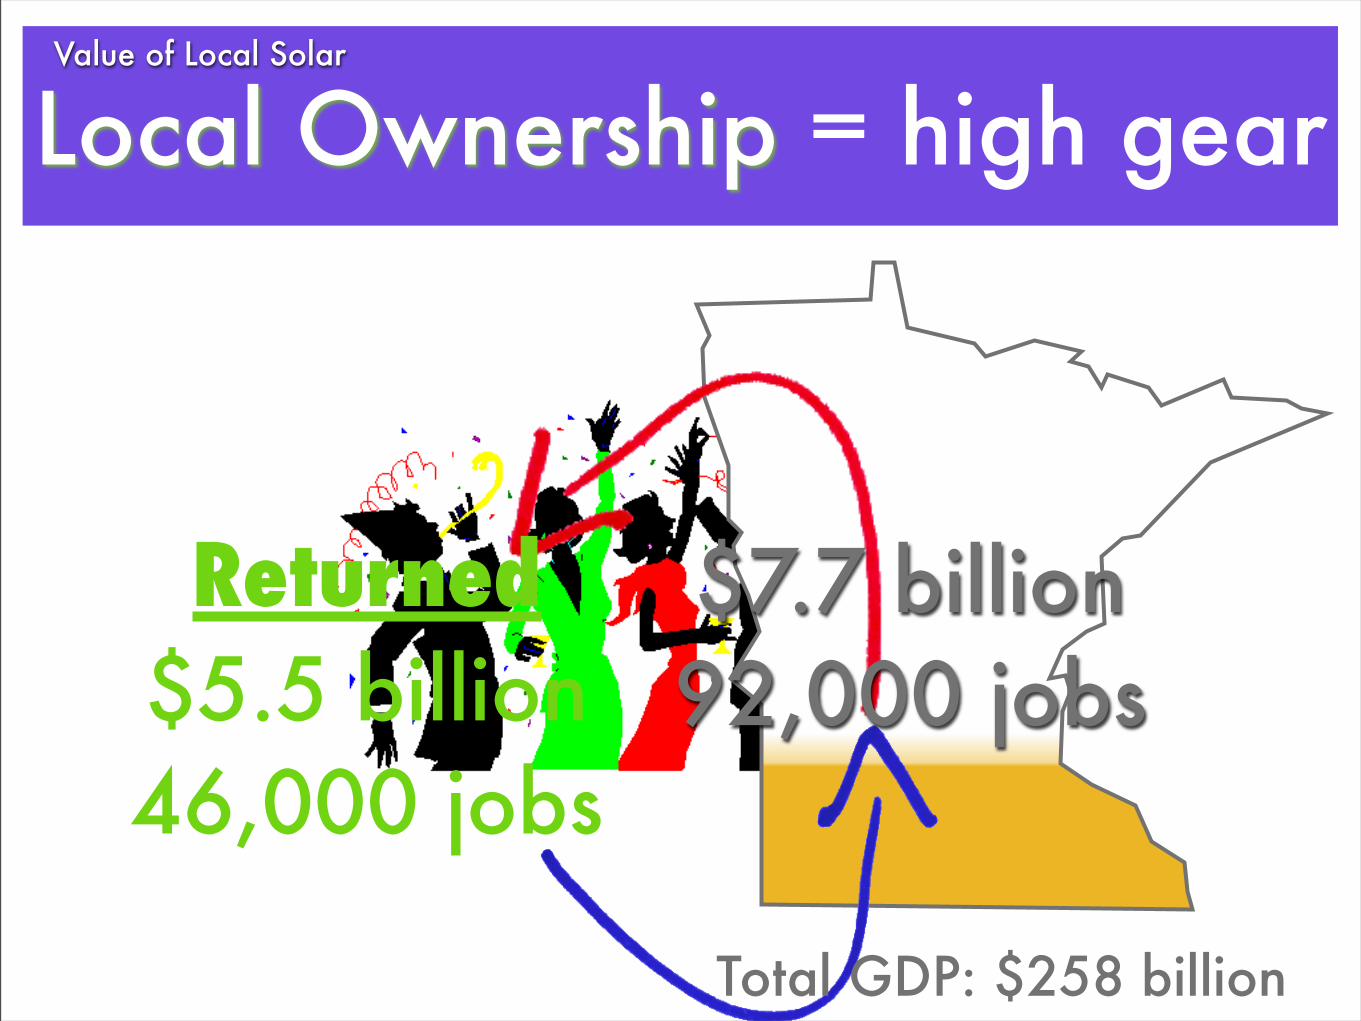
Local Ownership = high gear
Returned $5.5 billion46,000 jobs
Total GDP: $258 billion
$7.7 billion92,000 jobs
Value of Local Solar
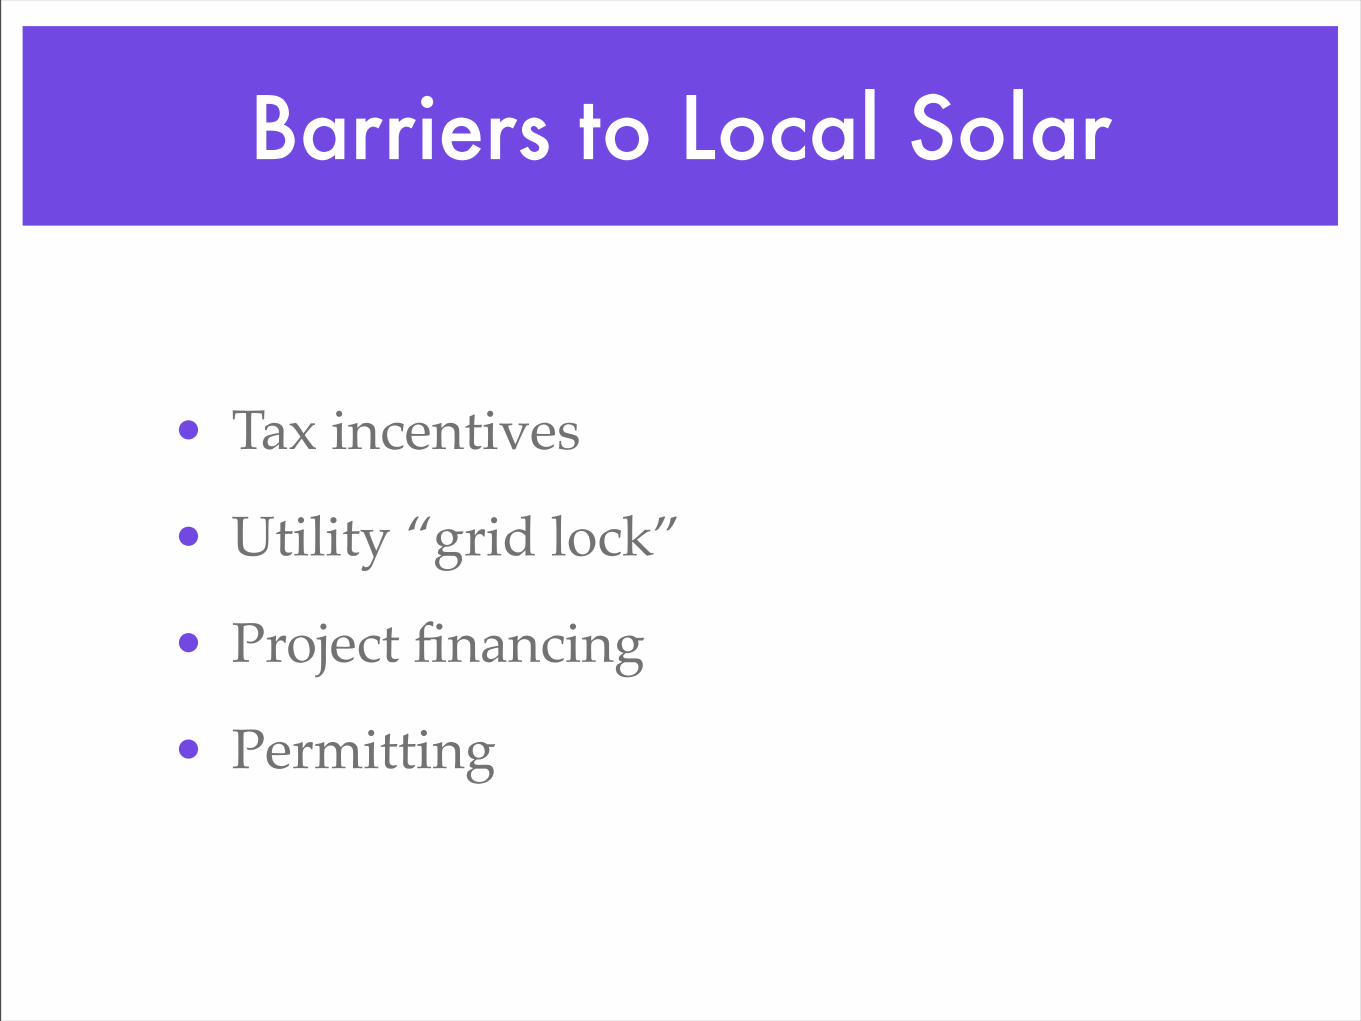
Barriers to Local Solar
• Tax incentives
• Utility “grid lock”
• Project financing
• Permitting
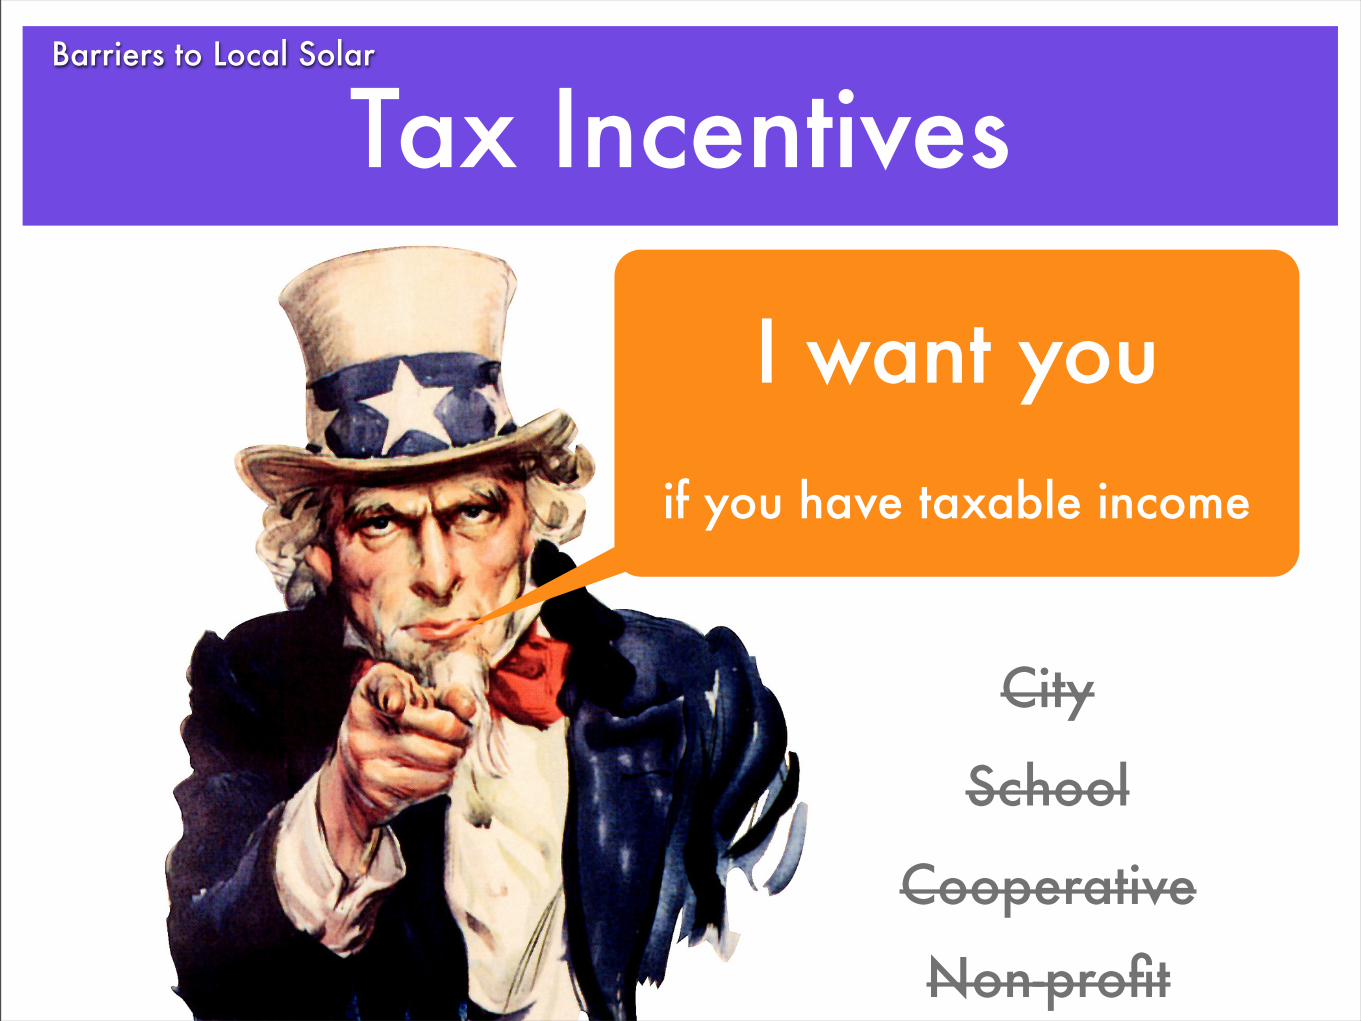
Tax IncentivesBarriers to Local Solar
I want youif you have taxable income
City
School
Cooperative
Non-profit

Utility “Grid Lock”Barriers to Local Solar
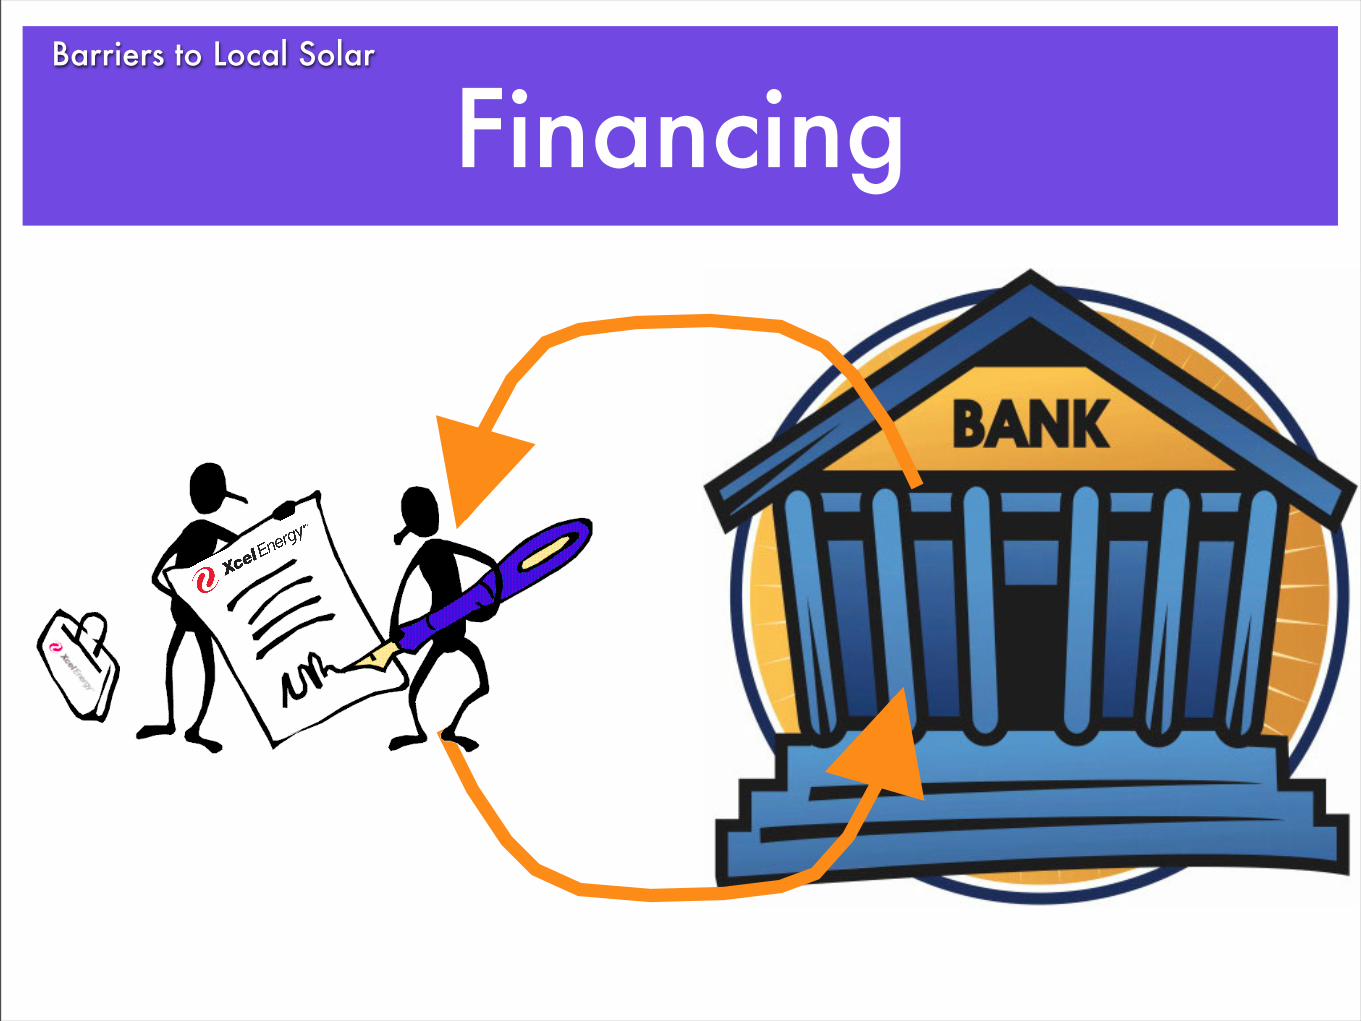
FinancingBarriers to Local Solar
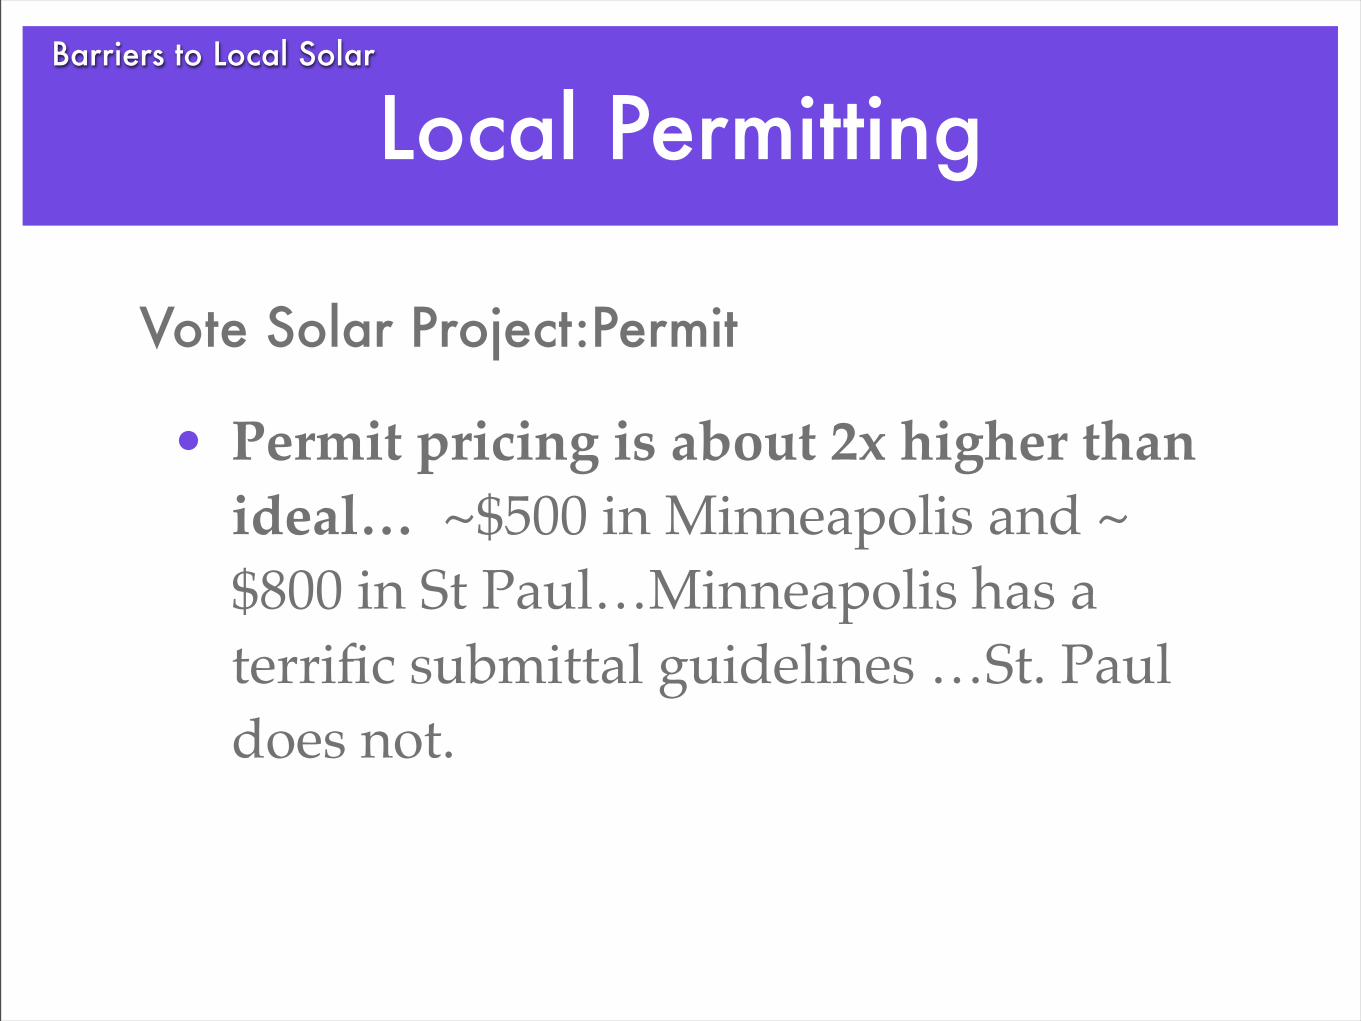
Local Permitting
• Permit pricing is about 2x higher than ideal… ~$500 in Minneapolis and ~$800 in St Paul…Minneapolis has a terrific submittal guidelines …St. Paul does not.
Vote Solar Project:Permit
Barriers to Local Solar
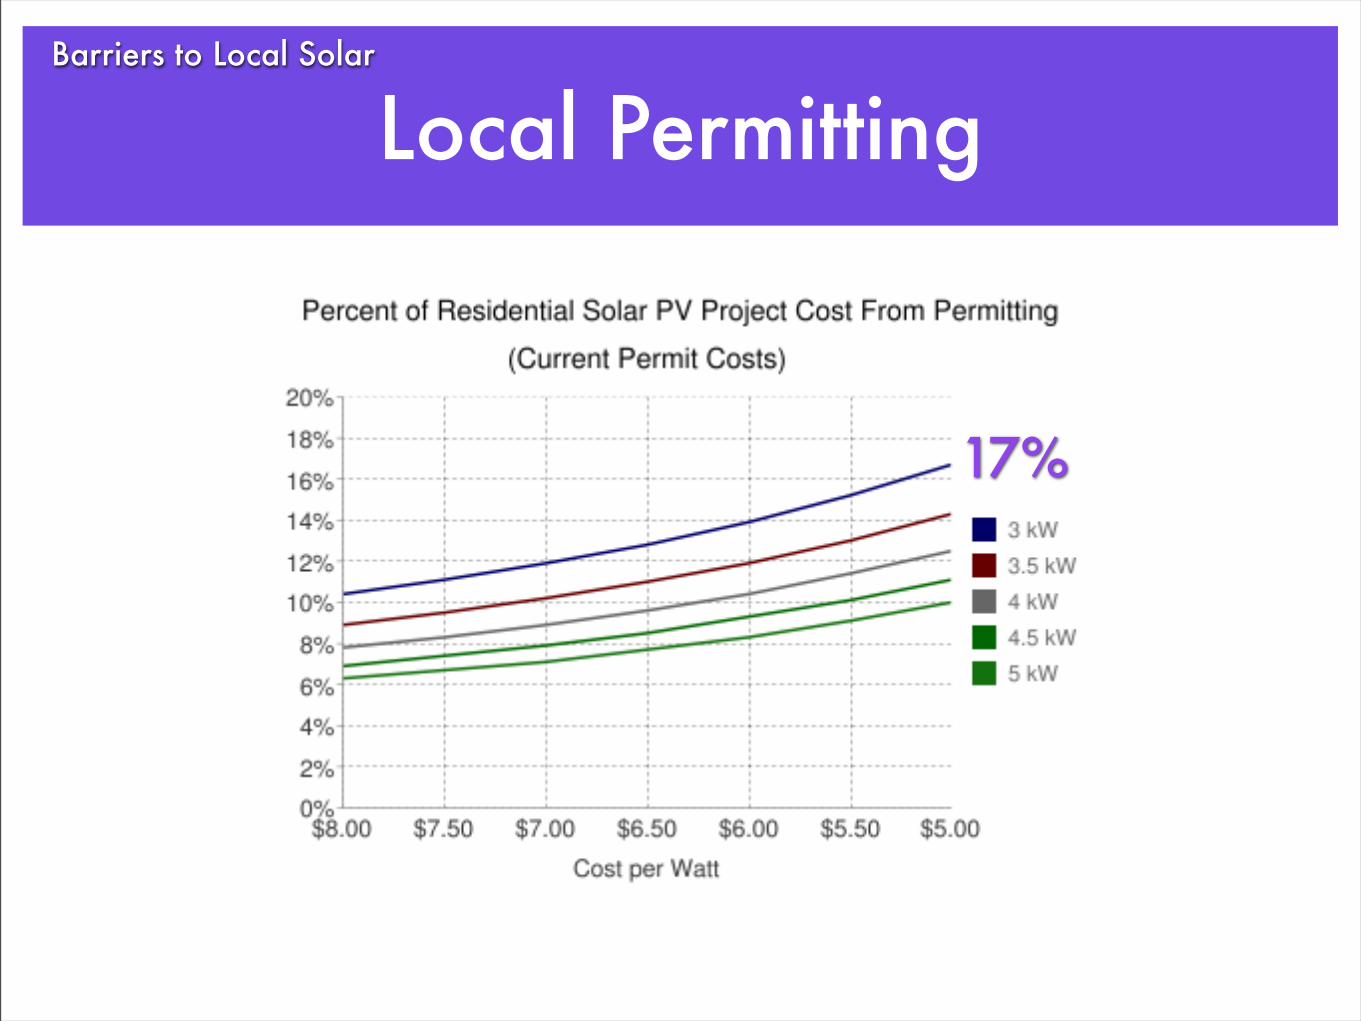
Local Permitting
17%
Barriers to Local Solar

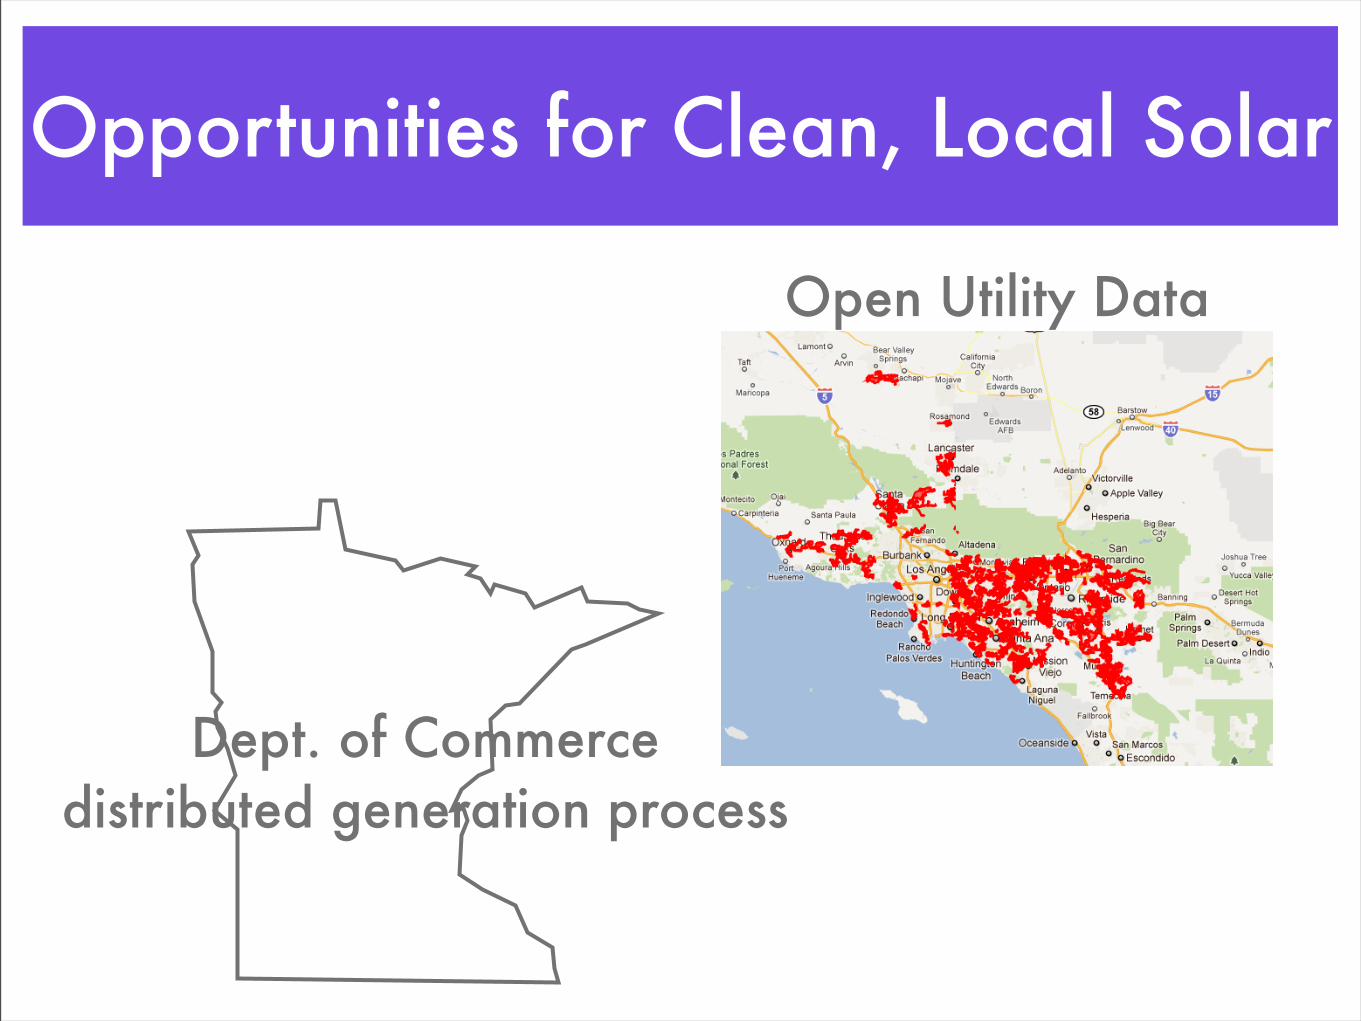
Opportunities for Clean, Local Solar
Cash Incentives
Opportunities for Clean, Local Solar
Open Utility Data
Dept. of Commerce distributed generation process

Opportunities for Clean, Local Solar
CLEAN Contracts
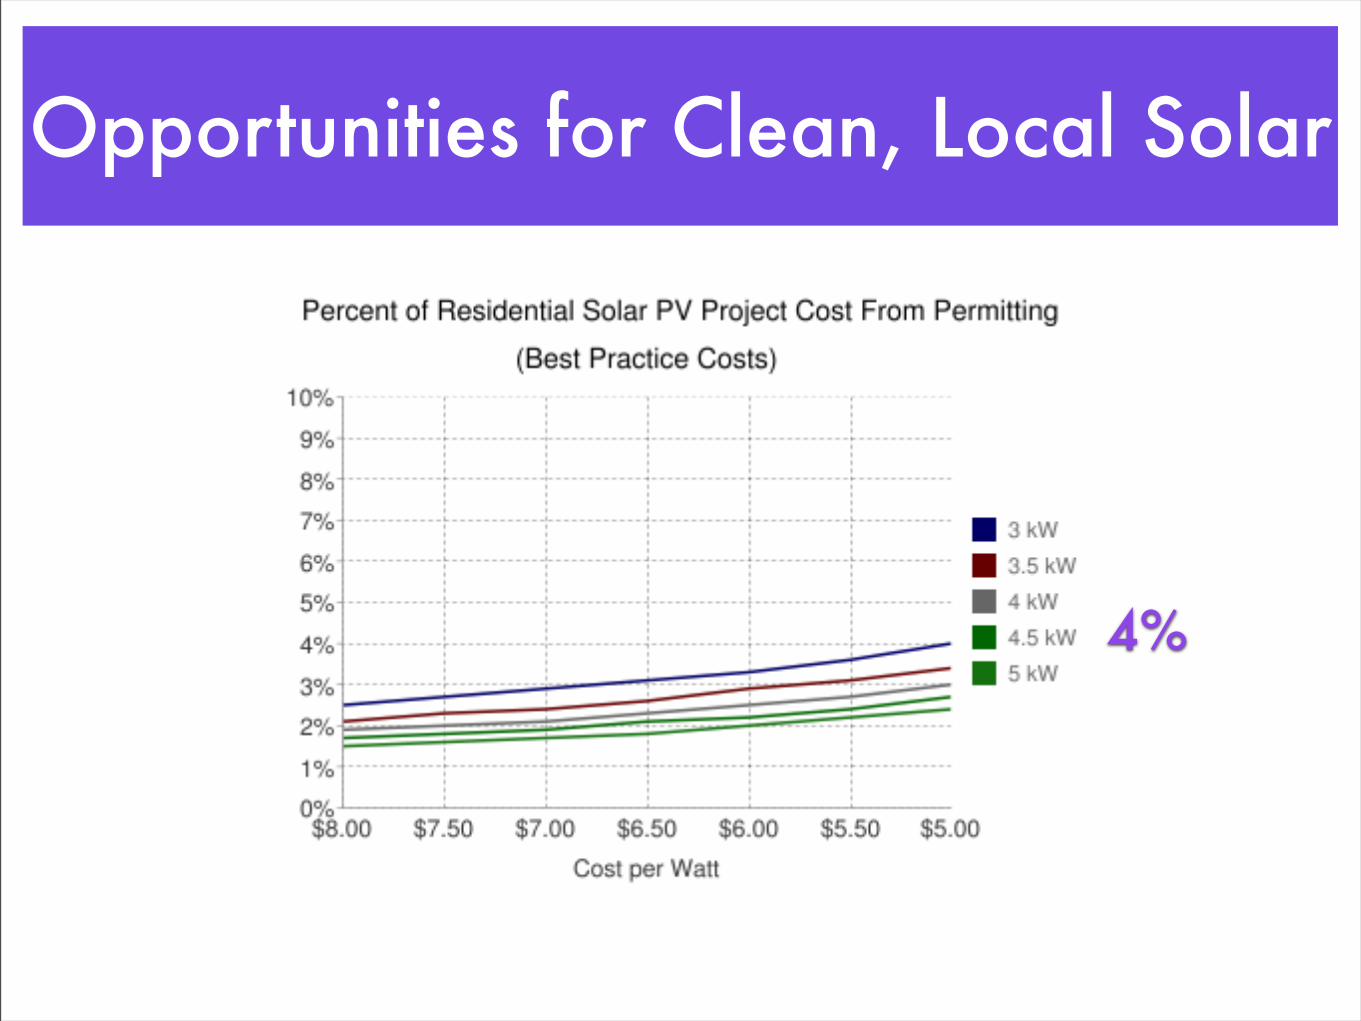
Opportunities for Clean, Local Solar
4%

Thank you!
John Farrellenergyselfreliantstates.orgjfarrell@ilsr.orgjohnffarrell612-276-3456 x210


![Minnesota Power – Energy & Engineeringsburns/EE1001Fall2012/UMD_EE_1001_9-27-12[1]Re… · Minnesota Power – Energy & Engineering. Introduction to technical aspects of renewable](https://img.pdfslide.us/doc/110x75/5b035d4a7f8b9a4e538c38b5/minnesota-power-energy-engineering-sburnsee1001fall2012umdee10019-27-121reminnesota.jpg)