Embed Size (px)
DESCRIPTION
This report examines the battle for the digital living room with an emphasis on the growth of connected devices in consumers’ homes and the impact this will have on the media industry.
Citation preview

February 2012
By: Michael Goodman
Nexus Research Group has published this content for the sole use of Nexus Research Group and its clients. It may
not be duplicated, reproduced or retransmitted in whole or in part without the express permission of Nexus Research
Group. All rights reserved. All opinions and estimates herein constitute Nexus Research Group’s judgment as of this
date and are subject to change without notice.
© Copyright 2012. Nexus Research Group. All rights reserved.
The Connected Home: Battle for
Dominance in the Digital Livingroom
Executive Summary
As a result of the proliferation of broadband and connected devices and increased availability of
movies and TV shows online, Over-the-Top Video (OTT) is poised to change the way consumers
watch television and movies and along the way reshape the media industry (see Exhibit 1). While
the TV will remain the dominate screen in consumers homes, connected TVs, game consoles,
media players, and Blu-ray players offer consumers alternative methods for accessing the
content they want.
Coaxial Cable/ Fiber/Satellite
Legacy Multi-Channel Video Providers
(e.g., Cable ,Satellite, Telco)
Multi-Channel Video
Broadband
Over-the-Top Video Delivery (e.g., Netflix, Hulu, Vudu,
HBO Go, iTunes, PlayStation Store, Xbox Live)
Exhibit 1
OTT Video is Poised to Reshape the Video Landscape Source: Nexus Research Group, 2012
Nexus Research Group Report

The Connected Home: Battle for Dominance in the Digital Livingroom February 2012
2
© Copyright 2012. Nexus Research Group. All rights reserved.
In 2011, the global installed base of in-home connected devices was approximately 319 million,
enabling content owners, either directly or through aggregators, such as Netflix, Hulu, Voddler,
and LOVEFiLM, to reach consumers via unmanaged network (e.g., broadband). By 2016, Nexus
Research Group anticipates this growing to 1.5 billion devices.
While the growth of connected devices and OTT video will meet consumer demand and create
new revenue streams it will simultaniously put hundreds of billions of dollars in subscriber fees
that multi-channel video providers pay to programmers at risk from canabiliazation.
This Report will examine the the battle for the digital living room with an emphasis on the
growth of connected devices in consumers’ homes and the impact this will have on the media
industry.

The Connected Home: Battle for Dominance in the Digital Livingroom February 2012
3
© Copyright 2012. Nexus Research Group. All rights reserved.
Table of Contents I. Introduction .......................................................................................................................................... 4
II. Changing Viewing Behaviors ............................................................................................................... 6
Will Blu-ray Match DVDs Success? ................................................................................................... 10
The Growth of Online Video ............................................................................................................... 11
III. In-Home Connected Device Forecast ................................................................................................. 13
Device Forecast .................................................................................................................................. 13
Regional Forecast ............................................................................................................................... 16
VI. Conclusions and Recommendations ................................................................................................... 19
Conclusions ......................................................................................................................................... 19
Recommendations for CE Manufacturers ........................................................................................... 20
Recommendations for Internet Video Providers ................................................................................. 21
Recommendations for Pay-TV Providers ............................................................................................ 21

The Connected Home: Battle for Dominance in the Digital Livingroom February 2012
4
© Copyright 2012. Nexus Research Group. All rights reserved.
I. Introduction
Despite growing competition from broadband and mobile over the past decade, the television
continues to be the dominate platform for video consumption, accounting for 83% of consumers
screen time in 2011 according to the Nielsen Company (see Exhibit 1). On average, persons 2+ in US
TV Households watched 32 hours and 47 minutes of traditional TV per week in 2011. In comparison,
persons 2+ who watched internet video viewed an average of 3 hours and 58 minutes per week and
among those who watched mobile video viewed 7 minutes per week in 2011.
Traditional TV, 32:47
Watching Time Shifted TV,
2:21
Using the Internet on a
computer, 3:58
Watching Internet Video
0.27
Watching Mobile Video0.07
HH:MM
* TV in the home includes Live usage plus any playback viewing within the measurement period. Time shifted TV is
playback primarily on a DVR but includes playback from VOD, DVD recorders, server based DVR’s and services
like Start Over
** The mobile video audience figures in this report include mobile phone users who access mobile video through any
means (including mobile Web, subscription-based, downloads and applications
Not only is television the dominate viewing platform, but television viewing continues to grow
across all demographic groups (see Exhibit 2). Over the past decade, average time spent watching TV
among persons 2+ in the US has grown at a compound annual growth rate (CAGR) of 1.38%, with
women 18+ watching more TV than any other demographic group.
Nor is this trend unique to the US. Across the globe consumers are watching more TV. According to
the Broadcasters' Audience Research Board (BARB) in the United Kingdom the average TV viewer
watched 18 hours and 9 minutes of commercial linear TV a week during the first six months of 2011,
an increase of 48 minutes a week, or seven minutes a day year-over-year (YoY). During the first six
months of 2011 commercial TV accounted for 64% of viewing in the UK, up from 62% YoY.
Exhibit 1
Weekly Time Spent Watching Video in Hours and Minutes by Person 2+ Source: The Nielsen Company, 2012

The Connected Home: Battle for Dominance in the Digital Livingroom February 2012
5
© Copyright 2012. Nexus Research Group. All rights reserved.
According to ThinkTV.com (a marketing initiative of Free TV Australia), in metro areas in Australia,
television viewing is up 1.3% over the past six years to 3 hours and 11 minutes a day.
2:30
3:00
3:30
4:00
4:30
5:00
5:30
1999 2000 2001 2002 2003 2004 2005 2006 2007 2008 2009
Ho
urs
a D
ay
Time Spent per Day Watching TV in U.S. 1999 – 2009
Men Women Teens Children
The continued strength of television as a viewing platform is a result of several factors.
Programming. While individual channels may struggle to attract viewers (as exemplified by
the decline of the broadcast networks), broadcast and cable networks overall are producing
programming that consumers want to see. In particular, cable networks are now producing
original programming whose quality rivals that once seen only on the broadcast networks.
Windowing. We don’t often think of television as having release windows the way that
movies do, but in reality it does. To minimize cannibalization and to protect their cash cows,
programmers first air programs on their linear channels, then release them to secondary
channels such as video-on-demand, online, and mobile after a 2 - 8 day delay. As a result, the
majority of viewing occurs during the initial airing with secondary channels providing
incremental viewing opportunities.
Exhibit 2
Average Time Spent per Day Watching TV (1999 – 2009) Source: The Nielsen Company, 2012

The Connected Home: Battle for Dominance in the Digital Livingroom February 2012
6
© Copyright 2012. Nexus Research Group. All rights reserved.
The television set. Sitting in the comfort of one’s living room, family room or bedroom
watching a large screen HDTV easily trumps the experience of watching video on a PC,
tablet or smartphone.
While broadband and mobile might not be cannibalizing television, these and other emerging video
platforms are changing how consumers use their TV.
II. Changing Viewing Behaviors
To understand how television viewing is changing, you have to start with an understanding of how
pervasive technology is impacting the television ecosystem. At its most basic level, the video
ecosystem is comprised of three primary components (see Exhibit 3).
Distribution
(Broadband, 3G/4G, Cable,
IPTV, Satellite, Retail)
Device Manufacturers
(TVs, STBs, Video Game Consoles,
Smartphones, Blu-ray Players)
Content Providers
(Cable & Broadcast Networks, Movie
& TV Studios, Internet Video
Providers)
Consumers
Content Providers. Content includes movies and TV shows produced by studios and airing
on broadcast and cable networks. Much of this content is also available via the Internet on
PCs, smartphones and tablets.
Distribution. Distribution is defined as how viewers access content. Over-the-air broadcast
networks dominated distribution until the late 70s and early 80s when cable and satellite
began to fragment the market. Today, the Internet and mobile networks provide alternative
Exhibit 3
Historical Video Distribution Value Chain Source: Nexus Research Group, 2012

The Connected Home: Battle for Dominance in the Digital Livingroom February 2012
7
© Copyright 2012. Nexus Research Group. All rights reserved.
means for consumers to access movies and TV shows. Though in decline, brick-n-mortar
retail (e.g., sell-through) remains a significant distribution channel for movies and TV shows.
Device Manufacturers. Finally, viewers require some kind of device to watch video. In the
past, this has been the TV but today alternatives such as PCs, smartphones and tablets have
emerged.
These three components must operate in harmony, otherwise the whole ecosystem will collapse.
However, despite their need for each other content providers have historically dominated the
marketplace with their ability to determine how, when, and where consumers can access content. The
internet (broadband and mobile) however has dramatically altered this relationship.
Initially, studios and broadcast and cable networks (which have historically been slow to embrace
technological innovation under the best of circumstances) balked at digital distribution fear of
damaging their existing business models. Nature, however, abhors a vacuum. Since studios and
broadcast and cable networks would not legally provide consumers with movies and TV shows
online, consumers took matters into their own hands.
Driven by the growth of PC computing power, increased storage capacity on PCs, broadband
penetration, software to copy movies and TV shows, and peer-to-peer networks (P2P) such as
Napster, LimeWire, and Bit Torrent to distribute them internet users rapidly embracing digital
distribution. As a result, piracy become a significant problem.
According Havoscope Black Markets (an online database of black market activities) movie piracy
accounted for $33.18 billion in lost revenue among the top 20 countries with the US accounting for
the vast majority ($25 billion) of that lost revenue (see exhibit 4). In addition, the biggest culprits are
industrialized nations with high PC and broadband penetration. Consumers in these countries have
sufficient income to afford to purchase movies and TV shows but rather than meet this demand
studios and broadcast and cable networks choose to stonewall consumers, forcing them to turn to
alternative (illegal) means of acquiring the content they want.
Exhibit 4
Top 20 Movie Piracy by Country
Source: Havocscope.com, 2012
Rank Country Lost Revenue Due to Piracy
1 United States $25 Billion
2 Australia $1.3 Billion
3 South Korea $1 Billion
4 India $959 Million
5 UK $818 Million

The Connected Home: Battle for Dominance in the Digital Livingroom February 2012
8
© Copyright 2012. Nexus Research Group. All rights reserved.
5 Japan $658 Million
7 China $565 Million
8 Mexico $483 Million
9 Thailand $324 Million
10 France $322 Million
11 Argentina $318 Million
12 Russia $266 Million
13 Spain $253 Million
14 Italy $161 Million
15 Germany $157 Million
16 Canada $118 Million
17 Laos $102 Million
18 Hungary $102 Million
19 Poland $102 Million
20 Brazil $101 Million
As evidenced by distribution agreements with Netflix, Hulu, Vudu (Walmart), Amazon Instant
Video, LOVEFilm, Microsoft Xbox Live and Sony PlayStation Store, content providers have gotten
the message and are now offering movies and TV shows online the way consumers want them but
despite these efforts, the damage has been done.
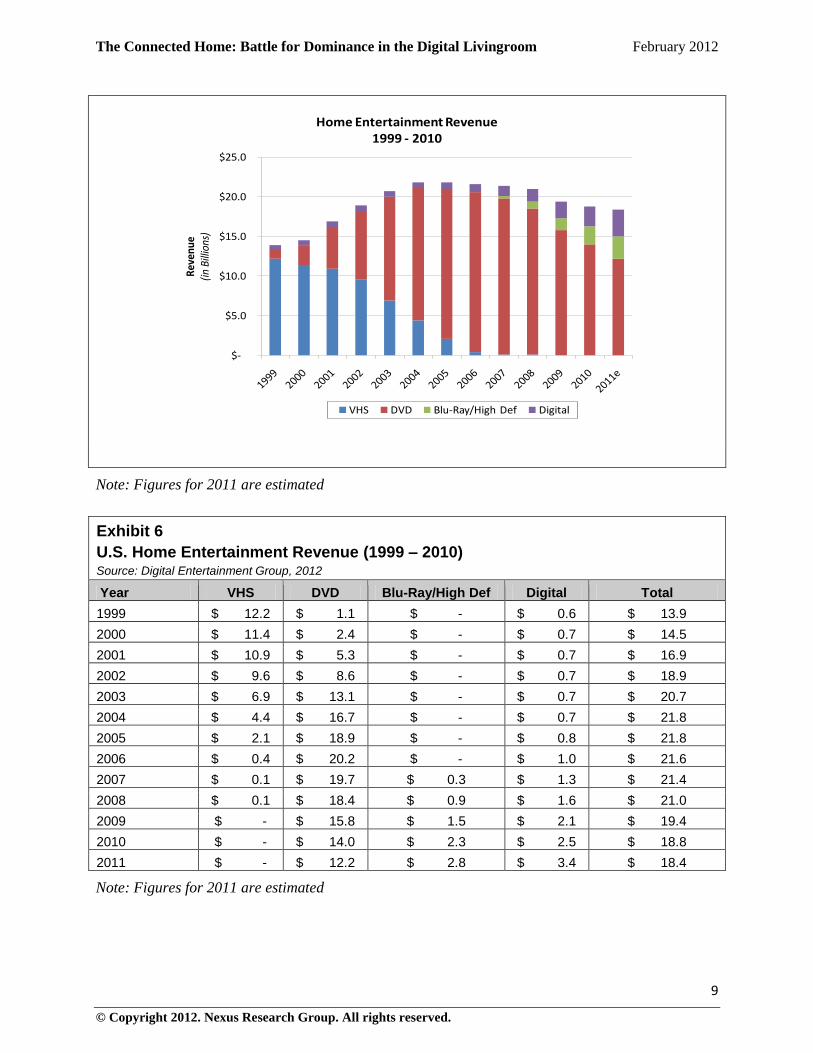
According to the Digital Entertainment Group (DEG), the home entertainment market (brick-n-
mortar and electronic rental and sell-through of movies & TV shows) in the US peaked in 2004 with
revenues of $21.8 billion. Since then revenue have been slowly spiraling downward. Over the past 6
years, overall home entertainment revenue has fallen 16%, from $21.8 billion in 2004 to $18.8 billion
in 2010 (see Exhibits 5 and 6).
In particular, DVD revenue (rental and sell-through), which comprised 74% of home entertainment
revenue in the US in 2010, has been hard hit. Over the past 4 years, DVD revenue has fallen 44% in
the US, from a high of $20.2 billion in 2006 to $14 billion in 2010 and neither Blu-ray nor digital
revenue have been sufficient to offset this decline.
Exhibit 5
U.S. Home Entertainment Revenue (1999 – 2010) Source: Digital Entertainment Group, 2012
The Connected Home: Battle for Dominance in the Digital Livingroom February 2012
9
© Copyright 2012. Nexus Research Group. All rights reserved.
$-
$5.0
$10.0
$15.0
$20.0
$25.0
Rev
enue
(in B
illio
ns)
Home Entertainment Revenue1999 - 2010
VHS DVD Blu-Ray/High Def Digital
Note: Figures for 2011 are estimated
Exhibit 6
U.S. Home Entertainment Revenue (1999 – 2010) Source: Digital Entertainment Group, 2012
Year VHS DVD Blu-Ray/High Def Digital Total
1999 $ 12.2 $ 1.1 $ - $ 0.6 $ 13.9
2000 $ 11.4 $ 2.4 $ - $ 0.7 $ 14.5
2001 $ 10.9 $ 5.3 $ - $ 0.7 $ 16.9
2002 $ 9.6 $ 8.6 $ - $ 0.7 $ 18.9
2003 $ 6.9 $ 13.1 $ - $ 0.7 $ 20.7
2004 $ 4.4 $ 16.7 $ - $ 0.7 $ 21.8
2005 $ 2.1 $ 18.9 $ - $ 0.8 $ 21.8
2006 $ 0.4 $ 20.2 $ - $ 1.0 $ 21.6
2007 $ 0.1 $ 19.7 $ 0.3 $ 1.3 $ 21.4
2008 $ 0.1 $ 18.4 $ 0.9 $ 1.6 $ 21.0
2009 $ - $ 15.8 $ 1.5 $ 2.1 $ 19.4
2010 $ - $ 14.0 $ 2.3 $ 2.5 $ 18.8
2011 $ - $ 12.2 $ 2.8 $ 3.4 $ 18.4
Note: Figures for 2011 are estimated

The Connected Home: Battle for Dominance in the Digital Livingroom February 2012
10
© Copyright 2012. Nexus Research Group. All rights reserved.
Will Blu-ray Match DVDs Success?
After winning a short but intense format war with HD DVD, Blu-ray is firmly entrenched as the next
video format for physical media but the question remains; will Blu-ray have a long and profitable run
similar to VHS and DVD or will digital distribution of video (streaming and downloading) prevent
Blu-ray from ever reaching its full potential.
Comparison of Blu-ray revenue (rental and sell-through) to DVD revenue at similar points in their
lifecycle shows that Blu-ray got off to a faster start than DVD but is not maintaining its momentum.
Driven by the rapid adoption of Blu-ray players (since launching in 2007, over 33 million households
in North America have acquired a Blu-ray player, with the Sony PlayStation 3 accounting for over
two-thirds of them). Compared to DVD, Blu-ray generated more rental and sell-through revenue each
of its first three years of existence than DVD did in a comparable period. Red flags, however, are
beginning to appear. In its fourth year Blu-ray fell slightly behind DVDs growth curve and in its fifth
year Blu-ray has fall nearly 50% behind DVDs growth curve (see Exhibit 7 & 8). So the question
remains; will Blu-ray have a significant place in the market long-term or will it be muscled out by
more popular digital video services?
$-
$5.0
$10.0
$15.0
$20.0
$25.0
Year 1
Year 2
Year 3
Year 4
Year 5
Year 6
Year 7
Year 8
Year 9
Year 10
Year 11
Year 12
U.S
. Re
ven
ue
(in
Bill
ion
s)
Revenue Growth by Year
DVD Blu-Ray/High Def Poly. (Blu-Ray/High Def)
Exhibit 7
Will Blu-Ray Match DVDs Success? Source: Digital Entertainment Group, 2012

The Connected Home: Battle for Dominance in the Digital Livingroom February 2012
11
© Copyright 2012. Nexus Research Group. All rights reserved.
Exhibit 8
U.S. Rental and Sell-Through Revenue by Year (in Billions) Source: Digital Entertainment Group, 2012
Year DVD Blu-Ray/High Def % Difference
Blu-ray vs. DVD
Year 1 $ 0.1 $ 0.3 200%
Year 2 $ 0.5 $ 0.9 80%
Year 3 $ 1.1 $ 1.5 36%
Year 4 $ 2.4 $ 2.3 -4%
Year 5 $ 5.3 $ 2.8 -47%
Year 6 $ 8.6 n/a n/a
Year 7 $ 13.1 n/a n/a
Year 8 $ 16.7 n/a n/a
Year 9 $ 18.9 n/a n/a
Year 10 $ 20.2 n/a n/a
Year 11 $ 19.7 n/a n/a
Year 12 $ 18.4 n/a n/a
The Growth of Online Video
Competition from digital distribution (rental, sell-through and subscription) is becoming increasingly
self-evident. Through the first half of the decade, digital video revenue (rental, sell-through and
subscription) in the U.S. was stagnate, generating around $700 million annually in revenue, with the
vast majority of this coming from cable Pay-Per-View.
The second half of the decade, however, has seen a dramatic increase in digital video revenue,
growing from $800 million in 2005 to $3.4 billion in 2011, a CAGR of 27.3% (see Exhibit 9).
Factors driving this growth include the following.
1. Continued improvement of internet and service provider infrastructure (bandwidth, storage
capacity, compression, security, etc) in order to deliver on-demand video to consumers.
2. A dramatic increase in the number of connected devices upon which to view video.
3. TV and movie studios coming to grips with the need for digital distribution and acquiring the
necessary rights.
4. More services (such as Netflix, Hulu, HBO Go, Crackle, and LOVEFiLM) bringing video
into consumers’ homes via the internet.
Much of the growth in digital video revenue is attributable to a paradigm shift in online video from
free user generated video to premium video. Prior to 2009, user-generated video, primarily on
YouTube, drove online video consumption; however, this generated little revenue. During this
period, the internet was as an occasionally viewed medium for peripheral, low quality video and
pirated video.

The Connected Home: Battle for Dominance in the Digital Livingroom February 2012
12
© Copyright 2012. Nexus Research Group. All rights reserved.
2
$0.6
$0.7
$0.7
$0.7
$0.7
$0.7
$0.8
$1.0
$1.3
$1.6
$2.1
$2.5
$3.4
$-
$0.5
$1.0
$1.5
$2.0
$2.5
$3.0
$3.5
$4.0
1999
2000
2001
2002
2003
2004
2005
2006
2007
2008
2009
2010
2011
Reve
nue
(in B
illio
ns)
U.S. Digital Video Revenue (1999 – 2011)
Digital Video
In 2009, however, we began to see TV and movie studios and broadcast and cable networks begin to
embrace the concept of Over-the-Top (OTT) broadcasting. According to comScore, viewing of long-
form TV content online more than doubled from 2009 to 2010. The number of videos viewed on
long-form TV programming sites such as Hulu, Netflix and broadcast and cable network websites
grew 104% YoY in 2010, while the number of videos viewed per viewer grew 75% during this time-
period. As a result, the internet has evolved into a regularly viewed medium for engaging, high
quality video.
Nexus Research Group defines Over-the-Top (OTT) Broadvasting as commercial video content
delivered over an open Internet connection with no monetization by traditional multichannel (pay-tv)
providers. For example, OTT providers such as Netflix and Hulu stream movies and TV shows over
the Internet, which for their purposes is an "unmanaged" network. This is in comparison to cable
operators, telecoms, and satellite providers that transmit programming over “managed” networks.
As internet users view more long-form TV content, the amount of time spent watching online video
is growing as well. According to comScore, between July 2010 and Sept 2011 the average minutes
viewed per unique user in the U.S. has grown 32%, from an average of 882 minutes in July 2010 to
1,168 in September 2011 (see Exhibit 10).
While short-form and user-generated sites continue to dominate in terms of total number of unique
viewers, long-form TV sites are making their presence felt, particularly in terms of revenue
generation.
Exhibit 9
Growth of Digital Video Revenue in the U.S. Source :Digital Entertainment Group, 2012

The Connected Home: Battle for Dominance in the Digital Livingroom February 2012
13
© Copyright 2012. Nexus Research Group. All rights reserved.
0
200
400
600
800
1,000
1,200
1,400
Jul-10
Aug-10
Sep-10
Oct-10
Nov-10
Dec-10
Jan-11
Feb-11
Mar-11
Apr-11
May-11
Jun-11
Jul-11
Aug-11
Sep-11A
vg. M
inut
es V
iew
ed p
er U
niqu
e U
ser
(in M
inut
es)
Avg. Minutes Viewed by Unique Viewer per Month in U.S.
Avg. Minutes Viewed per Viewer
According to Hulu CEO Jason Kilar, Hulu generated $420 million in revenue in 2011, up 69% YoY.
Driving this growth is a combination of advertising and subscription revenue, with Hulu Plus (Hulu’s
subscription service) ending 2011 with 1.5 million paying subscribers.
An important factor in this growth is the range of devices upon which Hulu Plus is available.
According to Hulu’s Kilar, Hulu Plus is now available on an aggregate install base of 200 million
devices, including game consoles, mobile phones, tablets and connected TVs as well as media
streamers.
III. In-Home Connected Device Forecast
Device Forecast
To get consumers to do more than “snack” on online videos, video providers must reach the
television. To bridge the gap between video providers and the TV a variety of in-home connected
devices exist, including connected TVs, video game consoles, connected media players, and Blu-ray
players.
In 2011, the global installed base of in-home connected devices was approximately 319 million,
enabling content owners, either directly or through aggregators, such as Netflix, Hulu, Voddler, and
Exhibit 10
Growth of Online Source: comScore, 2011

The Connected Home: Battle for Dominance in the Digital Livingroom February 2012
14
© Copyright 2012. Nexus Research Group. All rights reserved.
LOVEFiLM, to reach consumers via unmanaged network (e.g., broadband). By 2016, this will grow
to 1.5 billion devices (see exhibit 11 & 12).
0
200
400
600
800
1,000
1,200
1,400
1,600
2010 2011 2012 2013 2014 2015 2016
Glo
bal I
nsta
lled
Base
(in M
inut
es)
In-Home Connected Devices
(in Millions)
Connected TVs Blu-ray Players
Video Game Consoles Connected Media Players
Exhibit 12
By 2016 the Installed Base of In-Home Connected Devices will Reach 1.5 Billion Source: Nexus Research Group, 2012
Year Connected
TVs Blu-Ray Players Video Game
Consoles Connected
Media Players
Cumulative
Total
2010 62.2 23.1 84.1 2.0 171.3
2011 129.3 58.0 123.7 8.4 319.3
2012 207.7 107.2 162.3 15.7 493.0
2013 304.6 175.9 206.0 24.9 711.4
2014 427.0 255.9 250.1 36.0 969.0
2015 565.8 342.4 295.8 49.4 1,253.4
2016 724.4 432.7 339.7 64.6 1,561.4
Factors influencing the adoption of in-home connected devices include the following.
Exhibit 11
By 2016 the Installed Base of In-Home Connected Devices will Reach 1.5 Billion Source: Nexus Research Group, 2012

The Connected Home: Battle for Dominance in the Digital Livingroom February 2012
15
© Copyright 2012. Nexus Research Group. All rights reserved.
Number of TV households worldwide is growing. The number of TV households will grow
at an average annual rate of 2.7% over the next five years. With connectivity becoming a
basic feature on more flat panel TV this will drive adoption of internet-ready TVs.
Despite flat sales overall, connected TV share of overall TV sales is growing. In 2011,
connected TVs accounted for 38% of all TV sales in North America and 29% in Western
Europe. By 2016, Nexus Research Group anticipated connected TV accounting for 82% of
all TVs sold in North America and 67% in Western Europe.
Japan continues is a leading market for consumer electronics. According to the Japan
Electronics and Information Technology Industries Association, 11.8 million connected TV
were shipped in Japan is 2011, accounting for 59% of flat screen TVs shipped. In addition,
sales of Blu-ray players grew 33% YoY in Japan in 2011.
Subsidies push demand for flat panel TVs in Japan. Much of the recent demand for flat
panel TVs in Japan is a result of a government subsidy encouraging Japanese consumers to
purchase energy-efficient TVs, however, this program ended in mid 2011.
Connectivity has become a standard feature on Blu-ray players. Nearly all Blu-ray
players on the market today are internet-ready and through partnerships with internet video
providers such as Netflix, Crackle and LOVEFiLM are large library of TV shows and movies
are available on these devices. In fact, many consumers are now purchasing Blu-ray players
to access online content rather than watch Blu-ray disks.
Microsoft’s Xbox Live takes the first baby steps toward offering a differentiated video
service. Online video services such as Hulu, Netflix, Crackle, Voddler, and LOVEFiLM,
offer pretty much the same content as cable, satellite and Telco video providers, just on a
different box. This forces these providers to compete strictly on price. Microsoft’s Xbox
Live, in conjunction with ESPN, has taken to first steps to offering something different.
In addition to watching the same programming as offered on ESPN3, viewers can also watch
sporting events not available on the linear channel (such as FIFA beach soccer, rallycross
auto racing, and FIBA Euro Basketball), program the serviced to deliver clips of your
favorite teams(s), or replay nearly every college football game played on a given weekend.
Connected media player fail to gain significant traction. While connected media players
such as the Apple TV have gained favorable press, they have failed to impress consumers. As
a result, sales of these devices lag that of other in-home connected devices by a significant
margin.
In 2011, connected TVs were the most common in-home connected device in consumers’ homes,
accounting for 40% of the in-home connected devices installed base. Video game consoles followed
with 39% market share and then Blu-ray players with 18%. There are 1.4 billion TV households
globally, purchasing an average of 214 million TVs a year, many of which are internet-ready. In
2011, 34% of TVs sold were internet-ready. As connectivity increasingly becoming a basic feature
connected TVs share of total TV sales will grow to 71% by 2016. By 2016, connected TVs will

The Connected Home: Battle for Dominance in the Digital Livingroom February 2012
16
© Copyright 2012. Nexus Research Group. All rights reserved.
account for 46% of in-home connected devices installed base. Due to their steadily declining cost and
retailer bundling with HDTVs, Blu-ray players will supplant video game consoles as the second most
prominent in-home connected device. By 2016, Blu-ray players will account for 28% of the in-home
connected devices installed base.
While connected TVs and Blue-ray players market share will continue to grow that of video game
consoles will decline. By 2016, video game console in-home connected device share will be 22%.
Over the course of 2011 and 2012 annual video game console sales will decline, as the current
generation of consoles (PlayStation 3, Xbox 360 and Wii) get long in the tooth and consumer look
forward to a new generation of consoles (PlayStation 4, Xbox 720, Wii U). As a result of this new
generation of consoles, sales will begin growing again in 2013.
While this new generation of console will expand the market slightly for consoles, it will do little to
expand the installed base of in-home connected devices. While connected TVs and Blu-ray players
are replacing unconnected TVs and DVD players, the majority of next generation consoles will be
sold to homes that already own a PlayStation 3, Xbox 360 or Wii, and these are already connected
devices.
Regional Forecast
In 2011, North America accounted for 35% of the global installed base of in-home connected
devices. In comparison, Western Europe and the Asia-Pacific region each had a 27% share of the in-
home connected device installed base (see Exhibits 13 & 14). Driven by growing economies in China
and India, and a seemingly insatiable demand for consumer electronics in Japan and South Korea the
Asia Pacific regions share of in-home connected devices will grow to 31% in 2016, edging out North
America (30%) and Western Europe (26%).
Buoyed by an average annual growth rate of 19% and 17% respectively, connected TVs and Blu-ray
players will drive the growth of in-home connected devices in the Asia-Pacific region over the course
of this 5-year forecast. In particular, Internet-ready TVs will have a significant impact on in-home
connected device sales. In 2011, consumers in the Asia-Pacific region purchased nearly 87 million
TVs, of which 29 million were internet-ready. By 2016, consumers in the Asia-Pacific region will
purchase nearly 94 million TVs, of which 72% (68 million) will be internet-ready.
The split between connected TVs, Blu-ray players and video game consoles in North America and
Western Europe is more evenly split. In 2011, consumers in North America purchased nearly 19
million video game consoles, 13 million connected TVs and 11 million Blu-ray players. While the
ratio of sales of in-home connected devices will evolve over time they will remain within striking
distance of each other. In 2016, consumers in North America will purchase 30 million connected
TVs, 26 million Blu-ray players and 20 million video game consoles.
Western Europe will follow the pattern set by North America. In 2011, consumers in Western Europe
purchased nearly 14 million connected TVs and video game consoles respectively, and 6 million Blu-

The Connected Home: Battle for Dominance in the Digital Livingroom February 2012
17
© Copyright 2012. Nexus Research Group. All rights reserved.
ray players. In 2016, consumers in Western Europe will purchase 32 million connected TVs, 30
million Blu-ray players and 14 million video game consoles.
29% 27% 26% 26% 26% 26% 26%
37% 35% 34% 33% 31% 30% 30%
24% 27% 28% 29% 30% 30% 31%
10% 11% 12% 13% 13% 14% 14%
0%
10%
20%
30%
40%
50%
60%
70%
80%
90%
100%
2010 2011 2012 2013 2014 2015 2016
% S
har
e
Share of In-Home Connected Device Installed Base
North America Western Europe Asia Pacific All Other Countries
Exhibit 12
North America’s Share of the Connected Device Installed Base is Declining Source: Nexus Research Group, 2012
Year North
America Western Europe Asia-Pacific All Other Countries
Total
2010 63.9 49.5 41.1 16.8 171.3
2011 113.3 86.4 85.0 34.7 319.3
2012 167.3 129.6 138.1 58.0 493.0
2013 232.0 184.4 204.8 90.2 711.4
2014 303.6 250.1 287.1 128.1 969.0
2015 381.4 323.4 378.7 170.0 1,253.4
2016 465.0 404.5 477.8 214.0 1,561.4
Over the course of this five-year forecast, the Asia-Pacific region will see sales of in-home connected
devices grow by 43% annually, followed by Western Europe with a 36% annual growth and North
America a 33% annual growth. Regional factors influencing the adoption of in-home connected
devices include the following.
Exhibit 13
North America’s Share of the Connected Device Installed Base is Declining Source: Nexus Research Group, 2012

The Connected Home: Battle for Dominance in the Digital Livingroom February 2012
18
© Copyright 2012. Nexus Research Group. All rights reserved.
The Asia-Pacific region accounts for over half the world’s TV households. In 2011, the
Asia-Pacific region accounted for 54% of the world’s TV households and despite population
growth in South America, the Middle East and Africa will maintain this advantage for the
foreseeable future.
India is poised to become a significant market for connected TVs. The Indian
governments’ decision to switch off analog terrestrial signals and move to DVB-T2 digital
broadcast in 2015 will create a new market for connected TVs.
Emerging markets are showing strong growth, though still insufficient to offset weaker
demand in developed markets. Connected TV sales in Central and Eastern Europe, China
and the Middle East and Africa will have a compound annual growth rate (CAGR) of 32.1%,
22.3% and 15.7% respectively over the next five years.
Continued economic weakness in North America and Western Europe has weakened
demand for flat screen and connected TV. In 2011, overall TV sales decline 6.0% and
5.8% respectively in North America and Western Europe. Given the economic uncertainty in
these regions, Nexus Research Group expects YoY TV sales to remain relatively flat over the
course of the next several years.
Video game console sales are limited in the Asia Pacific region outside of Japan and
Australia. While Southeast Asia represents a significant market opportunity for CE
manufacturers, video game console sales are limited in this region due to rampant piracy and
the popularity of online games.

The Connected Home: Battle for Dominance in the Digital Livingroom February 2012
19
© Copyright 2012. Nexus Research Group. All rights reserved.
VI. Conclusions and Recommendations
Conclusions
TV sets, Blu-ray players, video game consoles and media players are all available with built-in
network connections making them internet-ready. As consumers begin using the connectivity
native in these devices, content owners will be able to establish a direct relationship with
consumers. This creates a challenge for the “middlemen” (e.g., cable operators, satellite providers
and Telcos) that aggregate and distribute content. Despite this challenge, traditional pay-TV
services are not going away any time soon.
The vast majority of consumers, however, are still content to receive their programming from
multi-channel video providers and content owners are not willing to cannibalize the hundreds of
billions of dollars in subscriber fees they receive annually from pay-TV providers. However, as
evidenced by the growing number of broadband subscribers with in-home connected devices the
building blocks for an alternative video delivery system capable over broadband has become a
reality.
Based upon this and other facts in this report we can draw the following conclusions.
The global installed base of in-home connected devices is growing rapidly. In 2011, the
global installed base of in-home connected devices was approximately 319 million, enabling
content owners, either directly or through aggregators, such as Netflix, Hulu, Voddler, and
LOVEFiLM, to reach consumers via unmanaged network (e.g., broadband). By 2016, this
will grow to 1.5 billion devices.
TV is and will remain the #1 screen for video consumption. As seen in the first part of this
report, television is the medium of choice for consumers, far surpassing all other mediums for
its ability to reach massive audiences. Considering that TV viewership remains at hundreds
of hours per month while viewership of broadband and mobile video remains in the low
single digits, it is reckless to proclaim that any great revolution is taking place just yet.
With the number of TV households growing at an average annual rate of 2.7% over the next
five years and connectivity becoming a basic feature on more flat panel TV this will drive
adoption of internet-ready TVs.
Internet-ready is not the same as connected. While the devices discussed in this report are
all network-capable it does not mean that consumers will actually connect them to their home
network or use them to access online content. Rather, the installed base forms the foundation
upon which over-the-top content can be delivered.
Broadband drives online video consumption. As of 2011, there were 537 million
households globally with fixed broadband. By 2016, this will grow to 768 million.
Content is king. While individual channels may struggle to attract viewers (as seen by the
decline of the broadcast networks), programmers overall are producing programming that
consumers want to see.
The Connected Home: Battle for Dominance in the Digital Livingroom February 2012
20
© Copyright 2012. Nexus Research Group. All rights reserved.
Reaching out to Cord Cutters. In-home connected devices provides consumers looking to
“cut-the-cord” with programming right on their TV rather than on a PC/laptop, tablet or
smartphone, thus creating a challenge for pay-TV providers.
Online VOD challenges pay-TV VOD and premium channels for dominance. With its
connection to the TV and availability of Netflix, Hulu and LOVEFiLM, in-home connected
devices are emerging as an alternative platform for video distribution, providing consumers
with an alternative to pay-TV VOD (VOD provided by cable, satellite and telcoTV service
providers) and premium channels.
Netflix, Hulu, LOVEFiLM and other online video providers can compete with the on-
demand offerings of multi-channel video providers and primium channels like HBO,
Showtime and Starz but still lack much of the content available on most linear channels.
Wide scale cord cutting will clog the internet. According to Sandvine’s Fall 2011 Global
Internet Phenomena Report, (Sandvine is a network management company that studies
Internet traffic patterns) Netflix, with 21.6 million straming accounts in 4Q 2011, accounts
for 32.7% of downstream Internet traffic during peak home Internet usage hours in North
America. Think about what would happen to download speeds if the other roughly 100
million TV households in North America started using Netflix streaming.
Opportunities abound in smaller international markets and developing countries.
Smaller international markets and developing countries, where pay-TV is less well
developed, present an opportunity CE manufacturers to get out ahead of the incumbant pay-
TV providers with their offering and become market leader instead of followers.
The 800-pound Apple…I mean gorilla in the room. CE manufacturers should be asking
themselves one question - What will Apple do? Apple is the leader in smart technologies.
While much has been written about Apple coming out with a smart TV, Apple itself has been
quiet on this topic, but it is very unlikely that they will concede this emerging segment to
rivals.
Recommendations for CE Manufacturers
Connectivity by itself is not sufficient. If CE manufactures want to compete for a share of
consumers video dollars they must improve the experience. Connected TV interfaces are
slow, clunky, and not intuitive.
One way to achieve this is through voice recognition. One of the first successful applications
of voice navigation is Microsoft’s Xbox 360. Rather than trying to navigate using a clunky
remote or on-screen keyboard users can just ask the Xbox to find specific movies or TV
show. This of course require that you have a Kinect.
Discovery must improve. Regardless of the device if you don’t know the programming is
available or can’t find it, you can’t view it. Currently it is difficult to discover movies and TV
shows if you are not specifically searching for it. This must improve.

The Connected Home: Battle for Dominance in the Digital Livingroom February 2012
21
© Copyright 2012. Nexus Research Group. All rights reserved.
Recommendations for Internet Video Providers
Internet video services must differentiate themselves from pay-TV providers. Currently,
internet video services are positioning themselves as low cost alternatives to incumbent
services. In order to gain traction internet video services must differentiate themselves from
pay-TV providers in other ways, such as offering consumers high-quality content (e.g.,
original programming) not available on linear channels.
Improve the user experience. Unlike switching pay-TV providers, it is very east to switch
internet video providers. When consumers have a bad experience with an internet video
provider they quickly move on to a competitor. Providers need to implement Video Service
Assurance solutions to manage their video services and improve the customer experience.
Device management is critical. Given the sheer number of connected devices consumers
can watch video on, providers must monitor QoE and QoS from within the end client devices
in real time and aggregate and report on this information from the cloud if they hope to
provide a quality experience.
Embrace cross-platform search. For users of multiple services it is helpful for search to
find all the airings of a specific piece of content. For example, before spending $2.99 to down
load an episode of The Simpsons from the Zune Video Store, you'll see that it's available for
free on Netflix (assuming that you subscribe). Furthermore, this eliminates the need to
memorize which service offer a specific movie or TV show.
Recommendations for Pay-TV Providers
Use content to differentiate yourself from the competition. Currently only a small
percentage of TV shows are available online. Pay-TV service providers must maintain this
advantage and find new ways to take advantage of it. For example, Xfinity is offering the
premier of NBC’s new drama SMASH on-demand a week prior to it airing on the broadcast
network.
Pay-TV providers should embrace 3D broadcasting. Due to bandwidth constraints,
broadband services cannot deliver 3D. Embracing this niche would help differentiate pay-TV
services.
Integrate linear TV program with broadband content in the set-top box (STB). The
European Broadcast Union has launched the Hybrid Broadcast Broadband combining linear
TV with enhancements delivered via broadband to the TV or STB. For example, in the
Netherlands, DailyMedia TV’s PitBox STB integrates a DVB-T tuner and broadband to
deliver enhanced programming directly to consumer TV.
Another option is for Pay-TV providers to open their platform to OTT content, essentially
making OTT services available as a separate channel.

The Connected Home: Battle for Dominance in the Digital Livingroom February 2012
22
© Copyright 2012. Nexus Research Group. All rights reserved.
Conditions of Purchase
Purchase of this multi-client study is on a nonexclusive basis. This study has not been
commissioned or contracted for by any one person or organization. The information contained is
confidential to the purchaser, and the purchaser agrees not to circulate or loan the study in whole
or in part to: their subsidiaries or divisions, industry trade associations (if not the purchaser), the
general public, the media, nor other parties not belonging to their company, agency or
organization. Unauthorized reproduction and dissemination which is discovered by Nexus
Research Group (the publisher) shall constitute grounds for legal prosecution and damages under
U. S. copyright law.
Nexus Research Group has made every attempt to verify the accuracy and completeness of
information in this study from sources we believe to be reliable. It is understood, however, that
our estimates, forecasts, opinions and recommendations represent the judgment of our analysts,
based on the best information available at the time of publication. It is recommended that
purchasers also consult other available business sources and not rely solely on this analysis as the
basis for major strategic, financial, or management decisions. Nexus Research Group makes no
warranty or representation, either expressed or implied, with respect to the information in this
report. In no event will Nexus Research Group be liable for direct, indirect or consequential
damages resulting from any defect or inaccuracy in this report, even if advised of the possibility
of such damages.
Information about specific companies is not intended to be a complete description, nor of their
securities, nor is this study an offer to buy or sell such securities. Nexus Research Group’s
liability, if any, shall not exceed the amount paid for this study.
About This Report
This report is part of a series of reports on Advertising and Games. The focus of this report is on
the overall industry. Other reports have more detailed analysis of companies, business models,
trends and breakouts of individual segments like advertising in and around console / PC games or
social / casual games.. The reports in this Advertising and Games series, including this report, are
based on a review of historical trends and opinions of leading members of the video game
industry, including analysts, consultants, developers, publishers, retailers and consumers. This
report has been prepared by utilizing a variety of primary and secondary research techniques
including: telephone and personal interviews; analysis of market surveys, trade journals and
company literature; extensive database searches; and Nexus Research Group’s original
compilations and analysis.
A Nexus Research Group report is more than a collection of raw statistics. We carefully
scrutinize and analyze data from a variety of sources. The result is a comprehensive overview
that puts facts and figures in context. Anyone who has attempted to collect figures for the online
game industry knows that is difficult to obtain accurate statistics. We have studied market
surveys, investment analyst reports and other sources of industry information. Our statistics and
forecasts are based on the careful analysis of the available research, a great deal of which is
contradictory. In many cases, we made assumptions based on the best available information. We

The Connected Home: Battle for Dominance in the Digital Livingroom February 2012
23
© Copyright 2012. Nexus Research Group. All rights reserved.
feel our figures accurately reflect past and future market conditions. At the very least, these
numbers track the industry trends and accurately estimate the market share of the various players.


![Fight Digital Distractions During Online Meetings, Trainings & Webinars [Infographic]](https://img.pdfslide.us/doc/110x75/55c37e9dbb61ebd8138b460b/fight-digital-distractions-during-online-meetings-trainings-webinars-infographic.jpg)