Embed Size (px)
Citation preview
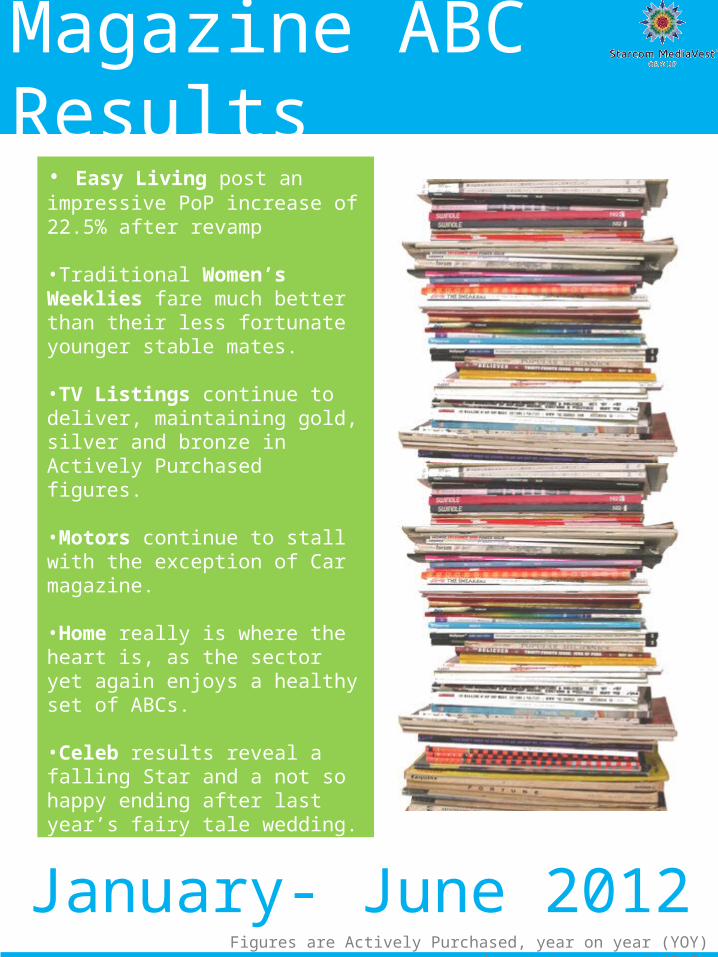
Magazine ABC Results
Headlines
• Easy Living post an impressive PoP increase of 22.5% after revamp
•Traditional Women’s Weeklies fare much better than their less fortunate younger stable mates.
•TV Listings continue to deliver, maintaining gold, silver and bronze in Actively Purchased figures.
•Motors continue to stall with the exception of Car magazine.
•Home really is where the heart is, as the sector yet again enjoys a healthy set of ABCs.
•Celeb results reveal a falling Star and a not so happy ending after last year’s fairy tale wedding.
•Commitment yet again is a problem in the Men’s market in terms of loyalty and putting their hands in their pockets!
•Tablet versions of the magazines continue to grow.
January- June 2012Figures are Actively Purchased, year on year (YOY) and
period on period (PoP)

Managing to maintain its circulation PoP Glamour remains top of the sector despite a YoY decline of over 12%. Rival title Cosmopolitan has revealed another disappointing set of figures, declining by 8.2% YoY and proving its fall behind Woman & Home at the last ABCs was more than a blip.
Hearst flagship title Good Housekeeping maintains in second position with a small YoY decline of 5.1%. Both W&H and GH have held on to the majority of their subscriptions YoY, showing that the declines are not coming from loyal readers.
Other titles in the more ‘mature’ category have also shown promising figures. Yours has remained flat, however has increased subscriptions by 6% YoY. Red also increased its subs base by 14% despite a decline of 2.5%. Easy Living’s revamp and publicity seems to have paid off as it boasts an increase of 22.5% PoP! Unfortunately the same cannot be said for younger title Company's new look, after posting a double digit decline. Aspiration continues to rule, as titles such as Vogue, Elle and Harpers all maintain their fashionista readers.
Overall this has been one of the worst hit sectors with a YoY decline of 11%.Take a Break maintains its leading position, circulating more than double that of its closest rival. Publishing Director Andy Brooks believes this strong position has been maintained due to investment into the title and TV advertising throughout the early part of the year.
At the other end of the market, some of the smaller titles have revealed that they have struggled in this period. Pick Me Up and Love It have posted YoY declines of nearly 20%, continuing the downward trend since their launch in 2006.
IPC argue that Pick Me Up readers are still loyal, they are just picking up the magazine less frequently. They have continued to invest in their brands through other platforms -e.g. Chat Puzzle App. Rather than Tablet, the mobile platform is where there is penetration against this audience.
Jan – June 2012
P on P %
Y on Y %
Glamour 428,514 +0.2 -12.5Good Housekeeping 393,147 -8.9 -5.1Woman & Home 335,101 -7.5 -4.9Cosmopolitan 298,221 -6.4 -8.2Yours 258,924 -0.8 -1.9Red 207,713 -2.4 -2.5Easy Living 155,624 +22.5 +7.2Elle 147,775 -0.7 0Company 139,488 -24.2 -20.9
Jan- June 2012
P on P %
Y on Y %
Take A Break 780,125 -0.4 -2.2Chat 356,638 -1.7 -6.3That’s Life 302,968 -6.6 -5.1Woman’s Weekly 297,870 -4.6 -3.6Woman 276,851 +0.2 -1.9Best 257,770 -5.4 -6.8Woman’s Own 228,339 -3.5 -5.3Pick me Up 205,301 -11.9 -18.8Love It! 170,840 -12.7 -18.9
Women’s Monthlies
Women’s Weeklies

Despite some declines, this genre continues to present some big numbers. TV Choice leads the way with an actively purchased figure of over 1.3 million despite a YoY decline of over 5%. IPC’s What’s On TV maintains 2nd place with a similar small decline. Stable mates TV & Satellite Week and TV Times also posted declines of 4.66% YoY and 8.15% YoY respectively.
Iconic title Radio Times posted a small decline of under 4% but continues to circulate well over 850,000 copies. Generally RT in particular posts much more positive results in Jul-Dec figures, so they’ll have their fingers crossed for a PoP increase next time.
The winner in this category is Total TV Guide which posted the only increase (3% YoY)
This category continues to defy skeptics who suggest that with the rise of EPG there is no need for a listings title. TV Choice, WOTV and Radio Times remain the 3 most Actively Purchased titles of all UK Magazines.
Jan – June 2012
P on P %
Y on Y %
TV Choice 1,277,850 -2.0 -5.7What’s On TV 1,213,566 -3.0 -4.6Radio Times 857,970 -6.5 -3.9TV Times 264,526 -9.9 -8.5TV & Sat Week 168,282 -2.8 -4.7Inside Soap 154,220 -1.7 -6.2TV Easy 148,654 -1.2 -8.3Total TV Guide 121,016 -1.5 +3.1
TV Listings
Celebrity WeekliesAn 11% decrease across the sector points to a few issues here.Clearly, appetite for celebrity-focussed content isn’t what it was 2,3,4 years ago – what titles previously banked on in terms of filling their pages is no longer as attractive and with it being readily available online this will continue to be the case.Add this to the fact that main female purchasers are considering what they’re buying a lot more – no longer chucking a copy in the basket without even thinking about it, but really making a considered approach to how and what they’re spending.The Express stable have seen particularly disappointing results, with both new! and Star dropping circa 71k copies each PoP, and OK! a 25% decrease YoY. However, it is worth noting as a group, they account for 40% of the sectors copy sales, so still have a dominant role. The waning interest in celebrity as we know it means the titles really need to re-assess what their readers want – why they would choose to pick up one title over another. However with the success of our Olympiads and the interest surrounding them, we could see a new phase of celebrity personalities.
Jan - Jun 2012
P on P %
Y on Y %
new 435,417 -13.6 -15.0
Closer 422,657 -7.4 -6.5
OK! 341,187 -8.0 -25.4
Star 285,219 -19.4 -29.1
Heat 276,151 -10.3 -11.5
Hello! 260,929 -4.1 -11.9
Now 255,199 +1.0 -15.1
Reveal 229,814 -15.9 -24.8
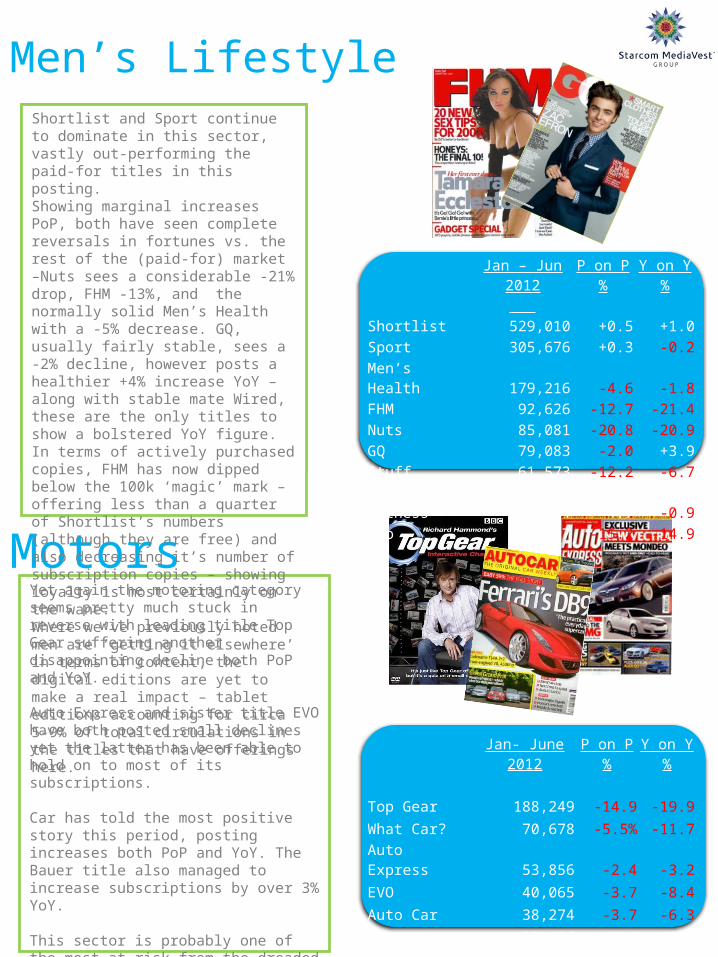
Yet again the motoring category seems pretty much stuck in reverse with leading title Top Gear suffering another disappointing decline both PoP and YoY.
Auto Express and sister title EVO have both posted small declines yet the latter has been able to hold on to most of its subscriptions.
Car has told the most positive story this period, posting increases both PoP and YoY. The Bauer title also managed to increase subscriptions by over 3% YoY.
This sector is probably one of the most at risk from the dreaded migration to online.- in this case, sites such as Auto Trader etc which maintain authority in all things auto. The current economic climate will not help this genre as people put off making large purchases. It is this ‘dip in, dip out’ readership that has fallen out of the market, as loyalty amongst true car fanatics remains strong.
Jan- June 2012
P on P %
Y on Y %
Top Gear 188,249 -14.9 -19.9
What Car? 70,678 -5.5% -11.7
Auto Express 53,856 -2.4 -3.2
EVO 40,065 -3.7 -8.4
Auto Car 38,274 -3.7 -6.3
Car 32,496 +1.4 +3.7
Men’s Lifestyle
Motors
Shortlist and Sport continue to dominate in this sector, vastly out-performing the paid-for titles in this posting.Showing marginal increases PoP, both have seen complete reversals in fortunes vs. the rest of the (paid-for) market –Nuts sees a considerable -21% drop, FHM -13%, and the normally solid Men’s Health with a -5% decrease. GQ, usually fairly stable, sees a -2% decline, however posts a healthier +4% increase YoY – along with stable mate Wired, these are the only titles to show a bolstered YoY figure.In terms of actively purchased copies, FHM has now dipped below the 100k ‘magic’ mark – offering less than a quarter of Shortlist’s numbers (although they are free) and also decreasing it’s number of subscription copies – showing loyalty is most certainly on the wane.Where we’ve previously noted men are ‘getting it elsewhere’ in terms of content, the digital editions are yet to make a real impact – tablet editions accounting for circa 5-9% of total circulations in the titles that have offerings here.
Jan – Jun 2012
P on P %
Y on Y %
Shortlist 529,010 +0.5 +1.0Sport 305,676 +0.3 -0.2Men’s Health 179,216 -4.6 -1.8FHM 92,626 -12.7 -21.4Nuts 85,081 -20.8 -20.9GQ 79,083 -2.0 +3.9Stuff 61,573 -12.2 -6.7Men’s Fitness 59,604 +4.7 -0.9Zoo 44,147 -15.2 -14.9
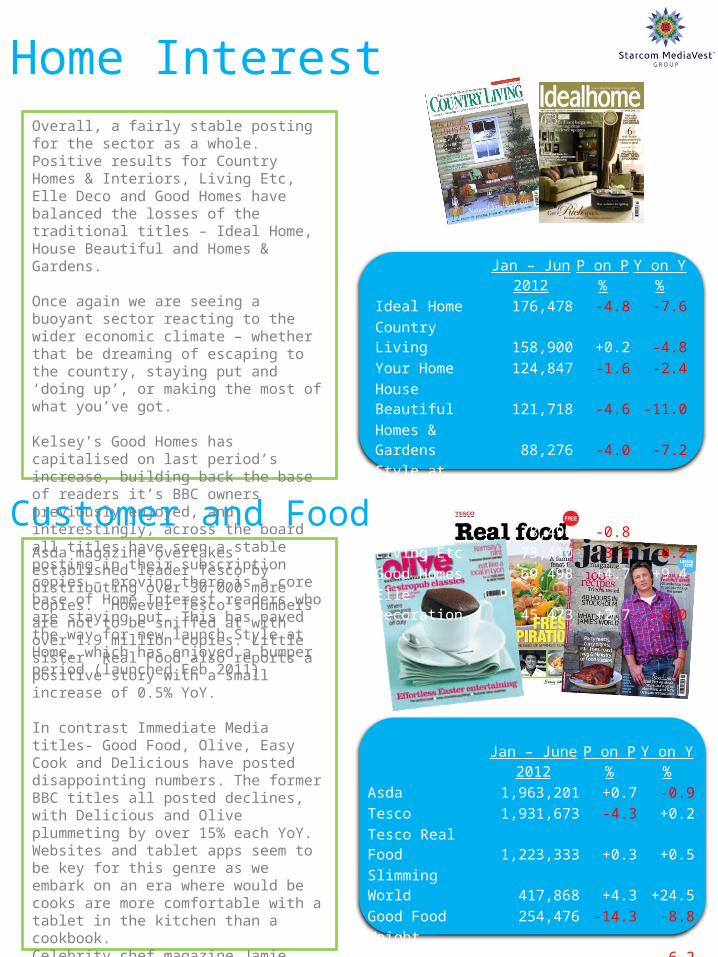
Asda magazine overtakes established leader Tesco by distributing over 30,000 more copies. However Tesco’s numbers are not to be sniffed at with over 1.9 million copies. Little sister Real Food also reports a positive story with a small increase of 0.5% YoY.
In contrast Immediate Media titles- Good Food, Olive, Easy Cook and Delicious have posted disappointing numbers. The former BBC titles all posted declines, with Delicious and Olive plummeting by over 15% each YoY. Websites and tablet apps seem to be key for this genre as we embark on an era where would be cooks are more comfortable with a tablet in the kitchen than a cookbook. Celebrity chef magazine Jamie also posted a decline, however has managed to increase subscription sales by 23.4% PoP.
Diet titles such as Slimming World have had a much more positive story to tell as people got into shape in the first half of 2012, posting an increase of over 24% YoY, Weight Watchers also increased readers PoP at 2.2%.
Jan – June 2012
P on P %
Y on Y %
Asda 1,963,201 +0.7 -0.9Tesco 1,931,673 -4.3 +0.2Tesco Real Food 1,223,333 +0.3 +0.5Slimming World 417,868 +4.3 +24.5Good Food 254,476 -14.3 -8.8Weight Watchers 187,127 +2.2 -6.2Delicious 70,296 -16.8 -16.7Olive 61,133 -21.5 -15.3Jamie 26,677 -19.7 -10.0
Home Interest
Customer and Food
Overall, a fairly stable posting for the sector as a whole.Positive results for Country Homes & Interiors, Living Etc, Elle Deco and Good Homes have balanced the losses of the traditional titles – Ideal Home, House Beautiful and Homes & Gardens.
Once again we are seeing a buoyant sector reacting to the wider economic climate – whether that be dreaming of escaping to the country, staying put and ‘doing up’, or making the most of what you’ve got.
Kelsey’s Good Homes has capitalised on last period’s increase, building back the base of readers it’s BBC owners previously enjoyed, and interestingly, across the board all titles have seen a stable posting in their subscription copies – proving there is a core base of Home Interest readers who are staying put. This has paved the way for new launch Style at Home, which has enjoyed a bumper period (launched Feb 2011).
Jan – Jun 2012
P on P %
Y on Y %
Ideal Home 176,478 -4.8 -7.6Country Living 158,900 +0.2 -4.8Your Home 124,847 -1.6 -2.4House Beautiful 121,718 -4.6 -11.0Homes & Gardens 88,276 -4.0 -7.2Style at Home 79.916 +11.3 +52.0CH & Interiors 78,490 -0.8 +3.9Living Etc 73,410 -3.3 -0.2Good Homes 69,498 +4.7 +9.4Elle Decoration 45,473 +2.7 -3.0

Perhaps one of the most positive stories of this period, with an overall increase of 2%.
Since the economic downturn, this sector has been one of the main beneficiaries with the public hungry to keep up with the ever changing policies that will influence their everyday lives. Politics has become something that matters to the every day man rather than just ‘people in the know’.
Private Eye posted some very positive figures, boasting a YoY increase of nearly 10%. Although figures are flat for the Economist they have managed to increase their subscription base by +2.5% YoY.
2012's winner of 'Consumer Magazine of the Year' at the PPA Awards The Week boasted a YoY increase of 2.5% and its new distribution partnership with Raconteur Media, should help to boost their figures even further.
Jan- June 2012
P on P %
Y on Y %
Private Eye 213,185 -1.3 +9.7Economist (UK) 160,910 +0.5 -0.1The Week 156,846 +3.1 +2.5New Scientist (WW) 76,271 -3.9 -1.8Spectator 38,136 -1.1 +0.3Monocle 12,039 -6.6 -3.8
Music
News & Views
There’s been little to sing about over the past few years in this sector, and this period sees little change.
Some fairly heavy losses for Bauer’s Q and IPC’s NME at -20% and -14% PoP respectively have contributed to an overall loss of over 20k copies across the sector.The loss sees NME’s current circulation at less than half it’s number just 4 years ago and now sees itself at the bottom of the pops, selling fewer copies than any other rock title. IPC will affirm – once again – the future of the brand rests in its extensions and festival tie-ups in order to keep this brand afloat.Q’s new editor Andrew Harrison will be hoping to reverse fortunes in the next posting – having moved from the now defunct The Word. The loss of this independent title was a blow to the sector and confirmed the changing nature of the music business – with NME currently posting a lower circulation to that of the final issue of The Word, it will indeed be testing times ahead.
Jan – Jun 2012 P on P % Y on Y %Q Magazine 51,261 -19.7 -18.4Mojo 47,020 -6.6 +1.2Kerrang! 38,403 -5.2 -7.3NME 21,419 -13.8 -17.7
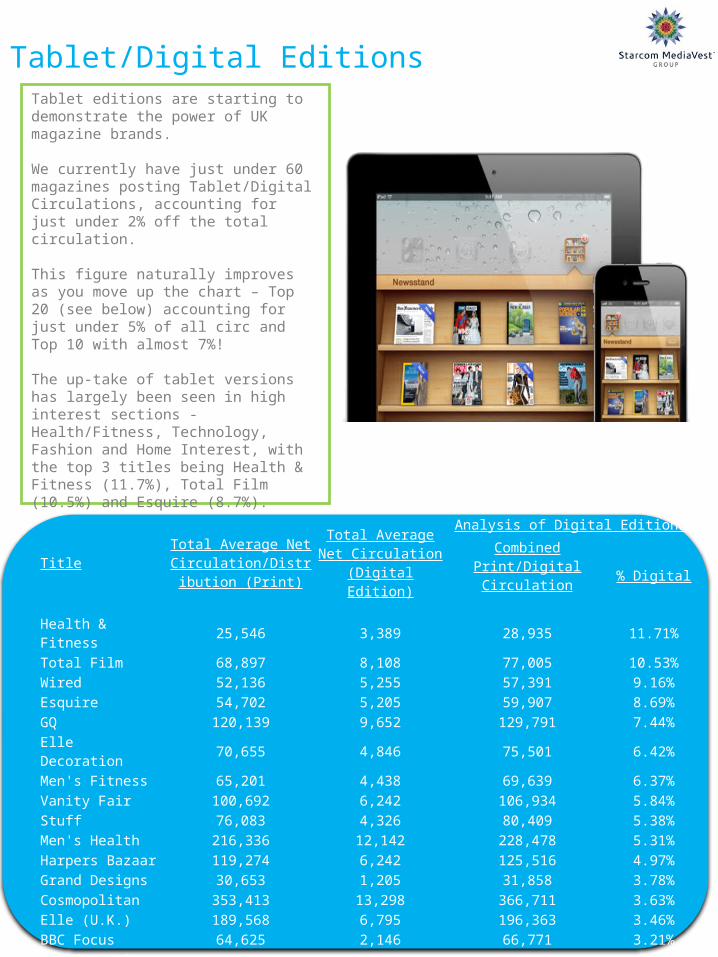
Tablet editions are starting to demonstrate the power of UK magazine brands.
We currently have just under 60 magazines posting Tablet/Digital Circulations, accounting for just under 2% off the total circulation.
This figure naturally improves as you move up the chart – Top 20 (see below) accounting for just under 5% of all circ and Top 10 with almost 7%!
The up-take of tablet versions has largely been seen in high interest sections - Health/Fitness, Technology, Fashion and Home Interest, with the top 3 titles being Health & Fitness (11.7%), Total Film (10.5%) and Esquire (8.7%).
The publishers leading this are currently Dennis, Future, Conde Nast and Hearst.
We would expect more publishers to enter the tablet market, with imminent launches such as Bauer's Grazia tablet edition in the autumn.
Tablet/Digital Editions
TitleTotal Average Net
Circulation/Distribution (Print)
Total Average Net Circulation (Digital
Edition)
Analysis of Digital EditionsCombined Print/Digital
Circulation % Digital
Health & Fitness 25,546 3,389 28,935 11.71%Total Film 68,897 8,108 77,005 10.53%Wired 52,136 5,255 57,391 9.16%Esquire 54,702 5,205 59,907 8.69%GQ 120,139 9,652 129,791 7.44%Elle Decoration 70,655 4,846 75,501 6.42%Men's Fitness 65,201 4,438 69,639 6.37%Vanity Fair 100,692 6,242 106,934 5.84%Stuff 76,083 4,326 80,409 5.38%Men's Health 216,336 12,142 228,478 5.31%Harpers Bazaar 119,274 6,242 125,516 4.97%Grand Designs 30,653 1,205 31,858 3.78%Cosmopolitan 353,413 13,298 366,711 3.63%Elle (U.K.) 189,568 6,795 196,363 3.46%BBC Focus 64,625 2,146 66,771 3.21%The Economist - UK 210,386 6,146 216,532 2.84%BBC Good Food 267,164 7,346 274,510 2.68%Women's Fitness 20,717 563 21,280 2.65%Zest 71,820 1,920 73,740 2.60%Living etc 98,250 2,267 100,517 2.26%