Embed Size (px)
Citation preview
Page 1
WIPAC MONTHLY The Monthly Update from Water Industry Process Automation & Control
www.wipac.org.uk Issue 6/2015
Page 2
In this Issue
Editorial.............................................................................................................................. 3
Industry News..................................................................................................................... 4 - 9
Highlights of the news of the month from the global water industry centred around the successes of a few of the
companies in the global market.
Opinion: To buy or not to buy............................................................................................. 10
In the first of this month’s opinion pieces the case for and against the “buying” of data and instrumentation services
is presented and why buying data rather than managing instruments is not necessarily economically feasible.
Opinion: The role of ICA in maintenance reliability............................................................. 11
In our second opinion piece of the month Farooq Janjua discusses the role of ICA in the development of maintenance
in order to drive a continuous cycle of review, corrective action and improvement.
Do I really need a new flow meter?................................................................................... 12-13
The development of flow meters and their use within the Water Industry has been quite outstanding. In the past flow
meters were used for measuring flow, now with modern needs they are used for so much more. In this article Oliver
Grievson examines the fact why we really do need this development in instrumentation across the industry
Catching up with Catchment Monitoring.......................................................................... 14-16
In this article by Rosa Richards, the programme manager of the Sensors for Water Interest Group. An approach taken by
the West Country’s Rivers Trust to use instrumentation to discover the reasons for failure of water quality in the catchment
under the Water Framework Directive is examined
The Future of WIPAC - Results of the recent survey............................................................ 17-18
The future of WIPAC was a survey that was put out to the group recently that asked the group as a whole where they
want to see the direction of the Water Industry Process Automation & Control Group to go. This article presents the
results of the survey in brief.
Workshops, Conferences & Seminars............................................................................... 19-20
The highlights of the conferences and workshops in the coming months
WIPAC Monthly is a publication of the Water Industry Process Automation & Control Group. It is produced by the group
manager and WIPAC Monthly Editor, Oliver Grievson. This is a free publication for the benefit of the Water Industry and please
feel free to distribute to any who you may feel benefit.
All enquires about WIPAC Monthly, including those who want to publish news or articles within these pages, should be directed
to the publications editor, Oliver Grievson
Photo on the front cover
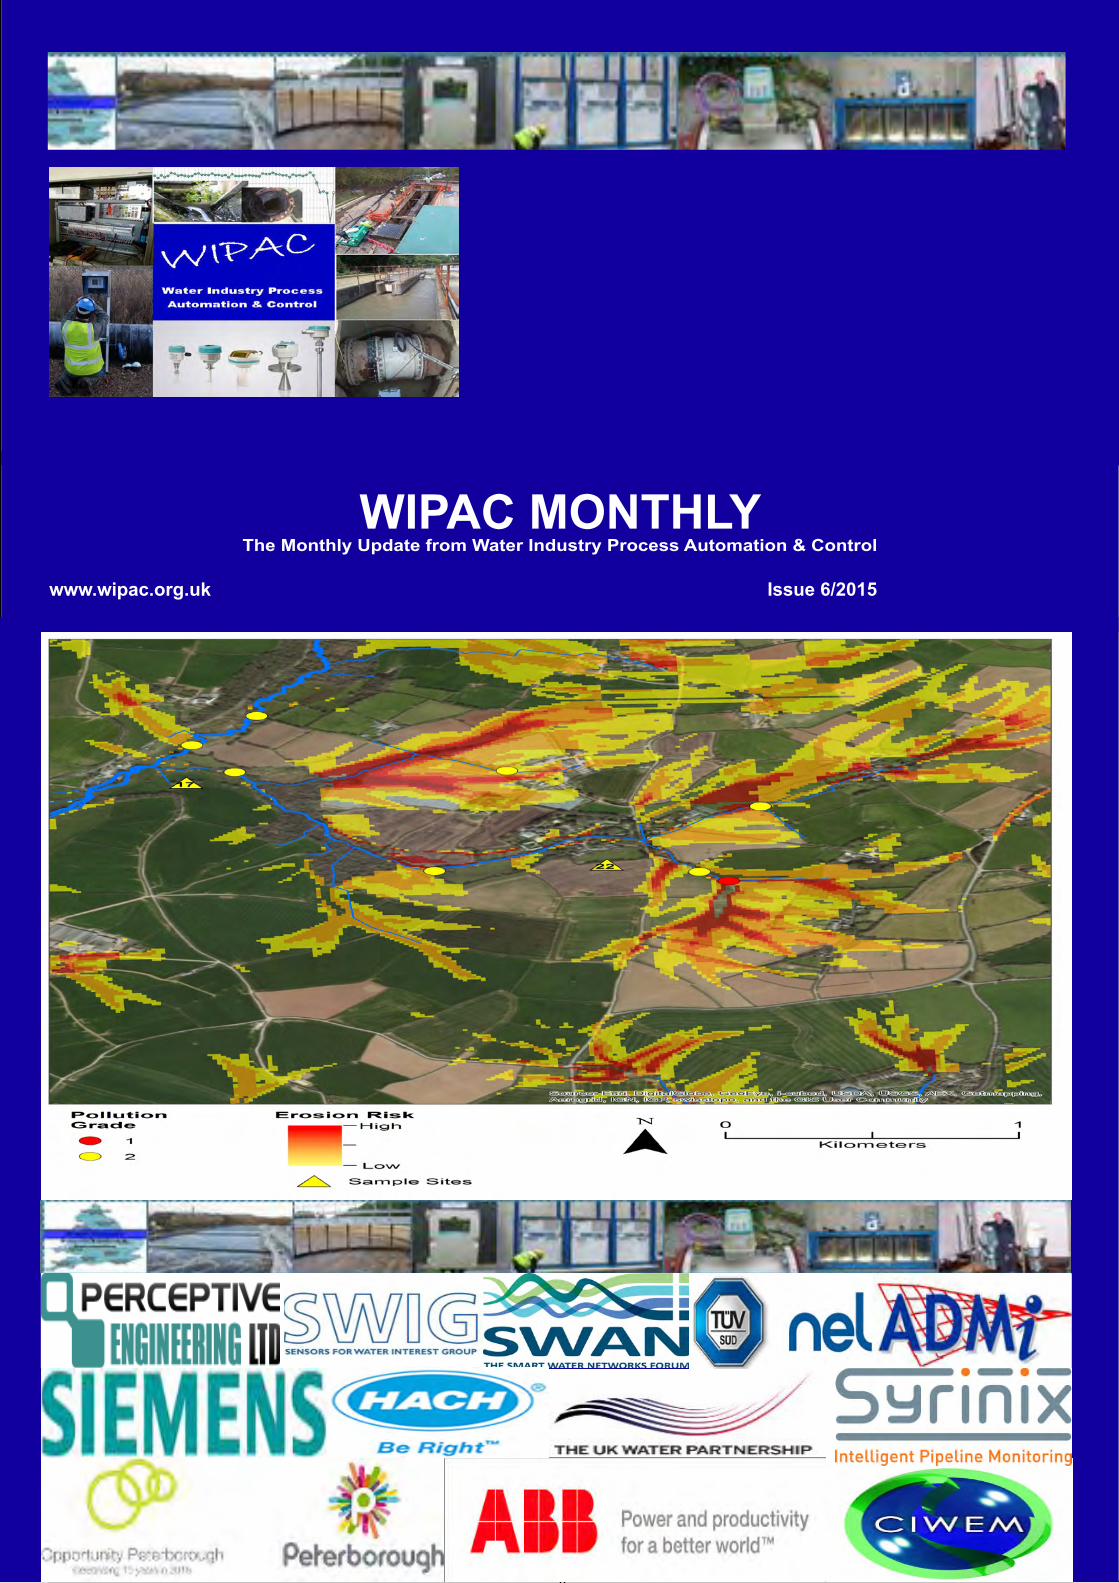
The cover photo this month is a map of SCIMAP sediment modelling data on the River Camel SSSI

Page 3
From the Editor
For me the important news this month is the results of the WIPAC survey. Any group or gathering of people must change over time, adapt and evolve. The result if you don’t is that things get stale and the topics don’t change and people start to lose interest and the value is lost. The WIPAc group is now over 5,300 people and I am sure that I am
not hearing all of the views of all of the members. One very honest person in the WIPAC survey said he dipped in and out of WIPAC Monthly, took the value from each edition he saw and took his leave. What I think my “job” is to find out what piques his interest and potentially turn him into a more regular reader. The one thing I do have to do is thank him and all of those who answered the survey. The results, as promised are in this issue and I will start to instigate changes from the next edition. Those of you who said you’d like to contribute to WIPAC Monthly - I’ll be in touch.
What was said was that, we, as a whole do need to be a bit more of a community. Less of me talking and more of others. especially those internationally. We have certainly made a start on this in the past few months with a regular volunteer for the opinion piece in each issue but there is more to do. One of the contributors did mention the possibility of holding Webinars. This is something that I am currently investigating and would welcome any comments from readers/members of the LinkedIn Group to share their experiences of the approach. What I will say is that it is a big step for WIPAC as it means that I will have to garner sponsors for each and everyone of the webinar sessions and I am sure have to turn the
WIPAC group into a not for profit company in order to manage any sponsorship. This doesn’t mean that WIPAC is going to be commercialised, this is the last thing that I want and is also the last thing that the group wants (this was a very clear message from the survey) but the expense of webinars is something that I cannot personally afford to bear and I think in order to maximise the audiences they will have to be free. I will investigate further and report back in future WIPAC editorials as to what the situation is going to be moving forward. What is clear is that WIPAC will move forward, hopefully continue to be a source of news and interest for its members and most importantly continue to be free to all of its members and future members.
To get onto more real life issues. This month has been one of planning, writing and managing expectations. Outside of my day job I sit on various industry committees and boards. One of these is the Sensors for Water Interest Group and are most recent board meeting was of great interest as we were planning for the future be it the near future for the Sensing for Water Conference in September or next years programme. What I have found out recently is that I actu-ally enjoy organising workshop or conferences. Its not something that I really thought about in the past but I think it satisfies the technical nerd in me to put together a group of other intelligent people and have a good chat, sharing the experiences. Sometimes it can fall slightly flat and I end up talking far too much but that’s the risk that you run on occasion. The problem is that sometimes it gets bigger and bigger and it makes me more and more nervous. Take another group I work with which is one of the UK professional institutions, CIWEM. Last year we ran a Water Network Conference and it was highly successful. Sitting down with the event organisers last week this had turned into a 2 day event complete with round-table discussion in the evening. The early call for papers is in this issue so those of you interested get in touch. There is a phrase for all of this though - Glutton for punishment - My answer - That’s the Water Industry.
Another thing that got me slightly hot under the collar this month related to my day job. As part of my job I manage the largest asset base of regulated flow meters in the UK. Its a challenge at times and under the last price review the plan was submitted for the next five years. This was without what the regula-tors were going to mark our performance against which hit my inbox only this morning (25th June). What I found in the scoring guidelines justified virtually everything that I submitted - data loggers, labelling as well as a significant amount of work around replacing sensors and measurement devices. All of this was very gratifying to see as its something to go to the investment boards and say “I told you we needed this bit of kit and here is why,” There were of course some nasty bits to it all and those, are the hard ones to swallow. I suppose its a case of taking the rough with the smooth but I just which the regulator was just a little bit gentler at times. I suppose that its a wish that most of us who “serve” in the Water Industry have had in the past and none of us has got our wish. Its the life that we all lead..... What all of this will lead to is better quality data and information for both operational and asset information and this is the driver at the end of the day but there is of course a balance between the data that is needed to protect the environment and the cost of doing so. Its a very delicate balance that is difficult to get right. This is the challenge that we face.
What will happen is that the industry will move on and in terms of the areas of this group instruments will move on as will control and automation systems and the industry as a whole will always need the right data and the right information to run the industry that we work in. Its something I have reflected on this month in an article on flow meter development over the years. The technology R&D helps and it is important as we ask more and more from our technologies helping us track how we are performing and how efficient we are.....now all we have to do is perfect the instrument, control and automation system that can do everything all for us........or maybe not.
Have a good month
Oliver
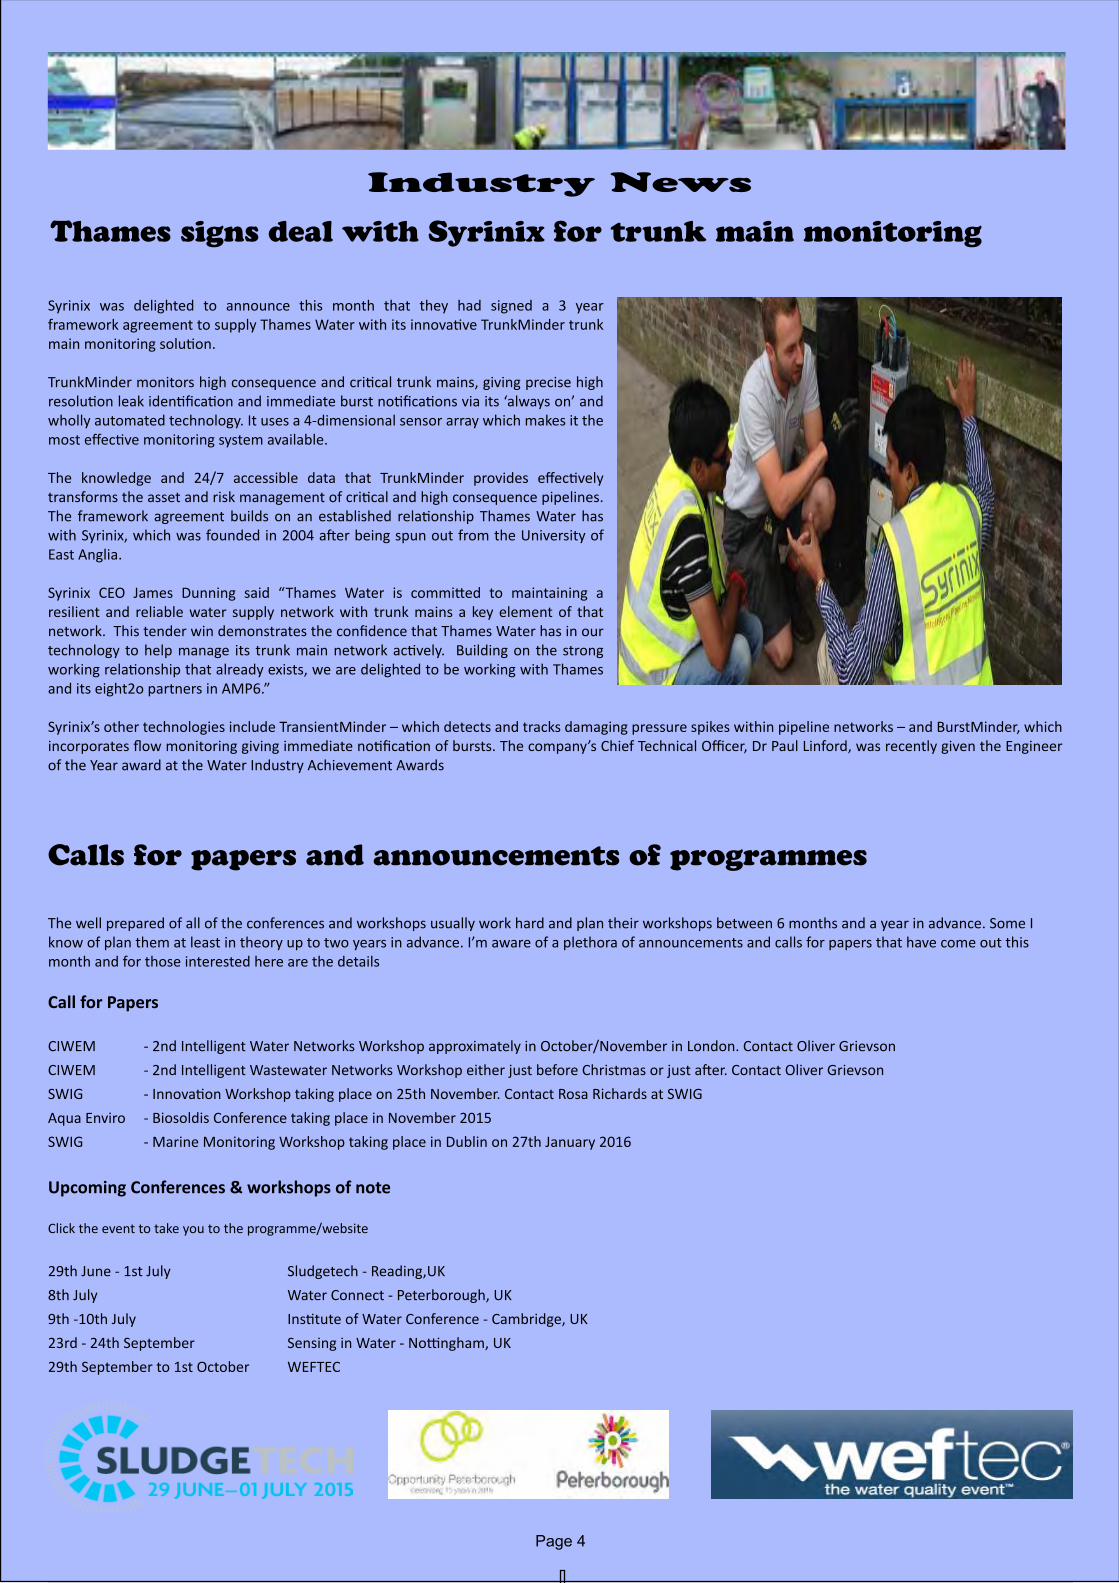
Syrinix was delighted to announce this month that they had signed a 3 year framework agreement to supply Thames Water with its innovative TrunkMinder trunk main monitoring solution.
TrunkMinder monitors high consequence and critical trunk mains, giving precise high resolution leak identification and immediate burst notifications via its ‘always on’ and wholly automated technology. It uses a 4-dimensional sensor array which makes it the most effective monitoring system available.
The knowledge and 24/7 accessible data that TrunkMinder provides effectively transforms the asset and risk management of critical and high consequence pipelines. The framework agreement builds on an established relationship Thames Water has with Syrinix, which was founded in 2004 after being spun out from the University of East Anglia.
Syrinix CEO James Dunning said “Thames Water is committed to maintaining a resilient and reliable water supply network with trunk mains a key element of that network. This tender win demonstrates the confidence that Thames Water has in our technology to help manage its trunk main network actively. Building on the strong working relationship that already exists, we are delighted to be working with Thames and its eight2o partners in AMP6.”
Syrinix’s other technologies include TransientMinder – which detects and tracks damaging pressure spikes within pipeline networks – and BurstMinder, which incorporates flow monitoring giving immediate notification of bursts. The company’s Chief Technical Officer, Dr Paul Linford, was recently given the Engineer of the Year award at the Water Industry Achievement Awards
Calls for papers and announcements of programmes
Page 4
Industry News
Thames signs deal with Syrinix for trunk main monitoring
The well prepared of all of the conferences and workshops usually work hard and plan their workshops between 6 months and a year in advance. Some I know of plan them at least in theory up to two years in advance. I’m aware of a plethora of announcements and calls for papers that have come out this month and for those interested here are the details
Call for Papers
CIWEM - 2nd Intelligent Water Networks Workshop approximately in October/November in London. Contact Oliver GrievsonCIWEM - 2nd Intelligent Wastewater Networks Workshop either just before Christmas or just after. Contact Oliver GrievsonSWIG - Innovation Workshop taking place on 25th November. Contact Rosa Richards at SWIGAqua Enviro - Biosoldis Conference taking place in November 2015SWIG - Marine Monitoring Workshop taking place in Dublin on 27th January 2016
Upcoming Conferences & workshops of note
Click the event to take you to the programme/website
29th June - 1st July Sludgetech - Reading,UK8th July Water Connect - Peterborough, UK 9th -10th July Institute of Water Conference - Cambridge, UK 23rd - 24th September Sensing in Water - Nottingham, UK29th September to 1st October WEFTEC
Page 5
John Marsh joins SWIG Board of Directors as John Brown takes over at the WCRF
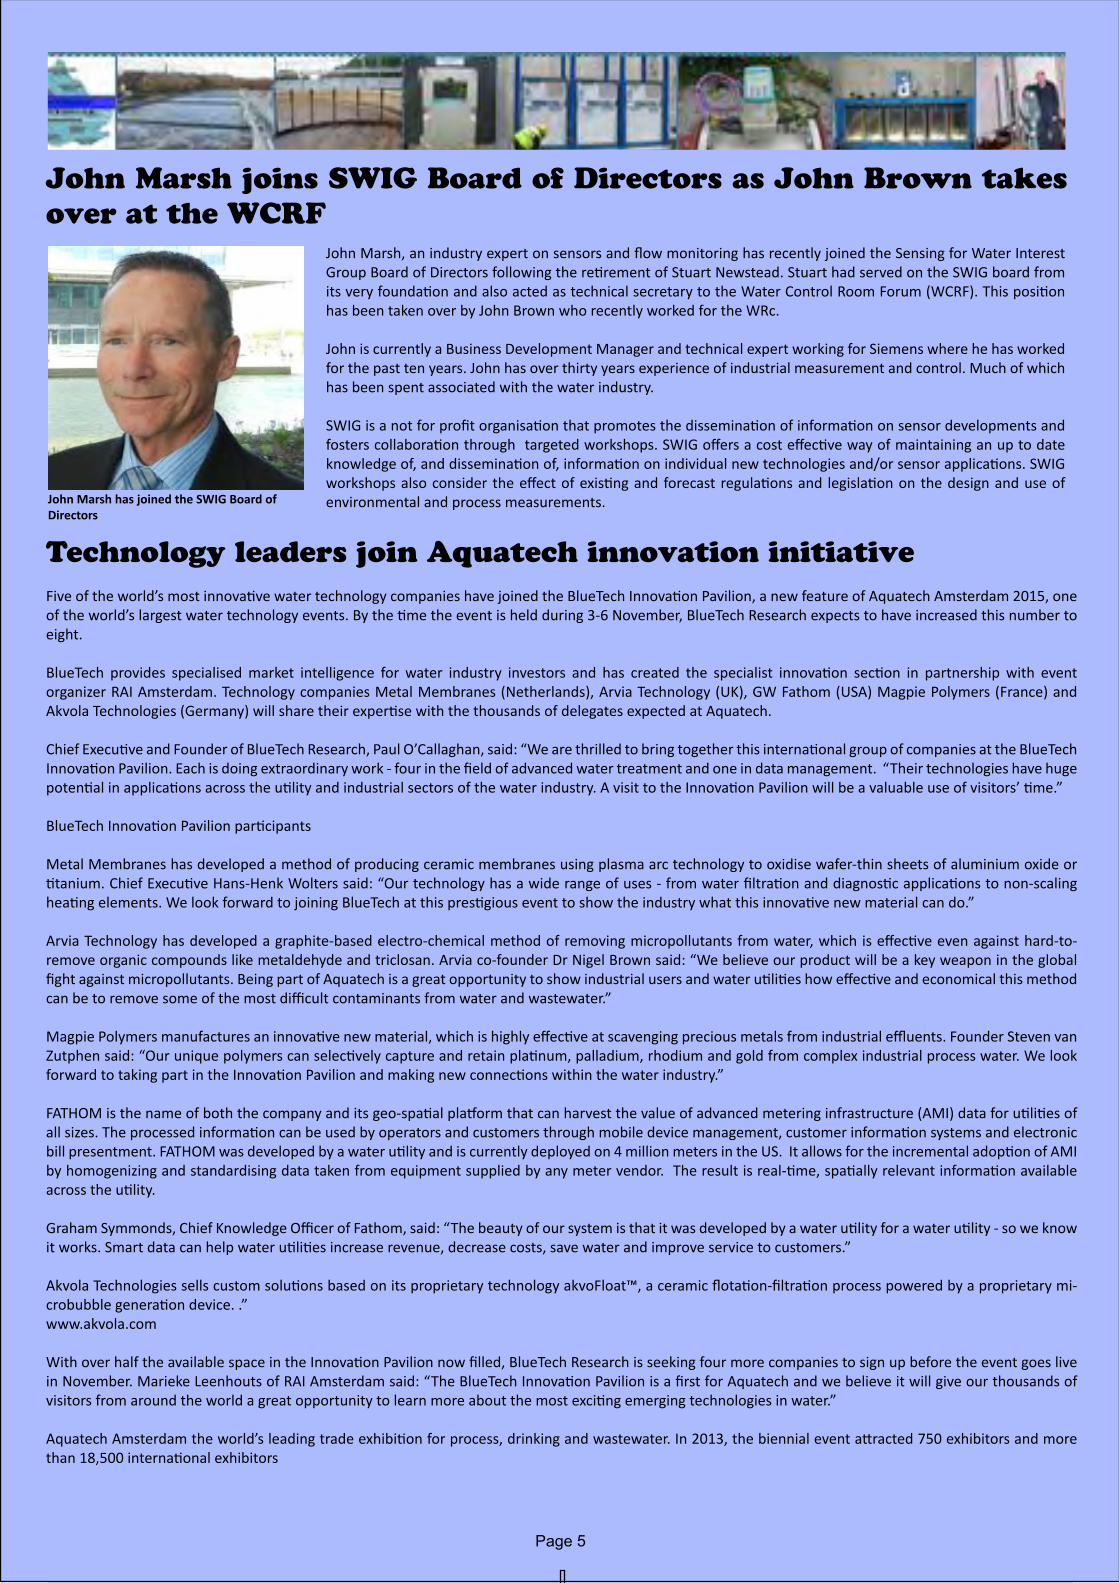
John Marsh has joined the SWIG Board of Directors
John Marsh, an industry expert on sensors and flow monitoring has recently joined the Sensing for Water Interest Group Board of Directors following the retirement of Stuart Newstead. Stuart had served on the SWIG board from its very foundation and also acted as technical secretary to the Water Control Room Forum (WCRF). This position has been taken over by John Brown who recently worked for the WRc.
John is currently a Business Development Manager and technical expert working for Siemens where he has worked for the past ten years. John has over thirty years experience of industrial measurement and control. Much of which has been spent associated with the water industry.
SWIG is a not for profit organisation that promotes the dissemination of information on sensor developments and fosters collaboration through targeted workshops. SWIG offers a cost effective way of maintaining an up to date knowledge of, and dissemination of, information on individual new technologies and/or sensor applications. SWIG workshops also consider the effect of existing and forecast regulations and legislation on the design and use of environmental and process measurements.
Five of the world’s most innovative water technology companies have joined the BlueTech Innovation Pavilion, a new feature of Aquatech Amsterdam 2015, one of the world’s largest water technology events. By the time the event is held during 3-6 November, BlueTech Research expects to have increased this number to eight.
BlueTech provides specialised market intelligence for water industry investors and has created the specialist innovation section in partnership with event organizer RAI Amsterdam. Technology companies Metal Membranes (Netherlands), Arvia Technology (UK), GW Fathom (USA) Magpie Polymers (France) and Akvola Technologies (Germany) will share their expertise with the thousands of delegates expected at Aquatech.
Chief Executive and Founder of BlueTech Research, Paul O’Callaghan, said: “We are thrilled to bring together this international group of companies at the BlueTech Innovation Pavilion. Each is doing extraordinary work - four in the field of advanced water treatment and one in data management. “Their technologies have huge potential in applications across the utility and industrial sectors of the water industry. A visit to the Innovation Pavilion will be a valuable use of visitors’ time.”
BlueTech Innovation Pavilion participants
Metal Membranes has developed a method of producing ceramic membranes using plasma arc technology to oxidise wafer-thin sheets of aluminium oxide or titanium. Chief Executive Hans-Henk Wolters said: “Our technology has a wide range of uses - from water filtration and diagnostic applications to non-scaling heating elements. We look forward to joining BlueTech at this prestigious event to show the industry what this innovative new material can do.”
Arvia Technology has developed a graphite-based electro-chemical method of removing micropollutants from water, which is effective even against hard-to- remove organic compounds like metaldehyde and triclosan. Arvia co-founder Dr Nigel Brown said: “We believe our product will be a key weapon in the global fight against micropollutants. Being part of Aquatech is a great opportunity to show industrial users and water utilities how effective and economical this method can be to remove some of the most difficult contaminants from water and wastewater.”
Magpie Polymers manufactures an innovative new material, which is highly effective at scavenging precious metals from industrial effluents. Founder Steven van Zutphen said: “Our unique polymers can selectively capture and retain platinum, palladium, rhodium and gold from complex industrial process water. We look forward to taking part in the Innovation Pavilion and making new connections within the water industry.”
FATHOM is the name of both the company and its geo-spatial platform that can harvest the value of advanced metering infrastructure (AMI) data for utilities of all sizes. The processed information can be used by operators and customers through mobile device management, customer information systems and electronic bill presentment. FATHOM was developed by a water utility and is currently deployed on 4 million meters in the US. It allows for the incremental adoption of AMI by homogenizing and standardising data taken from equipment supplied by any meter vendor. The result is real-time, spatially relevant information available across the utility.
Graham Symmonds, Chief Knowledge Officer of Fathom, said: “The beauty of our system is that it was developed by a water utility for a water utility - so we know it works. Smart data can help water utilities increase revenue, decrease costs, save water and improve service to customers.”
Akvola Technologies sells custom solutions based on its proprietary technology akvoFloat™, a ceramic flotation-filtration process powered by a proprietary mi-crobubble generation device. .”www.akvola.com
With over half the available space in the Innovation Pavilion now filled, BlueTech Research is seeking four more companies to sign up before the event goes live in November. Marieke Leenhouts of RAI Amsterdam said: “The BlueTech Innovation Pavilion is a first for Aquatech and we believe it will give our thousands of visitors from around the world a great opportunity to learn more about the most exciting emerging technologies in water.”
Aquatech Amsterdam the world’s leading trade exhibition for process, drinking and wastewater. In 2013, the biennial event attracted 750 exhibitors and more than 18,500 international exhibitors
Technology leaders join Aquatech innovation initiative
Water sample screening database to be available worldwide
The preventative water screening FOR-IDENT project funded by the German Government is being further expanded internationally in order to establish a worldwide strategy for preventative water sample analysis which will be freely available to access worldwide. The FOR-IDENT database completed in March 2015 now contains over 8,000 substances, together with their key chemical and physical characteristics.
The available options for quickly identifying unknown molecules in water have been limited in the past. However, the principle of preventative screening is essential when testing surface waters, which frequently serve as drinking water sources. A key goal is “screening to prevent or at least quickly identify potential risks”. Chemical analyses show that a single water sample can contain thousands different types of molecules. These substances stem from the surrounding environment, but are also introduced by humans in the form of industrial chemicals, pesticides, medications and household chemicals, as well as their respective degradation products. The amounts and composition of the molecules vary from region to region and from country to country, depending on the indigenous vegetation and the drugs, pesticides and chemicals approved for local use.
“Today, scientists can identify at most a few hundred of these thousands of molecules in routine analyses – and often only in specialized laboratories,” explained Prof. Thomas Letzel, from the Chair of Urban Water Systems Engineering at Technische Universität München (TUM). “Yet many labs already have the technology to carry out these analyses – even non-specialized control labs. The problem usually lies in the lack of strategic solutions for assessing the results.”
The database was developed in the context of the “RISK-IDENT” project funded by the German Federal Ministry of Education and Research (BMBF). Over 8,000 molecule profiles have already been stored in a public database for future analysis via the FOR-IDENT project . Completed in March 2015, the database now contains over 8,000 substances, together with their key chemical and physical characteristics. The database includes REACH-registered industrial chemicals, approved pharmaceuticals, pesticides and other substances from everyday products used by humans. It also lists degradation products found in the environment, like metabolites or transformation products.
Using the data, screening laboratories can identify unknown molecules faster. The technology deployed is referred to as non-target screening and generates “molecular fingerprints” that reflect the polarity and molecular mass of each identified molecule. “The properties stored in the database will now enable testers to identify a large number of previously unknown molecules, even in non-target screenings,” Prof. Letzel continued.
Database to be extended worldwide
The follow-up project “FOR-IDENT”, which is funded by the BMBF until 2017, NOW aims to extend the database to include locally approved and utilized chemicals in the respective locations. The scientists also hope to bundle and harmonize all internationally used evaluation strategies. In order to enable this the project will include the manufacturers of analytical instruments, as well as laboratories around the globe.
An open software platform in which the different evaluation strategies are combined and linked will evolve over the project lifespan. The open-access approach will ensure that companies, authorities and scientific institutions will have long-term, free and unlimited access to the evaluation tools and databases.
Data from measurements carried out by water analysts will remain available for future evaluations. This has a number of advantages. For example, when information is added to the database or new evaluation strategies are developed, previously taken samples must not be analyzed anew – the acquired data can retrospectively be analyzed.
Page 6
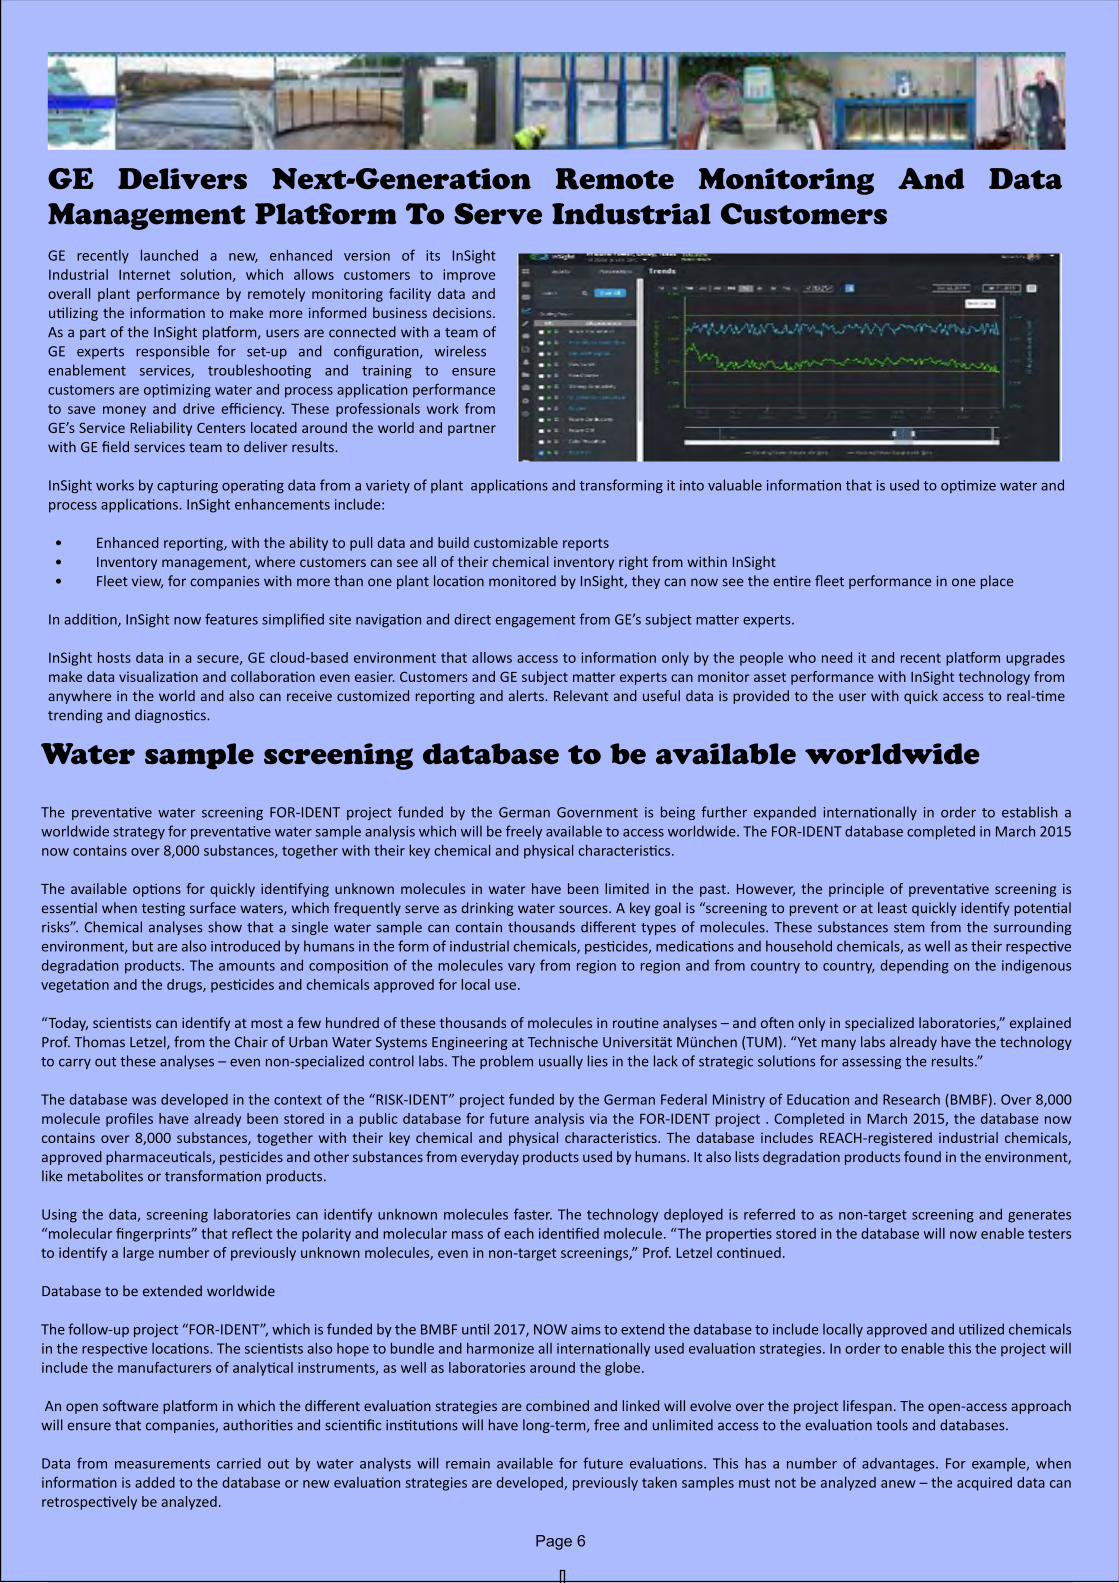
GE Delivers Next-Generation Remote Monitoring And Data Management Platform To Serve Industrial CustomersGE recently launched a new, enhanced version of its InSight Industrial Internet solution, which allows customers to improve overall plant performance by remotely monitoring facility data and utilizing the information to make more informed business decisions. As a part of the InSight platform, users are connected with a team of GE experts responsible for set-up and configuration, wireless enablement services, troubleshooting and training to ensure customers are optimizing water and process application performance to save money and drive efficiency. These professionals work from GE’s Service Reliability Centers located around the world and partner with GE field services team to deliver results.
InSight works by capturing operating data from a variety of plant applications and transforming it into valuable information that is used to optimize water and process applications. InSight enhancements include:
• Enhanced reporting, with the ability to pull data and build customizable reports• Inventory management, where customers can see all of their chemical inventory right from within InSight• Fleet view, for companies with more than one plant location monitored by InSight, they can now see the entire fleet performance in one place
In addition, InSight now features simplified site navigation and direct engagement from GE’s subject matter experts.
InSight hosts data in a secure, GE cloud-based environment that allows access to information only by the people who need it and recent platform upgrades make data visualization and collaboration even easier. Customers and GE subject matter experts can monitor asset performance with InSight technology from anywhere in the world and also can receive customized reporting and alerts. Relevant and useful data is provided to the user with quick access to real-time trending and diagnostics.
Malvern Instruments develop online Zeta Potential analyser
Drone technology used on £4.8m Yorkshire Water scheme
Drone technology has been used as part of a £4.8 million project to replace a Yorkshire Water water treatment works with new clean water pipeline and two new pumping stations.
YW Drone in the air 22The company’s water treatment works in West Stonesdale needs to be replaced and the most effective solution is to replace it with a new clean water pipeline and two new pumping stations.
Yorkshire Water’s contractors, Morrison Utility Services (MUS) are carrying out the work and installing more than 20 km of new water pipe from Reeth to Angram, passing through Healaugh, Low Whita and Gunnerside.
Most of the pipe will be laid in private land and fields but there will be some road crossings, where traffic management will be used for safety reasons.
Unmanned Air Vehicles or drones were trialled by MUS whilst investigating the route of the new pipeline. Investigating private land can be a very time con-suming process and the pipeline route presented the team with a number of engineering issues including four crossings of the River Swale and 13 crossings of other water courses, none of which could be viewed from with Google Earth or from the highways which were located too far away.
Mike West, MUS Construction Manager said:
“Drones have minimised the physical risks to our employees, allowed us to access unreachable locations at speed, and enabled us to take aerial images, ex-tract the terrain slope, aspect and ruggedness and see things in a range of ways. All of this was very useful when designing the new pipeline and we’ve seen enough from this trial to suggest drones can play an extremely beneficial role in future projects.”
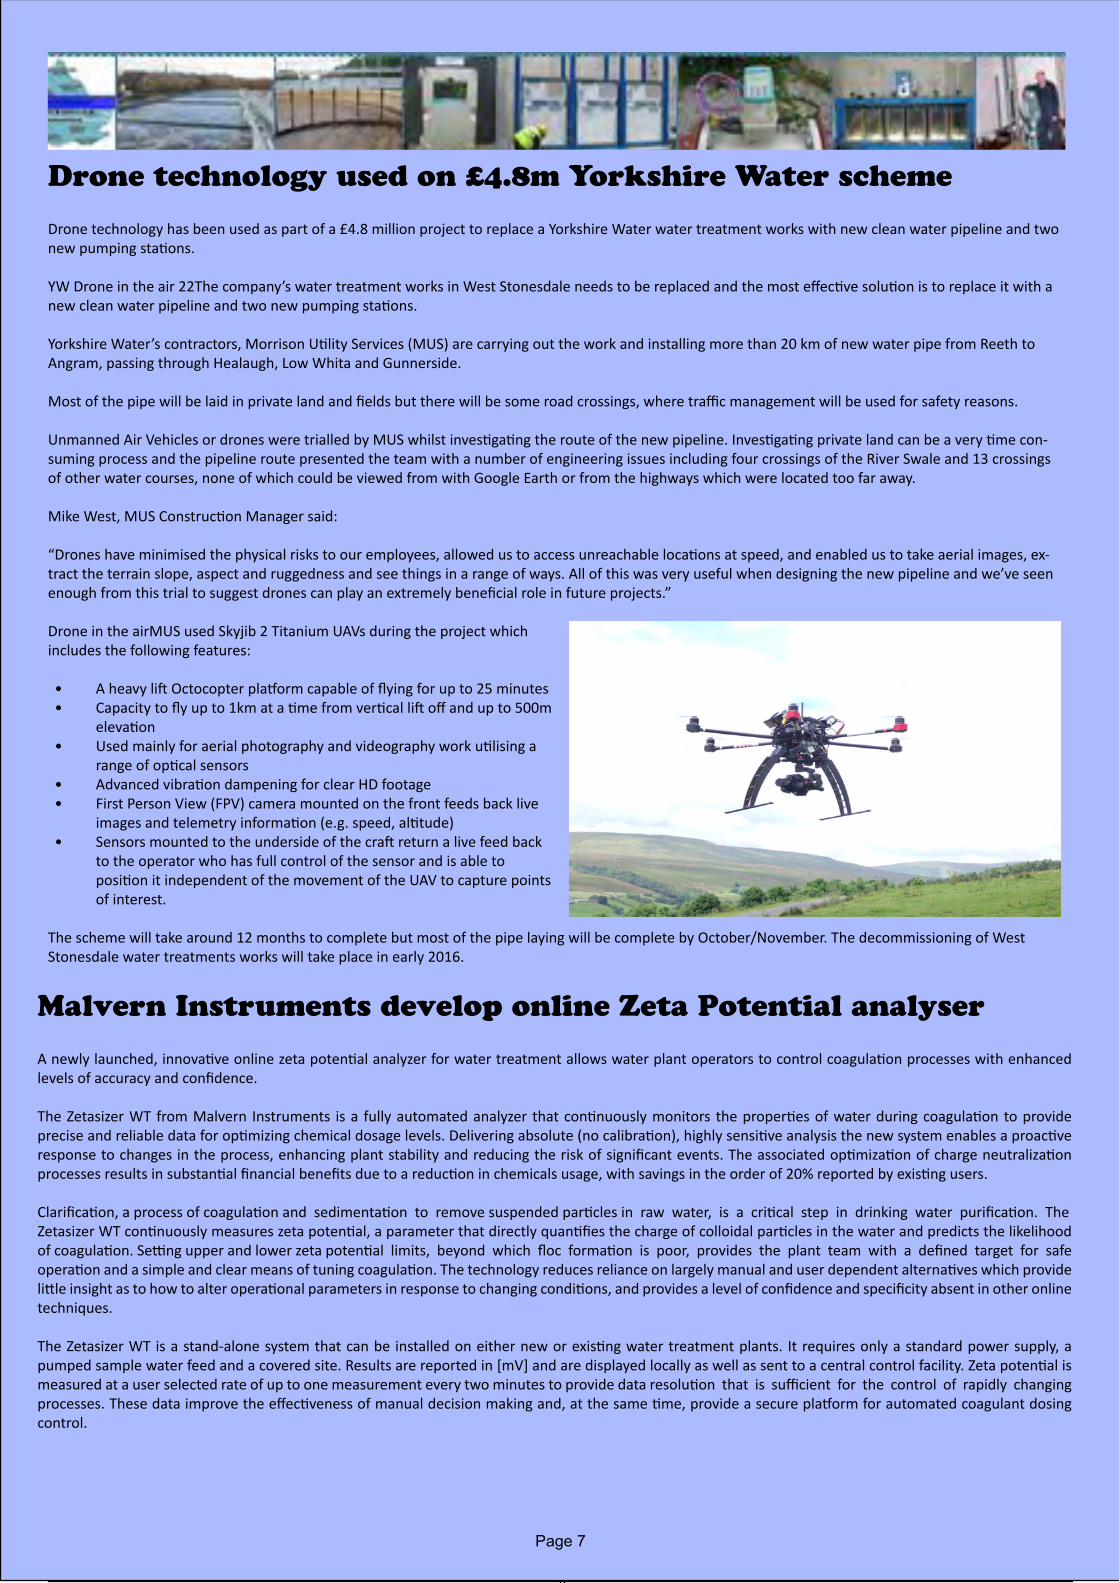
Drone in the airMUS used Skyjib 2 Titanium UAVs during the project which includes the following features:
• A heavy lift Octocopter platform capable of flying for up to 25 minutes• Capacity to fly up to 1km at a time from vertical lift off and up to 500m elevation• Used mainly for aerial photography and videography work utilising a range of optical sensors• Advanced vibration dampening for clear HD footage• First Person View (FPV) camera mounted on the front feeds back live images and telemetry information (e.g. speed, altitude)• Sensors mounted to the underside of the craft return a live feed back to the operator who has full control of the sensor and is able to position it independent of the movement of the UAV to capture points of interest.
The scheme will take around 12 months to complete but most of the pipe laying will be complete by October/November. The decommissioning of West Stonesdale water treatments works will take place in early 2016.
Page 7
A newly launched, innovative online zeta potential analyzer for water treatment allows water plant operators to control coagulation processes with enhanced levels of accuracy and confidence.
The Zetasizer WT from Malvern Instruments is a fully automated analyzer that continuously monitors the properties of water during coagulation to provide precise and reliable data for optimizing chemical dosage levels. Delivering absolute (no calibration), highly sensitive analysis the new system enables a proactive response to changes in the process, enhancing plant stability and reducing the risk of significant events. The associated optimization of charge neutralization processes results in substantial financial benefits due to a reduction in chemicals usage, with savings in the order of 20% reported by existing users.
Clarification, a process of coagulation and sedimentation to remove suspended particles in raw water, is a critical step in drinking water purification. The Zetasizer WT continuously measures zeta potential, a parameter that directly quantifies the charge of colloidal particles in the water and predicts the likelihood of coagulation. Setting upper and lower zeta potential limits, beyond which floc formation is poor, provides the plant team with a defined target for safe operation and a simple and clear means of tuning coagulation. The technology reduces reliance on largely manual and user dependent alternatives which provide little insight as to how to alter operational parameters in response to changing conditions, and provides a level of confidence and specificity absent in other online techniques.
The Zetasizer WT is a stand-alone system that can be installed on either new or existing water treatment plants. It requires only a standard power supply, a pumped sample water feed and a covered site. Results are reported in [mV] and are displayed locally as well as sent to a central control facility. Zeta potential is measured at a user selected rate of up to one measurement every two minutes to provide data resolution that is sufficient for the control of rapidly changing processes. These data improve the effectiveness of manual decision making and, at the same time, provide a secure platform for automated coagulant dosing control.
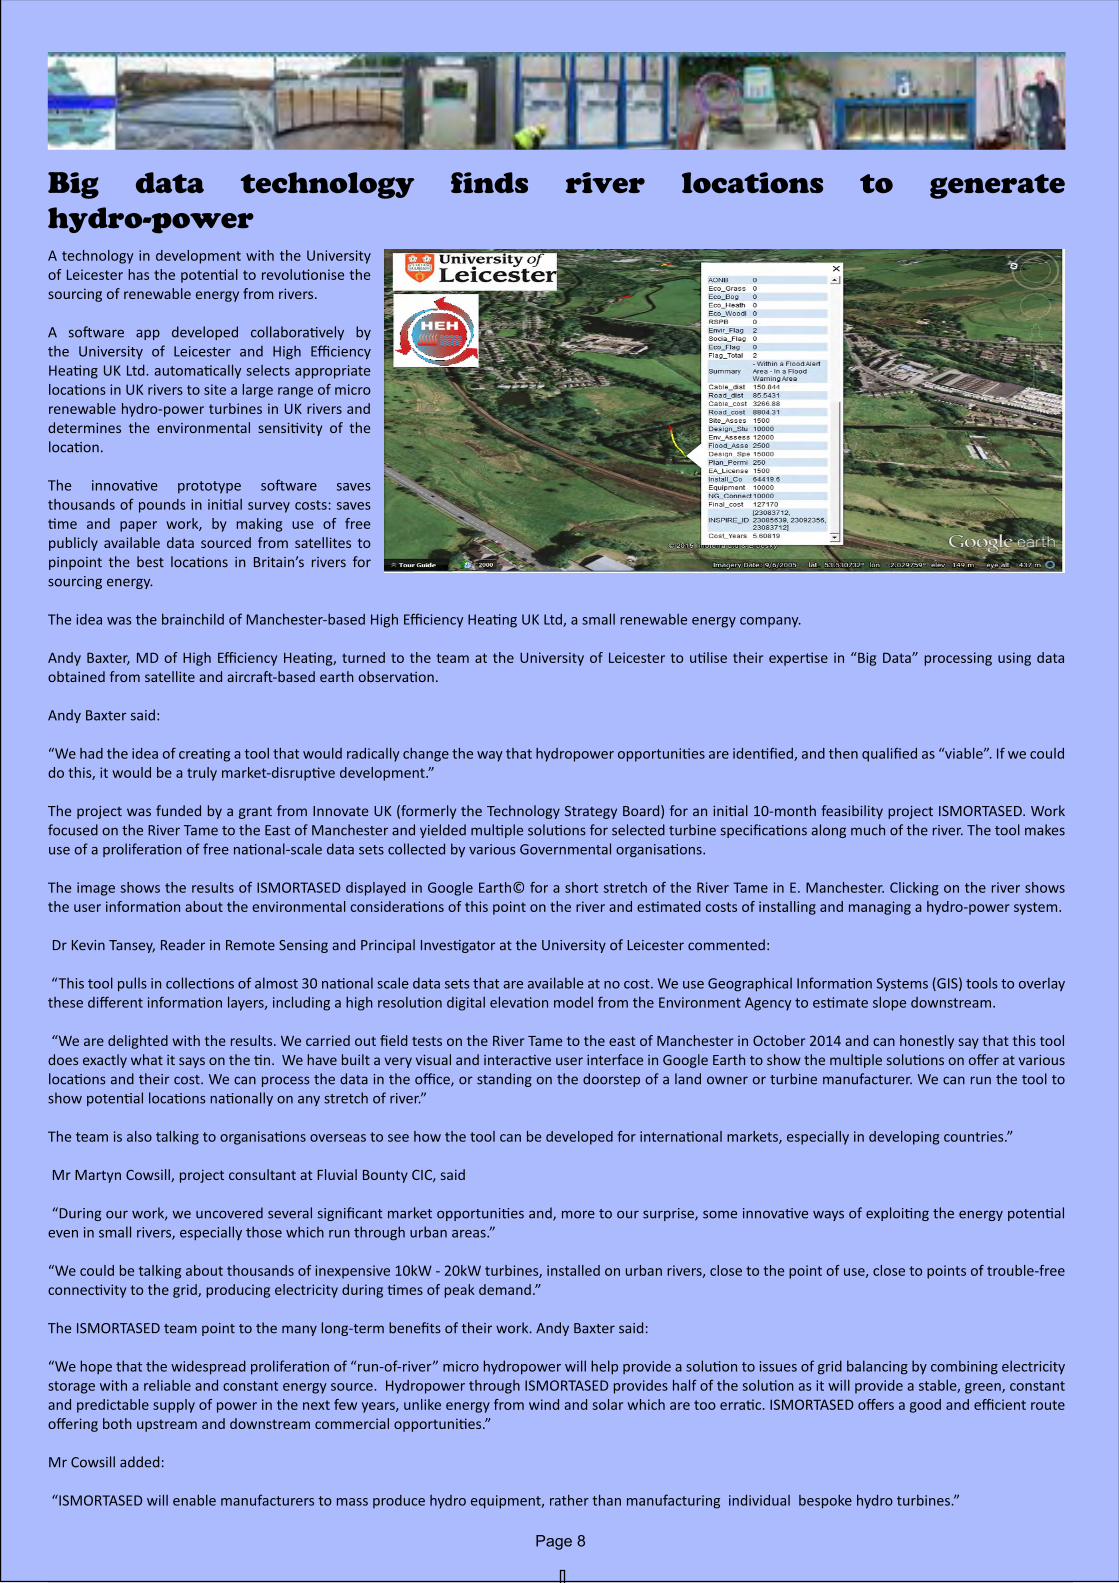
Big data technology finds river locations to generate hydro-powerA technology in development with the University of Leicester has the potential to revolutionise the sourcing of renewable energy from rivers.
A software app developed collaboratively by the University of Leicester and High Efficiency Heating UK Ltd. automatically selects appropriate locations in UK rivers to site a large range of micro renewable hydro-power turbines in UK rivers and determines the environmental sensitivity of the location.
The innovative prototype software saves thousands of pounds in initial survey costs: saves time and paper work, by making use of free publicly available data sourced from satellites to pinpoint the best locations in Britain’s rivers for sourcing energy.
The idea was the brainchild of Manchester-based High Efficiency Heating UK Ltd, a small renewable energy company.
Andy Baxter, MD of High Efficiency Heating, turned to the team at the University of Leicester to utilise their expertise in “Big Data” processing using data obtained from satellite and aircraft-based earth observation.
Andy Baxter said:
“We had the idea of creating a tool that would radically change the way that hydropower opportunities are identified, and then qualified as “viable”. If we could do this, it would be a truly market-disruptive development.”
The project was funded by a grant from Innovate UK (formerly the Technology Strategy Board) for an initial 10-month feasibility project ISMORTASED. Work focused on the River Tame to the East of Manchester and yielded multiple solutions for selected turbine specifications along much of the river. The tool makes use of a proliferation of free national-scale data sets collected by various Governmental organisations.
The image shows the results of ISMORTASED displayed in Google Earth© for a short stretch of the River Tame in E. Manchester. Clicking on the river shows the user information about the environmental considerations of this point on the river and estimated costs of installing and managing a hydro-power system.
Dr Kevin Tansey, Reader in Remote Sensing and Principal Investigator at the University of Leicester commented:
“This tool pulls in collections of almost 30 national scale data sets that are available at no cost. We use Geographical Information Systems (GIS) tools to overlay these different information layers, including a high resolution digital elevation model from the Environment Agency to estimate slope downstream.
“We are delighted with the results. We carried out field tests on the River Tame to the east of Manchester in October 2014 and can honestly say that this tool does exactly what it says on the tin. We have built a very visual and interactive user interface in Google Earth to show the multiple solutions on offer at various locations and their cost. We can process the data in the office, or standing on the doorstep of a land owner or turbine manufacturer. We can run the tool to show potential locations nationally on any stretch of river.”
The team is also talking to organisations overseas to see how the tool can be developed for international markets, especially in developing countries.”
Mr Martyn Cowsill, project consultant at Fluvial Bounty CIC, said
“During our work, we uncovered several significant market opportunities and, more to our surprise, some innovative ways of exploiting the energy potential even in small rivers, especially those which run through urban areas.”
“We could be talking about thousands of inexpensive 10kW - 20kW turbines, installed on urban rivers, close to the point of use, close to points of trouble-free connectivity to the grid, producing electricity during times of peak demand.”
The ISMORTASED team point to the many long-term benefits of their work. Andy Baxter said:
“We hope that the widespread proliferation of “run-of-river” micro hydropower will help provide a solution to issues of grid balancing by combining electricity storage with a reliable and constant energy source. Hydropower through ISMORTASED provides half of the solution as it will provide a stable, green, constant and predictable supply of power in the next few years, unlike energy from wind and solar which are too erratic. ISMORTASED offers a good and efficient route offering both upstream and downstream commercial opportunities.”
Mr Cowsill added:
“ISMORTASED will enable manufacturers to mass produce hydro equipment, rather than manufacturing individual bespoke hydro turbines.”
Page 8
Innovate UK, the government’s innovation agency, is looking to help companies develop innovative products and services that can use all the environmental data collected by government through various agencies.
Innovate UK says that companies are keen to understand how quickly their businesses and the markets they operate in will be affected by environmental change. However, effective planning for disruption of this kind requires a comprehensive understanding of environmental factors.
Through various agencies, government has amassed a large amount of environmental data that businesses could use in managing future risks and exploring opportunities. Data is routinely collected on subjects such as land cover, environmental change, precipitation, farm performance, biodiversity, water flows, geological surveys and marine environment.
Innovate UK is highlighting the fact that integrating these datasets with commercial and societal data can enable innovation in important areas:
•Infrastructure- including built environment and water•Agriculture and food•Energy generation and supply
Innovate has now published a directory showcasing the businesses involved and the feasibility studies it funded in its 2014 ‘Solving business problems with environmental data’ competition. Projects lasted up to 12 months, with a value of up to £200,000. The competition funded 33 feasibility studies with a total of £4 million investment, allowing companies to test their ideas and take them forward.
Water sector applications included:
•A project by Shoothill worked with the Environment Agency data to use Twitter to monitor UK river levels. •BRE led a consortium with AXA Insurance and Lexis Nexis to undertake a project focused on flood technologies. The project developed a database that insurers could use to identify locations where measures were taken to improve properties’ flood resilience. This should allow properties within flood risk areas to obtain affordable levels of insurance.
According to Innovate UK, the feasibility studies it supported, in partnership with the Natural Environment Research Council (NERC), will help businesses to attract further investment for research and development, validation and eventual commercialisation.
Environmental data offers route to water sector innovation
Pulsar’s Global Ultrasonic Capability the Key to Major Australian Contract
As the principal supplier of water, wastewater and drainage services throughout the state of Western Australia, Water Corporation manages more than 100 wastewater treatment plants and over 1,100 pump stations across an area more than a quarter of the size of the USA.
After trials and extensive experience with a wide variety of both contacting and non-contacting alternatives, Water Corporation has chosen UK manufacturer Pulsar Process Measurement to be a preferred supplier of level measurement and control requirements.
The Corporation will use hundreds of Pulsar’s specialist non-contacting ultrasonic sensors and controllers, with technical and sales support from Pulsar’s regional office and Australian distributor.
Since 2012, Water Corporation has installed over 200 Pulsar ultrasonic units, and has recently purchased a further 33046 to install throughout its Perth Metropolitan network. Pulsar’s Australian distributor Bintech is supplying both equipment and know-how through their Western Australian representative John Hoskins of Gateway Technical Services.
With such an extensive network operating in the often extreme conditions of Australia, equipment has to work reliably. Water Corporation undertook a detailed investigation of equipment in use throughout its sites, reviewing and comparing performance. The Corporation was able to identify Pulsar equipment as consistently being a reliable system.
Pulsar has grown to the point that the company is now the leading specialist ultrasonic manufacturer in the world, with non-contacting measurement systems working successfully from the heat of Australia to the cold of Canada, from China to the United States. With regional offices strategically positioned around the world working with an extensive network of trained and accredited distributors, Pulsar can confidently supply and support equipment anywhere in the world.
“Water Corporation’s choice of Pulsar equipment demonstrates the lower support costs and high reliability that we offer, and we are delighted to be able to help them to solve technical issues and provide a high standard of service to the people of Western Australia,” said Pulsar’s Regional Manager Asia Pacific, Colin Murphy.
“Our policy of strongly supporting national specialists such as Bintech/Gateway Technical Services means that users can be absolutely confident of great on-going advice and training wherever they are.”
Page 9

Oliver Grievson is the group manager of the Water Industry Process Automation and Control LinkedIn discussion group . He has many years experience firstly in the laboratory and for the past 12 years in the operational and process management of both potable and wastewater treatment works. He developed a passion for the control of water and wastewater treatment works whilst working for Yorkshire Water in the United Kingdom and decided to share this passion by setting up the WIPAC LinkedIn discussion group.
He is a Fellow of CIWEM & the IES as well as being a Chartered Environmentalist, Scientist and Water & Environmental Manager. He is a member of the MCERTS Steering Group for the monitoring of flow, a member of the ICA Special Interest Group on ICA as well as sitting on the Wastewater Management Committees of the Foundation for Water Research and the Chartered Institute of Water & Environmental Management.
In my day job I have the largest asset base of regulated flow meters in the UK, 693 sites with more or less 800 flow meters. Every now and then somebody says to me - “ What would you feel if we take it all of your hands, install a new asset base and look after everything for you. We’ll then just charge you by the data point.” Invariably I do what most people do in this regard, smile and move on. It will never happen. The question that would challenge me is why? Why I am so closed minded, why is never going to happen? and lastly why not?.
Well the answer to that is actually quite simple - there are complications within the business that allows somebody external to the company access to the data as well as problems with integration with corporate telemetry systems and dare say issues with security. These all exist now though and with the right amount of work and the right amount of assurances all of these things can be worked around. So to ask the question again, why not?
This is where I get out a piece of paper and do some rough calculations which I will share with you now:
In the next ten years I expect my asset base to have a management value of approximately £11 million, this includes
• External verification by an independent party that is required under law• A replacement cost for every single flow meter device• Maintenance by an internal electrical maintenance technician• Regularly checking by an internal operational member of staff including cleaning of the flow meter• Potentially external contractor to come in and clean electro-magnetic flow meters• My management time of the asset base• Potentially the complete replacement of the primary device (the flume or weir)• 15 minute communication with the corporate telemetry system• Daily data validation through the corporate data validation engine and alert system to raise where there are problems• Somebody to manage the daily alert system and raise the necessary jobs to ensure the flow meter is working• Somebody in the field to react to those jobs and fix the problems
This is, to put it mildly, quite a list of things that need to be done on a daily basis to react to maintain the regulated flow data. So my next question is whether or not this can be done by an external party cheaper than it can be done in-house and in such a way that the supplier can make money so that they are financially stable throughout the 10 years that I would likely employ him for. Can it be achieved for less than £11million. Invariably my answer is no.
The natural answer of course to these thoughts are.....of course we can but let’s analyse the case even further and look at a cost per day and a cost per piece of data. Crudely if £11 million is split to cover all assets on all sites then the answer comes out at £3.77 per site per day or just under 4p per piece of data which includes all of the above services (for those of you who work annually its £1,375 per year. There are some out there who will quite happily say that this very achievable but I would hazard a guess that they are factoring in the fact that they will not have to encounter any civil work of replacement flumes, replacement weir plates and replacement chambers.
So what happens when I re-run the figures with all of the civil costs removed? The figure then drops to £1.20 per day or just over 1 p per piece of data (or £438 per year). If you take out the replacement cost of the flow meter after a 10 year period it further drops to £0.51, just over 0.5 penny per piece of data or £186 per year. This sort of financial value starts to look dubious in terms of what can actually be afforded considering that some sites would need to be visited at least once per month for the primary device to be cleaned and once a year for maintenance to be carried out on the flow meter itself.
For flow meters. for me at least, I am unconvinced that it can economically be done and for my supplier to happy to make a profit.
Putting the finance aside for a minute though there is one last barrier in the way and that is who takes responsibility when the flow meter is wrong? The answer here is of course that a properly installed flow meter is never wrong. One that has been installed correctly and is quietly maintained is never going to be wrong. Unless somebody has fiddled with it, done something to it which is beyond the control of the contractor. Which is partly true and of course on wastewater treatment works there is always something to cause error for a flow meter and this can have huge consequences that are often not appreciated.
I have seen in the few years that I have been dealing with flow meters errors ranging up to many factors above the flow meters range, these are the easy ones and invariably I end up with my trusty measuring stick and end up repairing things. What is trickier is the ones that are out by 10-20%, is it error of is it growth. If its growth then is a growth scheme needed. With a growth scheme the standards tighten and suddenly that 10-20% costs £3-4 million, all because the flow meter was wrong for some reason. Who bears the cost? Who holds the professional indemnity?
Can I really expect this of somebody who is looking after the flow meters.......what do you think?
Opinion
To buy or not to buy: is it better to rent your data?
Page 10
Opinion
The role of Instrumentation, control and automation in
maintenance reliability
In my previous article I addressed the importance of ICA in the maintaining the long term stewardship and integrity of asset equipment. In this article the use of ICA to evaluate condition and performance of equipment as part of operational maintenance inspections (OMI ) is discussed.
Asset risk criticality is defined by the various equations linking the mode of failure, effect of failure, impact, and significance of failure and in terms of ICA the presence of equipment for detectability. Examples of detectability may be on line vibration sensors or calibrated functional pressure or temperature sensors used for rotating equipment. The presence of these instruments as part of the data analytics in monitoring the status and performance of plant provides the information for work triggers or intervention standards such as maintenance and renewal / rehabilitation intervention levels.
The role of ICA in maintenance reliability contributes to the overall tasks for perform analyses of asset criticality, condition, performance, failure risk, life cycle cost requirements, and determining relative priorities for maintenance and capital renewal expenditure over the forward life of the asset. ICA as a tool using information from sensors as mentioned above provides the capture, not only of asset condition and performance data, but also maintenance cost histories by location at the equipment or component level. With a better understanding of risk associated with the changing condition of the assets, levels of service can be fine-tuned and adjusted accordingly. Effective condition deterioration prediction underpins proactive asset management programs and enables whole life cycle costs to be optimized using economic analysis. Current condition information along with knowledge of future service demand is an input to the prediction of the future state of the assets, thus facilitating multi-year financial analysis and long term planning and budget allocation.
Without delving into the science of asset management it is worth mentioning the overall evolution process of maintenance management from reactive, time based, condition to risk based approaches. For further information there is a plethora of excellent guidance, standards, institutes and associations relating to asset management tools but the basic role in maintenance systems to support asset management depends on the status of the evolution of maintenance systems. Underpinning this is the use of ICA and hence it can be seen that the status of ICA whether defined by the use of instruments or any technique involving control / SMART systems is of importance in achieving and sustaining improvements in maintenance performance.
Finally the assessing the status of ICA available within plants and facilities may be the first step in developing the road maps for establishing optimization / improvement programmes.
Starting with Operation Maintenance Inspections (OMI) and utilizing basic information such as pressure, temperature sensors through to advanced devices such as real time solutions providing two way communication (i.e. power monitors etc.) it is clear that synergizing the integration of operation, process control and maintenance strategies through a well-developed ICA plan is paramount for developing and optimising the efficiency and effectiveness of assets.
Put in another other way assessing the state and effectiveness of instrumentation at the full hierarchy level from the very ground level within the plant rooms to the next levels of reporting within control or management board rooms, the use of data analytics showing real time or otherwise reporting of normal and abnormal events , is a key tool for setting continuous or periodic quantitative and qualitative assessment of actual plant performance against specific targets linking maintenance reliability and operational excellence to total asset management strategies.
Using ICA to monitor both the performance of physical assets and their adequacy, sustainability, associated risks is necessary to drive a continuous cycle of review, corrective action and improvement.
The author of this is Farooq Janjua - who works as Project Manager in the Operations and Maintenance Department of a Major Leading Middle East Utility Company. The views are entirely his own.
He has also authored the handbook on process safety integrity for water and waste water utility operators which is downloadable free of charge from the International Water Association web site.
Page 11
Article:
Do I really need a new flow meter? - The need for innovation in flow
monitoring in the Water Industry
The measurement of flow in the wastewater industry is fundamental to the way the industry both operates and is regulated. We rely on it to find out how much flow is passing through the treatment works, how much is passing out to storm and this all in turn protects the environment and what quality standards of the receiving watercourse.
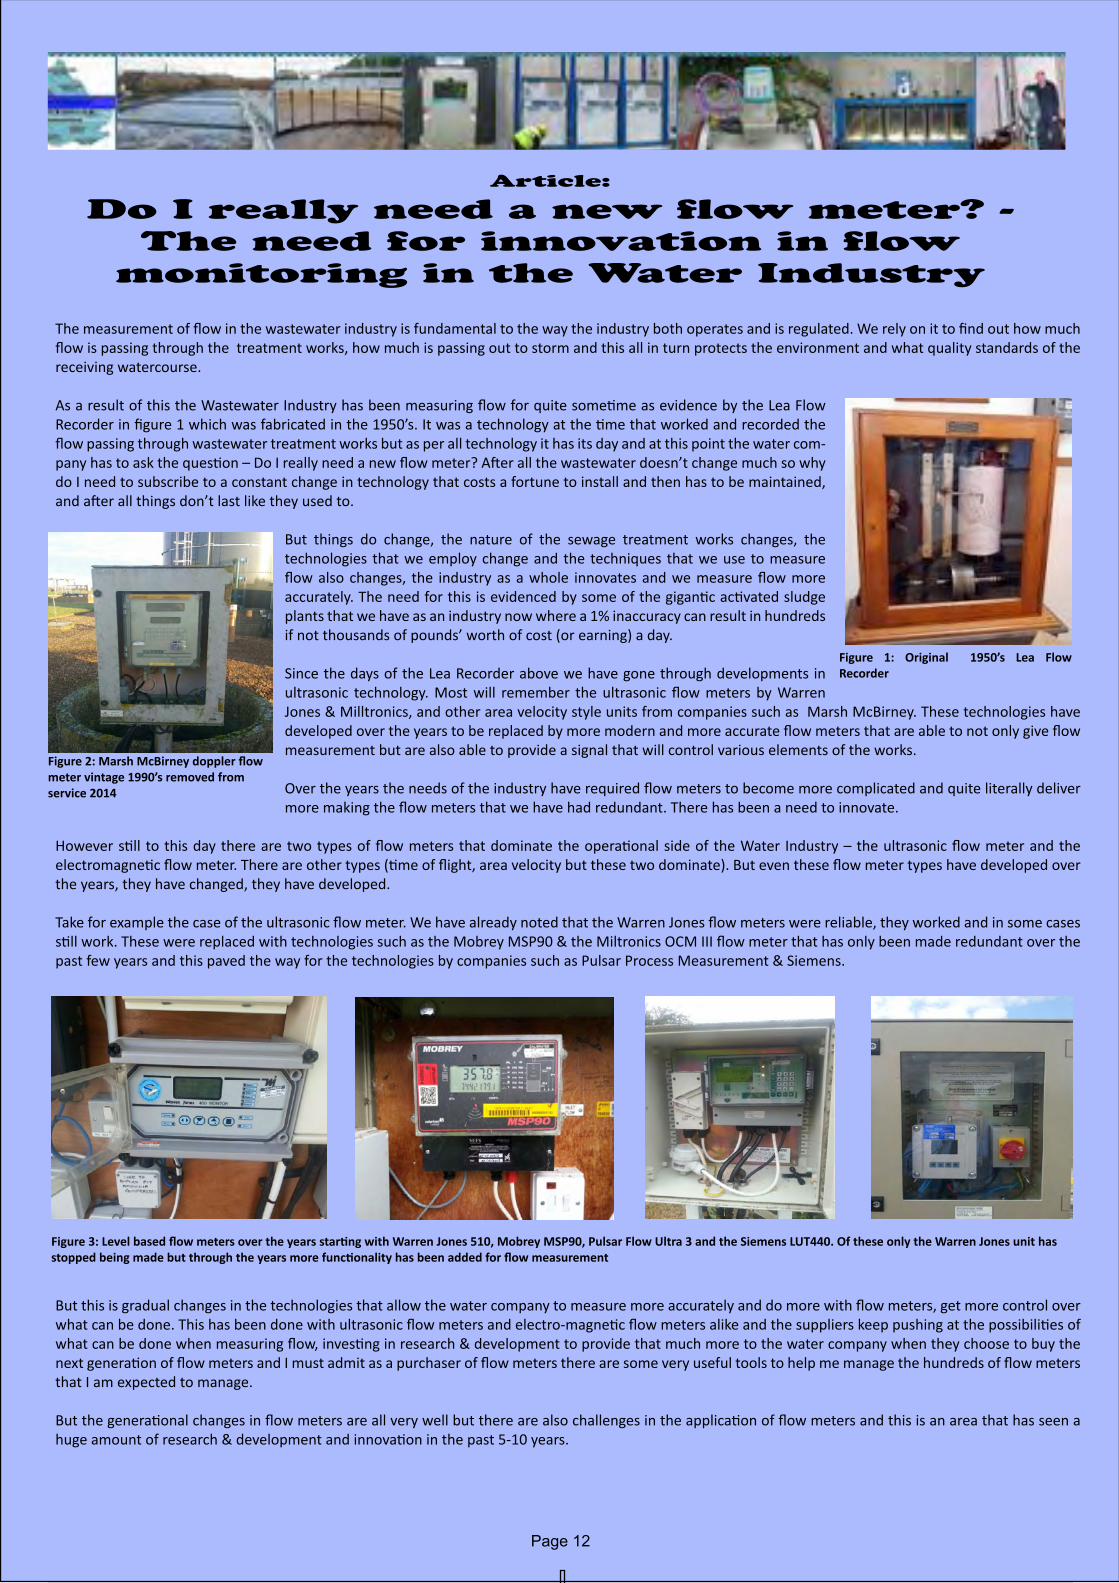
As a result of this the Wastewater Industry has been measuring flow for quite sometime as evidence by the Lea Flow Recorder in figure 1 which was fabricated in the 1950’s. It was a technology at the time that worked and recorded the flow passing through wastewater treatment works but as per all technology it has its day and at this point the water com-pany has to ask the question – Do I really need a new flow meter? After all the wastewater doesn’t change much so why do I need to subscribe to a constant change in technology that costs a fortune to install and then has to be maintained, and after all things don’t last like they used to.
But things do change, the nature of the sewage treatment works changes, the technologies that we employ change and the techniques that we use to measure flow also changes, the industry as a whole innovates and we measure flow more accurately. The need for this is evidenced by some of the gigantic activated sludge plants that we have as an industry now where a 1% inaccuracy can result in hundreds if not thousands of pounds’ worth of cost (or earning) a day.
Since the days of the Lea Recorder above we have gone through developments in ultrasonic technology. Most will remember the ultrasonic flow meters by Warren Jones & Milltronics, and other area velocity style units from companies such as Marsh McBirney. These technologies have developed over the years to be replaced by more modern and more accurate flow meters that are able to not only give flow measurement but are also able to provide a signal that will control various elements of the works.
Over the years the needs of the industry have required flow meters to become more complicated and quite literally deliver more making the flow meters that we have had redundant. There has been a need to innovate.
However still to this day there are two types of flow meters that dominate the operational side of the Water Industry – the ultrasonic flow meter and the electromagnetic flow meter. There are other types (time of flight, area velocity but these two dominate). But even these flow meter types have developed over the years, they have changed, they have developed.
Take for example the case of the ultrasonic flow meter. We have already noted that the Warren Jones flow meters were reliable, they worked and in some cases still work. These were replaced with technologies such as the Mobrey MSP90 & the Miltronics OCM III flow meter that has only been made redundant over the past few years and this paved the way for the technologies by companies such as Pulsar Process Measurement & Siemens.
But this is gradual changes in the technologies that allow the water company to measure more accurately and do more with flow meters, get more control over what can be done. This has been done with ultrasonic flow meters and electro-magnetic flow meters alike and the suppliers keep pushing at the possibilities of what can be done when measuring flow, investing in research & development to provide that much more to the water company when they choose to buy the next generation of flow meters and I must admit as a purchaser of flow meters there are some very useful tools to help me manage the hundreds of flow meters that I am expected to manage.
But the generational changes in flow meters are all very well but there are also challenges in the application of flow meters and this is an area that has seen a huge amount of research & development and innovation in the past 5-10 years.
Figure 1: Original 1950’s Lea Flow Recorder
Figure 2: Marsh McBirney doppler flow meter vintage 1990’s removed from service 2014
Figure 3: Level based flow meters over the years starting with Warren Jones 510, Mobrey MSP90, Pulsar Flow Ultra 3 and the Siemens LUT440. Of these only the Warren Jones unit has stopped being made but through the years more functionality has been added for flow measurement
Page 12
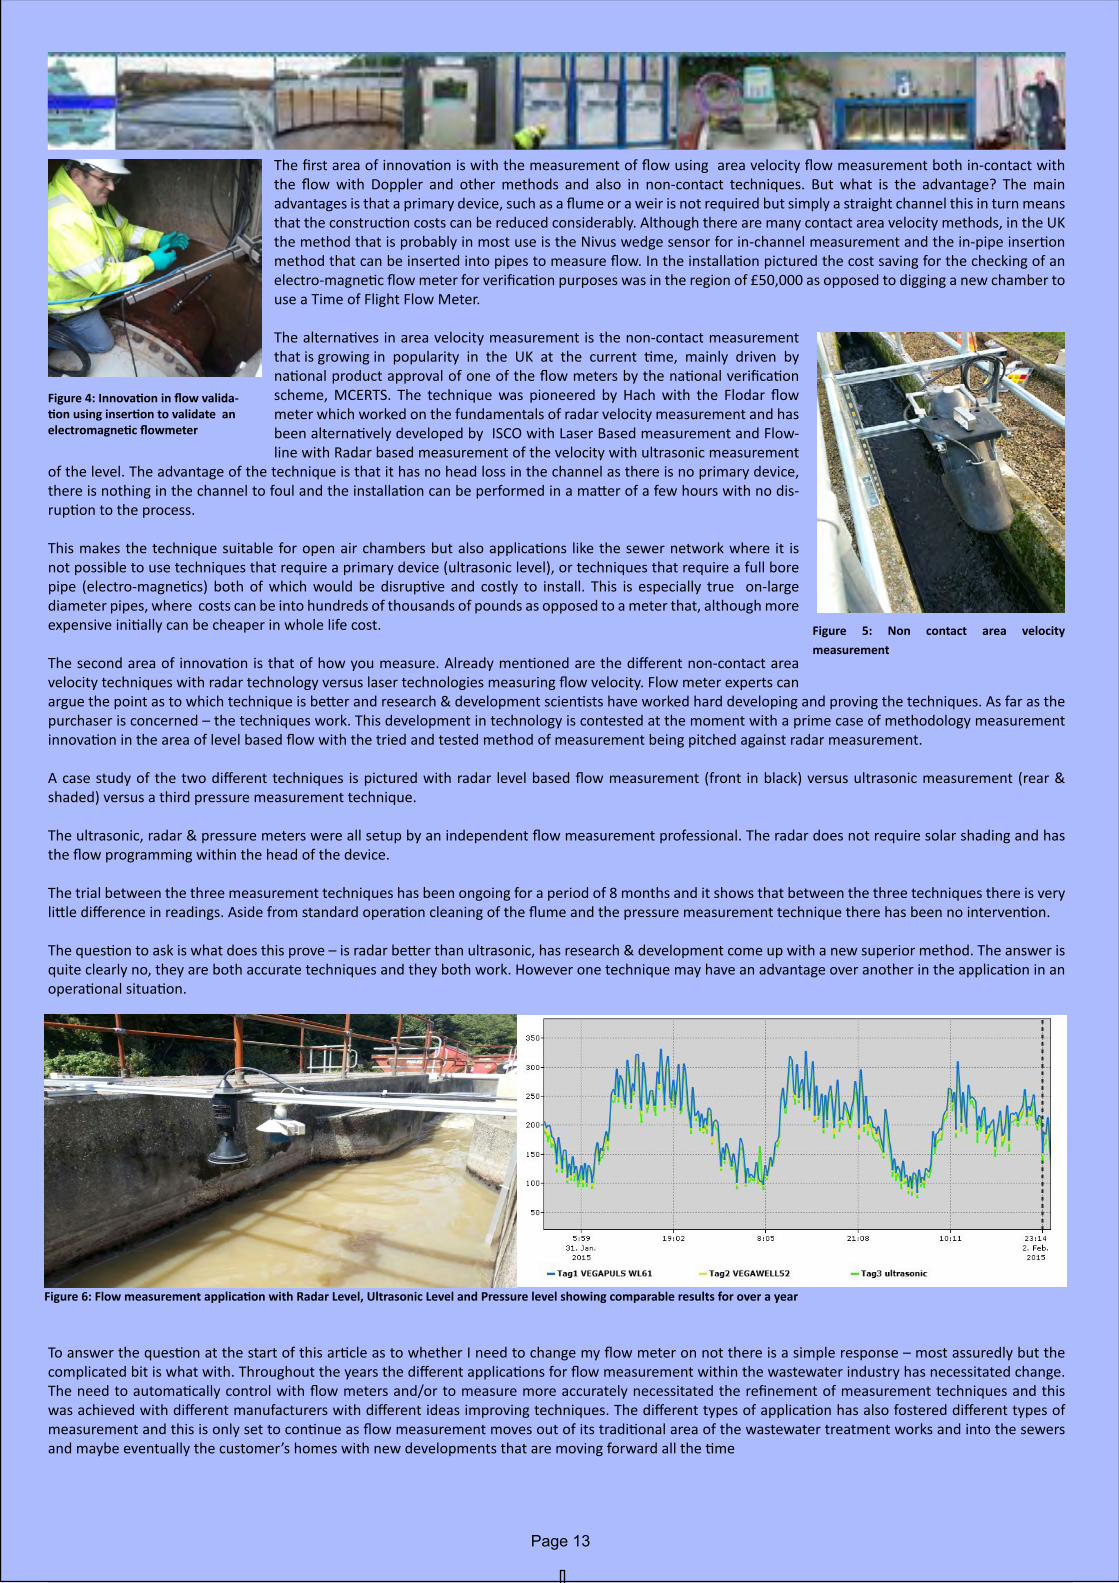
The first area of innovation is with the measurement of flow using area velocity flow measurement both in-contact with the flow with Doppler and other methods and also in non-contact techniques. But what is the advantage? The main advantages is that a primary device, such as a flume or a weir is not required but simply a straight channel this in turn means that the construction costs can be reduced considerably. Although there are many contact area velocity methods, in the UK the method that is probably in most use is the Nivus wedge sensor for in-channel measurement and the in-pipe insertion method that can be inserted into pipes to measure flow. In the installation pictured the cost saving for the checking of an electro-magnetic flow meter for verification purposes was in the region of £50,000 as opposed to digging a new chamber to use a Time of Flight Flow Meter.
The alternatives in area velocity measurement is the non-contact measurement that is growing in popularity in the UK at the current time, mainly driven by national product approval of one of the flow meters by the national verification scheme, MCERTS. The technique was pioneered by Hach with the Flodar flow meter which worked on the fundamentals of radar velocity measurement and has been alternatively developed by ISCO with Laser Based measurement and Flow-line with Radar based measurement of the velocity with ultrasonic measurement
of the level. The advantage of the technique is that it has no head loss in the channel as there is no primary device, there is nothing in the channel to foul and the installation can be performed in a matter of a few hours with no dis-ruption to the process.
This makes the technique suitable for open air chambers but also applications like the sewer network where it is not possible to use techniques that require a primary device (ultrasonic level), or techniques that require a full bore pipe (electro-magnetics) both of which would be disruptive and costly to install. This is especially true on-large diameter pipes, where costs can be into hundreds of thousands of pounds as opposed to a meter that, although more expensive initially can be cheaper in whole life cost.
The second area of innovation is that of how you measure. Already mentioned are the different non-contact area velocity techniques with radar technology versus laser technologies measuring flow velocity. Flow meter experts can argue the point as to which technique is better and research & development scientists have worked hard developing and proving the techniques. As far as the purchaser is concerned – the techniques work. This development in technology is contested at the moment with a prime case of methodology measurement innovation in the area of level based flow with the tried and tested method of measurement being pitched against radar measurement.
A case study of the two different techniques is pictured with radar level based flow measurement (front in black) versus ultrasonic measurement (rear & shaded) versus a third pressure measurement technique.
The ultrasonic, radar & pressure meters were all setup by an independent flow measurement professional. The radar does not require solar shading and has the flow programming within the head of the device.
The trial between the three measurement techniques has been ongoing for a period of 8 months and it shows that between the three techniques there is very little difference in readings. Aside from standard operation cleaning of the flume and the pressure measurement technique there has been no intervention.
The question to ask is what does this prove – is radar better than ultrasonic, has research & development come up with a new superior method. The answer is quite clearly no, they are both accurate techniques and they both work. However one technique may have an advantage over another in the application in an operational situation.
To answer the question at the start of this article as to whether I need to change my flow meter on not there is a simple response – most assuredly but the complicated bit is what with. Throughout the years the different applications for flow measurement within the wastewater industry has necessitated change. The need to automatically control with flow meters and/or to measure more accurately necessitated the refinement of measurement techniques and this was achieved with different manufacturers with different ideas improving techniques. The different types of application has also fostered different types of measurement and this is only set to continue as flow measurement moves out of its traditional area of the wastewater treatment works and into the sewers and maybe eventually the customer’s homes with new developments that are moving forward all the time
Figure 4: Innovation in flow valida-tion using insertion to validate an electromagnetic flowmeter
Figure 5: Non contact area velocity measurement
Figure 6: Flow measurement application with Radar Level, Ultrasonic Level and Pressure level showing comparable results for over a year
Page 13
Article:
Catching up with Catchment Monitoring
Flooding versus droughts. Water issues have affected the UK and been the focus of the media recently. However, it is not just the volume of available water in catchments which matters - the quality of natural waters also affects their ecological health, recreational value and the amount of treatment needed to make water potable. Our catchments are under pressure from agriculture, industry and climate change. With the second cycle of action plans to manage water catchments across Europe due to commence in September 2015, it is timely to take stock of some of the technology which has been used to monitor catchments and potential future technology developments.
So which sensors are currently used for catchment monitoring? What kinds of new monitoring technologies are under development for the future? What can be achieved using the knowledge gained about sources of pollution in catchments? And how will our understanding of inputs to catchments improve over time? The Sensors for Water Interest Group (SWIG) held a workshop on 18 March 2015 at Rothamsted Research, North Wyke to bring together specialists in the field of water monitoring in catchments and address all of these questions.
The toolbox of technology for catchment monitoring includes sensors for monitoring water level, flow and water quality; automatic samplers and integrated wireless telemetry can be useful for transmission of results as explained by Wavelength Environmental. Monitoring equipment needs to be low maintenance, require low power input and have a small ecological footprint. The choice of sensors will of course depend upon the monitoring requirements and budget of each end user.
The West Country Rivers Trust (WRT) have used monitoring or a combination of monitoring and modelling to investigate reasons for failure (RFF) under the Water Framework Directive by producing a detailed assessment of status and identifying key pressures on a catchment and sources of pollution. On the Fingle Brook on the Upper Teign, by taking sediment samples as well as water quality monitoring, they were able to ascertain that: there was a clear gradient of lead below road drains (above the environmental quality standard for lead), contamination was bound to sediment creating a legacy of lead being released in addition to chronic inputs from a historical mining site, and there was evidence of an early flush of solutes below road drains. Improving the functioning of the existing attenuation wetland helped address these issues.
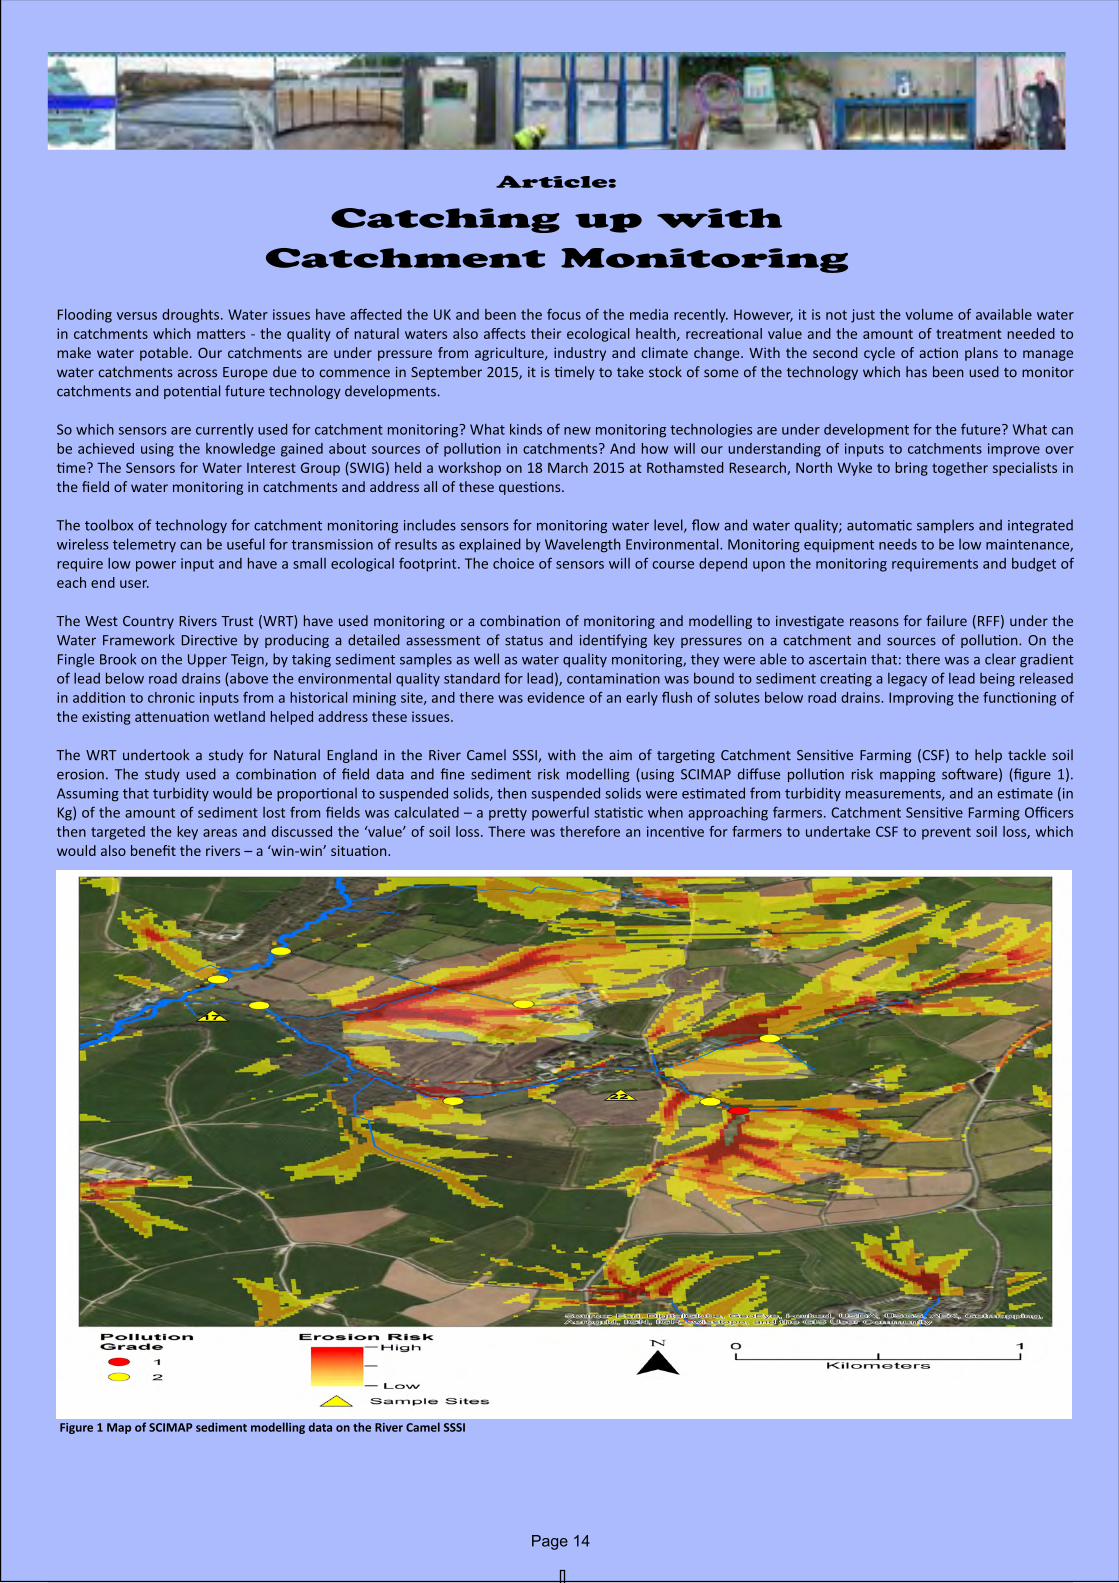
The WRT undertook a study for Natural England in the River Camel SSSI, with the aim of targeting Catchment Sensitive Farming (CSF) to help tackle soil erosion. The study used a combination of field data and fine sediment risk modelling (using SCIMAP diffuse pollution risk mapping software) (figure 1). Assuming that turbidity would be proportional to suspended solids, then suspended solids were estimated from turbidity measurements, and an estimate (in Kg) of the amount of sediment lost from fields was calculated – a pretty powerful statistic when approaching farmers. Catchment Sensitive Farming Officers then targeted the key areas and discussed the ‘value’ of soil loss. There was therefore an incentive for farmers to undertake CSF to prevent soil loss, which would also benefit the rivers – a ‘win-win’ situation.
Figure 1 Map of SCIMAP sediment modelling data on the River Camel SSSI
Page 14

Looking to the future, Alex Taylor, Data, Evidence and Communication Team, West Country Rivers Trust said:
“In future we would like to improve the spatial resolution of our monitoring in a cost effective way, so low cost sensors and sampling devices would be valua-ble to us. We are exploring the use of cheap and easy to use passive samplers, for example ChemCatcherTM (developed by the University of Portsmouth), to help identify pollution hotspots. With regard to sensors, in future, the ultimate aim would be to place a dense network of low cost sensors, potentially at the farm-scale, to measure some basic parameters such as conductivity and turbidity. From this we would like to engage stakeholders using live data feeds, and citizen science apps (such as that being developed by Dr Liz Bagshaw (Cardiff University)) so that people can both download real-time data and upload their own monitoring data. We hope that this will increase public awareness of catchment systems and provide a sense of ownership and interest in the quality of natural waters.”
Tryptophan fluorometers are one new technology which the WRT have tried out. This relatively new technology shows good potential for measuring organic pollution (see box). Wherever there is organic pollution there will likely be microbial communities, and the cell walls and waste products of microbes contain the amino acid Tryptophan (Tryp). In theory tryptophan readings should therefore correlate well with bacterial load and other parameters such as BOD, ammonia and phosphate.
Adam Gilbert at the Environment Agency (EA) has been trialling the use of tryp flurometers and presented examples of successful deployments including investigating the source of a sewage pollution incident (Menalhyl), investigating the source of a phosphate failure (Seaton) and for inferring bacterial loads and linking this with bathing water alarms at a seaside resort (Porthluney). The results were promising, and Adam Gilbert (EA) said that fluorometers are particularly useful to identify point sources of pollution and for triggering pollution alarms.
However, the EA found challenges associated with freshwater applications of fluorometers. For example in terms of the sensitivity of the fluorometers. Tryp would only be picked up in very polluted samples (more 24,000 bacteria per 100ml), so Adam Gilbert (EA) thought that a fluorometer would not currently be useful at lower levels of organic pollution where there are lots of other factors involved. Also turbidity can cause a ‘quenching’ effect on the Tryp measured – if turbidity increases above 250 NTU then Tryp decreases even during a pollution event. In this case monitoring for ammonia would pick up the pollution event, but measuring Tryp would not. The EA found that light interference affected the measurement of Tryp, so there is a definite need for a cover or cap over the sample. The guard for the fluorometer was susceptible to getting fouled by rags, seaweed etc which stopped the sample from flowing through, this could be addressed by regular checking or removing the guard, guarding from light but still allowing the sample through. Further to this. particulates caused interference with the measurement of Tryp, but this could be remedied by the use of a 100 μ filter (tights!) over the sensor to prevent particulates from getting through. Of particular concern was the fact that there was interference from other parameters and other fluorescent substances for example Optical Brightening Agents (OBAs). Temperature may also affect the measurement of Tryp as the literature states that the higher the temperature the lower the Tryp measured. Finally, the Adam Gilbert (EA) said there was a need for a common unit of measurement for fluorometers, as currently different fluorometers use different units and the data is not directly comparable.
Some solutions to the above issues were suggested during the workshop. A specialist UK sensor manufacturer has recently adopted a fluorescence standardisation procedure in-house which could be used more widely. Rather than reporting fluorescence in units of ppb of a particular compound, the fluorescence can be reported in Quinine Sulphate Units (QSU). 1 QSU is equivalent to the fluorescence recorded from 1 ppm quinine sulphate (a certified reference standard for fluorescence) at an excitation wavelength of 347.5 nm and an emission wavelength of 450 nm. To aid with CDOM background assessment, the sensor manufacturer has developed a two fluorometer solution, consisting of Uvilux Tryptophan and CDOM fluorometers. The manufacturer in question has found that with two fluorometers, taking a ratio of the Tryptophan:CDOM fluorescence signal effectively ‘smooths out’ variations in CDOM background, providing a more stable fluorescence baseline above which Tryptophan anomalies can be detected. The ratio also helps to prevent the problems with ‘quenching’ caused by turbidity identified above.
“Fluorometers show great potential for monitoring organic pollution. They are certainly useful for catchment walkovers and pollution alarms” said Adam Gilbert, Technical Specialist in water quality monitoring at the Environment Agency. “However, some work needs to be done on increasing their sensitivity and finding solutions to the other problems we encountered. It would be really useful to have a standardised unit of measurement for fluorometers, so that results from different fluorometers could be compared. Fluorometers should be marketed honestly as to what they can and can’t do - including their limitations, otherwise end users will lose confidence in them.”
Another interesting development which could be of interest to end users such as the River Trusts were two wireless sensors which could meet the panacea of a low cost method for monitoring at high spatial resolution. The sensors currently being adapted for use monitoring rivers, have until now have been used to monitor glaciers by Cardiff University. By incorporating water quality sensors (temperature, pressure and electrochemical sensors) and wireless technology into a small plastic ‘egg’ case monitoring can be undertaken in formerly inaccessible locations and data acquired remotely using radio transmission, including long term datasets and high spatial resolution. There are two protypes which have been developed: ‘E-Tracers’ - buoyant sensors the size of a Christmas bauble which collect data along a flowpath, and the ‘Cryoegg’ for long term deployments in situ – a larger platform with multiple sensors (as needed) and a larger transmitter. Both types would need to be recovered after use to prevent causing their own environmental problem of waste plastic and components. There is potential for these sensors to be used for citizen science with the public accessing the monitoring data from nearby sensors via their mobile phone. There are currently trials of the WISECAM phone app to manage water quality data received from ETracers or other sources of water quality data.
One thing is for sure, with the continuing pressures of land use and climate change on our waterbodies, monitoring using well established and new techniques will definitely be needed going forward. There is a continuing need to manage our catchments, and meet the requirements of the Water Framework Directive to improve the water quality for both ecology and for the benefit of humans.
Practitioners of catchment monitoring and catchment management may be interested in the results of two current ongoing projects which will improve knowledge and understanding about the inputs to catchments, and will therefore help aid analysis, modelling and management of catchments. We heard about the NERC DOMAINE project from Simon Browning of Wavelength Environmental, and had a tour of the fascinating and impressive Rothamsted Research North Wyke Farm Platform project.
The NERC DOMAINE project (characterising the nature, origins and ecological significance of Dissolved Organic Matter IN freshwater Ecosystems) is due to be completed in 2018. The DOMAINE project will assess the origins, transport and downstream export of dissolved organic carbon, nitrogen and
Page 15
phosphorus and also the ecosystem functional significance and wider environmental and human health impacts of DOM flux. Led by the University of Bristol, the DOMAINE project is currently monitoring the Hampshire Avon as an example of a lowland agricultural catchment; and the Conwy as an example of an upland catchment comprising mountain moorland, peat and commercial forestry.
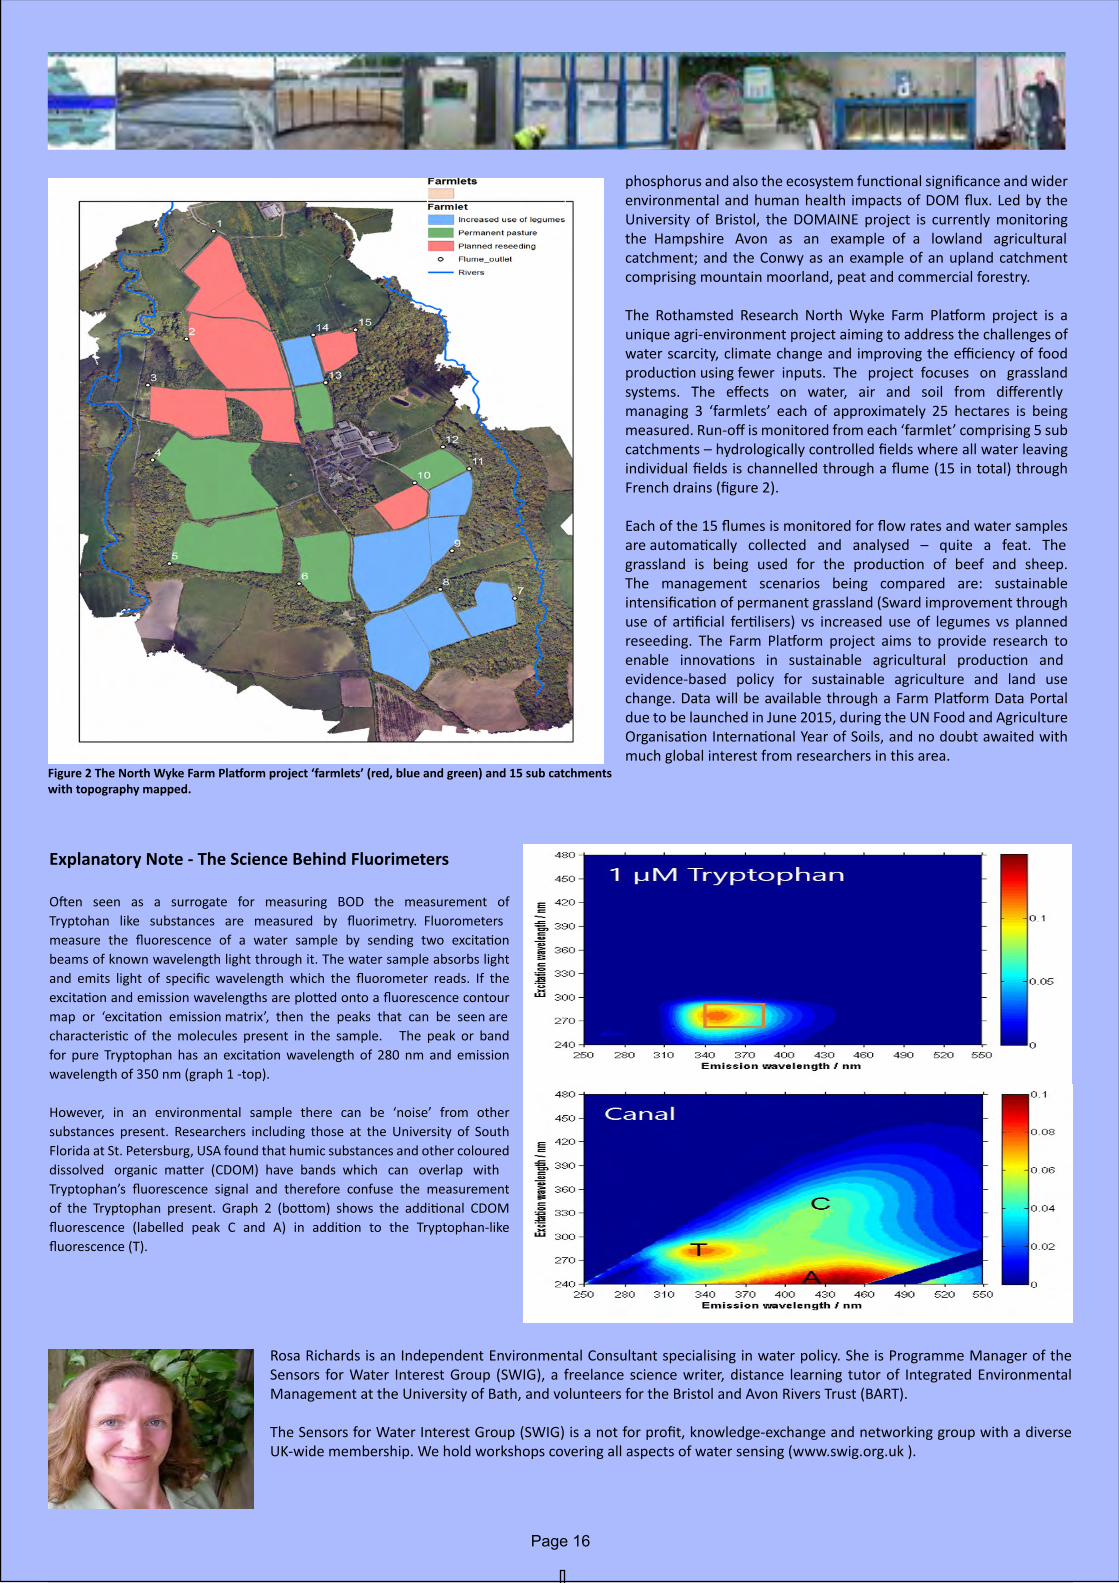
The Rothamsted Research North Wyke Farm Platform project is a unique agri-environment project aiming to address the challenges of water scarcity, climate change and improving the efficiency of food production using fewer inputs. The project focuses on grassland systems. The effects on water, air and soil from differently managing 3 ‘farmlets’ each of approximately 25 hectares is being measured. Run-off is monitored from each ‘farmlet’ comprising 5 sub catchments – hydrologically controlled fields where all water leaving individual fields is channelled through a flume (15 in total) through French drains (figure 2).
Each of the 15 flumes is monitored for flow rates and water samples are automatically collected and analysed – quite a feat. The grassland is being used for the production of beef and sheep. The management scenarios being compared are: sustainable intensification of permanent grassland (Sward improvement through use of artificial fertilisers) vs increased use of legumes vs planned reseeding. The Farm Platform project aims to provide research to enable innovations in sustainable agricultural production and evidence-based policy for sustainable agriculture and land use change. Data will be available through a Farm Platform Data Portal due to be launched in June 2015, during the UN Food and Agriculture Organisation International Year of Soils, and no doubt awaited with much global interest from researchers in this area.
Figure 2 The North Wyke Farm Platform project ‘farmlets’ (red, blue and green) and 15 sub catchments with topography mapped.
Explanatory Note - The Science Behind Fluorimeters
Often seen as a surrogate for measuring BOD the measurement of Tryptohan like substances are measured by fluorimetry. Fluorometers measure the fluorescence of a water sample by sending two excitation beams of known wavelength light through it. The water sample absorbs light and emits light of specific wavelength which the fluorometer reads. If the excitation and emission wavelengths are plotted onto a fluorescence contour map or ‘excitation emission matrix’, then the peaks that can be seen are characteristic of the molecules present in the sample. The peak or band for pure Tryptophan has an excitation wavelength of 280 nm and emission wavelength of 350 nm (graph 1 -top).
However, in an environmental sample there can be ‘noise’ from other substances present. Researchers including those at the University of South Florida at St. Petersburg, USA found that humic substances and other coloured dissolved organic matter (CDOM) have bands which can overlap with Tryptophan’s fluorescence signal and therefore confuse the measurement of the Tryptophan present. Graph 2 (bottom) shows the additional CDOM fluorescence (labelled peak C and A) in addition to the Tryptophan-like fluorescence (T).
Page 16
Rosa Richards is an Independent Environmental Consultant specialising in water policy. She is Programme Manager of the Sensors for Water Interest Group (SWIG), a freelance science writer, distance learning tutor of Integrated Environmental Management at the University of Bath, and volunteers for the Bristol and Avon Rivers Trust (BART).
The Sensors for Water Interest Group (SWIG) is a not for profit, knowledge-exchange and networking group with a diverse UK-wide membership. We hold workshops covering all aspects of water sensing (www.swig.org.uk ).
Group News:
The Future of WIPAC
Last month I launched a survey asking the group as a whole what they wanted to get from the Water Industry Process Automation & Control group, WIPAC Monthly and where it could things possibly go. I am aware that the group is over 5,000 members strong and continues to grow week on week. With such a large number my feelings were that I needed to know what everyone as members of the WIPAC Group want. What areas you would like to hear about and where you as a group want things to go. After all if things get boring and tedious the group will quickly fail and fade away into nothing. As a result the opinions of the group members are very important to me. Although no money is involved (in fact it costs money to run things) everyone in the group is involved whether commenting in a discussion or providing an article. The strength of the group is in its members. As a result I put a survey together to hear everyone’s opinions.
The questions and the results are below:
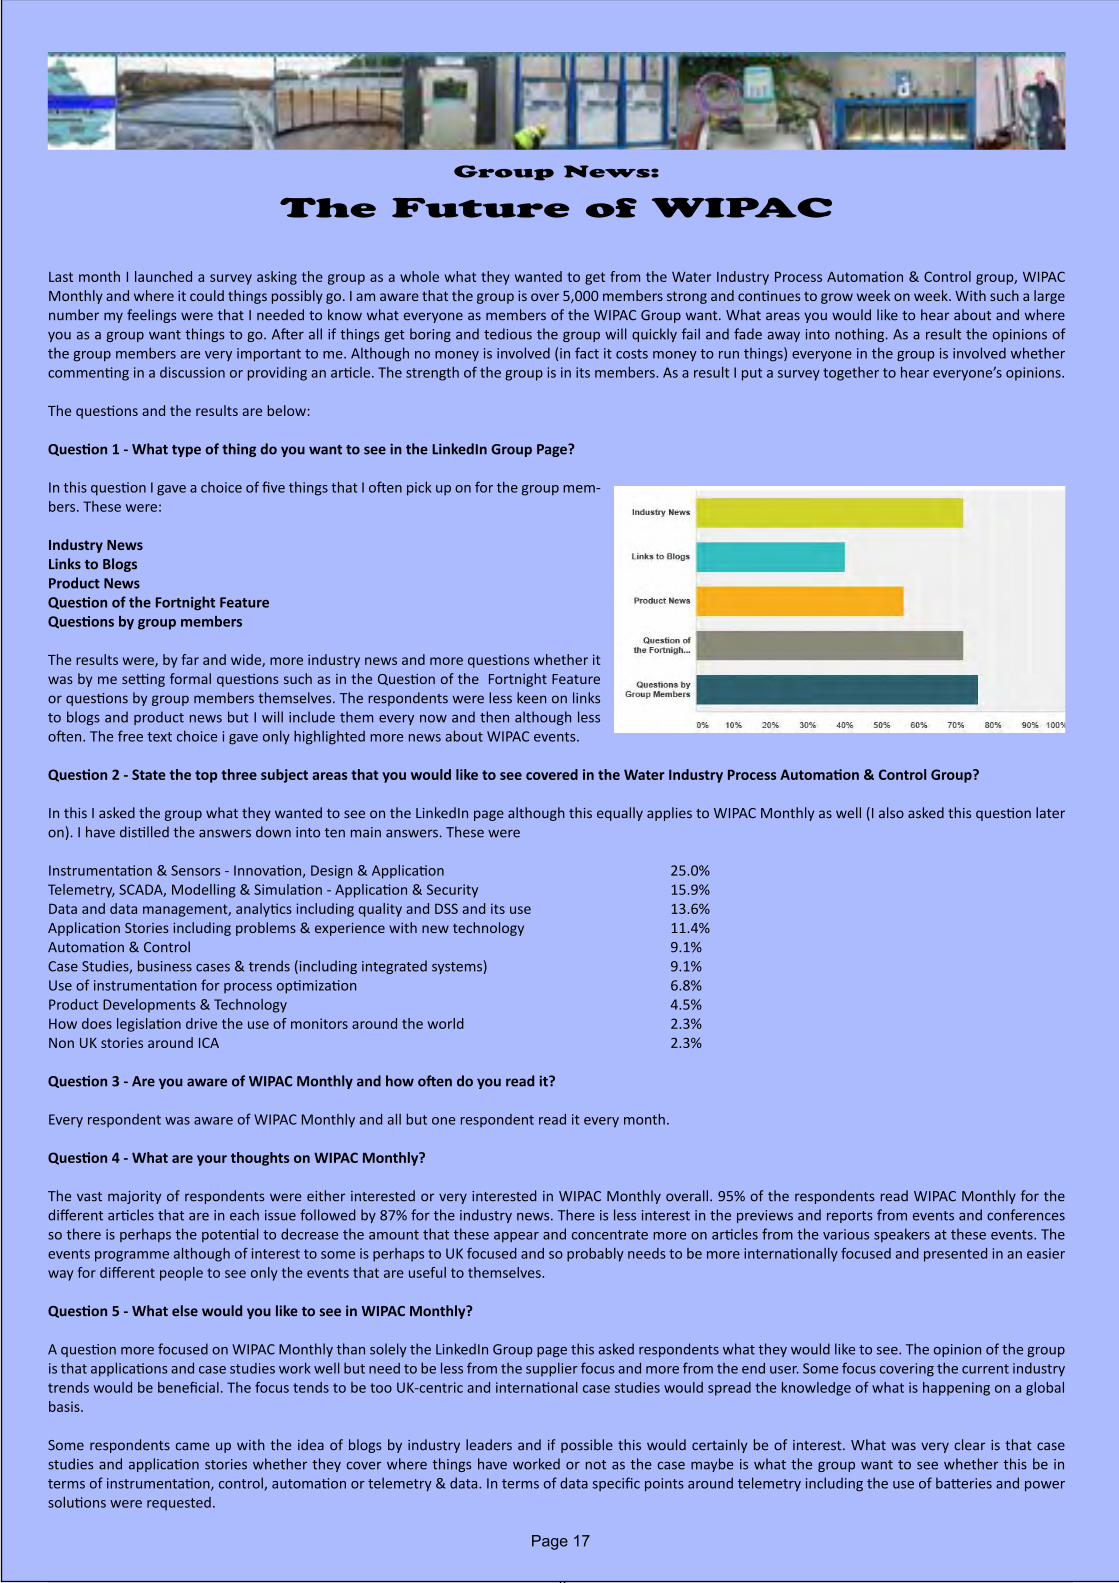
Question 1 - What type of thing do you want to see in the LinkedIn Group Page?
In this question I gave a choice of five things that I often pick up on for the group mem-bers. These were:
Industry NewsLinks to BlogsProduct NewsQuestion of the Fortnight FeatureQuestions by group members
The results were, by far and wide, more industry news and more questions whether it was by me setting formal questions such as in the Question of the Fortnight Feature or questions by group members themselves. The respondents were less keen on links to blogs and product news but I will include them every now and then although less often. The free text choice i gave only highlighted more news about WIPAC events.
Question 2 - State the top three subject areas that you would like to see covered in the Water Industry Process Automation & Control Group?
In this I asked the group what they wanted to see on the LinkedIn page although this equally applies to WIPAC Monthly as well (I also asked this question later on). I have distilled the answers down into ten main answers. These were
Instrumentation & Sensors - Innovation, Design & Application 25.0%Telemetry, SCADA, Modelling & Simulation - Application & Security 15.9%Data and data management, analytics including quality and DSS and its use 13.6%Application Stories including problems & experience with new technology 11.4%Automation & Control 9.1%Case Studies, business cases & trends (including integrated systems) 9.1%Use of instrumentation for process optimization 6.8%Product Developments & Technology 4.5%How does legislation drive the use of monitors around the world 2.3%Non UK stories around ICA 2.3%
Question 3 - Are you aware of WIPAC Monthly and how often do you read it?
Every respondent was aware of WIPAC Monthly and all but one respondent read it every month.
Question 4 - What are your thoughts on WIPAC Monthly?
The vast majority of respondents were either interested or very interested in WIPAC Monthly overall. 95% of the respondents read WIPAC Monthly for the different articles that are in each issue followed by 87% for the industry news. There is less interest in the previews and reports from events and conferences so there is perhaps the potential to decrease the amount that these appear and concentrate more on articles from the various speakers at these events. The events programme although of interest to some is perhaps to UK focused and so probably needs to be more internationally focused and presented in an easier way for different people to see only the events that are useful to themselves.
Question 5 - What else would you like to see in WIPAC Monthly?
A question more focused on WIPAC Monthly than solely the LinkedIn Group page this asked respondents what they would like to see. The opinion of the group is that applications and case studies work well but need to be less from the supplier focus and more from the end user. Some focus covering the current industry trends would be beneficial. The focus tends to be too UK-centric and international case studies would spread the knowledge of what is happening on a global basis.
Some respondents came up with the idea of blogs by industry leaders and if possible this would certainly be of interest. What was very clear is that case studies and application stories whether they cover where things have worked or not as the case maybe is what the group want to see whether this be in terms of instrumentation, control, automation or telemetry & data. In terms of data specific points around telemetry including the use of batteries and power solutions were requested.
Page 17

Question 6 - Are you interested in providing content for WIPAC Monthly?
This was basically for me to gather in contributors for WIPAC Monthly and got people to give me their email addresses if they were willing to contribute to pro-ducing each edition each month. Thank you to all of those who replied that they were willing to contribute in their specific areas. I will get in touch and provide guidelines for contributors. For those who were not willing to contribute thank you for saying so. A reminder to anyone who did not take part in the survey that if anyone wants to contribute then please feel free to get in touch with me at anytime. All contributions are greatly received, it takes a huge amount of work to put together each edition each month. Some statistics:
• Each issue for approximately the last year has been 21 A3 Pages long• There are approximately 10,000 words in each edition• If all editions for a year are brought together in one edition and printed it would weigh 2.5kg and if the 46 editions so far were printed it would be just under
10kg• The most frequent contributor has been John Cook & Edwin Roehl of ADMI.
In short, thank you for all of you who have contributed and thank you to all of those who will.
Question 7 - WIPAC has always been free but if more of a service can be provided would you be interested in.....
• Advertising• WIPAC led workshops• WIPAC led conferences• Manuals of Best Practice• No just keep it free and how it is at the moment
The majority of respondents wanted to keep WIPAC free and as it is and some worried how WIPAC would convert to the “real world” of workshops, conferences & exhibitions. Of course those outside the UK thought that this did not apply to them. Probably the firmest message of all though was that people appreciated the fact that WIPAC was free of advertising. On the answers of this question it is clear that the group as a whole wanted to keep WIPAC free of cost and free of advertising and would rather keep it the way it is than see it expand into something else. It has always been my principle and I have resisted advances in the past to commercialise WIPAC. As such I can make the guarantee that WIPAC will remain free and as it is.
What was interesting is that some indicated that they would be willing to provide sponsorship for various activities and one respondent mentioned Webinar based events. I am currently investigating the costs and interest of holding sponsored webinars that would resolve the problem of being UK-centric as they could apply to members around the globe. If this sounds interesting to any member then please get in touch. I will put a preliminary programme together (any suggestions would be appreciated) and then gauge interest within the global community.
Question 8 - Various projects have been attempted without much success is this of interest to the group?
There was a general interest in projects put together by WIPAC gathering the experience and knowledge of the group as a whole. 87% of respondents were interested or wanted to get actively involved. What projects were of interest were less certain. The two suggestions were for manual of best practice which would include the current Manual of Wastewater Flow Monitoring and a product based website (i.e. the WIPAC Directory). The manual of Best Practice was of interest to 88% of respondents meaning there is an active interest in this area. For the product based website there was less interest (55%) and some who were not interested at all 31% and so this sort of project is unlikely to be successful
The last question asked for the thoughts of the members and gave everyone who took part in the survey to say whatever they want. Thank you to all of the mem-bers who offered their praise and support it was much appreciated and thank you to the one respondent who offered me advice on where to take WIPAC that was especially appreciated and I have taken on board that I need to reduce the typos (I think I cracked that in the last issue)
So where does WIPAC go from here....what is the “Future of WIPAC?”
• In terms of the LinkedIn Group it will of course continue - it grows each week (we have never had a week in four years where there hasn’t been at least one new member). We have some interesting topics that have come out of the survey that we can address. The Question of the Fortnight will continue but we do need more questions from group members. If there are people who do not feel able to ask a question then send it to me and I will ask in anonymously.
• In terms of WIPAC Monthly it is very satisfying that the majority of people read it every month, the distribution is excellent (around 6,000 a month). I have had a comment recently that it looks a little dated and would value the group’s opinion and suggestions. In terms of content I do need a more varied group of contributors both in content and location around the world. One of our recent contributors from the Middle East, who has provided the opinion pieces in April & May literally just contacted me through LinkedIn. If you want to contribute then please just get in touch with me especially if you work for an end user and have a good case study to share.
• In terms of WIPAC it will remain free for all and advertising will pay no part in the future of WIPAC. However suppliers are always welcome to contribute and in terms of articles they will always be supplier neutral (I.e. any supplier is welcome). There will never be any charges.
• Putting together a series of Webinars (probably 6 per year) will be investigated. Any suggestions will be welcome. These will be international and available to all and will be made available after the events (private Youtube channel perhaps - suggestions anyone). These events will need to be sponsored as webinar conference facilities are expensive.
• The current WIPAC project is a manual of Wastewater Flow Measurement and I am lucky to have put together a group of people who are currently bringing it together and will be speaking to others. The manual will be electronic and free to all in line with the principles of the Water Industry Process Automation & Control Group.
Finally thank you to all of those who took part in the survey, it has provided a much needed direction for WIPAC to go in, thank you.
Page 18
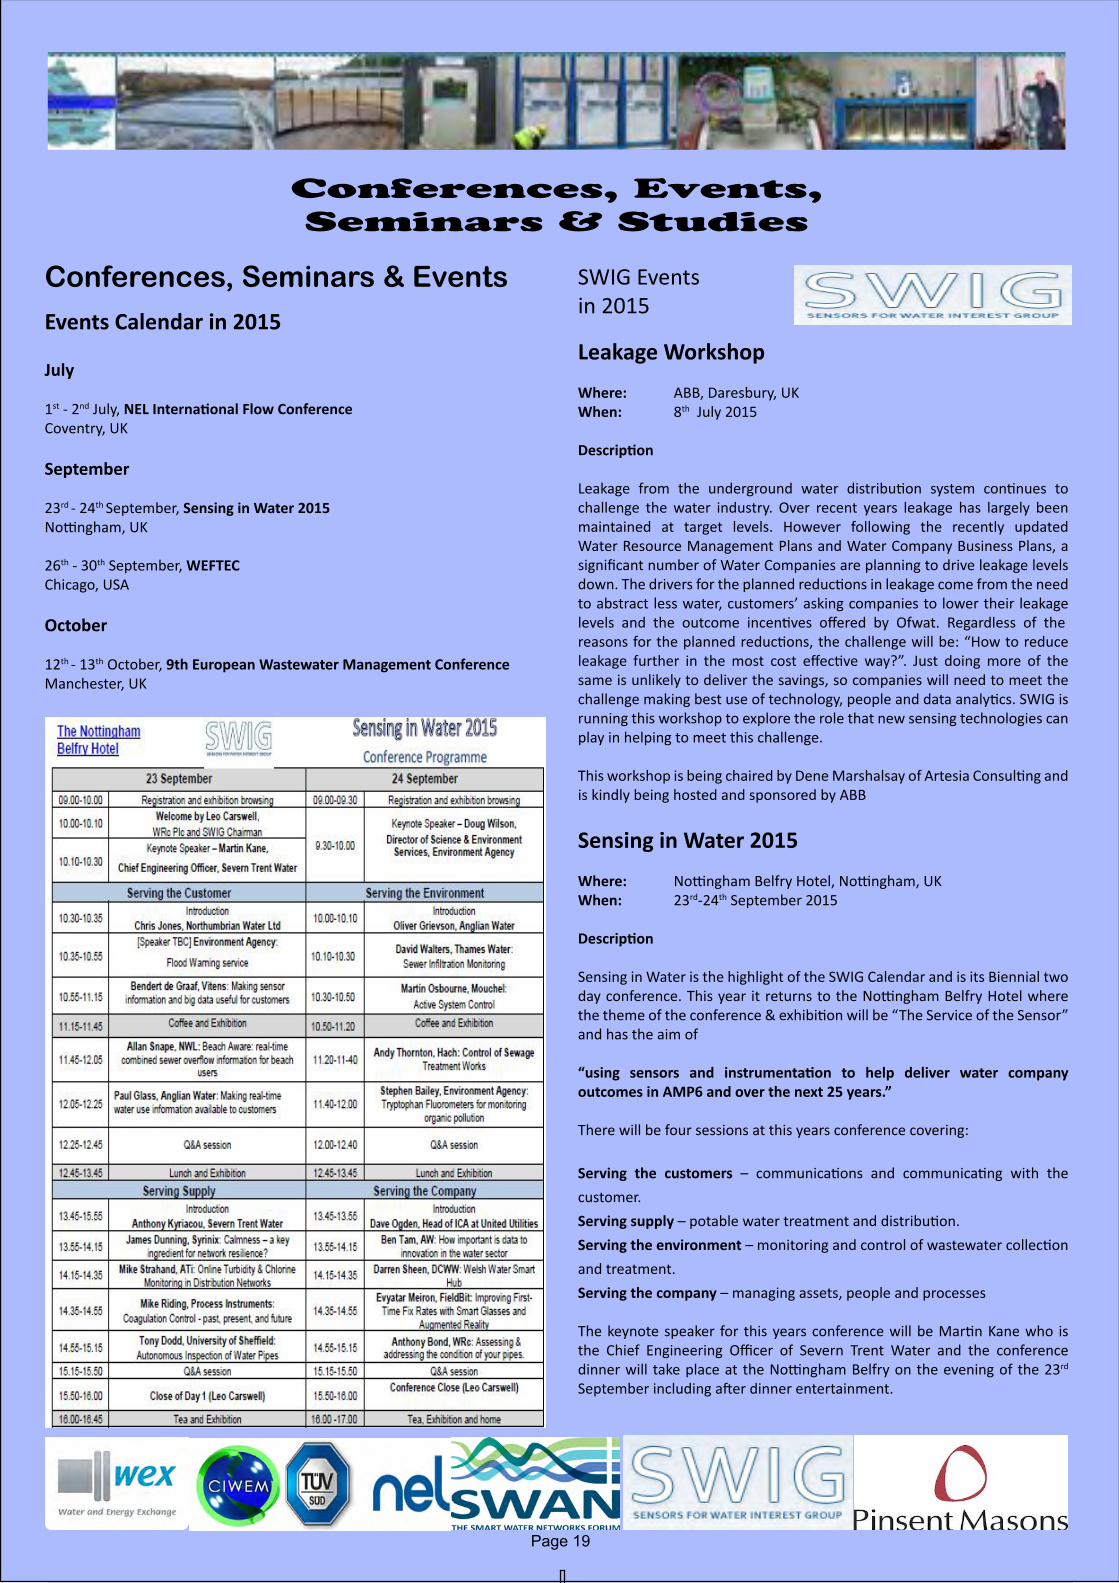
Page 19
Leakage Workshop
Where: ABB, Daresbury, UKWhen: 8th July 2015
Description
Leakage from the underground water distribution system continues to challenge the water industry. Over recent years leakage has largely been maintained at target levels. However following the recently updated Water Resource Management Plans and Water Company Business Plans, a significant number of Water Companies are planning to drive leakage levels down. The drivers for the planned reductions in leakage come from the need to abstract less water, customers’ asking companies to lower their leakage levels and the outcome incentives offered by Ofwat. Regardless of the reasons for the planned reductions, the challenge will be: “How to reduce leakage further in the most cost effective way?”. Just doing more of the same is unlikely to deliver the savings, so companies will need to meet the challenge making best use of technology, people and data analytics. SWIG is running this workshop to explore the role that new sensing technologies can play in helping to meet this challenge.
This workshop is being chaired by Dene Marshalsay of Artesia Consulting and is kindly being hosted and sponsored by ABB
Sensing in Water 2015
Where: Nottingham Belfry Hotel, Nottingham, UKWhen: 23rd-24th September 2015
Description
Sensing in Water is the highlight of the SWIG Calendar and is its Biennial two day conference. This year it returns to the Nottingham Belfry Hotel where the theme of the conference & exhibition will be “The Service of the Sensor” and has the aim of
“using sensors and instrumentation to help deliver water company outcomes in AMP6 and over the next 25 years.”
There will be four sessions at this years conference covering:
Serving the customers – communications and communicating with the customer.Serving supply – potable water treatment and distribution.Serving the environment – monitoring and control of wastewater collection and treatment.Serving the company – managing assets, people and processes
The keynote speaker for this years conference will be Martin Kane who is the Chief Engineering Officer of Severn Trent Water and the conference dinner will take place at the Nottingham Belfry on the evening of the 23rd
September including after dinner entertainment.
SWIG Events in 2015
Conferences, Events,Seminars & Studies
Conferences, Seminars & Events
Events Calendar in 2015
July
1st - 2nd July, NEL International Flow ConferenceCoventry, UK
September
23rd - 24th September, Sensing in Water 2015Nottingham, UK
26th - 30th September, WEFTECChicago, USA
October
12th - 13th October, 9th European Wastewater Management ConferenceManchester, UK

Page 20


![Introduction for the 46th Rankine Lecturedoi: 10.1680/geot.2008.58.9.693] 693 Introduction for the 46th Rankine Lecture The 46th Lecture of the British Geotechnical Society was given](https://img.pdfslide.us/doc/110x75/5af3037f7f8b9a154c8c4584/introduction-for-the-46th-rankine-lecture-doi-101680geot2008589693-693-introduction.jpg)