Embed Size (px)
Citation preview
Big Data & Data Science | Bogotá | Colombia | Octubre 27, 2016
Whose Balance Sheet is this? Neural Networks for Banks’ Pattern Recognition
Carlos León
Banco de la República (Colombia)
& Tilburg University
Jose Fernando Moreno
Barcelona Grad. School of Economics
Jorge Cely
Banco de la República (Colombia)
Cats No cats
0.5 0.6 0.7 0.8 0.9 1 1.1 1.2 1.3 1.4 1.5
5
10
15
20
25
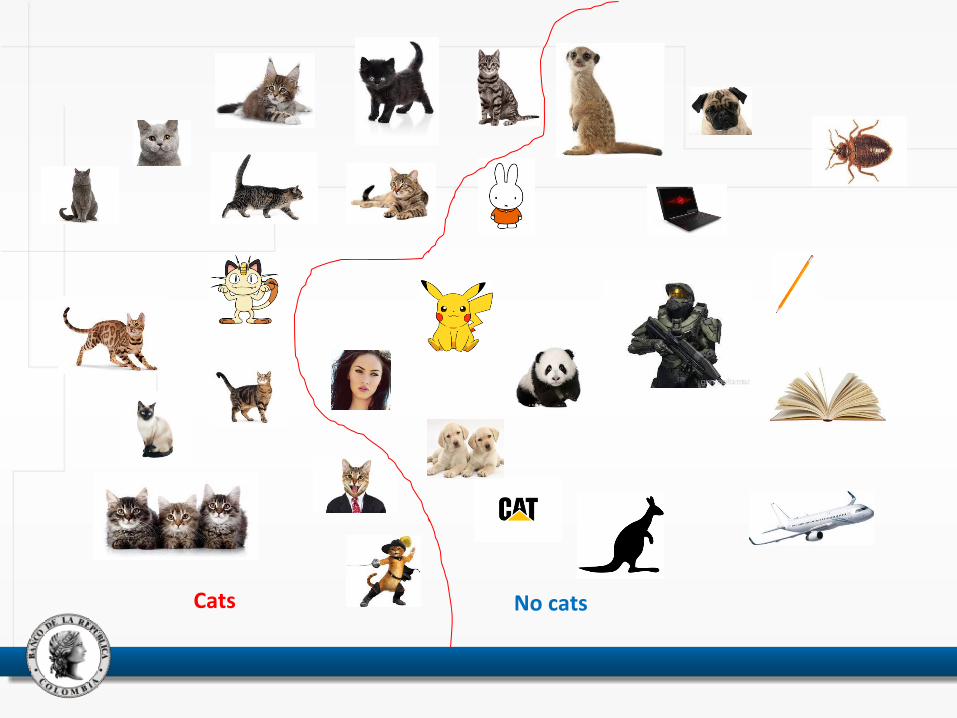
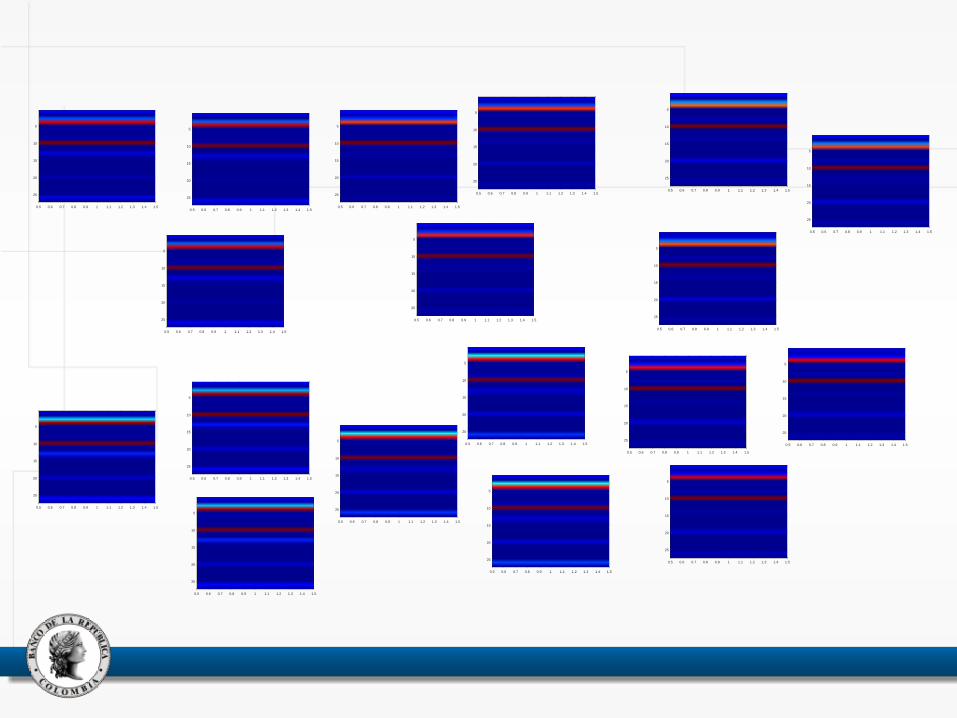
A bank’s balance sheet as a 27x1 pixels image
Assets (9)
Liabilities (9)
Equity (9)
0.5 0.6 0.7 0.8 0.9 1 1.1 1.2 1.3 1.4 1.5
5
10
15
20
25
0.5 0.6 0.7 0.8 0.9 1 1.1 1.2 1.3 1.4 1.5
5
10
15
20
25
0.5 0.6 0.7 0.8 0.9 1 1.1 1.2 1.3 1.4 1.5
5
10
15
20
25
0.5 0.6 0.7 0.8 0.9 1 1.1 1.2 1.3 1.4 1.5
5
10
15
20
25
0.5 0.6 0.7 0.8 0.9 1 1.1 1.2 1.3 1.4 1.5
5
10
15
20
25
0.5 0.6 0.7 0.8 0.9 1 1.1 1.2 1.3 1.4 1.5
5
10
15
20
25
0.5 0.6 0.7 0.8 0.9 1 1.1 1.2 1.3 1.4 1.5
5
10
15
20
25
0.5 0.6 0.7 0.8 0.9 1 1.1 1.2 1.3 1.4 1.5
5
10
15
20
25
0.5 0.6 0.7 0.8 0.9 1 1.1 1.2 1.3 1.4 1.5
5
10
15
20
25
0.5 0.6 0.7 0.8 0.9 1 1.1 1.2 1.3 1.4 1.5
5
10
15
20
25
0.5 0.6 0.7 0.8 0.9 1 1.1 1.2 1.3 1.4 1.5
5
10
15
20
25
0.5 0.6 0.7 0.8 0.9 1 1.1 1.2 1.3 1.4 1.5
5
10
15
20
25
0.5 0.6 0.7 0.8 0.9 1 1.1 1.2 1.3 1.4 1.5
5
10
15
20
25
0.5 0.6 0.7 0.8 0.9 1 1.1 1.2 1.3 1.4 1.5
5
10
15
20
25
0.5 0.6 0.7 0.8 0.9 1 1.1 1.2 1.3 1.4 1.5
5
10
15
20
25
0.5 0.6 0.7 0.8 0.9 1 1.1 1.2 1.3 1.4 1.5
5
10
15
20
25
0.5 0.6 0.7 0.8 0.9 1 1.1 1.2 1.3 1.4 1.5
5
10
15
20
25
0.5 0.6 0.7 0.8 0.9 1 1.1 1.2 1.3 1.4 1.5
5
10
15
20
25
0.5 0.6 0.7 0.8 0.9 1 1.1 1.2 1.3 1.4 1.5
5
10
15
20
25
0.5 0.6 0.7 0.8 0.9 1 1.1 1.2 1.3 1.4 1.5
5
10
15
20
25
0.5 0.6 0.7 0.8 0.9 1 1.1 1.2 1.3 1.4 1.5
5
10
15
20
25
0.5 0.6 0.7 0.8 0.9 1 1.1 1.2 1.3 1.4 1.5
5
10
15
20
25
0.5 0.6 0.7 0.8 0.9 1 1.1 1.2 1.3 1.4 1.5
5
10
15
20
25
0.5 0.6 0.7 0.8 0.9 1 1.1 1.2 1.3 1.4 1.5
5
10
15
20
25
0.5 0.6 0.7 0.8 0.9 1 1.1 1.2 1.3 1.4 1.5
5
10
15
20
25
0.5 0.6 0.7 0.8 0.9 1 1.1 1.2 1.3 1.4 1.5
5
10
15
20
25
0.5 0.6 0.7 0.8 0.9 1 1.1 1.2 1.3 1.4 1.5
5
10
15
20
25
0.5 0.6 0.7 0.8 0.9 1 1.1 1.2 1.3 1.4 1.5
5
10
15
20
25
0.5 0.6 0.7 0.8 0.9 1 1.1 1.2 1.3 1.4 1.5
5
10
15
20
25
0.5 0.6 0.7 0.8 0.9 1 1.1 1.2 1.3 1.4 1.5
5
10
15
20
25
0.5 0.6 0.7 0.8 0.9 1 1.1 1.2 1.3 1.4 1.5
5
10
15
20
25
0.5 0.6 0.7 0.8 0.9 1 1.1 1.2 1.3 1.4 1.5
5
10
15
20
25
0.5 0.6 0.7 0.8 0.9 1 1.1 1.2 1.3 1.4 1.5
5
10
15
20
25
0.5 0.6 0.7 0.8 0.9 1 1.1 1.2 1.3 1.4 1.5
5
10
15
20
25
0.5 0.6 0.7 0.8 0.9 1 1.1 1.2 1.3 1.4 1.5
5
10
15
20
25
0.5 0.6 0.7 0.8 0.9 1 1.1 1.2 1.3 1.4 1.5
5
10
15
20
25

Disclaimer
The opinions and statements in this article are the sole responsibility of the authors and do not represent neither those of Banco de la República nor of its Board of Directors. Comments and suggestions from Hernando Vargas, Clara Machado, Freddy Cepeda, Fabio Ortega, and other members of the technical staff of Banco de la República are appreciated. Any remaining errors are the authors’ own.
http://www.banrep.gov.co/sites/default/files/publicaciones/archivos/be_959.pdf
Contents
1. Introduction
2. Related literature
3. Artificial neural networks and pattern recognition
3.1. Artificial neural network models
3.2. Training the artificial neural network
3.3. Post-training analysis
4. Data and methodology
5. Main results
6. Final remarks
Introduction
Balance sheets’ overall informational content …
o … information about the past performance of a firm, and a starting point for forecasts of future performance (Chisholm, 2002)
o … assess the overall composition of resources, the constriction of external obligations, and the firm’s flexibility and ability to change to meet new requirements (Kaliski, 2001)
In the banking industry …
o … among the minimum periodic reports that banks should provide to supervisors to conduct effective supervision and to evaluate the condition of the local banking market (BCBS, 1997 & 1998)
o … traditional supervisory examination has focused on the assessment of bank’s balance sheets (see Mishkin, 2004)
o … and they have been related to bank lending, investment spending, and economic activity, and the advent of financial crisis (see Mishkin, 2004)
Introduction
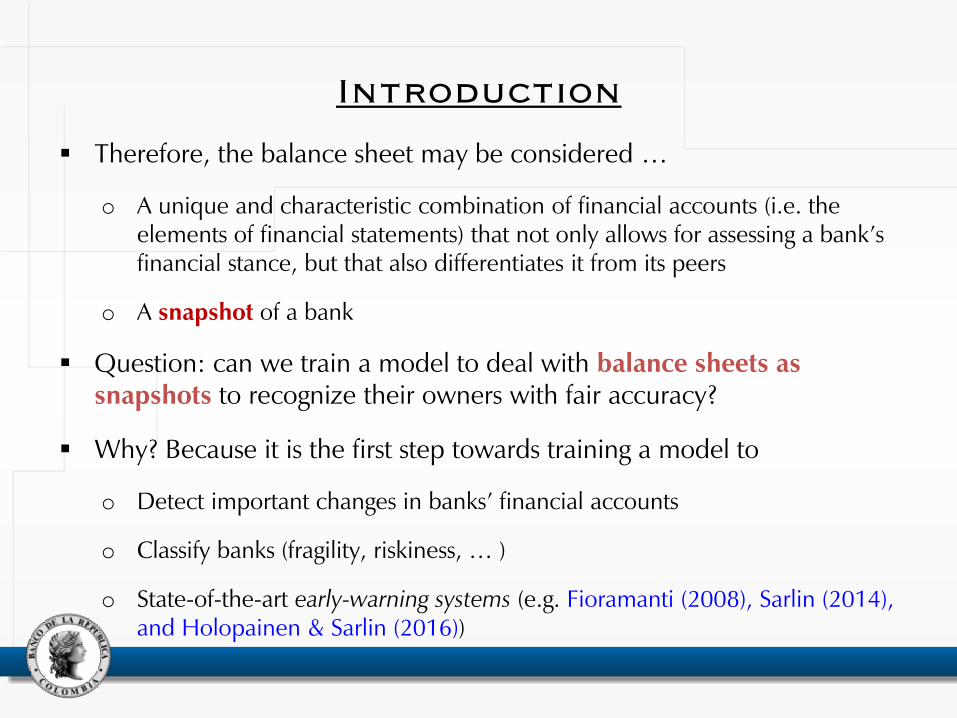
Therefore, the balance sheet may be considered …
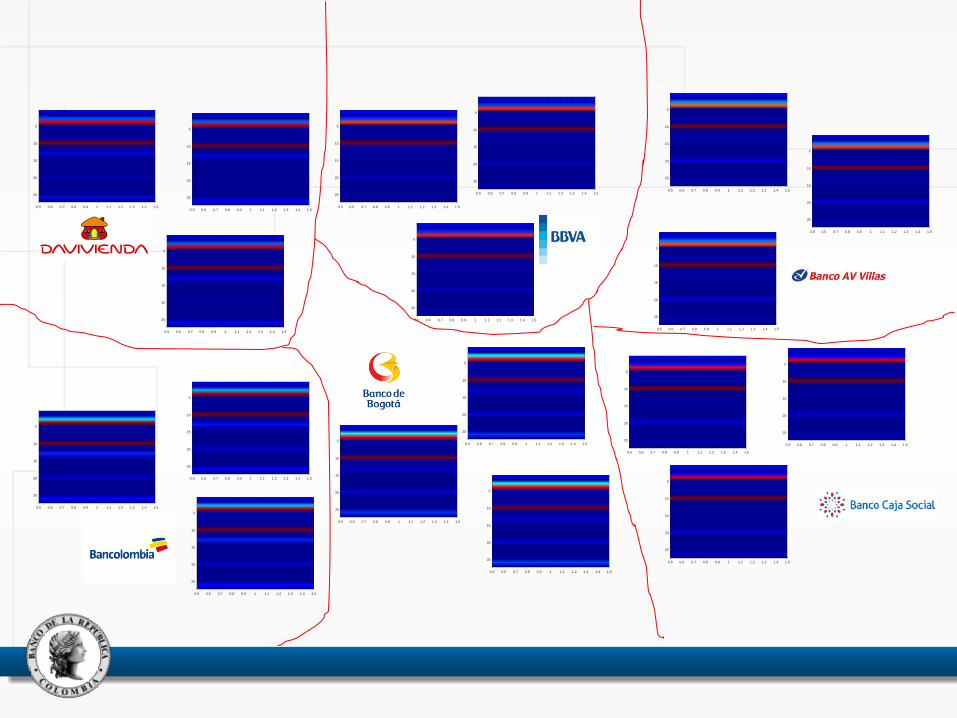
o A unique and characteristic combination of financial accounts (i.e. the elements of financial statements) that not only allows for assessing a bank’s financial stance, but that also differentiates it from its peers
o A snapshot of a bank
Question: can we train a model to deal with balance sheets as snapshots to recognize their owners with fair accuracy?
Why? Because it is the first step towards training a model to
o Detect important changes in banks’ financial accounts
o Classify banks (fragility, riskiness, … )
o State-of-the-art early-warning systems (e.g. Fioramanti (2008), Sarlin (2014), and Holopainen & Sarlin (2016))
Introduction
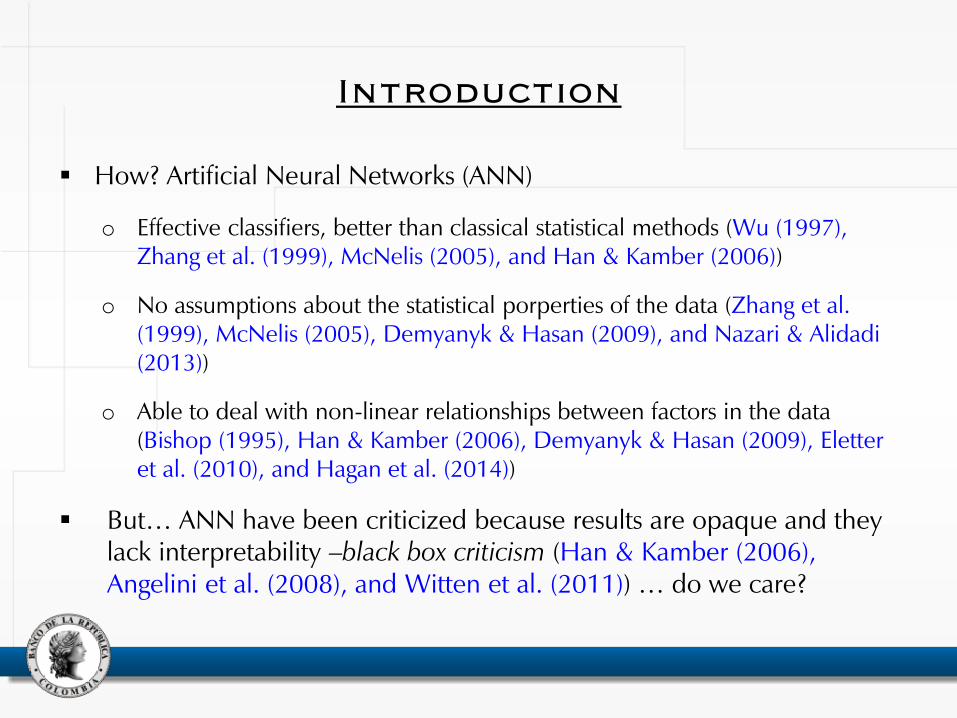
How? Artificial Neural Networks (ANN)
o Effective classifiers, better than classical statistical methods (Wu (1997), Zhang et al. (1999), McNelis (2005), and Han & Kamber (2006))
o No assumptions about the statistical porperties of the data (Zhang et al. (1999), McNelis (2005), Demyanyk & Hasan (2009), and Nazari & Alidadi (2013))
o Able to deal with non-linear relationships between factors in the data (Bishop (1995), Han & Kamber (2006), Demyanyk & Hasan (2009), Eletter et al. (2010), and Hagan et al. (2014))
But… ANN have been criticized because results are opaque and they lack interpretability –black box criticism (Han & Kamber (2006), Angelini et al. (2008), and Witten et al. (2011)) … do we care?
Introduction
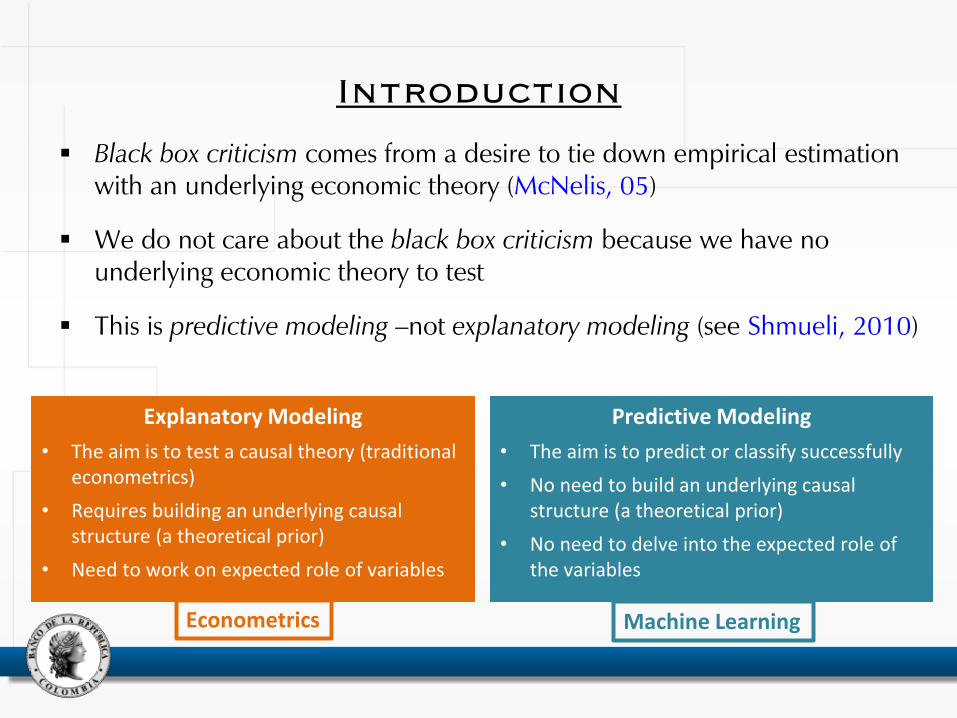
Black box criticism comes from a desire to tie down empirical estimation with an underlying economic theory (McNelis, 05)
We do not care about the black box criticism because we have no underlying economic theory to test
This is predictive modeling –not explanatory modeling (see Shmueli, 2010)
Explanatory Modeling
• The aim is to test a causal theory (traditional econometrics)
• Requires building an underlying causal structure (a theoretical prior)
• Need to work on expected role of variables
Predictive Modeling
• The aim is to predict or classify successfully
• No need to build an underlying causal structure (a theoretical prior)
• No need to delve into the expected role of the variables
Machine Learning Econometrics
Introduction
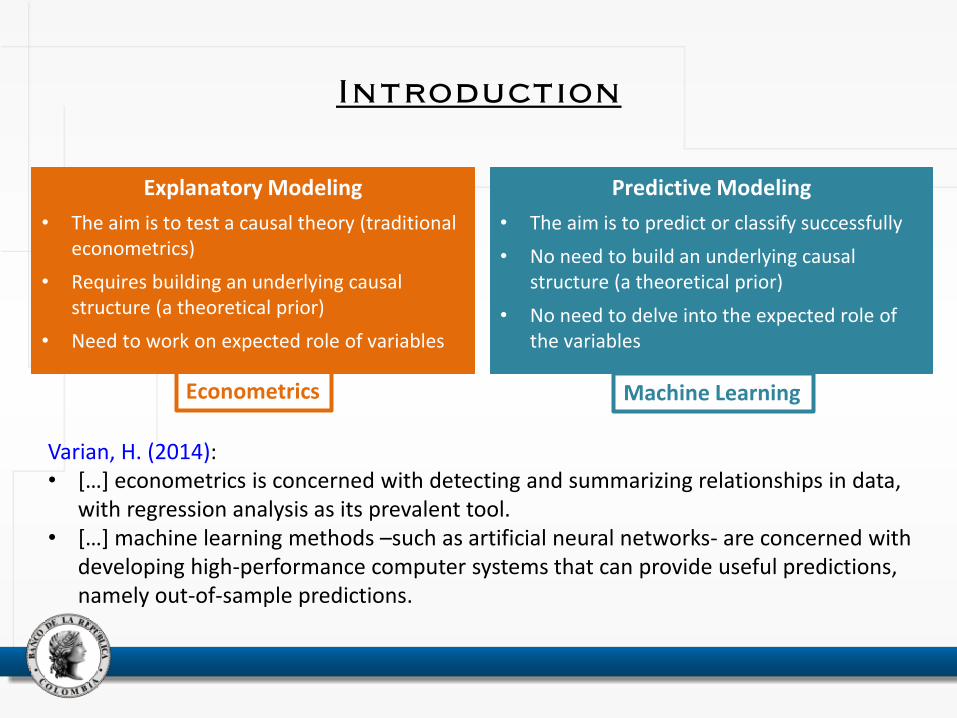
Explanatory Modeling
• The aim is to test a causal theory (traditional econometrics)
• Requires building an underlying causal structure (a theoretical prior)
• Need to work on expected role of variables
Predictive Modeling
• The aim is to predict or classify successfully
• No need to build an underlying causal structure (a theoretical prior)
• No need to delve into the expected role of the variables
Machine Learning Econometrics
Varian, H. (2014): • […] econometrics is concerned with detecting and summarizing relationships in data,
with regression analysis as its prevalent tool. • […] machine learning methods –such as artificial neural networks- are concerned with
developing high-performance computer systems that can provide useful predictions, namely out-of-sample predictions.
Contents
1. Introduction
2. Related literature
3. Artificial neural networks and pattern recognition
3.1. Artificial neural network models
3.2. Training the artificial neural network
3.3. Post-training analysis
4. Data and methodology
5. Main results
6. Final remarks
Related literature
• Pattern recognition • ANN on financial data
Related literature
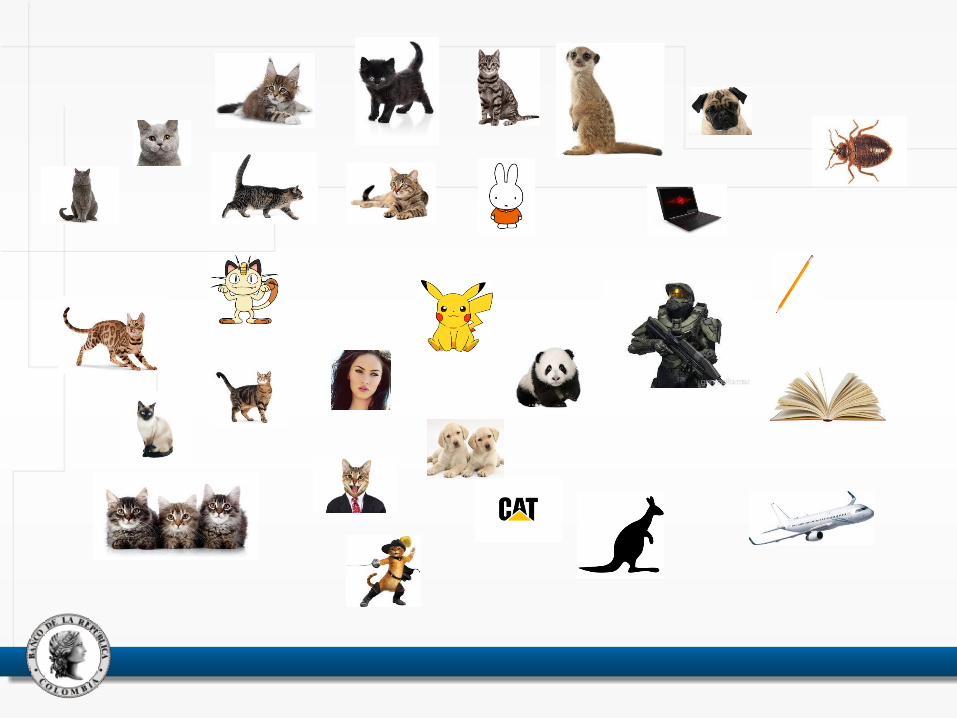
• Pattern recognition (classification)
– Aims at classifying inputs into a set of target categories (Hagan et al., 2014)
– Mainly a supervised machine learning problem: for training, each example pertains to a known category
– Wide spectrum: facial recognition, image classification, voice recognition, text translation, fraud detection, classification of handwritten characters, and medical diagnosis
– Contemporary success due to:
• Big data is now available for successful training
• Great computational power is now available for ANN
• Deep learning for particularly complex ANN (Schmidhuber (2015))
Related literature
• ANN on financial data (financial ratios)
– Bankruptcy/failure prediction based on classification of firms
• Non- financial (Rudorfer (1995), Zhang et al. (1999), Atiya (2001), Brédart (2014))
• Financial (Tam & Kiang (1990), Tam (1991), Olmeda & Fernández (1997))
– Loan decisions in retail and corporate banking (Angelini et al. (2008), Eletter et al. (2010), Nazari & Alidadi (2013), Bekhet & Eletter (2014))
– Local/foreign bank classification (Turkan et al. (2011))
– Islamic/conventional bank classification (Khediri et al. (2015))
– Auditing/no auditing firms for tax evasion (Wu (1997))
– State-of-the-art early warning systems
• Sovereign debt crises prediction (Fioramanti (2008))
• Country-specific fin. crises (Sarlin, (2014), Holopainen & Sarlin (2016))
Related literature
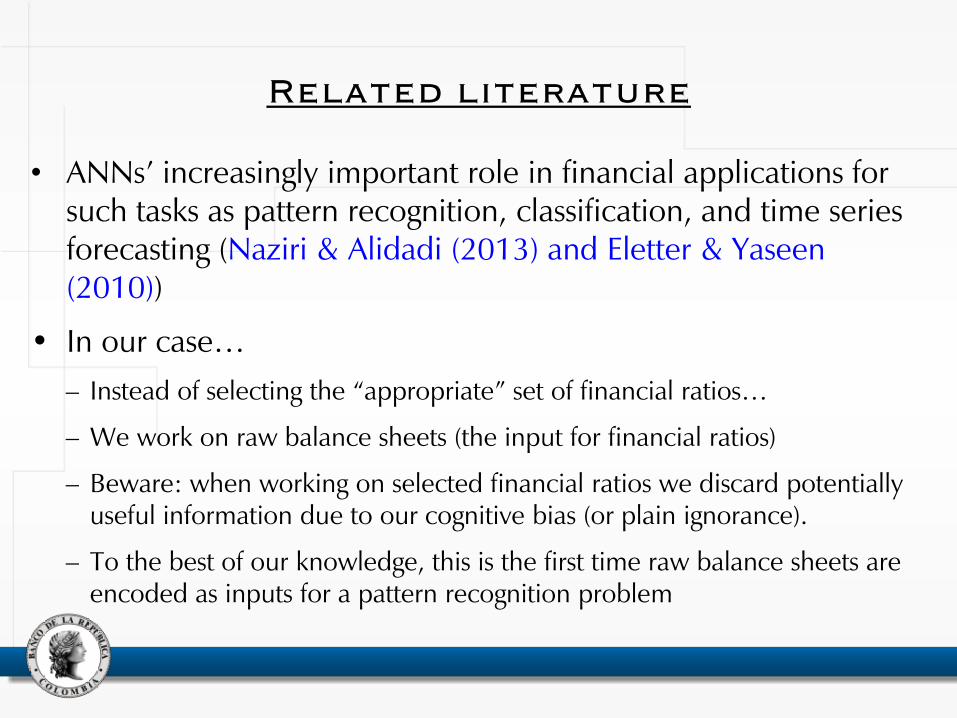
• ANNs’ increasingly important role in financial applications for such tasks as pattern recognition, classification, and time series forecasting (Naziri & Alidadi (2013) and Eletter & Yaseen (2010))
• In our case…
– Instead of selecting the “appropriate” set of financial ratios…
– We work on raw balance sheets (the input for financial ratios)
– Beware: when working on selected financial ratios we discard potentially useful information due to our cognitive bias (or plain ignorance).
– To the best of our knowledge, this is the first time raw balance sheets are encoded as inputs for a pattern recognition problem
Contents
1. Introduction
2. Related literature
3. Artificial neural networks and pattern recognition
3.1. Artificial neural network models
3.2. Training the artificial neural network
3.3. Post-training analysis
4. Data and methodology
5. Main results
6. Final remarks
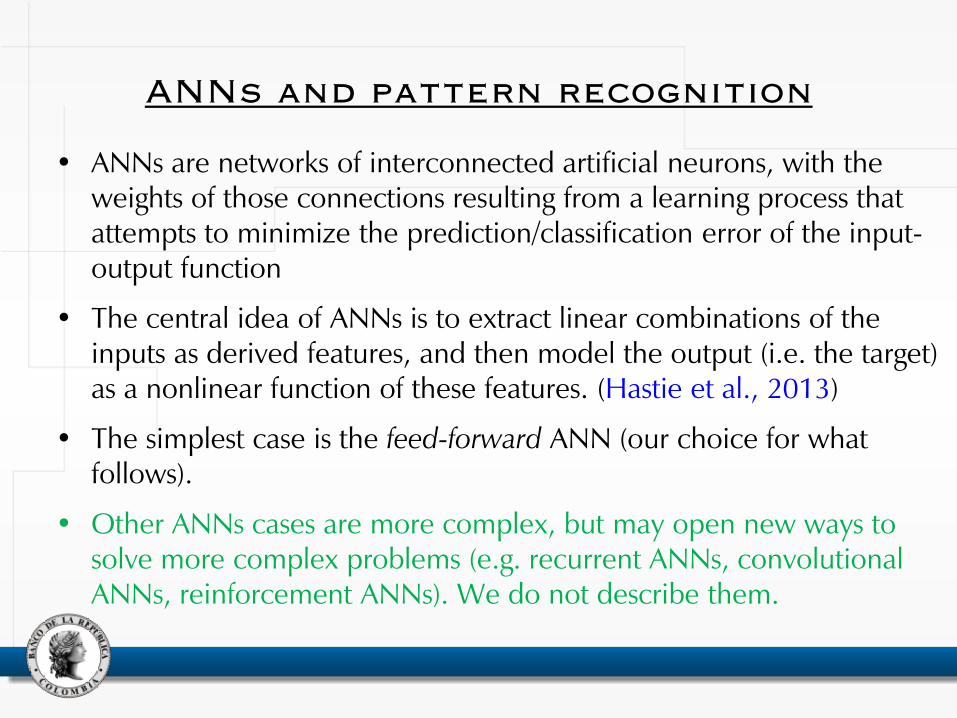
ANNs and pattern recognition
• ANNs are networks of interconnected artificial neurons, with the weights of those connections resulting from a learning process that attempts to minimize the prediction/classification error of the input-output function
• The central idea of ANNs is to extract linear combinations of the inputs as derived features, and then model the output (i.e. the target) as a nonlinear function of these features. (Hastie et al., 2013)
• The simplest case is the feed-forward ANN (our choice for what follows).
• Other ANNs cases are more complex, but may open new ways to solve more complex problems (e.g. recurrent ANNs, convolutional ANNs, reinforcement ANNs). We do not describe them.
Contents
1. Introduction
2. Related literature
3. Artificial neural networks and pattern recognition
3.1. Artificial neural network models
3.2. Training the artificial neural network
3.3. Post-training analysis
4. Data and methodology
5. Main results
6. Final remarks
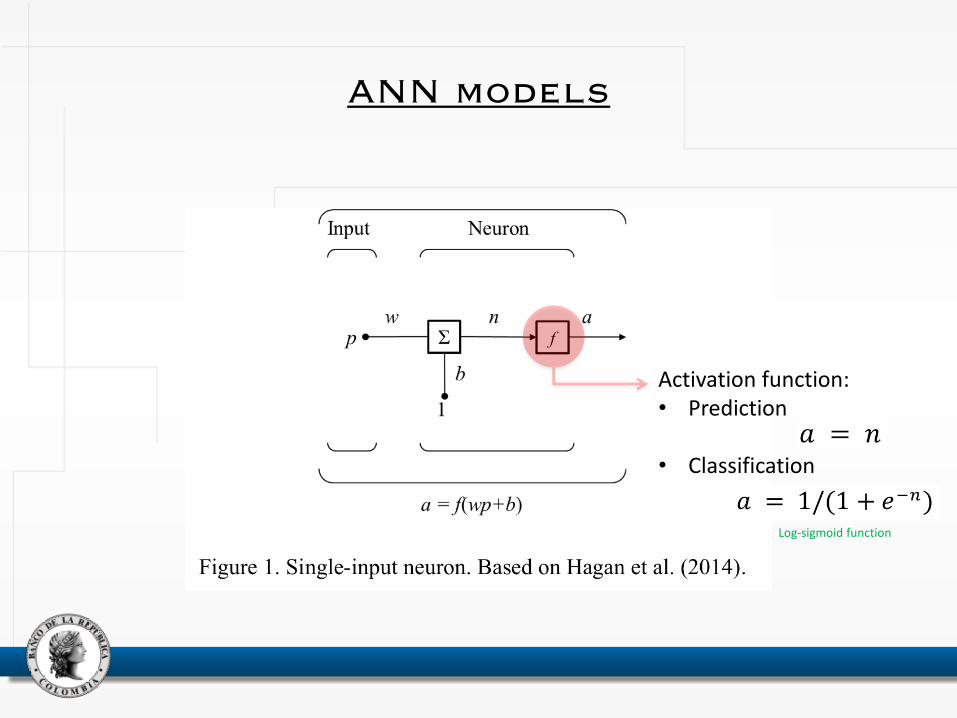
ANN models
Activation function: • Prediction
• Classification
Log-sigmoid function
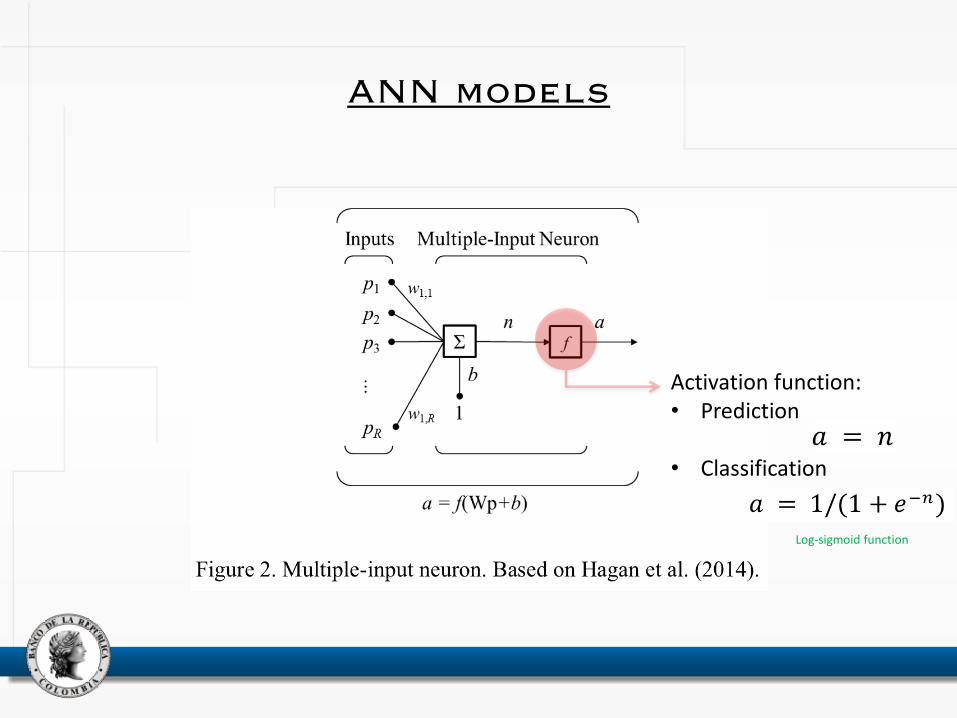
ANN models
Activation function: • Prediction
• Classification
Log-sigmoid function
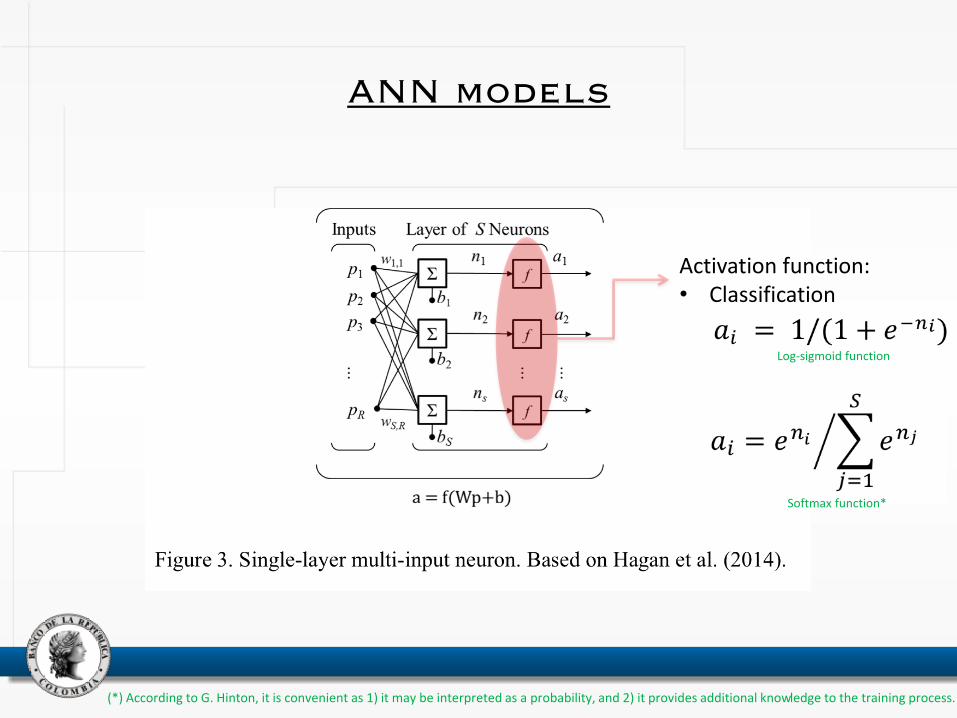
ANN models
Activation function: • Classification
Log-sigmoid function
Softmax function*
(*) According to G. Hinton, it is convenient as 1) it may be interpreted as a probability, and 2) it provides additional knowledge to the training process.
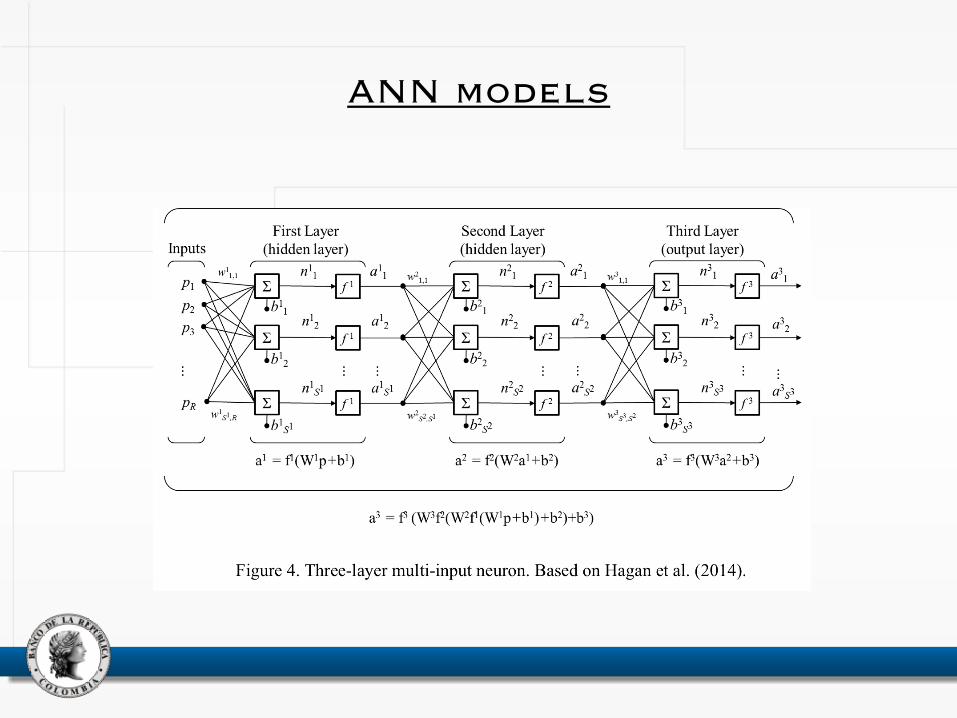
ANN models
Contents
1. Introduction
2. Related literature
3. Artificial neural networks and pattern recognition
3.1. Artificial neural network models
3.2. Training the artificial neural network
3.3. Post-training analysis
4. Data and methodology
5. Main results
6. Final remarks
Training the ANN
• Training: Adjusting parameters in W and b in order to attain an input-output relationship target under the chosen transfer functions for a set of observations (i.e. examples)
• Backpropagation:
– Backpropagation learns by iteratively processing a dataset of training examples (i.e. observations), comparing network’s prediction (i.e. output) for each example with the actual target value
– Parameters in W and b are modified in backwards direction, from the output layer, through each hidden layer down to the first hidden layer –hence its name (Han & Kamber, 2006)
Training the ANN
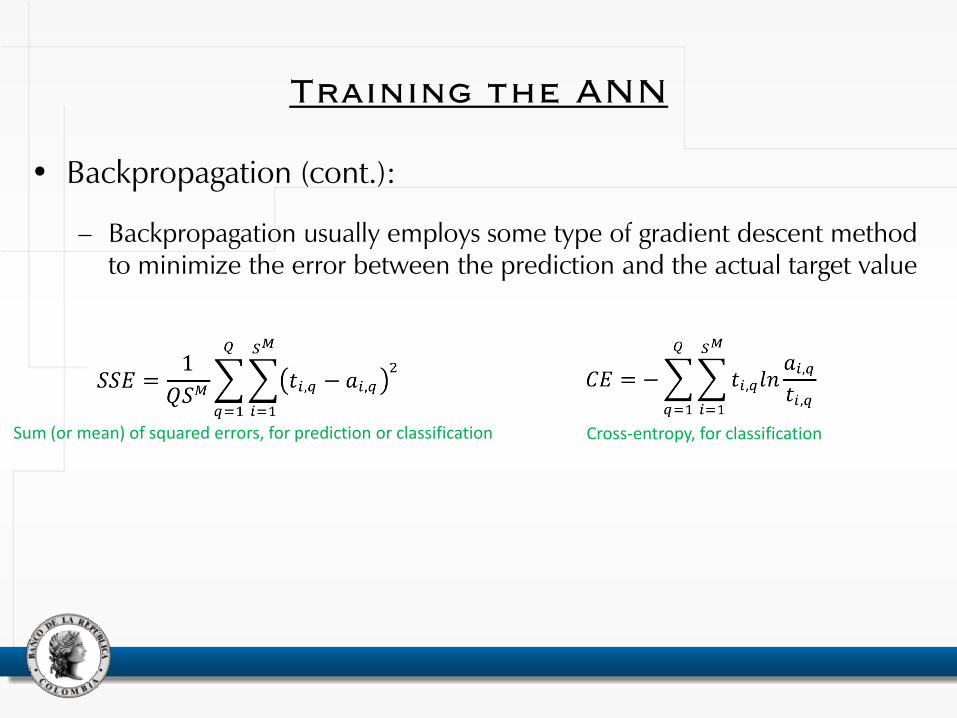
• Backpropagation (cont.):
– Backpropagation usually employs some type of gradient descent method to minimize the error between the prediction and the actual target value
Sum (or mean) of squared errors, for prediction or classification Cross-entropy, for classification
Training the ANN
• Unlike typical applications of regression models in econometrics, the goal of training an artificial neural network is not limited to minimizing in-sample the errors.
• The overfitting problem may be described as the model’s ability to succeed at fitting in-sample but to fail at fitting out-of-sample (see Shmueli (2010), Varian (2014))
• The goal is not to memorize the training data, but to model the underlying generator of the data (Bishop, 1995)
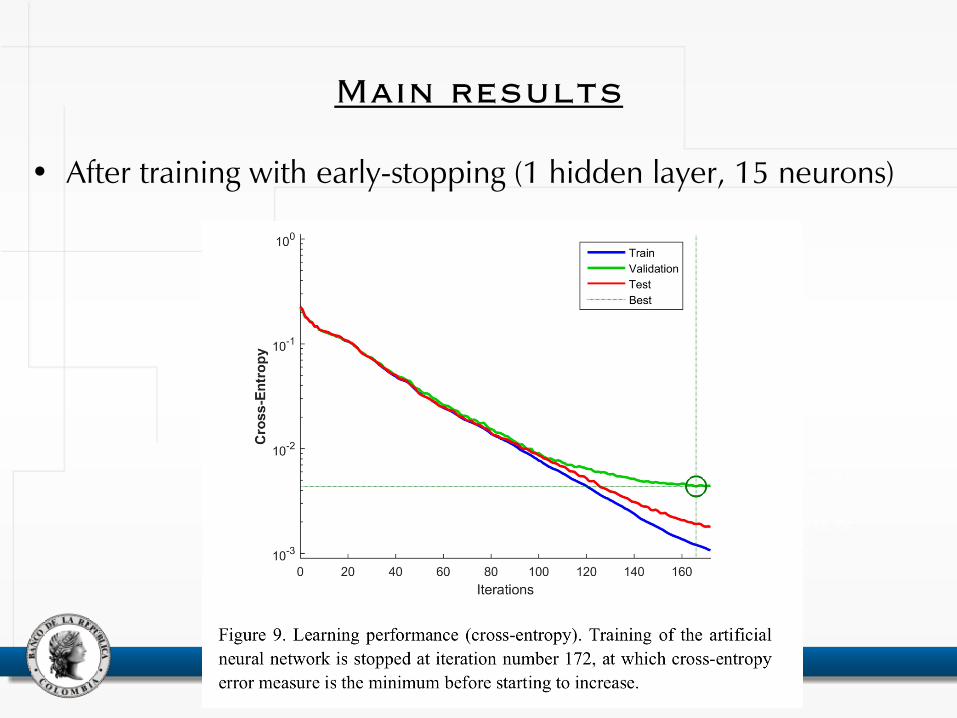
• Early stopping:
– Halt the minimization process before the complexity of the solution inhibits its generalization capability
– If training is stopped before the minimum in-sample is reached, then the network will effectively be using fewer parameters and will be less likely to overfit (Hagan et al., 2014)
Training the ANN
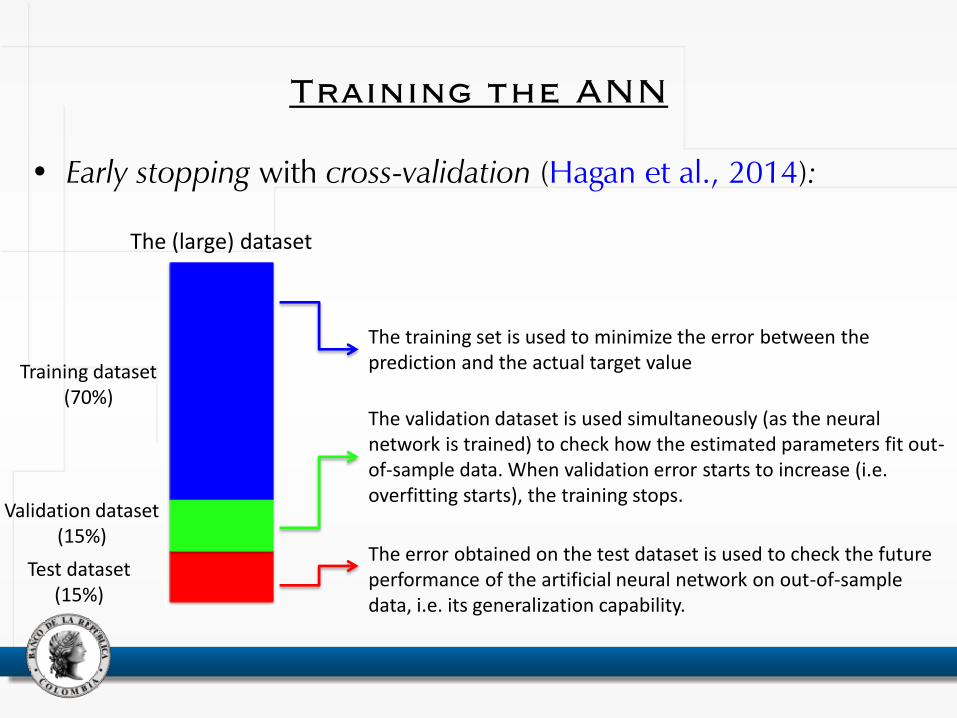
• Early stopping with cross-validation (Hagan et al., 2014):
Training dataset (70%)
Validation dataset (15%)
Test dataset (15%)
The training set is used to minimize the error between the prediction and the actual target value
The (large) dataset
The validation dataset is used simultaneously (as the neural network is trained) to check how the estimated parameters fit out-of-sample data. When validation error starts to increase (i.e. overfitting starts), the training stops.
The error obtained on the test dataset is used to check the future performance of the artificial neural network on out-of-sample data, i.e. its generalization capability.
Contents
1. Introduction
2. Related literature
3. Artificial neural networks and pattern recognition
3.1. Artificial neural network models
3.2. Training the artificial neural network
3.3. Post-training analysis
4. Data and methodology
5. Main results
6. Final remarks
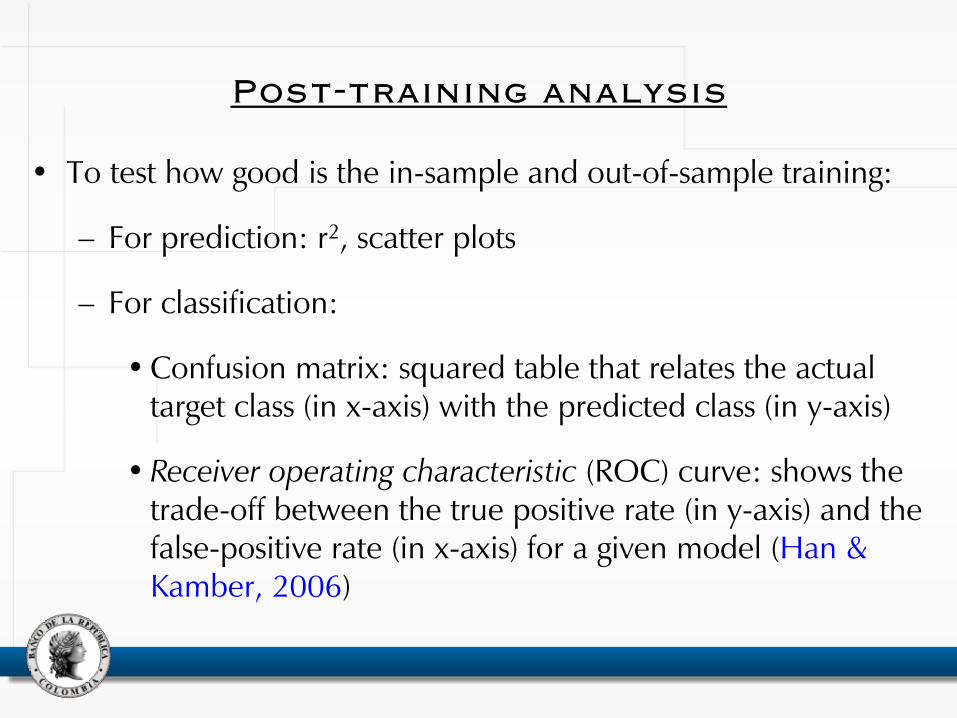
Post-training analysis
• To test how good is the in-sample and out-of-sample training:
– For prediction: r2, scatter plots
– For classification:
• Confusion matrix: squared table that relates the actual target class (in x-axis) with the predicted class (in y-axis)
• Receiver operating characteristic (ROC) curve: shows the trade-off between the true positive rate (in y-axis) and the false-positive rate (in x-axis) for a given model (Han & Kamber, 2006)
Contents
1. Introduction
2. Related literature
3. Artificial neural networks and pattern recognition
3.1. Artificial neural network models
3.2. Training the artificial neural network
3.3. Post-training analysis
4. Data and methodology
5. Main results
6. Final remarks
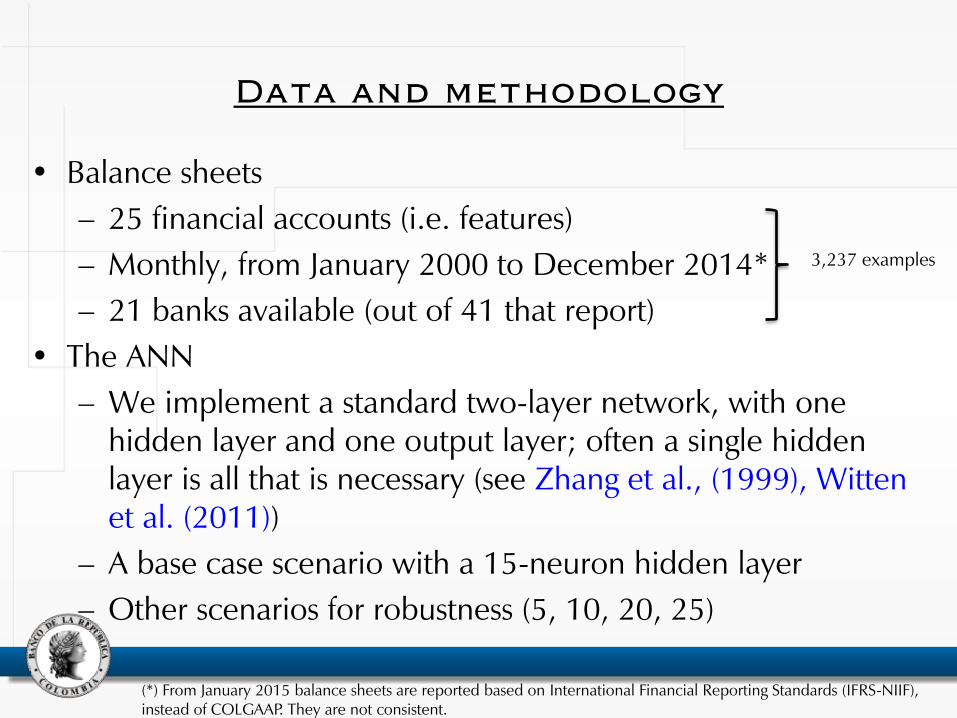
Data and methodology
• Balance sheets
– 25 financial accounts (i.e. features)
– Monthly, from January 2000 to December 2014*
– 21 banks available (out of 41 that report)
• The ANN
– We implement a standard two-layer network, with one hidden layer and one output layer; often a single hidden layer is all that is necessary (see Zhang et al., (1999), Witten et al. (2011))
– A base case scenario with a 15-neuron hidden layer
– Other scenarios for robustness (5, 10, 20, 25)
(*) From January 2015 balance sheets are reported based on International Financial Reporting Standards (IFRS-NIIF), instead of COLGAAP. They are not consistent.
3,237 examples
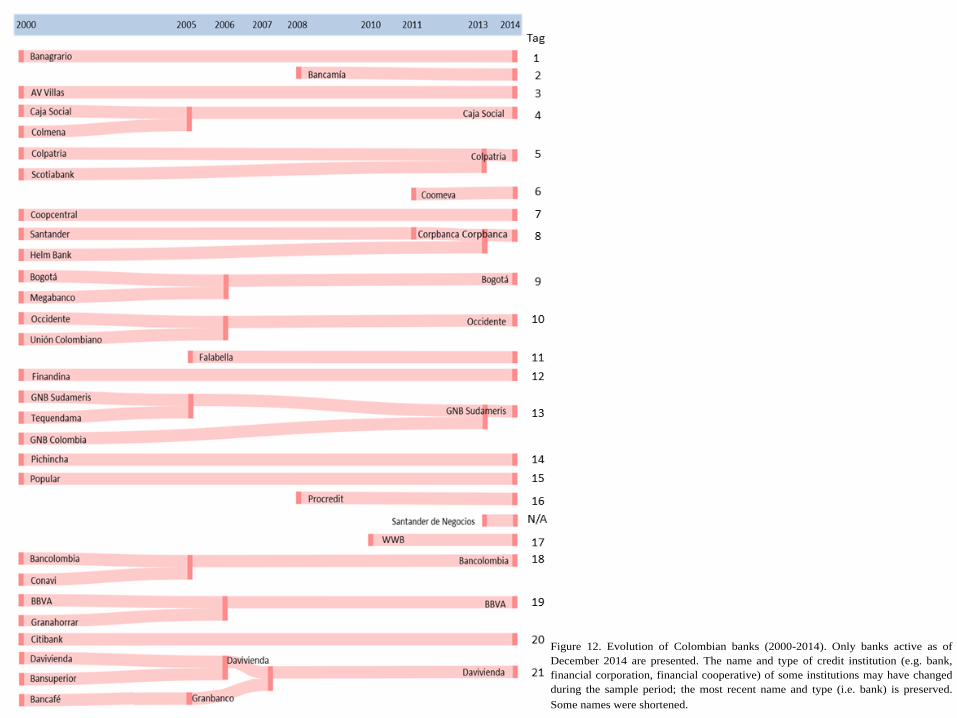
Figure 12. Evolution of Colombian banks (2000-2014). Only banks active as of
December 2014 are presented. The name and type of credit institution (e.g. bank,
financial corporation, financial cooperative) of some institutions may have changed
during the sample period; the most recent name and type (i.e. bank) is preserved.
Some names were shortened.
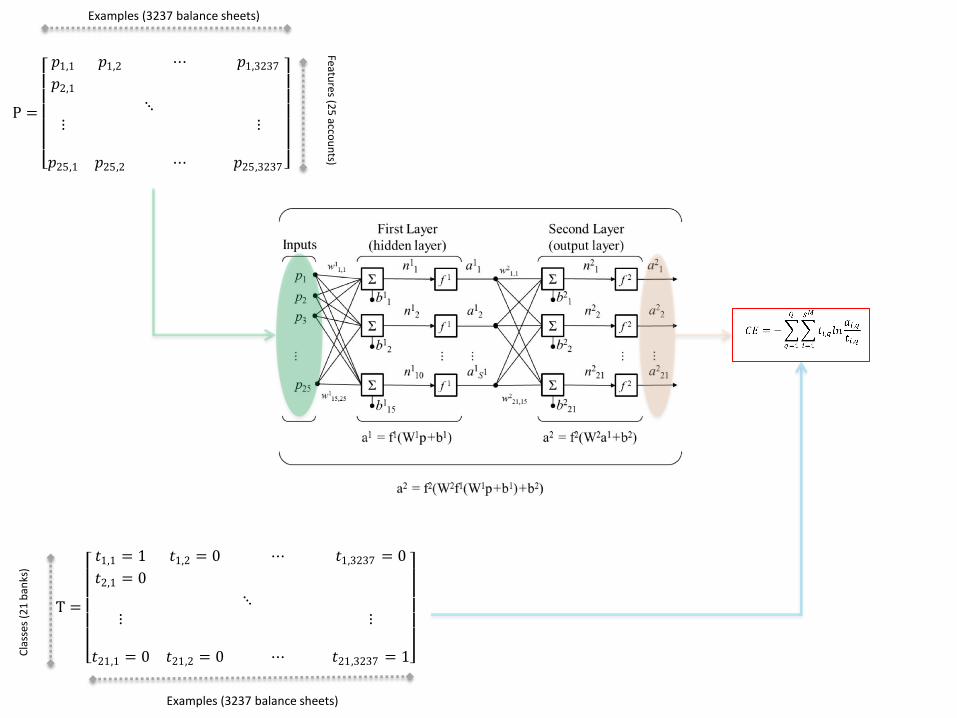
P =
𝑝1,1 𝑝1,2 ⋯ 𝑝1,3237𝑝2,1
⋱⋮ ⋮
𝑝25,1 𝑝25,2 ⋯ 𝑝25,3237
Examples (3237 balance sheets) C
lass
es (
21
ban
ks)
T =
𝑡1,1 = 1 𝑡1,2 = 0 ⋯ 𝑡1,3237 = 0
𝑡2,1 = 0
⋱⋮ ⋮
𝑡21,1 = 0 𝑡21,2 = 0 ⋯ 𝑡21,3237 = 1
Examples (3237 balance sheets)
Features (2
5 acco
un
ts)
Contents
1. Introduction
2. Related literature
3. Artificial neural networks and pattern recognition
3.1. Artificial neural network models
3.2. Training the artificial neural network
3.3. Post-training analysis
4. Data and methodology
5. Main results
6. Final remarks
Main results
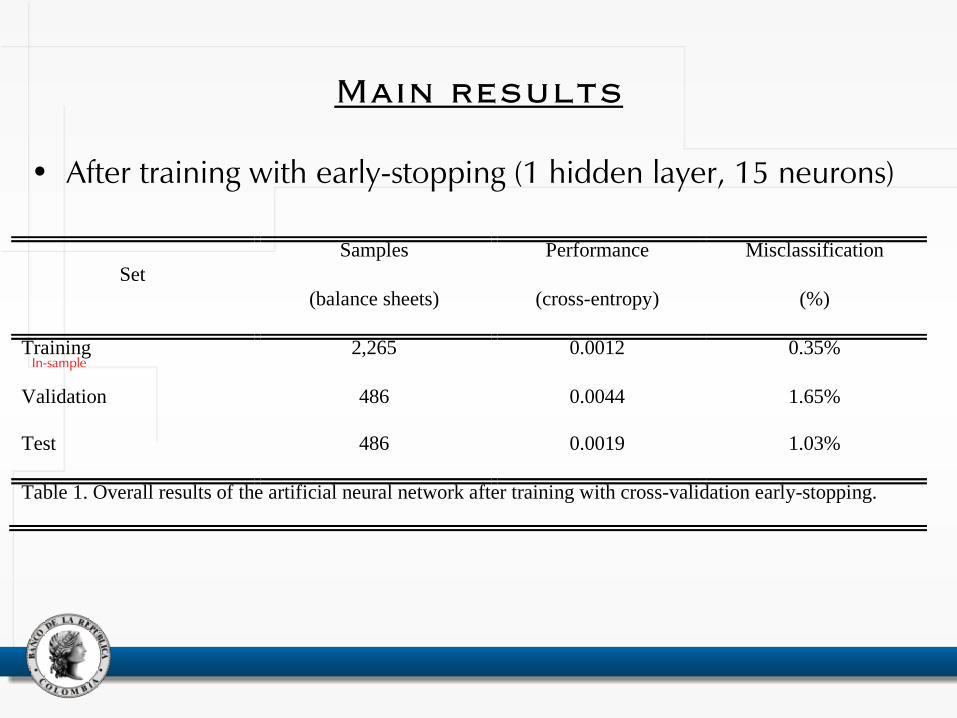
• After training with early-stopping (1 hidden layer, 15 neurons)
Set
Samples
(balance sheets)
Performance
(cross-entropy)
Misclassification
(%)
Training 2,265 0.0012 0.35%
Validation 486 0.0044 1.65%
Test 486 0.0019 1.03%
Table 1. Overall results of the artificial neural network after training with cross-validation early-stopping.
In-sample
Main results
• After training with early-stopping (1 hidden layer, 15 neurons)
•In-sample
•Out-of-sample #1
•Out-of-sample #2
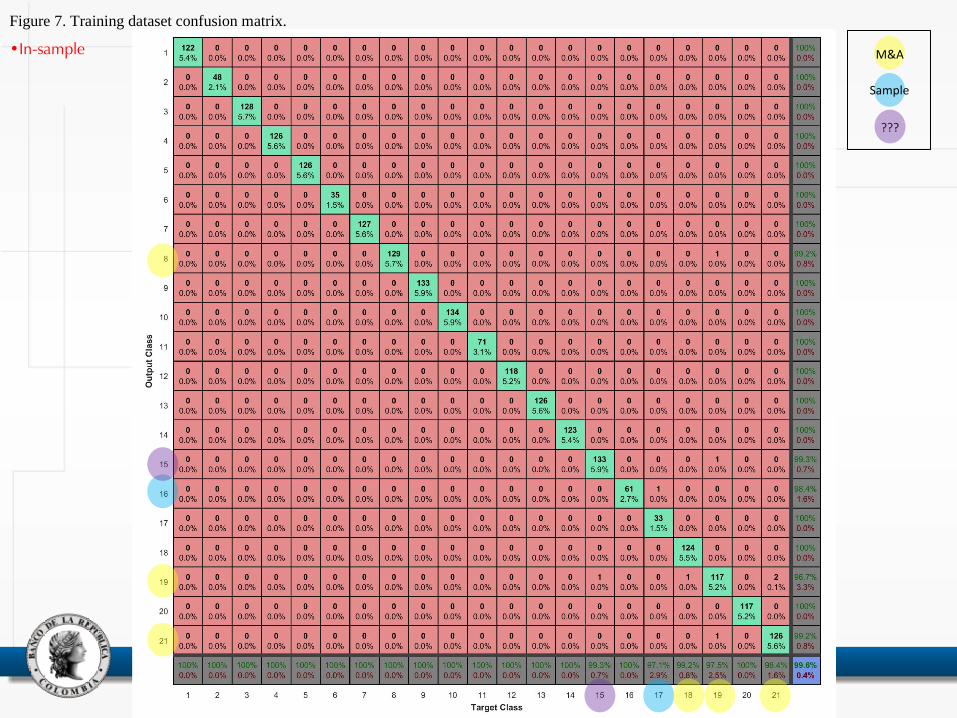
Figure 7. Training dataset confusion matrix.
Figure 7. Training dataset confusion matrix.
•In-sample M&A
Sample
???
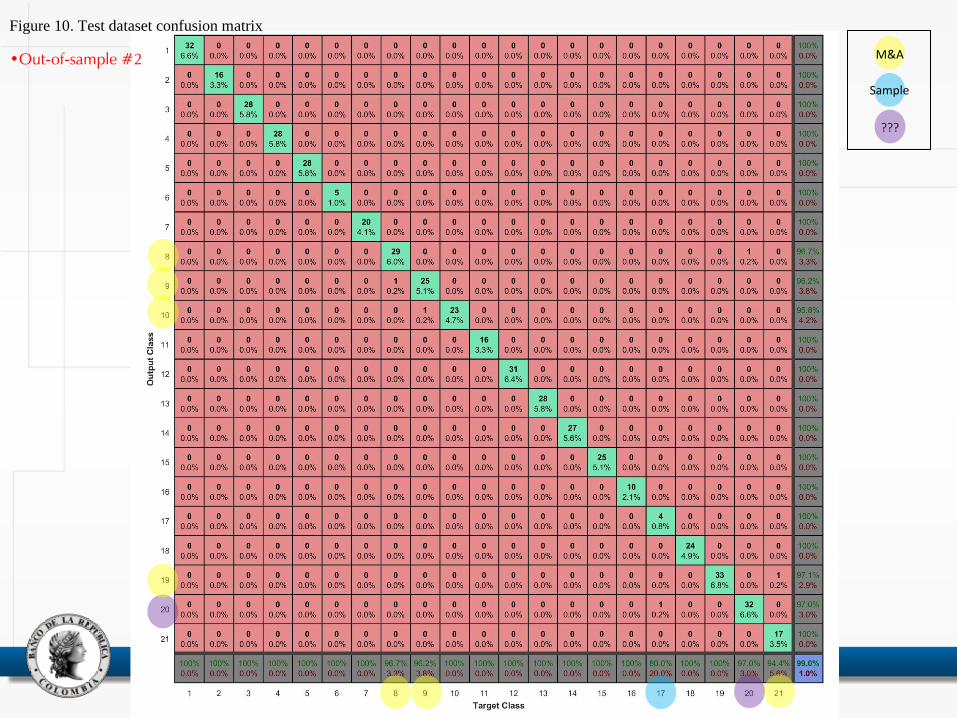
Figure 10. Test dataset confusion matrix
Figure 10. Test dataset confusion matrix
•Out-of-sample #2 M&A
Sample
???
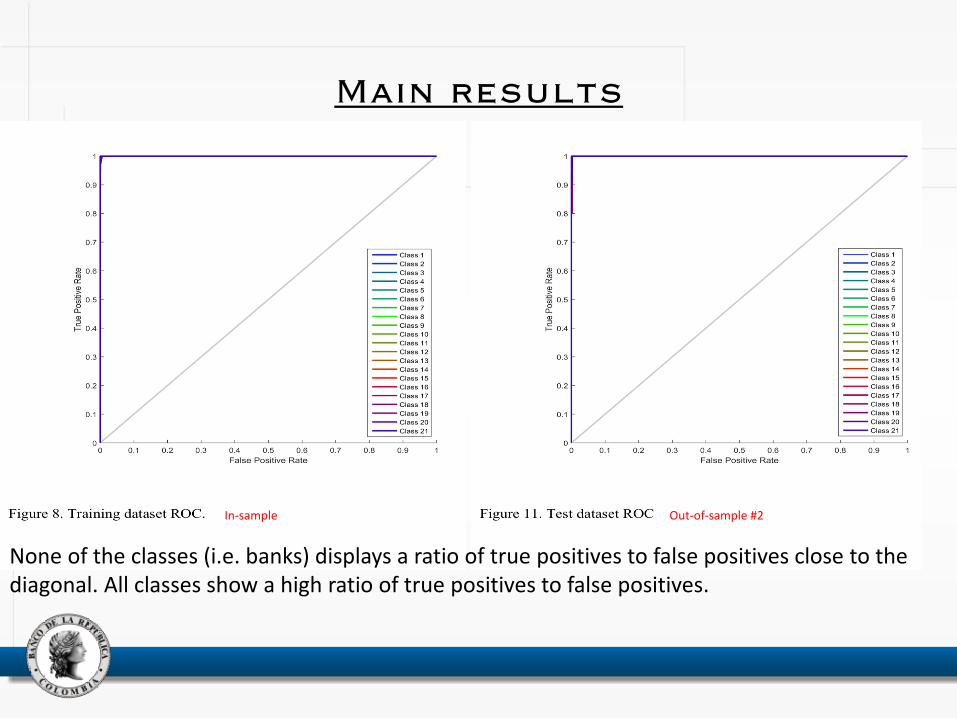
Main results
None of the classes (i.e. banks) displays a ratio of true positives to false positives close to the diagonal. All classes show a high ratio of true positives to false positives.
In-sample Out-of-sample #2
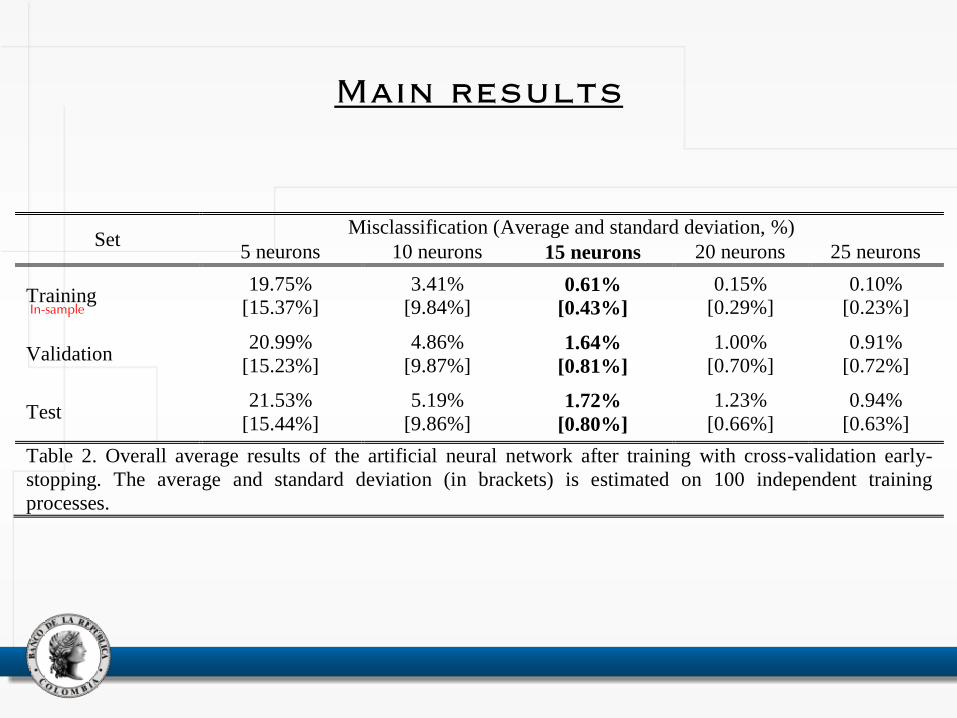
Set Misclassification (Average and standard deviation, %)
5 neurons 10 neurons 15 neurons 20 neurons 25 neurons
Training 19.75%
[15.37%]
3.41%
[9.84%] 0.61%
[0.43%]
0.15%
[0.29%]
0.10%
[0.23%]
Validation 20.99%
[15.23%]
4.86%
[9.87%] 1.64%
[0.81%]
1.00%
[0.70%]
0.91%
[0.72%]
Test 21.53%
[15.44%]
5.19%
[9.86%] 1.72%
[0.80%]
1.23%
[0.66%]
0.94%
[0.63%]
Table 2. Overall average results of the artificial neural network after training with cross-validation early-
stopping. The average and standard deviation (in brackets) is estimated on 100 independent training
processes.
Main results
In-sample
Contents
1. Introduction
2. Related literature
3. Artificial neural networks and pattern recognition
3.1. Artificial neural network models
3.2. Training the artificial neural network
3.3. Post-training analysis
4. Data and methodology
5. Main results
6. Final remarks
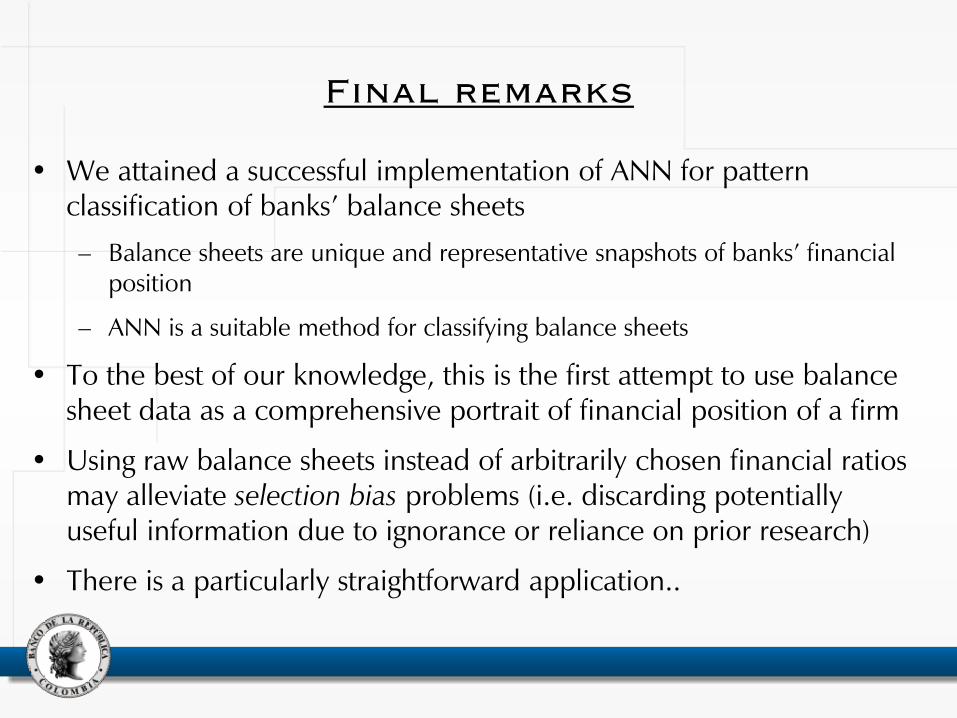
Final remarks
• We attained a successful implementation of ANN for pattern classification of banks’ balance sheets
– Balance sheets are unique and representative snapshots of banks’ financial position
– ANN is a suitable method for classifying balance sheets
• To the best of our knowledge, this is the first attempt to use balance sheet data as a comprehensive portrait of financial position of a firm
• Using raw balance sheets instead of arbitrarily chosen financial ratios may alleviate selection bias problems (i.e. discarding potentially useful information due to ignorance or reliance on prior research)
• There is a particularly straightforward application..
Final remarks
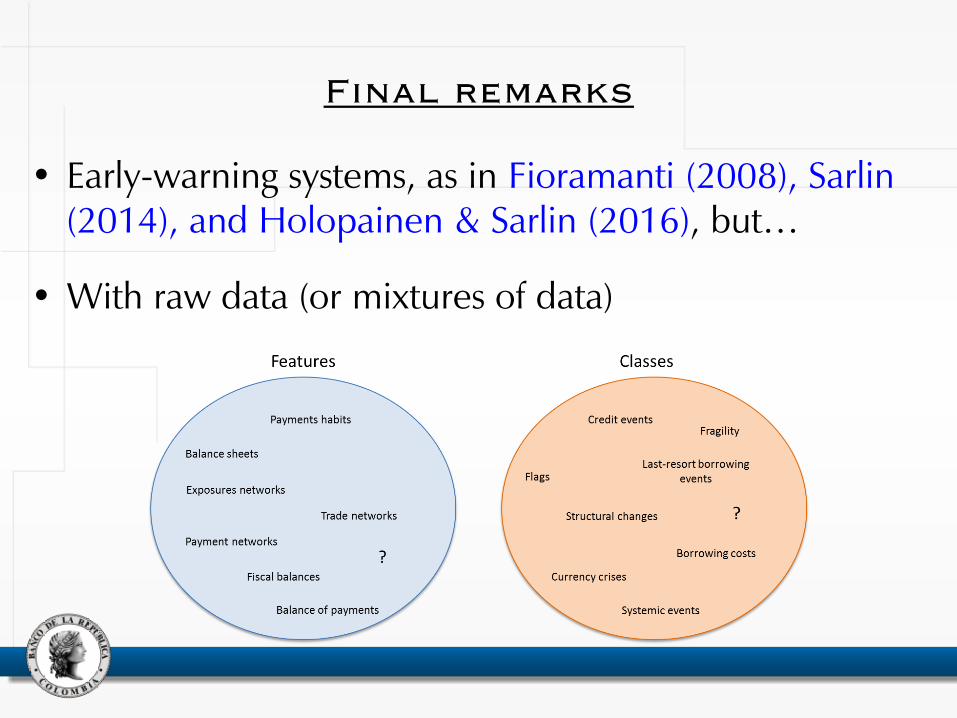
• Early-warning systems, as in Fioramanti (2008), Sarlin (2014), and Holopainen & Sarlin (2016), but…
• With raw data (or mixtures of data)
Final remarks
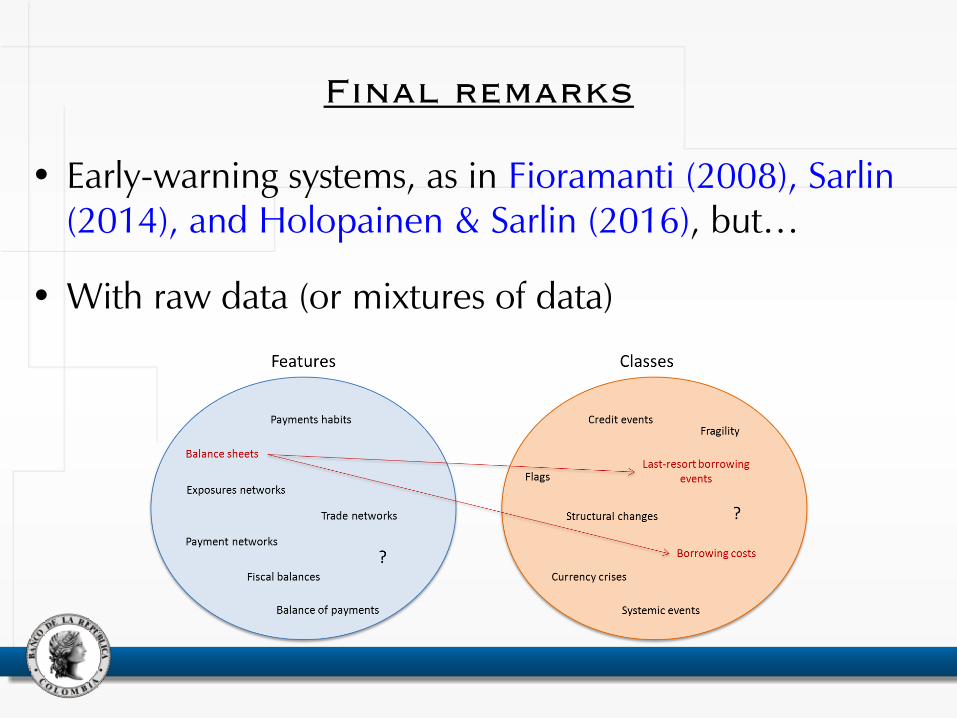
• Early-warning systems, as in Fioramanti (2008), Sarlin (2014), and Holopainen & Sarlin (2016), but…
• With raw data (or mixtures of data)
Final remarks
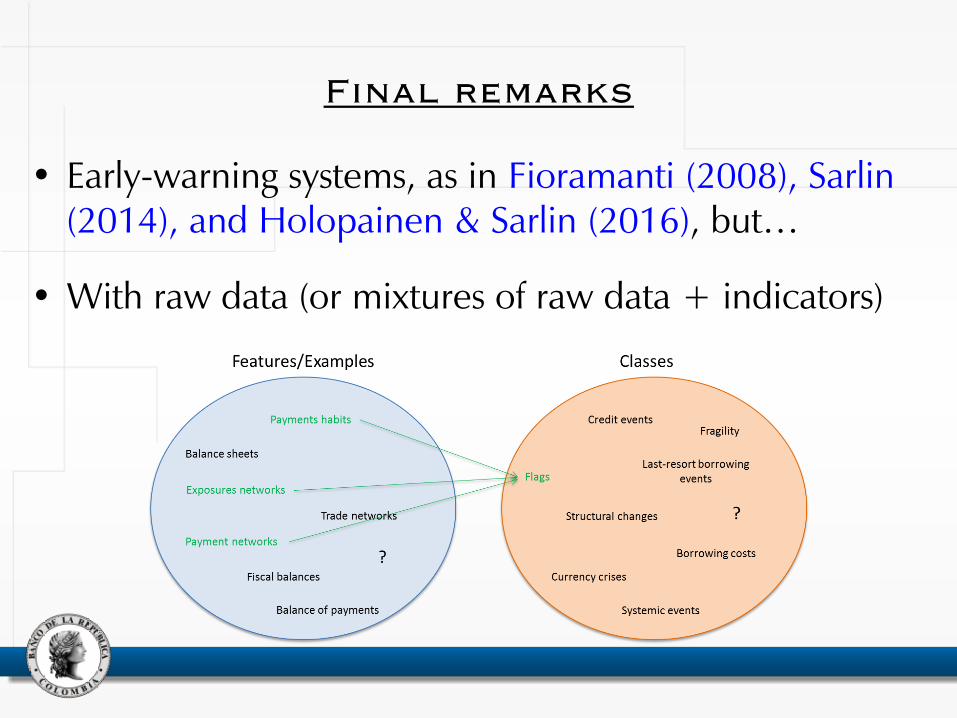
• Early-warning systems, as in Fioramanti (2008), Sarlin (2014), and Holopainen & Sarlin (2016), but…
• With raw data (or mixtures of raw data + indicators)
Big Data & Data Science | Bogotá | Colombia | Octubre 27, 2016
Whose Balance Sheet is this? Neural Networks for Banks’ Pattern Recognition


![Indian Banks - PSU Banks[1]](https://img.pdfslide.us/doc/110x75/577d36f51a28ab3a6b946f03/indian-banks-psu-banks1.jpg)