Embed Size (px)
Citation preview

Simulation based study on storage
policies in a unit load warehouse
S.Jayakanthan091416u

Aisle
Unit load/ Pallet
LITERATURE FINDINGS METHODOLOGY INTRODUCTION CONCLUSION

LITERATURE FINDINGS METHODOLOGY INTRODUCTION
Storage Policies
• Main Issue: Decide how to allocate the various storage locations of a uniform storage medium to a number of SKU’s.
I/O
CONCLUSION

Which storage policy is best to apply in a unit load warehouses under certain situations such as: Different layout configurations, warehouse dimensions, types of inventory and with different SKU activity profiles.
Research Problem
LITERATURE FINDINGS METHODOLOGY INTRODUCTION CONCLUSION

• Analyze total travel distance traveled by the material handling equipment, by implementing different storage policies.
• Analyze changes in picking time by implementing different storage policies.
• Identify the best storage policy to implement in a unit load warehouse of concern.
Aims and objectives of the research
LITERATURE FINDINGS METHODOLOGY INTRODUCTION CONCLUSION
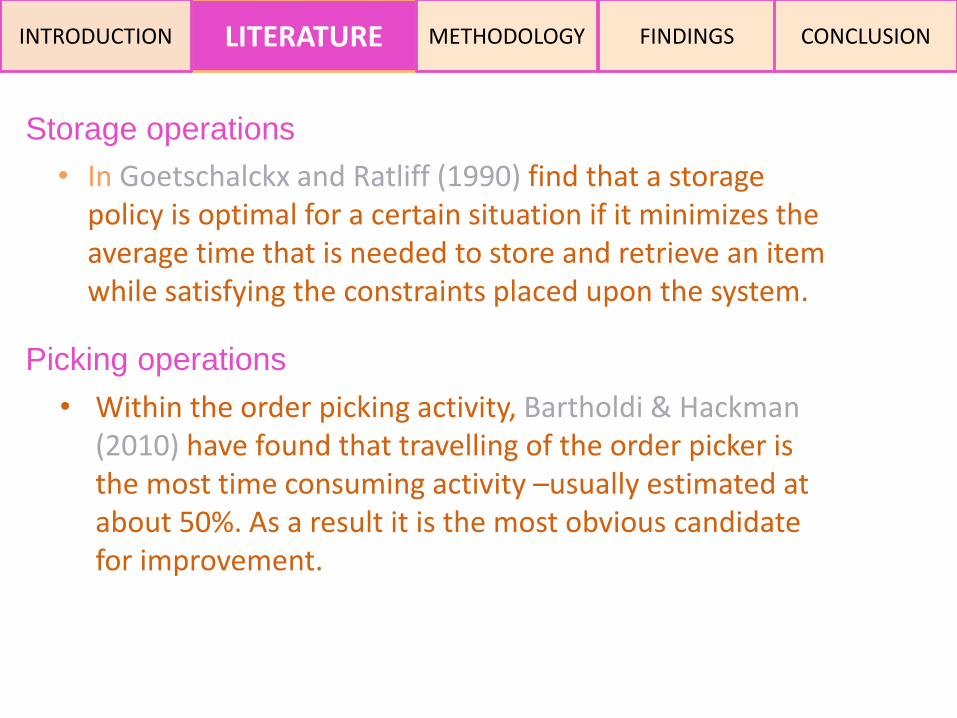
• In Goetschalckx and Ratliff (1990) find that a storage policy is optimal for a certain situation if it minimizes the average time that is needed to store and retrieve an item while satisfying the constraints placed upon the system.
Storage operations
Picking operations
• Within the order picking activity, Bartholdi & Hackman (2010) have found that travelling of the order picker is the most time consuming activity –usually estimated at about 50%. As a result it is the most obvious candidate for improvement.
LITERATURE FINDINGS METHODOLOGY INTRODUCTION CONCLUSION

Types of Storage Policies• Dedicated storage: Every SKU i gets a number of storage
locations, Ni, exclusively allocated to it. The number of storage locations allocated to it, Ni, reflects its maximum storage needs and it must be determined through inventory activity profiling.
• Randomized storage: Each unit from any SKU can be
stored in any available location
• Class-based storage: SKU’s are grouped into classes. Each class is assigned a dedicated storage area, but SKU’s within a class are stored according to randomized storage logic.
LITERATURE FINDINGS METHODOLOGY INTRODUCTION CONCLUSION

Storage policies vs Operational efficiency
• Van den Berg &Zijm, (1999), States travel time will be reduces when move towards dedicated/Full-turnover based storage
LITERATURE FINDINGS METHODOLOGY INTRODUCTION CONCLUSION

METHODOLOGY
• Here simulation is selected as a method because this problem is affected by more variables and from the literature it shows that most of the researchers suggest simulation as a best tool to analyze storage policies eg: Kristian, (2009).
• Here I have chosen Microsoft Excel and Visual basic for applications (VBA) as a programming tool to create the simulator
• The overall objective of the simulation will be measuring the travel time by the material handling equipment, under different conditions.
Simulation
FINDINGS INTRODUCTION CONCLUSION LITERATURE

METHODOLOGY
• The warehouse size is fixed and has the capacity to store the entire stock of the selected SKU database
• Quantities are measured in terms of pallets of in equal size
• Dispatch and receiving both occurred in full pallet loads
• Dispatch quantity and order quantity are fixed amounts and there is no inventory shortage during the simulation period
• These SKU’s following Pereto’s 80/20 rule
Simulation Assumptions
FINDINGS INTRODUCTION CONCLUSION LITERATURE
METHODOLOGY
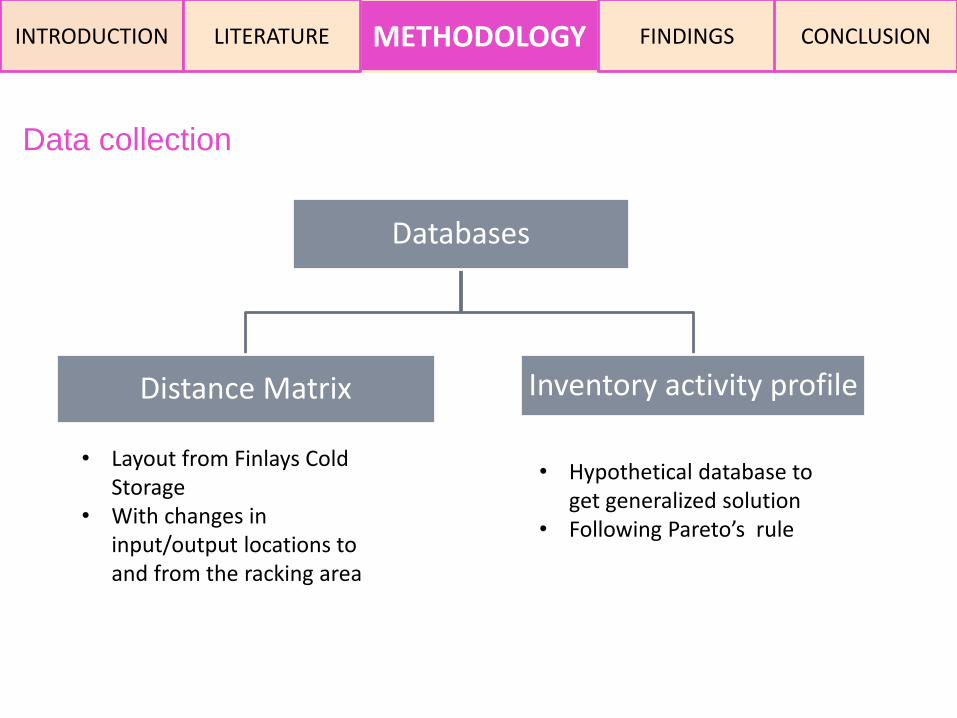
Data collection
FINDINGS INTRODUCTION CONCLUSION LITERATURE
Databases
Distance Matrix Inventory activity profile
• Layout from Finlays Cold Storage
• With changes in input/output locations to and from the racking area
• Hypothetical database to get generalized solution
• Following Pareto’s rule
METHODOLOGY
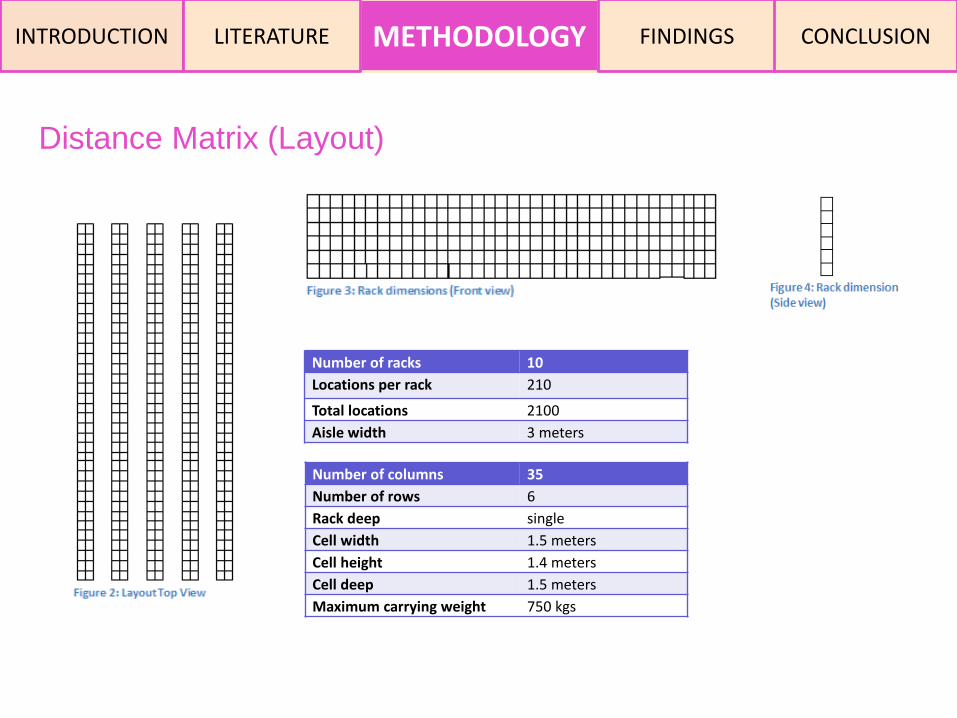
Distance Matrix (Layout)
FINDINGS INTRODUCTION CONCLUSION LITERATURE
Number of racks 10
Locations per rack 210
Total locations 2100
Aisle width 3 meters
Number of columns 35
Number of rows 6
Rack deep single
Cell width 1.5 meters
Cell height 1.4 meters
Cell deep 1.5 meters
Maximum carrying weight 750 kgs
METHODOLOGY
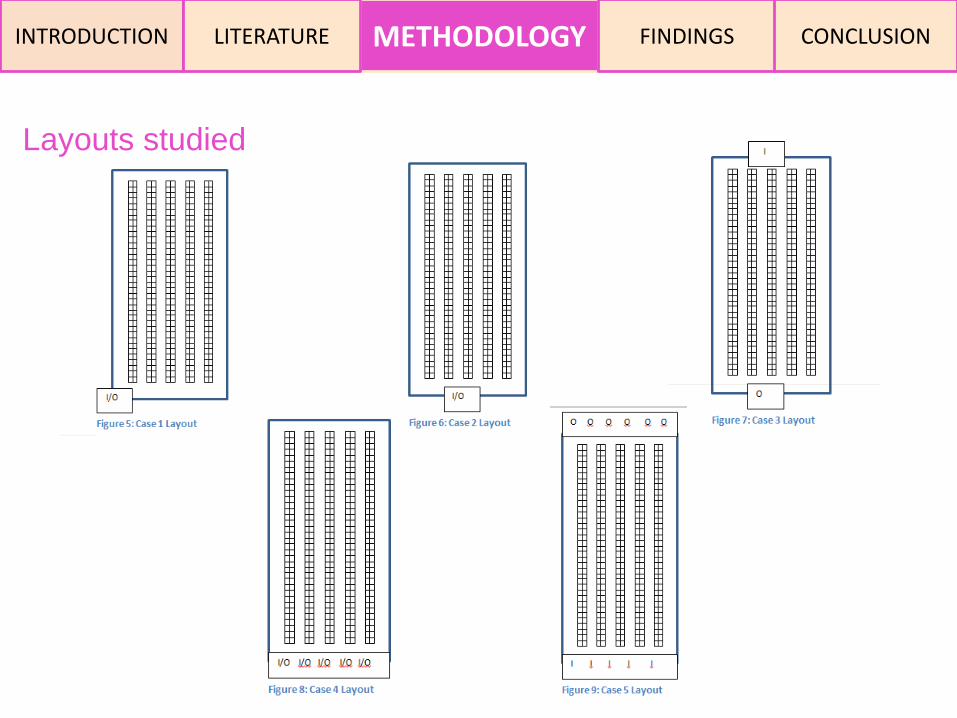
Layouts studied
FINDINGS INTRODUCTION CONCLUSION LITERATURE

METHODOLOGY
Inventory database
FINDINGS INTRODUCTION CONCLUSION LITERATURE
SKU’s percentage Dispatch frequency
10% of the SKU’s 1 (Each day dispatch)
Next 30 % of the SKU’s Greater than 1 and less than 7 (Within a week)
Rest of the 60% of the SKU’s Greater than 7 (Takes more than a week)
SKU id
range Demand
%of
demand
Cumulative
% of
demand
% in the
Categor
y
Categor
y
1 to 10 18250 50% 50% 50% A
11 to 20 6648 18% 18% B
21 to 30 4536 13% 13% 31% B
31 to 40 3972 11% 11% C
41 to 50 429 1% 1% C
51 to 60 499 1% 1% C
61 to 70 572 2% 2% C
71 to 80 434 1% 1% C
81 to 90 390 1% 1% C
91 to 100 534 1% 1% 19% C
36263 100% 100%
0%
50%
100%
150%
10 30 50 70 90
Series1
ABC classification of the inventory SKU popularity distribution

Steps in Simulation
Create distance matrix for that particular layout
Run Inventory movement simulation
Call storage policy
Calculate cost of travel
METHODOLOGY FINDINGS INTRODUCTION CONCLUSION LITERATURE

METHODOLOGY
Inventory movement simulation
FINDINGS INTRODUCTION CONCLUSION LITERATURE
• i = the id of the simulation number.This value will be increased by one at the end of each simulation period. Here the value of (i) has been considered as one day. Therefore within a loop of (i) the actions have been considered as inventory activities within a day.
• Sku = the id of the skuEach sku’s will be considered separately to find out whether it reached a re-order level and scheduled dispatches.
• AvaiQty = Available quantity of that particular sku on that particular day
• DisQty = Dispatching quantity of that particular sku
• OrdQty = ordering quantity of that particular sku
• Next order date = scheduled next (i) where that particular sku need to be dispatched
• Dispatch frequency = The time duration in between two successful dispatch operations based on this value next order date will be calculated
• No.of Sku’s = This is the total number of sku’s available in the scenario for our simulation No.of Sku’s has been taken as 100 skus
• Max.no of simulation = This indicates the number of days we want to run this simulation, for this study it has been taken 1 year (365days) as maximum number of simulation

METHODOLOGY
Random storage policy algorithm
FINDINGS INTRODUCTION CONCLUSION LITERATURE
• Random storage does exactly what it says. For each incoming product, a random location is assigned to it.
• The only prerequisite is that the chosen location is still available. The storage location then needs to be recorded for future retrieval jobs.
• Some authors (e.g. de Koster et al., 2007) claim that it can only be implemented correctly in a computer-controlled environment. If operators are to choose freely, they will most likely opt for the first open location, which would result into closest-open location storage instead.
• This particular policy has been extensively used in other research as a basis to look at the performance of picking policies. The reason why it has been used so much is quite straightforward; it is very simple to apply, no additional data is needed and it often requires less space than other storage policies (Petersen II et al., 1999).
• Random storage can also be described as an extreme case of class-based storage, where there is only one class. Class-based storage will be discussed later in this section. According to Chan et al. (2011), random storage is often used in bulk storage areas that utilize a computerized inventory system.

METHODOLOGY
Class based storage policy algorithm
FINDINGS INTRODUCTION CONCLUSION LITERATURE

METHODOLOGY
Simulation Scenarios
FINDINGS INTRODUCTION CONCLUSION LITERATURE
Layout scenario Storage policySimulation ID
Case 1 Random storageWS001
Class based storageWS002
Case 2 Random storageWS003
Class based storageWS004
Case 3 Random storageWS005
Class based storageWS006
Case 4 Random storageWS007
Class based storageWS008
Case 5 Random storageWS009
Class based storageWS010

Total travel distance & time during 365 days of simulation
FINDINGS INTRODUCTION CONCLUSION LITERATURE METHODOLOGY
Simulation ID Layout Type Storage policyTotal Travel Distance
(Km)Total Travel Time (hrs)
WS001Case1
Random Storage 7445.50 930.69
WS002 Class based storage 4485.06 560.63
WS003Case2
Random Storage 6687.31 835.91
WS004 Class based storage 3881.09 485.14
WS005Case3
Random Storage 6714.44 839.30
WS006 Class based storage 5387.08 673.39
WS007Case4
Random Storage 5148.83 643.60
WS008 Class based storage 2645.45 330.68
WS009Case5
Random Storage 5151.56 643.94
WS010 Class based storage 4627.86 578.48

Total travel distance & time during 365 days of simulation
FINDINGS INTRODUCTION CONCLUSION LITERATURE METHODOLOGY
0.00
1000.00
2000.00
3000.00
4000.00
5000.00
6000.00
7000.00
8000.00
Case 1 Case 2 Case 3 Case 4 Case 5
Random Storage
Class based storage

Total travel savings when applying class based storage policy
FINDINGS INTRODUCTION CONCLUSION LITERATURE METHODOLOGY
Layout
type
Random
Storage
Class based
storage
Savings% of cost
saving
Case 1 7445.50 4485.06 2960.44 39.76
Case 2 6687.31 3881.09 2806.22 41.96
Case 3 6714.44 5387.08 1327.36 19.77
Case 4 5148.83 2645.45 2503.38 48.62
Case 5 5151.56 4627.86 523.69 10.17
0.00
1000.00
2000.00
3000.00
4000.00
5000.00
6000.00
7000.00
8000.00
Case 1 Case 2 Case 3 Case 4 Case 5
Random Storage Class based storage Savings
• If this warehouse practices random storage policy then there will be no much impact on using across aisle layout or U type layout.
• If this warehouse practices class based storage policy then U type layouts are much more effective than across aisle type layouts.

Layouts studied
FINDINGS INTRODUCTION CONCLUSION LITERATURE METHODOLOGY

Total travel savings when applying class based storage policy
FINDINGS INTRODUCTION CONCLUSION LITERATURE METHODOLOGY
Layout
type
Random
Storage
Class based
storage
Savings% of cost
saving
Case 1 7445.50 4485.06 2960.44 39.76
Case 2 6687.31 3881.09 2806.22 41.96
Case 3 6714.44 5387.08 1327.36 19.77
Case 4 5148.83 2645.45 2503.38 48.62
Case 5 5151.56 4627.86 523.69 10.17
0.00
1000.00
2000.00
3000.00
4000.00
5000.00
6000.00
7000.00
8000.00
Case 1 Case 2 Case 3 Case 4 Case 5
Random Storage Class based storage Savings
• If this warehouse practices random storage policy then there will be no much impact on using across aisle layout or U type layout.
• If this warehouse practices class based storage policy then U type layouts are much more effective than across aisle type layouts.

• The best performance in terms of total travel distance and time savings come from class based storage.
• The layout type with multiple input output locations at one side of the racking area achieve 48.62% of total travel distance saving when applying class based storage, this is the best possible combination with highest cost saving.
• And two across aisle I type layouts has been analyzed in case 3 and case 5 both are having travel distance savings respectively 19.77% and 10.17%. These are two lowest values in this study.
• Class based policies are less affective to across aisle layouts with input and output points at opposite sides, compare to layouts which have input and output points at same side.
INTRODUCTION CONCLUSIONLITERATURE METHODOLOGY FINDINGS
Conclusions and Recommendations

• It has been assumed dispatch and receiving both occurred in full pallet loads. But in practical situation lots will be ordered in cases also, which may lead to order batching.
• The recommendation found here is significant only if the inventory follows Pereto’s 80/20 rule. Otherwise applying class based storage policy is questionable.
• The congestion factor of the research has not been studied, that also has to be taken into consideration. If the sku’s has high correlation in dispatch or receiving times then the congestion will be have high impact that need to be studied.
INTRODUCTION CONCLUSIONLITERATURE METHODOLOGY FINDINGS
Limitations of the research

• Probabilistic inventory movement can be used to study this simulation again.
• Simulation program can be re-developed in a way to simulate case picking warehouse, here different pickling policies also can be studied.
• Congestion factor can be taken into account when simulating and analyzing the results then time delay due to congestion also taken into consideration.
• Finally there is lack of research in warehouse domain studying storage policies qualitatively and quantitatively but at once that may lead to a better decision support tool if studied.
INTRODUCTION CONCLUSIONLITERATURE METHODOLOGY FINDINGS
Suggestions and recommendations for future research

Thank you

INTRODUCTION METHODOLOGY LITERATURE PROBLEM
Create distance matrix (Notations)
Nr : No of RacksNc : No of Columns in rackNr : No of Rows in rackDr : Deep of the rackWa : Aisle WidthLc : Cell LengthHc : Cell Height Dc : Cell Depth Ia : Input AisleOa : Output Aislen : Racki : Columnj : Rowk : DeepLnijk : Location SDnijk : Distance from input point to location Lnijk (Storage Distance)PDnijk : Distance from output point to location Lnijk (Picking Distance)TDnijk : Total Distance

INTRODUCTION METHODOLOGY LITERATURE PROBLEM
Create distance matrix (Notations)
If Ia and Oa are in same side then
SDnijk = i.Lc + j.Hc + |(Ia - (n + k – 1)) * (Dr.Dc + Wa)|
PDnijk = i.Lc + j.Hc + |(Oa – (n + k-1)) * (Dr.Dc + Wa)|
If Ia and Oa are in opposite side then
SDnijk = i.Lc + j.Hc + |(Ia - (n + k – 1)) * (Dr.Dc + Wa)|
PDnijk = (Nc-i + 1).Lc + j.Hc + |(Oa – (n + k-1)) * (Dr.Dc + Wa)|
TDnijk = SDnijk + PDnijk

INTRODUCTION METHODOLOGY LITERATURE PROBLEM
Screen shots of the simulation program