Embed Size (px)
Citation preview

1
Dept. of Civil Engineering
Course No: CE 452
TRANSPORTATION
ENGINEERING SESSIONAL -II
2
Course Instructor: Mr. Minhazul Islam
Khan (Lecturer)
Ms. Nuzhat (Lecturer)
3
Presentation on
Traffic Volume Study
Presented by4th Year 2nd Semester
Section; B
Group No: 4
4
Name Student ID
Wasi Uddin Ahmed 11.01.03.129
Shahana Akter Esha 11.01.03.073
Farjana Rahman Tripty 11.01.03.077
Suhana Sultana 11.01.03.095
Antora Dhali 11.01.03.114
Shajeda Allam Mahbuba 10.01.03.103
Sazzad Hussain 10.01.03.152
Tuhin Hasan 10.01.03.156
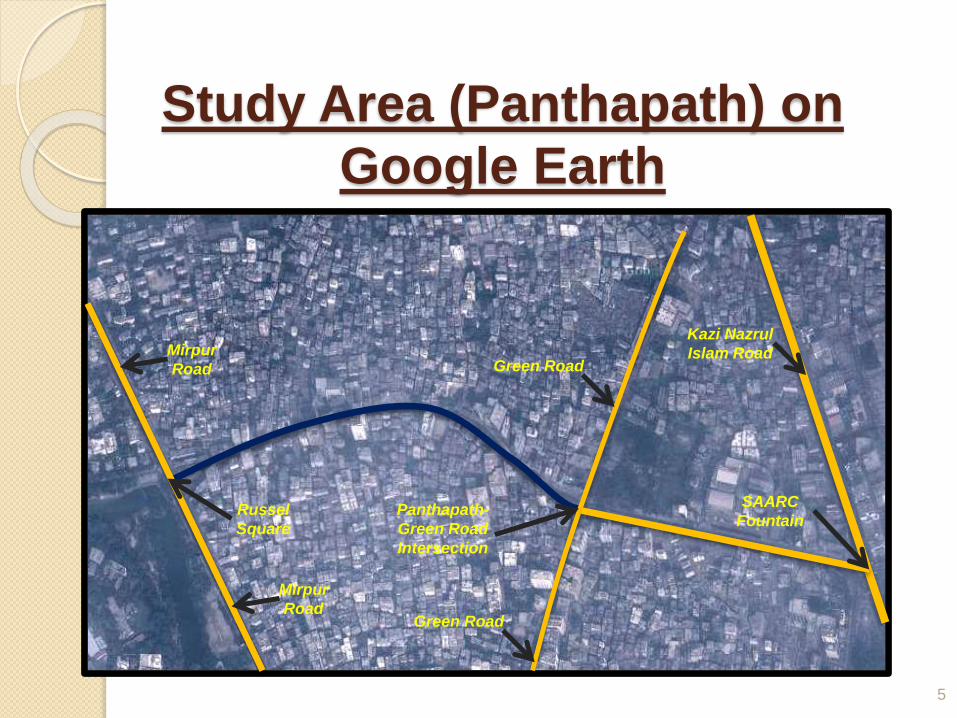
Study Area (Panthapath) on
Google Earth
Mirpur
Road
Russel
Square
Panthapath-
Green Road
Intersection
Green Road
SAARC
Fountain
Green Road
Mirpur
Road
Kazi Nazrul
Islam Road
5
Presentation Contents
6
Introduction General Objectives of Traffic Volume Study Methodology Survey procedure Data Collection Analysis of collected data Conclusion Recommendations Limitations of the Study

OBJECTIVES
7
Design purposes•Structural and geometric design
• Intersection design
• Design of side walks, pedestrian crossing etc.
Improvement purposes•Allocation of limited maintenance budget rationally
• Improvement of roadway operating condition
Planning purposes• Planning of road maintenance and improvement policies
• Deciding if there is need for improvement or expansion
Other purposes• Dynamic traffic management
• Estimation of highway use
• Measurement of current demand of a facility
• Economic feasibility evaluation
• Computation of accident rates
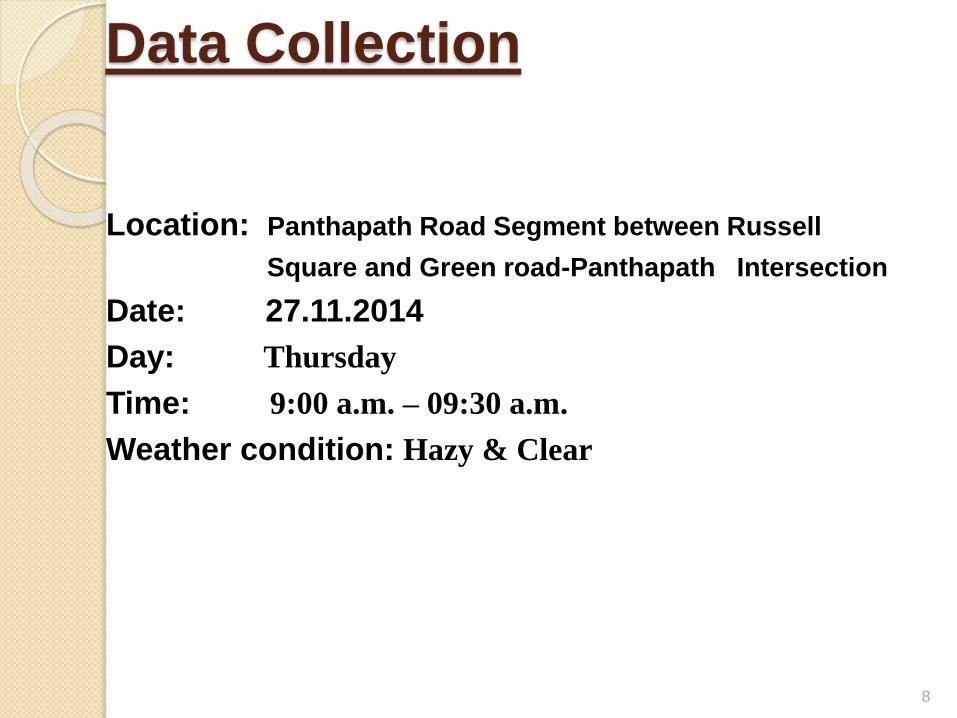
Data Collection
Location: Panthapath Road Segment between Russell
Square and Green road-Panthapath Intersection
Date: 27.11.2014
Day: Thursday
Time: 9:00 a.m. – 09:30 a.m.
Weather condition: Hazy & Clear
8
9
Objectives of the Study
Determination of Vehicle Composition of traffic
stream
Determination of Service Flow Rate
Determination of Directional Distribution (DD)
Estimation of ADT based on expansion factors
Drawing Flow-fluctuation curve
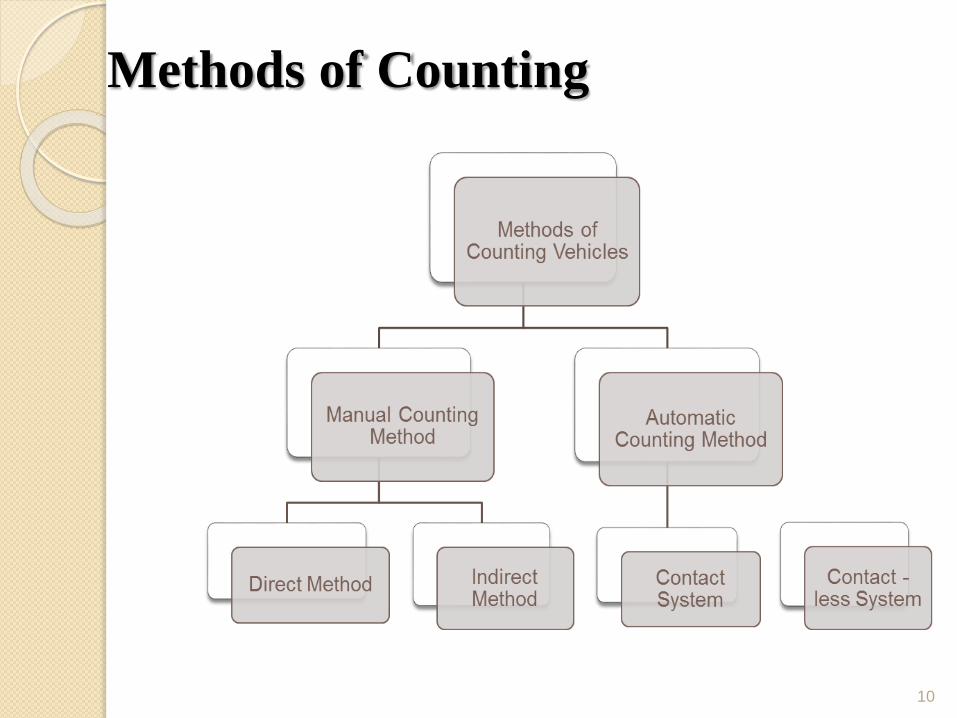
Methods of Counting
10
11
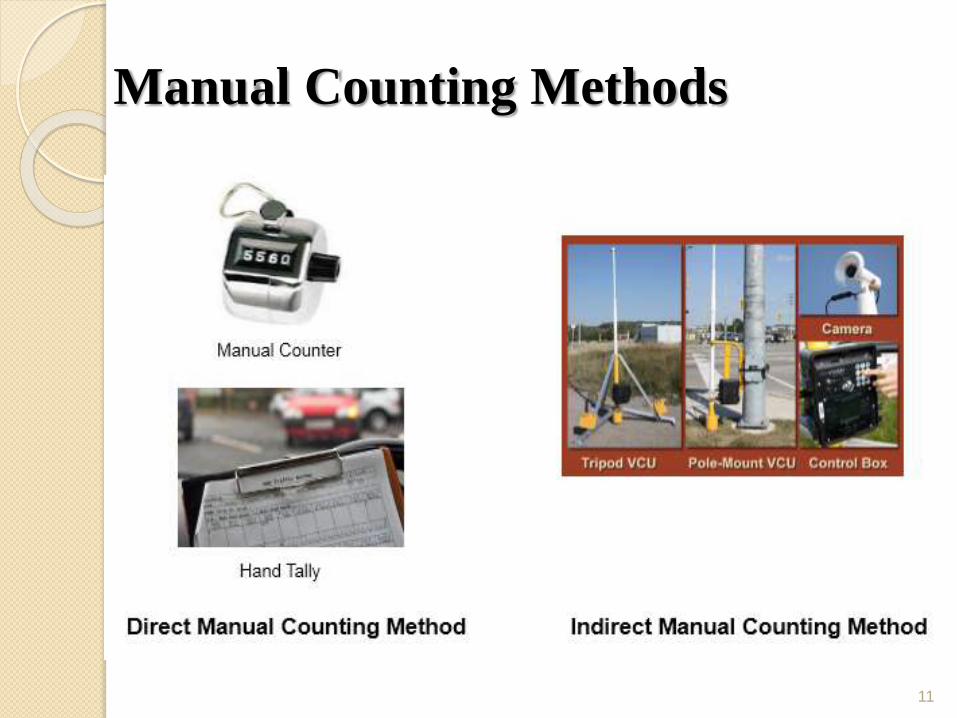
Manual Counting Methods
12
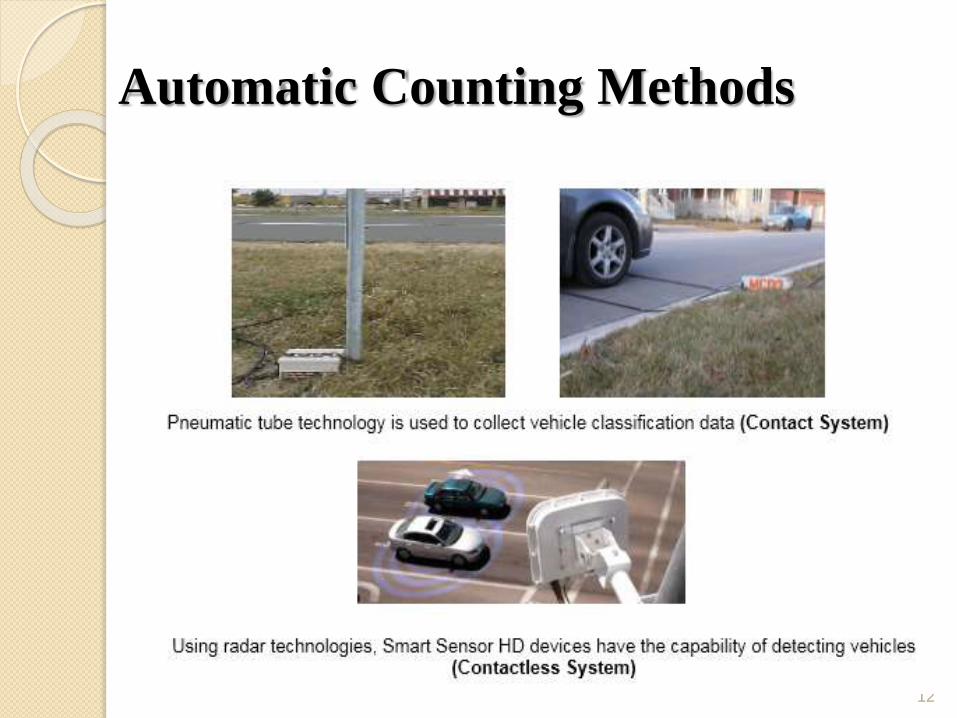
Automatic Counting Methods
13
Selected Method
Manual Method using hand tally and manual counters
Reasons:
Simple and Direct
Classified vehicle count can be obtained
Data can be used immediately after
collection
No special equipment required
14
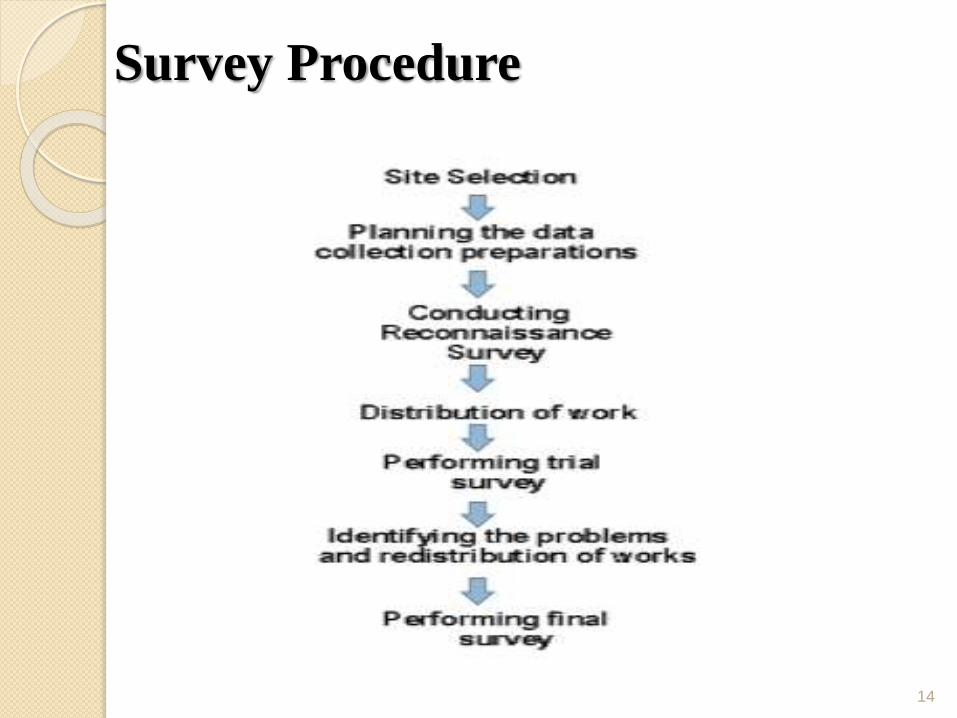
Survey Procedure

15
Analysis of
Collected Data
16
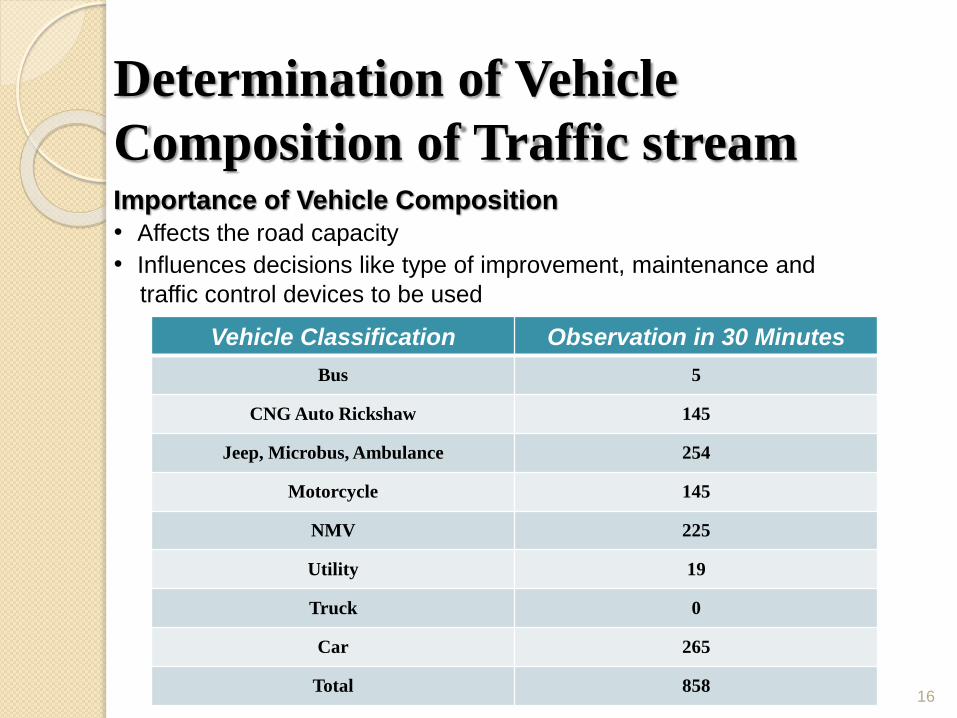
Determination of Vehicle
Composition of Traffic streamImportance of Vehicle Composition
• Affects the road capacity
• Influences decisions like type of improvement, maintenance and
traffic control devices to be used
Vehicle Classification Observation in 30 Minutes
Bus 5
CNG Auto Rickshaw 145
Jeep, Microbus, Ambulance 254
Motorcycle 145
NMV 225
Utility 19
Truck 0
Car 265
Total 858
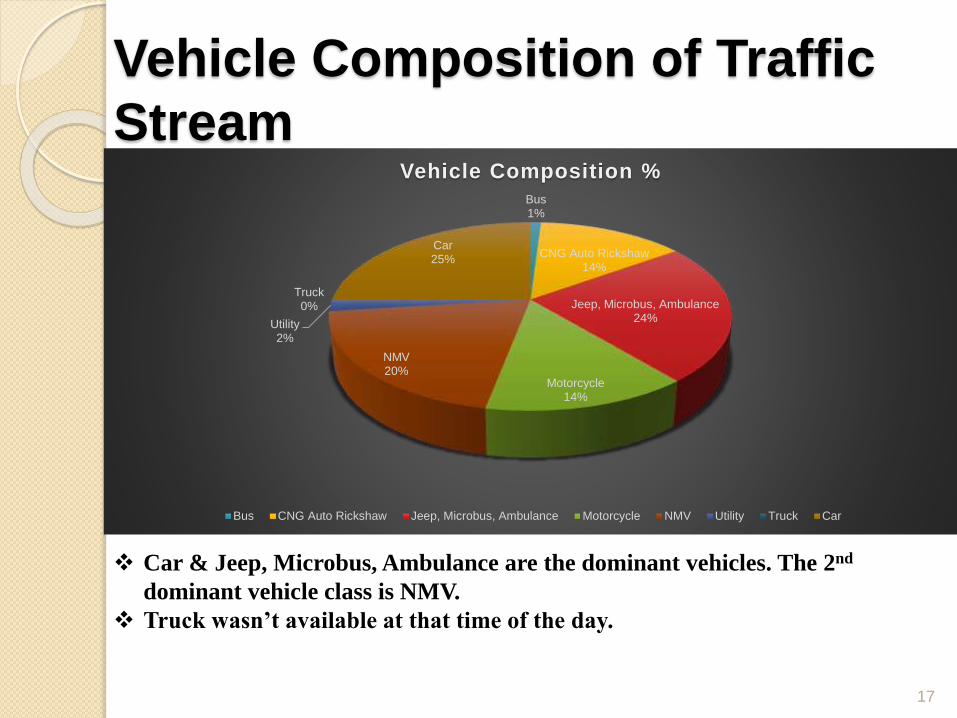
Vehicle Composition of Traffic
Stream
17
Bus1%
CNG Auto Rickshaw14%
Jeep, Microbus, Ambulance24%
Motorcycle14%
NMV20%
Utility2%
Truck0%
Car25%
Vehicle Composition %
Bus CNG Auto Rickshaw Jeep, Microbus, Ambulance Motorcycle NMV Utility Truck Car
Car & Jeep, Microbus, Ambulance are the dominant vehicles. The 2nd
dominant vehicle class is NMV.
Truck wasn’t available at that time of the day.
Definitions
18
Flow Rate
The equivalent hourly rate at which vehicles pass over a given point or section
of a lane or roadway during a given time interval less than 1 hour usually 15
minutes
Service Flow Rate
The maximum hourly rate of a roadway section during a given period under
prevailing roadway condition
Importance of Flow Rate
A short duration count (for e.g. 15 minutes count) can be converted into an
equivalent hourly rate
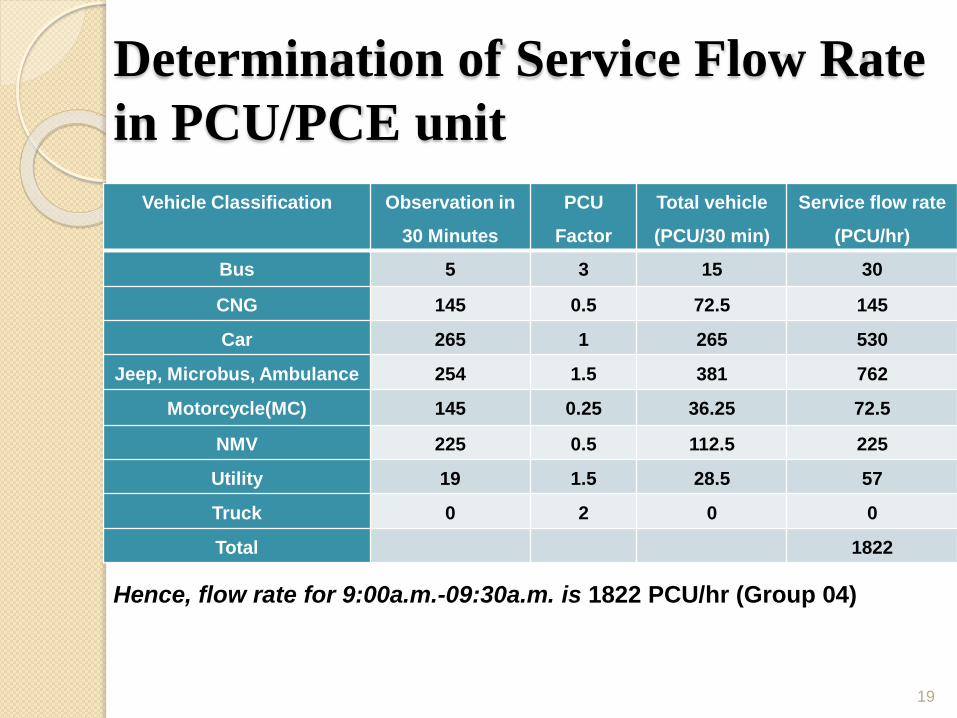
Determination of Service Flow Rate
in PCU/PCE unit
19
Vehicle Classification Observation in
30 Minutes
PCU
Factor
Total vehicle
(PCU/30 min)
Service flow rate
(PCU/hr)
Bus 5 3 15 30
CNG 145 0.5 72.5 145
Car 265 1 265 530
Jeep, Microbus, Ambulance 254 1.5 381 762
Motorcycle(MC) 145 0.25 36.25 72.5
NMV 225 0.5 112.5 225
Utility 19 1.5 28.5 57
Truck 0 2 0 0
Total 1822
Hence, flow rate for 9:00a.m.-09:30a.m. is 1822 PCU/hr (Group 04)
Average Daily Traffic (ADT) and Annual
Average Daily Traffic (AADT)
20
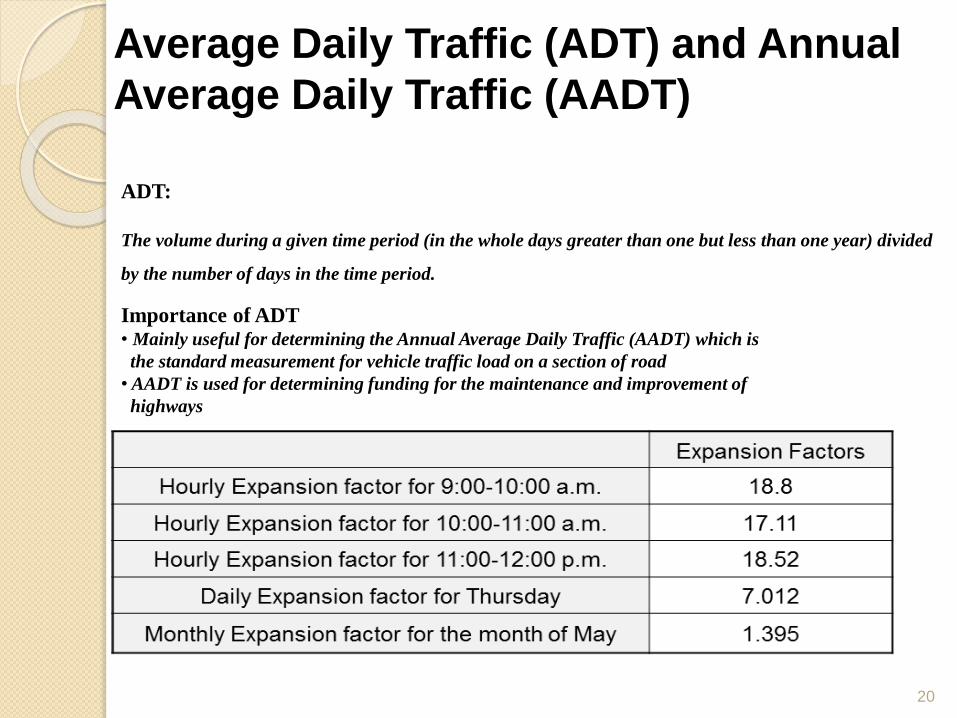
ADT:
The volume during a given time period (in the whole days greater than one but less than one year) divided
by the number of days in the time period.
Importance of ADT• Mainly useful for determining the Annual Average Daily Traffic (AADT) which is
the standard measurement for vehicle traffic load on a section of road
• AADT is used for determining funding for the maintenance and improvement of
highways
21
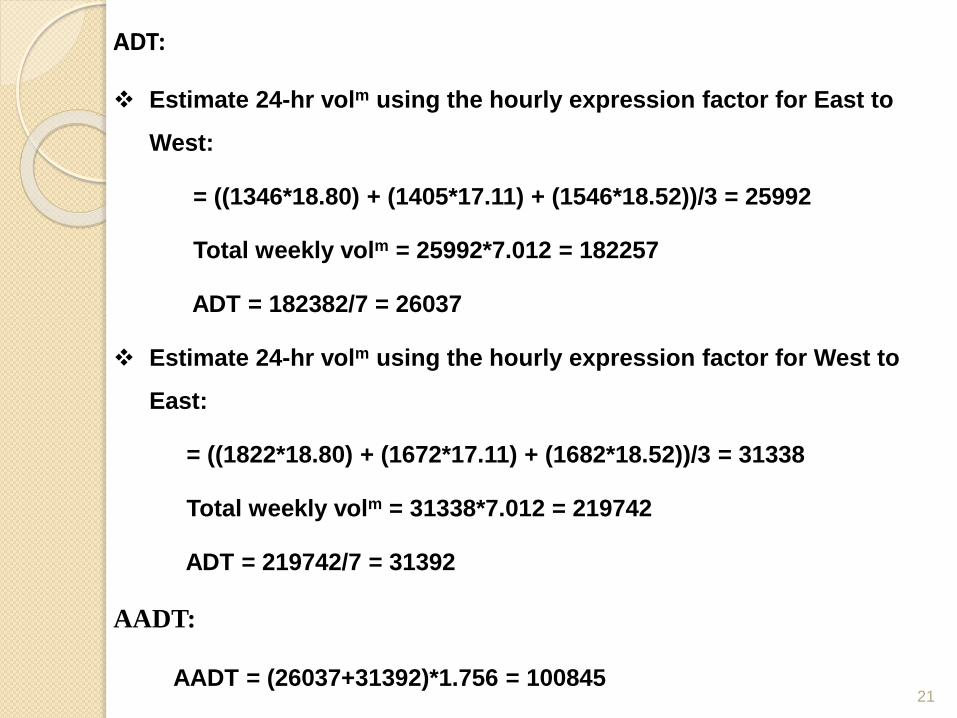
ADT:
Estimate 24-hr volm using the hourly expression factor for East to
West:
= ((1346*18.80) + (1405*17.11) + (1546*18.52))/3 = 25992
Total weekly volm = 25992*7.012 = 182257
ADT = 182382/7 = 26037
Estimate 24-hr volm using the hourly expression factor for West to
East:
= ((1822*18.80) + (1672*17.11) + (1682*18.52))/3 = 31338
Total weekly volm = 31338*7.012 = 219742
ADT = 219742/7 = 31392
AADT:
AADT = (26037+31392)*1.756 = 100845
Determination of Directional
Distribution (DD)
22
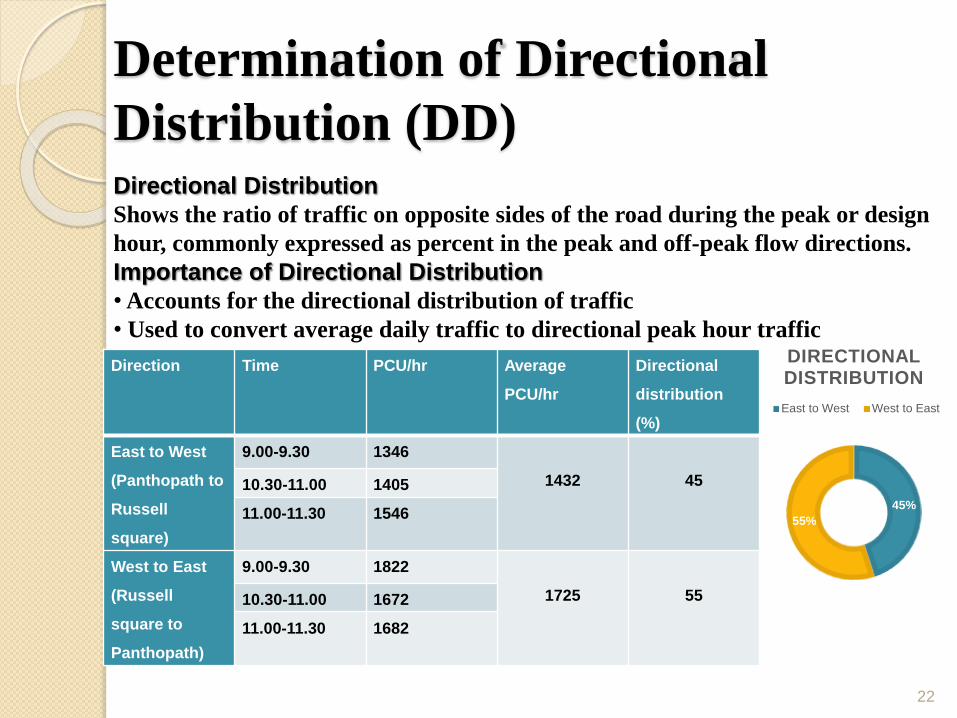
Directional Distribution
Shows the ratio of traffic on opposite sides of the road during the peak or design
hour, commonly expressed as percent in the peak and off-peak flow directions.
Importance of Directional Distribution
•Accounts for the directional distribution of traffic
• Used to convert average daily traffic to directional peak hour traffic
Direction Time PCU/hr Average
PCU/hr
Directional
distribution
(%)
East to West
(Panthopath to
Russell
square)
9.00-9.30 1346
1432 4510.30-11.00 1405
11.00-11.30 1546
West to East
(Russell
square to
Panthopath)
9.00-9.30 1822
1725 5510.30-11.00 1672
11.00-11.30 1682
45%
55%
DIRECTIONAL DISTRIBUTION
East to West West to East
Flow-fluctuation Curves
23
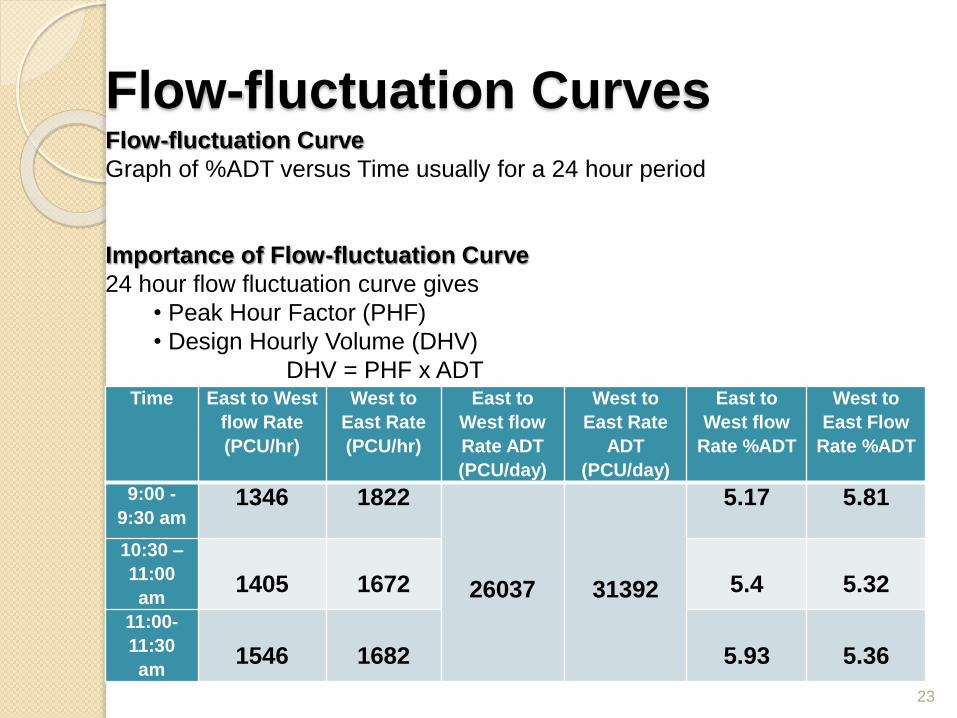
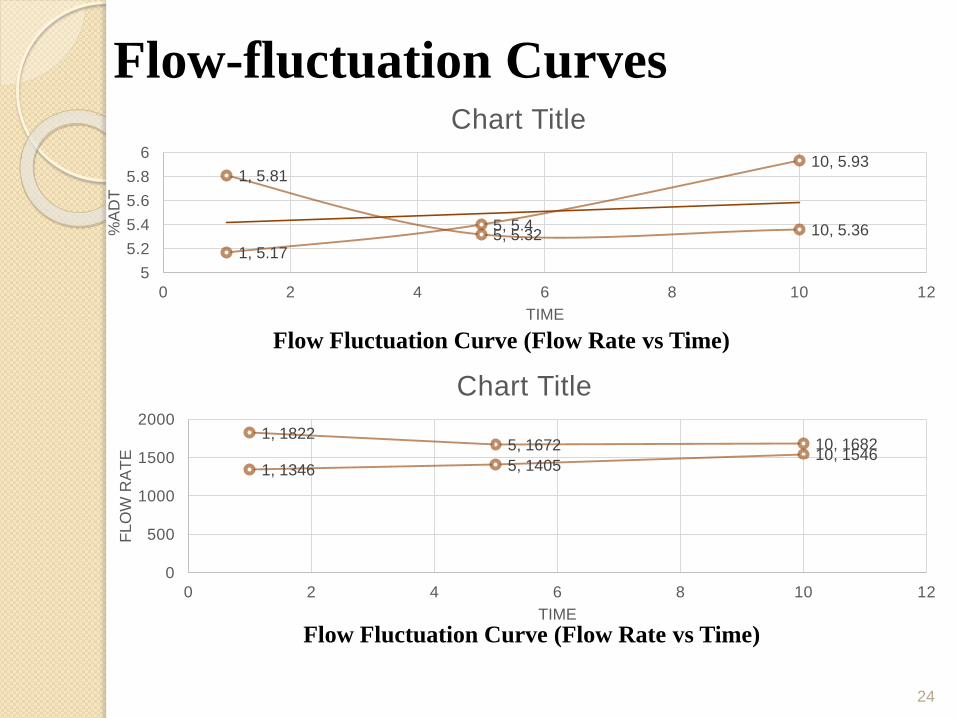
Flow-fluctuation Curve
Graph of %ADT versus Time usually for a 24 hour period
Importance of Flow-fluctuation Curve
24 hour flow fluctuation curve gives
• Peak Hour Factor (PHF)
• Design Hourly Volume (DHV)
DHV = PHF x ADTTime East to West
flow Rate
(PCU/hr)
West to
East Rate
(PCU/hr)
East to
West flow
Rate ADT
(PCU/day)
West to
East Rate
ADT
(PCU/day)
East to
West flow
Rate %ADT
West to
East Flow
Rate %ADT
9:00 -
9:30 am1346 1822
26037 31392
5.17 5.81
10:30 –
11:00
am1405 1672 5.4 5.32
11:00-
11:30
am1546 1682 5.93 5.36
24
1, 5.17
5, 5.4
10, 5.931, 5.81
5, 5.32 10, 5.36
5
5.2
5.4
5.6
5.8
6
0 2 4 6 8 10 12
%A
DT
TIME
Chart Title
Flow-fluctuation Curves
1, 1346 5, 140510, 1546
1, 18225, 1672 10, 1682
0
500
1000
1500
2000
0 2 4 6 8 10 12
FL
OW
RA
TE
TIME
Chart Title
Flow Fluctuation Curve (Flow Rate vs Time)
Flow Fluctuation Curve (Flow Rate vs Time)
Conclusions
25
• Light vehicles were the most frequent vehicle in the corridor which
comprised of 72% of the total traffic volume and least frequent vehicles were
buses comprising only 1% of the total traffic volume.
• The service flow rate obtained for our Group was 1822 PCU/hour.
• The directional distribution in the corridor was 55-45 showing that the
traffic scenario of the site is quite unstable and unplanned.
• The Average Daily Traffic (ADT) for the W-E direction of the road is 31392
vehicles which is a rather low estimation of such a busy street.
• The flow fluctuation curves obtained for both the sides of the road were
rather straight instead of showing profound peaks
Limitations and Recommendations
26
Direct Manual method being less accurate, indirect method using
video recorders should be used for future surveys.
More representative results of service flow rate would be obtained if
24 hours volume is counted and the flow-fluctuation curve would
show two distinct peaks around morning and evening rush hours.
Expansion factors used for the calculation of ADT were developed for
a rural primary road.
Proper enforcement of traffic regulations in the study corridor must
be ensured.
If future surveyors collect data for 24 hours and for 3 days they will
get much more representative results than those obtained in this study.
27
References
Mr. Mudasser Seraj Rafi, Technical Report of Volume Study on A Collector Road
Traffic Volume Counts. Retrieved from:
www.ctre.iastate.edu/pubs/traffichandbook/3trafficcounts.pdf
Volume study. Retrieved from:
http://www.learningace.com/doc/5860600/7f7ee6e961409475037f6cf670aacb85/12_volume-study
V. Thamizharasan and K. Krishnamurthy, Study of the effect of traffic volume and road width on
PCU value of vehicles using microscopic simulation
Kirsten Duivenvoorden, The relationship between traffic volume and road safety on the secondary
road network, www.swov.nl/rapport/D-2010-02.pdf
Roads Department. Ministry of Works and Transport. Roads Department. Private Bag 0026.
Gaborone, Botswana: Traffic Data Collection and Analysis,
www.vegvesen.no/_attachment/61658/binary/14468

28
Thank You