Embed Size (px)
Citation preview

Vibration Study of a OCDC Bracket
EM 406 – Mechanical Vibrations

So what is an OCDC bracket?
OCDC (Operator Controlled Discharge Chute)

Overview of Presentation
Testing • Test Setup
• RT Pro Settings
Results• Reciprocity
• Sample Data and Plots
• Mode Shapes
Analysis• Comparison of Modes
• Lessons Learned
• Discussion & Conclusion

Modal analysis was performed on the OCDC bracket and data was collected.
OCDC Bracket with two accelerometersPlaced in separate locations
Modal Data Collection Setup and Equiptment:Hammer, data acquisition unit, and computer running RT Pro

Details of Test Setup (RT Pro Settings)
Test Setup Details
Analysis Settings
Measurement Points
2048
Frequency Range 1000
Lines 800
Frames Multiple
Windowing Force/Exponential
Averages 5
Trigger Level 2%
Physical Test Settings
Hammer Tip Nylon
Test Points 91
Accelerometer data tapered off properly with Force/Exponential window
Settings were changed until proper coherence was achieved throughoutfrequency range.
0 0.1 0.2 0.3 0.4 0.5 0.6 0.7 0.8-8
-6
-4
-2
0
2
4
6
8Acceleration Response
Time [sec]
Acc
ele
rati
on
[g's
]
0 200 400 600 800 1000 12000
0.1
0.2
0.3
0.4
0.5
0.6
0.7
0.8
0.9
1Coherence
Frequency [HZ]

The layout of the points on bracket
0
1
2
3
4
5
01
23
45
67
0
0.5
1
1.5
2
2.5
3
x
64
71
78
65
72
79
66
73
80
85
89
57
67
74
81
86
90
58
68
75
82
87
91
50
59
69
76
83
88
70
77
84
51
60
43
52
61
44
6263
53
36
45
54
37
5556
46
y
29
38
47
30
4849
39
31
40
1
8
15
4142
32
2
9
16
33
3
10
17
22
26
3435
4
11
18
23
27
5
12
19
24
28
6
13
20
25
7
14
21
z

Sample plots from data collection
0 0.1 0.2 0.3 0.4 0.5 0.6 0.7 0.8-2
0
2
4
6
8
10
12Hammer Impact Force
Ham
me
r Im
pact
Forc
e [
lbf]
Time [sec]
0 200 400 600 800 1000 12000
0.1
0.2
0.3
0.4
0.5
0.6
0.7
0.8
0.9
1Coherence
Frequency [HZ]
0 0.1 0.2 0.3 0.4 0.5 0.6 0.7 0.8-8
-6
-4
-2
0
2
4
6
8Acceleration Response
Time [sec]
Acc
ele
rati
on
[g's
]

Confirmation of linearity in the bracket through a reciprocity test
0 200 400 600 800 1000 120010
-3
10-2
10-1
100
101
102
103
Frequency (Hz)
Mag
nitu
de (
gn/l
bf)
Reciprocity
FRF 1
FRF 2

CMIF Used to Identify Mode Shapes

Mode shapes and Natural Frequencies Mode Description Frequency (Hz)
Bending 163.8
Twisting 216.3
Bending 371.3
Bending/Twisting 491.3
Bending/Twisting 536.3

Mode 1: f = 163.8 Hz & ζ = 0.0084

Mode 2: f = 216.3 Hz & ζ = 0.0064

Mode 3: f = 371.3 Hz & ζ = 0.0038

Mode 4: f = 491.3 Hz & ζ = 0.0040
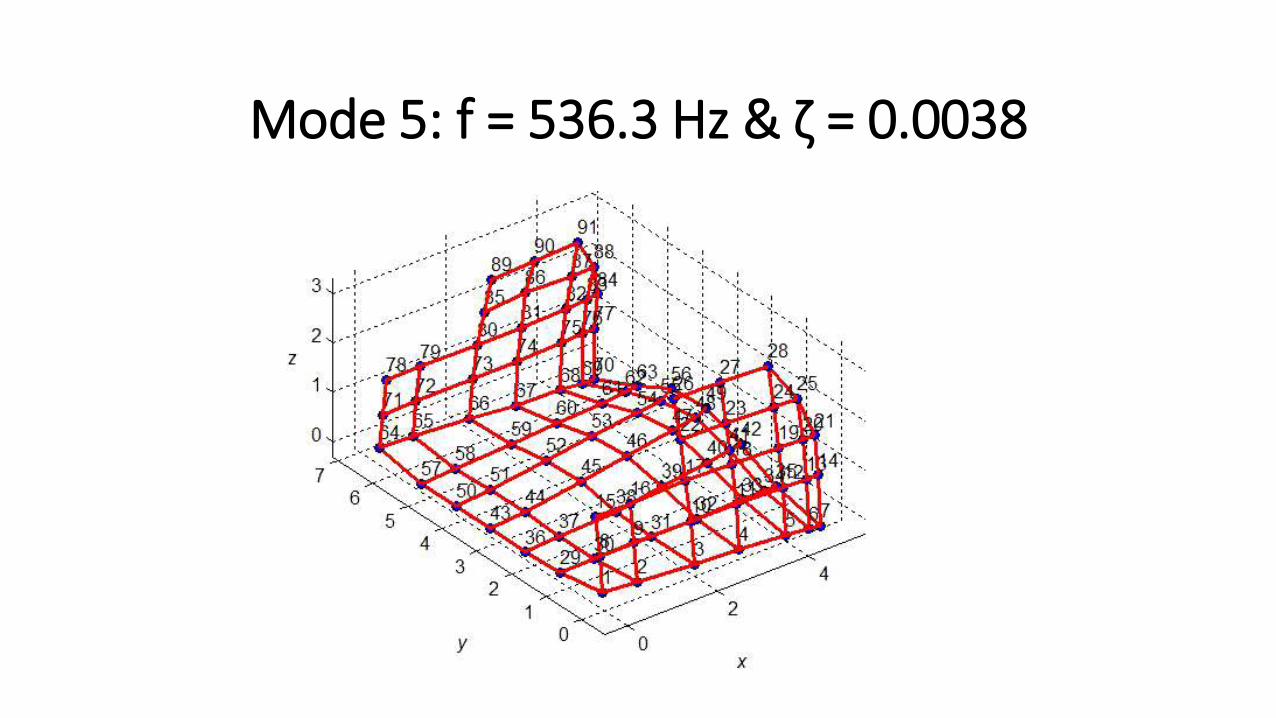
Mode 5: f = 536.3 Hz & ζ = 0.0038

ANSYS Mode 1: f = 163.46 Hz
%𝐷𝑖𝑓𝑓𝑒𝑟𝑒𝑛𝑐𝑒 =𝐹𝐸𝐴 −𝐸𝑥𝑝𝑒𝑟𝑖𝑚𝑒𝑛𝑡𝑎𝑙
𝐸𝑥𝑝𝑒𝑟𝑖𝑚𝑒𝑛𝑡𝑎𝑙∙ 100 =
163.46−163.80
163.80∙ 100 = .21%

%𝐷𝑖𝑓𝑓𝑒𝑟𝑒𝑛𝑐𝑒 =𝐹𝐸𝐴 −𝐸𝑥𝑝𝑒𝑟𝑖𝑚𝑒𝑛𝑡𝑎𝑙
𝐸𝑥𝑝𝑒𝑟𝑖𝑚𝑒𝑛𝑡𝑎𝑙∙ 100 =
212.98−216.30
216.30∙ 100 = 1.53%
SolidWorks Mode 2: f = 212.98 Hz

%𝐷𝑖𝑓𝑓𝑒𝑟𝑒𝑛𝑐𝑒 =𝐹𝐸𝐴 −𝐸𝑥𝑝𝑒𝑟𝑖𝑚𝑒𝑛𝑡𝑎𝑙
𝐸𝑥𝑝𝑒𝑟𝑖𝑚𝑒𝑛𝑡𝑎𝑙∙ 100 =
387.34 −371.30
371.30∙ 100 = 4.32%
SolidWorks Mode 3: f = 387.34 Hz

%𝐷𝑖𝑓𝑓𝑒𝑟𝑒𝑛𝑐𝑒 =𝐹𝐸𝐴 −𝐸𝑥𝑝𝑒𝑟𝑖𝑚𝑒𝑛𝑡𝑎𝑙
𝐸𝑥𝑝𝑒𝑟𝑖𝑚𝑒𝑛𝑡𝑎𝑙∙ 100 =
504.57 −491.30
491.30∙ 100 = 2.70%
SolidWorks Mode 4: f = 504.57 Hz

%𝐷𝑖𝑓𝑓𝑒𝑟𝑒𝑛𝑐𝑒 =𝐹𝐸𝐴 −𝐸𝑥𝑝𝑒𝑟𝑖𝑚𝑒𝑛𝑡𝑎𝑙
𝐸𝑥𝑝𝑒𝑟𝑖𝑚𝑒𝑛𝑡𝑎𝑙∙ 100 =
560.41 −536.30
536.30∙ 100 = 4.50%
SolidWorks Mode 5: f = 560.41 Hz

Lessons learned from analyzing the OCDC bracket
• Place grid lines on outside of object if dealing with complex geometries for more accessibility for hammer strikes.
• Hammer strikes near edges and corners requires precise strikes and careful technique.
• When doing FEA simulation in ANSYS material thickness makes a HUGE difference in the results.
• Complicated part geometry is difficult to recreate in Excel

What makes this project special• Relatively complex geometry allows for unique mode shapes.
• The bracket is a key component in a multi-component system
• Could apply constraints in simulation testing to obtain useful design data.