Embed Size (px)
Citation preview
IOSR Journal of Mechanical and Civil Engineering (IOSR-JMCE)
e-ISSN: 2278-1684,p-ISSN: 2320-334X, Volume 8, Issue 6 (Sep. - Oct. 2013), PP 73-82 www.iosrjournals.org
www.iosrjournals.org 73 | Page
Using of intelligent communicational devices in controlling road
structural weights
Mokhtar Jalilian * 1, Nasser Taghizadieh 2 1Master Student Civil Structures, Department of Civil Engineering, University of Tabriz, Tabriz, Iran 2Assistant Professor of Faculty Departments of Civil Engineering, University of Tabriz, Tabriz Iran,
Abstract: The goal of this paper is to state and evaluate the differences in gap acceptance observations
between left lane and right lane change, and experiment overall aggressiveness by the means of right lane
change behaviors and use of electrical instruments for reaching this goal, furthermore we use Digital Signal
Processing on our controlling cameras to be able to distinguish different behaviours of drivers. Also, in this
paper we evaluate the decision making process of drivers, we do this work with use of electrical sensors for
accumulating some data and clarifying and processing them and finally with use of cumulative distribution
functions of driver lane change behaviours from the observed field data. These experiments are performed for
drivers using I-20 in Grand Prairie, Texas with the roadside controlling cameras and some other electronical
controlling instruments which were amounted near the intersection of I-20 and Great Southwest Blvd. Our
experiments and evaluations demonstrates, that the whole ratio of right lane change observations to left lane
change observations was close to 3 to 1. Keywords: Electronic devices, roadside control camera, lane change, digital image processing, electronic
control systems.
I. Introduction:
The impact of lane change maneuvers is fundamental to microscopic traffic flow theory. In
microscopic model both the system entities and their interactions are described at a high level of detail. For
example, a lane-change maneuver at this level could invoke the car-following law for the subject vehicle with
respect to its current leader, then with respect to its putative leader and its putative follower in the target lane, as
well as representing other detailed driver decision processes. The duration of the lane-change maneuver can also
be calculated (TRAFFIC SIMULATION BY EDWARD LIEBERMAN18 AJAY K. RATHI). There are several
lane change algorithms in microscopic simulation models aiming at simulating a series of decision-making
processes during lane change movement. The agreement between the simulated and field lane change behaviors is an important factor for simulation models to replicate the real world conditions.
A recent study (Godthelp and Shumann 1994) found errors between speed desired and maintained to
vary from -0.3 to -0.8 m/sec in a lane change maneuver; drivers tended to lose velocity when they made such a
maneuver.
In an article published by Kouichi Sumida et. al. - Mitsubishi Motors, it is measured the changes of
heart rate in order to analyze the drivers' stress while they tried high speed lane-change on the stationary driving
simulator. In this paper they concluded that the reasons of the changes were mainly dependent on the following
two items. (1) mental pressure caused by the coming task of lane-change, (2) mental disturbance by the task to
keep the vehicle inside the lane. By using the mental pressure and disturbance, they could evaluate the stability
of the vehicles in lane-change maneuver.
The purpose of this paper is to experiment that there is difference in gap acceptance observations
between left lane change and right lane change maneuver, and evaluate the overall aggressiveness of right lane change behaviors. In this paper, the driver's decision-making processes are evaluated using cumulative
distribution functions of driver lane change behaviors from the observed field data. These evaluations are
performed for drivers using I-20 in Grand Prairie, Texas with the roadside cameras mounted near the
intersection of I-20 and Great Southwest Blvd.
It has been widely recognized that the performance of a multi-agent system (MAS) is highly affected by its
organization. A large scale MAS may have billions of possible ways of organization, depending on the number
of agents, the roles, and the relationships among these agents. These characteristics make it impractical to find
an optimal choice of organization using exhaustive search methods.(16)
Data Collection Approach:
Due to the difficulty of tracking many vehicles over time and space, we collected lane change
maneuver data recorded from a Texas Department of Transportation roadside camera located near the intersection of I-20 and Great Southwest Blvd. The type camera cannot be mentioned due to the security
concerns. This approach eliminates the need for high-resolution maps accurate enough to capture the exact
Using of intelligent communicational devices in controlling road structural weights
www.iosrjournals.org 74 | Page
positions of vehicles in individual lanes. Five video segments from two days were analyzed in this project. The
time periods analyzed were:
Monday, October 20, 2008
o 9:00 am to 9:30 am
o 4:00 pm to 4:15 pm
o 4:30 pm to 4:50 pm
Thursday, October 23, 2008
o 3:00 pm to 4:00 pm
o 4:30 pm to 4:50 pm
A combination of data from all five time periods were examined together, and then the segments were
segregated according to Peak and Off-peak periods. The 9am and 3pm segments were considered in the off-
peak analysis, and the 4pm and 4:30pm segments were included in the peak period analysis. The time periods
were segregated in this manner to determine if lane change behavior varies between low volume and high
volume traffic conditions.
The determination of gap sizes were accomplished by recording the elapsed time between a vehicle
moving into a particular lane (the “lead vehicle”) passing a fixed point on the freeway and the vehicle directly behind the lead vehicle (the “trailing vehicle”) in that lane passing the same point. Times were recorded using a
hand-held stop watch, and gap values were carried out to tenths of a second. For this project, the west abutment
of the Interstate 20 overpass over Great Southwest Blvd. proved to be an ideal fixed point at which to base the
measurements. This determination was performed for both right lane and left lane change. The vehicle that
made lane change was not tracked after the lane change. Due to the small numbers of lane changes observed by
large tractor-trailer trucks and motorcycles during the observation times, the behavior of these vehicles was not
considered in this study. Also gap lengths greater than five seconds were not measured to prevent excessive gap
lengths from skewing the data.
II. Data Collection and Results: The gap acceptance observations for this project were analyzed in two parts: As a whole by combining
all observations made over all five time periods considered, and individually by segregating the observations
into peak and off-peak time periods. To help account for possible error in the data collection procedure
stemming from the operation of the stop watch, the observations were grouped into 0.2 second classes for
analysis. For each case, the number of observations, average gap size, and standard deviation of the gap size
were computed. These same statistics were calculated for the “raw” (ungrouped) observations for comparison
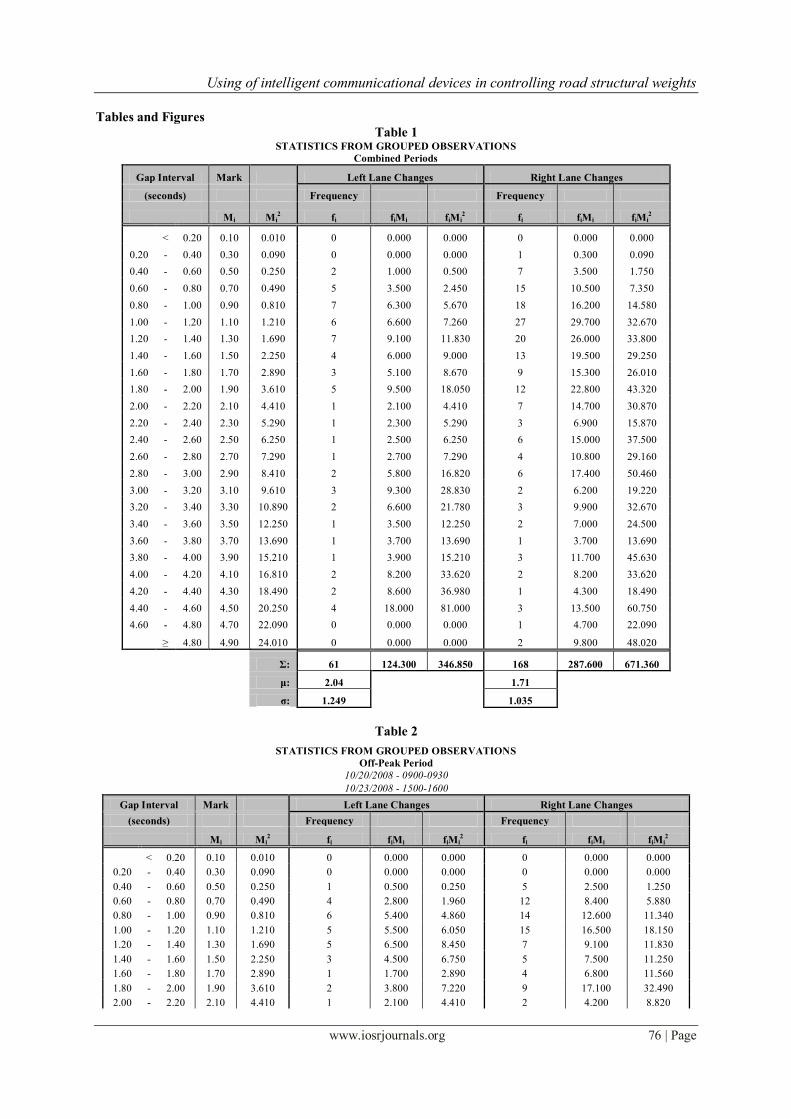
purposes. Summary tables of the grouped data are shown in Tables 1 through 3, and the statistics computed
from the ungrouped observation data are presented in Table 4.
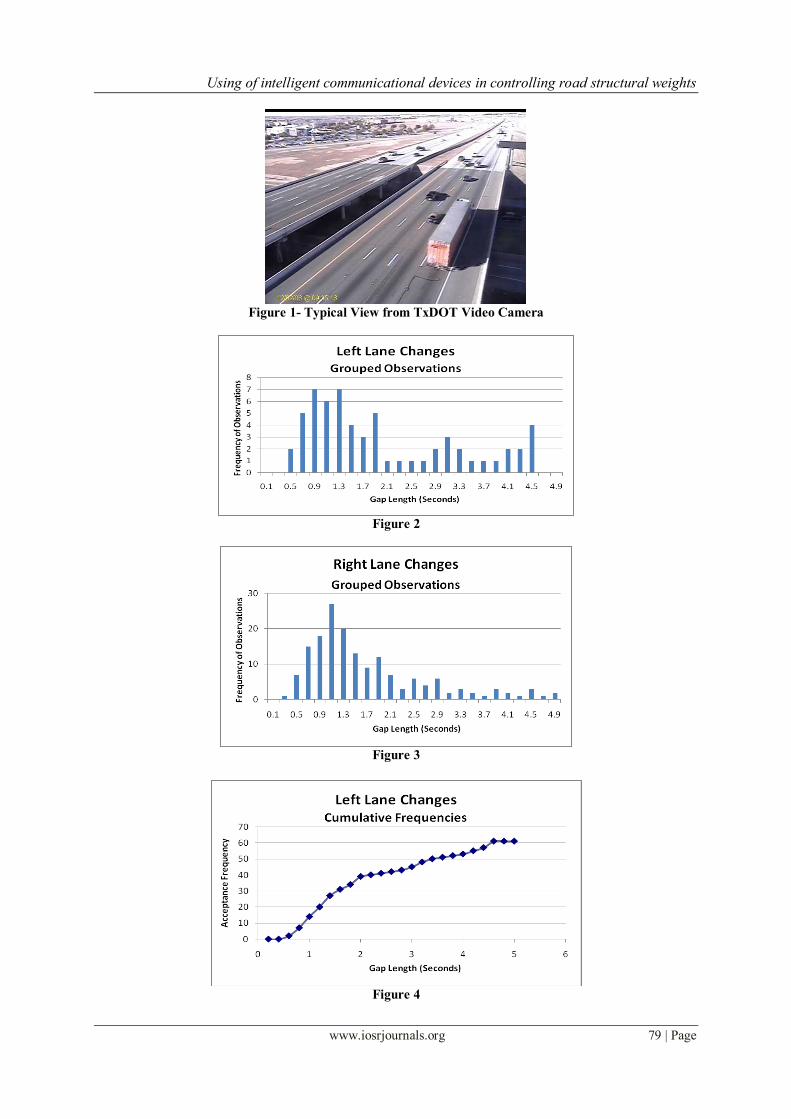
The number of observed gaps that fell within each class was compiled and tabulated, and histogram
plots of the frequencies of observations in each class were drawn for right and left lane change movements. It is interesting to note that the shapes of the histograms, shown in Figures 1 and 2, resemble that of an exponential
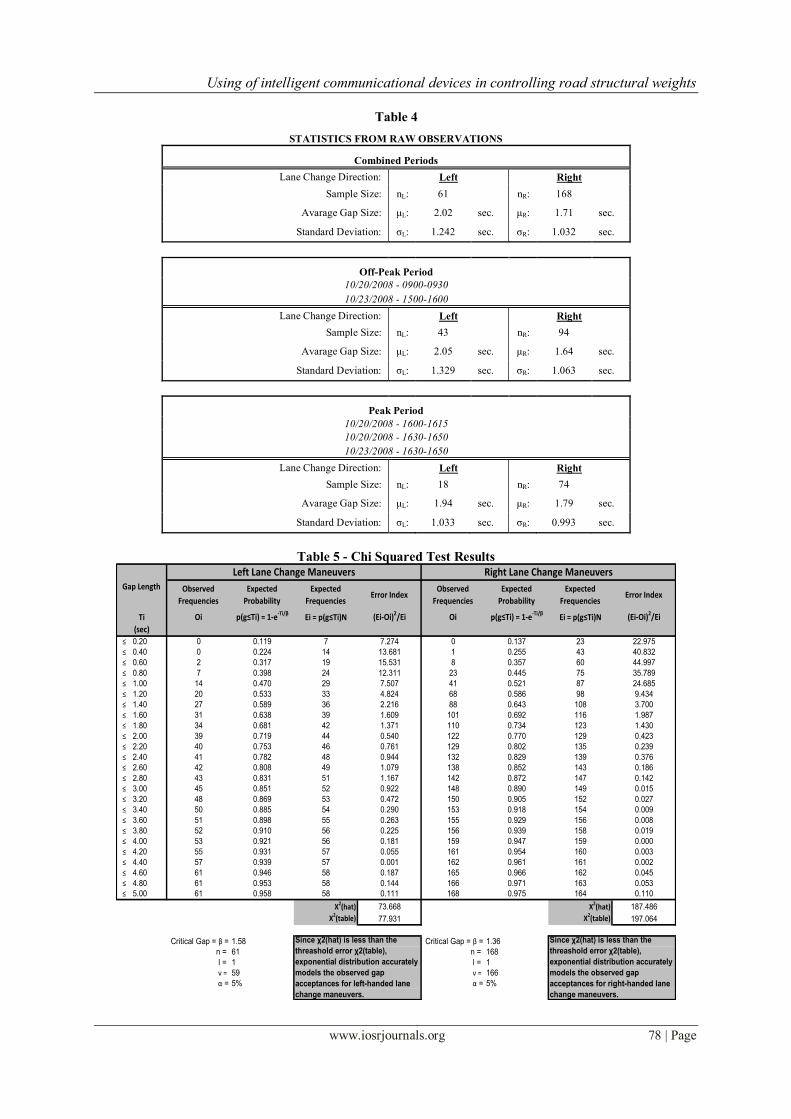
function that gap acceptance distributions commonly represent. To prove that the observed gaps were
exponentially distributed, a Chi-Squared test was performed. The critical gap parameter was estimated for each
case by computing the gap length that fell in the middle of the observations. Theoretically, half of the drivers
would accept this gap, and half of the drivers would reject it. Not surprisingly, the critical gap for left lane
change movements was found to be larger than that for right lane changes. Expected frequencies were
calculated by multiplying the total number of observations for each lane change direction by the cumulative
probability function, and then compared with the observed frequencies. For both the right and left lane change
movements, the error between observed and expected frequencies was found to be within the threshold chi-
squared error limits, indicating that the observed gaps were exponentially distributed. Results of the Chi-
Squared tests are presented in Table 5. Plots of the observed cumulative frequencies are shown in Figures 3 and
4. Finally, hypothesis tests were performed to determine if drivers did, indeed, accept shorter gaps for
right lane changes than for left lane changes. For the three conditions considered – the Off-peak Periods, Peak
Periods, and Combined Observations – a one-sided hypothesis test was run on the combined mean gap lengths
and variances of the left and right lane change gap observations. The null (h0) hypothesis stated that the gap
lengths for right lane changes were, on average, about the same or greater than those for the left lane changes,
and the alternative (h1) hypothesis stated that the average gap lengths for right lane changes were less than those
for left lane changes. The tests were performed at a 5% level of significance, which is the common significance
level used for traffic studies.
Using of intelligent communicational devices in controlling road structural weights
www.iosrjournals.org 75 | Page
Since this study used variances that were estimated from observed data and not “true” or universally
accepted variances, the hypothesis tests were performed using the Student’s t distribution. A pooled variance
was found by taking the weighted average of the observed variances, and this was used to compute the test
statistic, t*. This test statistic was compared with the t-value from the Student’s t table at a 5% level of
significance and degrees of freedom equal to the sum of both sample sizes minus 2. If the absolute value of t*
was found to be less than that of the tabulated value, the null hypothesis was confirmed. Conversely, if the
absolute value of t* was greater than the tabulated value, the null hypotheses was rejected. For this study, it was concluded that, overall, the average gaps accepted by drivers making right lane changes are statistically less than
those making left lane changes. Of the two time periods considered, this was also found to be true during the
off-peak conditions. For the peak conditions, however, the average gaps of left-lane changes were found to be
statistically equal to or greater than those of right hand maneuvers.
For the periods where the both the right and left lane change sample sizes were large (>30), which was
the case for the Combined and Off-peak Periods, hypothesis tests were also conducted as if the variances were
known. This is acceptable because, according to the Central Limit Theorem, large sample sizes normally
produce estimated variances that are close to the “true” variances. In this case, the test statistic (Z*) was found
using a pooled value of the measured variances, and this was compared with the Z value from the Standard
Normal at a 5% level of significance. For both cases in which this method was performed, its conclusion
matched that of the assumed variance method. The null hypothesis was rejected, and the average gap lengths of right lane change maneuvers was found to be statistically less than those of left lane change maneuvers. All
hypothesis tests are shown in the Appendix to this report.
III. Conclusions and Discussion: The first thing that was noticed when collecting the data for this paper was the disproportionate number
of right lane change movements observed compared to left lane change movements. The overall ratio of right
lane change observations to left lane change observations was close to 3 to 1, and the disparity was more than 4
to 1 during the Peak Period observations. This is likely due, in part, to the location of the camera from which
the video was taken for this project. As stated previously, the camera is located alongside westbound Interstate 20 at its interchange with Great Southwest Parkway, which is less than a mile upstream of the Interstate 20 /
State Highway 360 interchange. It is reasonable to think that a large number of vehicles would access the right
lane in this location in preparation to exit to SH 360, and the observations reflected this. The disparity may also
stem from the idea that left lane changes are mainly “convenience movements” made for speed of travel
purposes, while right lane changes are “necessity movements” made, in large part, for navigational purposes to
access exit ramps. The increase in vehicle volume during peak periods results in a lower availability of
comfortable gaps in which to change lanes, and this condition would likely reduce the number of “convenience”
lane change movements more than it would the “necessity” lane change movements.
The second item that stood out in the findings was that the difference in gap lengths in the two lane
change movements was most prevalent in the Off-peak Period, and not so much in the Peak Period. The
average gap length observed for right lane changes was shorter than that for left lane changes during all periods
considered. Interestingly, however, this difference was almost one half second in the off-peak times, and it reduced to less than a quarter second during the peak times. The overall results indicated that, overall, there is a
statistical difference between the gap acceptance lengths for right and left lane changes, but most of the
discrepancy appears to occur during periods of lighter traffic. This may be due to the fact that, since there are
fewer vehicles on the road during the off-peak, there are a greater number of long gaps for drivers to choose
from. What then occurs is the reverse of what happens during the peak times and described in the previous
paragraph. The lighter volume allows a greater amount of freedom for vehicles to move within the freeway,
which results in a greater number of “convenience” (i.e. left) lane change movements, and these movements
occur with longer gap lengths. Meanwhile, the “necessity” (i.e. right) lane changes continue to occur at
relatively high rates and with shorter gap lengths.
While the scope of this study was rather limited by its use of one camera to collect data from a single
location, we believe that it does shed some light on driver behavior regarding lane change maneuvers during varying traffic conditions. It would be interesting to expand the scope of this study to other locations throughout
the Metroplex and even to other metropolitan locations to determine if the behavior patterns described herein
translate to other locations as well.
Using of intelligent communicational devices in controlling road structural weights
www.iosrjournals.org 76 | Page
Tables and Figures
Table 1 STATISTICS FROM GROUPED OBSERVATIONS
Combined Periods
Gap Interval Mark Left Lane Changes Right Lane Changes
(seconds) Frequency Frequency
Mi Mi2 fi fiMi fiMi
2 fi fiMi fiMi
2
< 0.20 0.10 0.010 0 0.000 0.000 0 0.000 0.000
0.20 - 0.40 0.30 0.090 0 0.000 0.000 1 0.300 0.090
0.40 - 0.60 0.50 0.250 2 1.000 0.500 7 3.500 1.750
0.60 - 0.80 0.70 0.490 5 3.500 2.450 15 10.500 7.350
0.80 - 1.00 0.90 0.810 7 6.300 5.670 18 16.200 14.580
1.00 - 1.20 1.10 1.210 6 6.600 7.260 27 29.700 32.670
1.20 - 1.40 1.30 1.690 7 9.100 11.830 20 26.000 33.800
1.40 - 1.60 1.50 2.250 4 6.000 9.000 13 19.500 29.250
1.60 - 1.80 1.70 2.890 3 5.100 8.670 9 15.300 26.010
1.80 - 2.00 1.90 3.610 5 9.500 18.050 12 22.800 43.320
2.00 - 2.20 2.10 4.410 1 2.100 4.410 7 14.700 30.870
2.20 - 2.40 2.30 5.290 1 2.300 5.290 3 6.900 15.870
2.40 - 2.60 2.50 6.250 1 2.500 6.250 6 15.000 37.500
2.60 - 2.80 2.70 7.290 1 2.700 7.290 4 10.800 29.160
2.80 - 3.00 2.90 8.410 2 5.800 16.820 6 17.400 50.460
3.00 - 3.20 3.10 9.610 3 9.300 28.830 2 6.200 19.220
3.20 - 3.40 3.30 10.890 2 6.600 21.780 3 9.900 32.670
3.40 - 3.60 3.50 12.250 1 3.500 12.250 2 7.000 24.500
3.60 - 3.80 3.70 13.690 1 3.700 13.690 1 3.700 13.690
3.80 - 4.00 3.90 15.210 1 3.900 15.210 3 11.700 45.630
4.00 - 4.20 4.10 16.810 2 8.200 33.620 2 8.200 33.620
4.20 - 4.40 4.30 18.490 2 8.600 36.980 1 4.300 18.490
4.40 - 4.60 4.50 20.250 4 18.000 81.000 3 13.500 60.750
4.60 - 4.80 4.70 22.090 0 0.000 0.000 1 4.700 22.090
≥ 4.80 4.90 24.010 0 0.000 0.000 2 9.800 48.020
Σ: 61 124.300 346.850 168 287.600 671.360
μ: 2.04 1.71
σ: 1.249 1.035
Table 2
STATISTICS FROM GROUPED OBSERVATIONS
Off-Peak Period
10/20/2008 - 0900-0930
10/23/2008 - 1500-1600
Gap Interval Mark Left Lane Changes Right Lane Changes
(seconds) Frequency Frequency
Mi Mi2 fi fiMi fiMi
2 fi fiMi fiMi
2
< 0.20 0.10 0.010 0 0.000 0.000 0 0.000 0.000
0.20 - 0.40 0.30 0.090 0 0.000 0.000 0 0.000 0.000
0.40 - 0.60 0.50 0.250 1 0.500 0.250 5 2.500 1.250
0.60 - 0.80 0.70 0.490 4 2.800 1.960 12 8.400 5.880
0.80 - 1.00 0.90 0.810 6 5.400 4.860 14 12.600 11.340
1.00 - 1.20 1.10 1.210 5 5.500 6.050 15 16.500 18.150
1.20 - 1.40 1.30 1.690 5 6.500 8.450 7 9.100 11.830
1.40 - 1.60 1.50 2.250 3 4.500 6.750 5 7.500 11.250
1.60 - 1.80 1.70 2.890 1 1.700 2.890 4 6.800 11.560
1.80 - 2.00 1.90 3.610 2 3.800 7.220 9 17.100 32.490
2.00 - 2.20 2.10 4.410 1 2.100 4.410 2 4.200 8.820
Using of intelligent communicational devices in controlling road structural weights
www.iosrjournals.org 77 | Page
2.20 - 2.40 2.30 5.290 0 0.000 0.000 2 4.600 10.580
2.40 - 2.60 2.50 6.250 1 2.500 6.250 3 7.500 18.750
2.60 - 2.80 2.70 7.290 0 0.000 0.000 1 2.700 7.290
2.80 - 3.00 2.90 8.410 1 2.900 8.410 4 11.600 33.640
3.00 - 3.20 3.10 9.610 2 6.200 19.220 1 3.100 9.610
3.20 - 3.40 3.30 10.890 1 3.300 10.890 2 6.600 21.780
3.40 - 3.60 3.50 12.250 1 3.500 12.250 0 0.000 0.000
3.60 - 3.80 3.70 13.690 1 3.700 13.690 1 3.700 13.690
3.80 - 4.00 3.90 15.210 1 3.900 15.210 1 3.900 15.210
4.00 - 4.20 4.10 16.810 2 8.200 33.620 2 8.200 33.620
4.20 - 4.40 4.30 18.490 2 8.600 36.980 0 0.000 0.000
4.40 - 4.60 4.50 20.250 3 13.500 60.750 2 9.000 40.500
4.60 - 4.80 4.70 22.090 0 0.000 0.000 1 4.700 22.090
≥ 4.80 4.90 24.010 0 0.000 0.000 1 4.900 24.010
Σ: 43 89.100 260.110 94 155.200 363.340
μ: 2.07 1.65
σ: 1.341 1.073
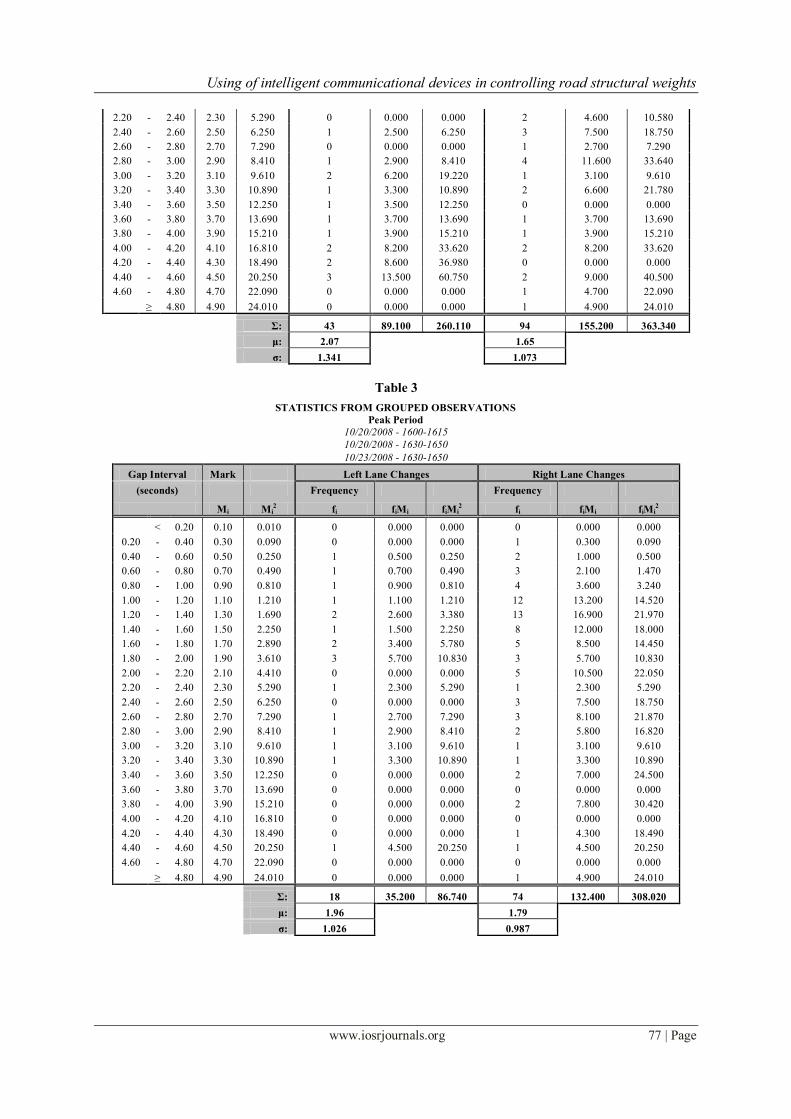
Table 3
STATISTICS FROM GROUPED OBSERVATIONS
Peak Period
10/20/2008 - 1600-1615
10/20/2008 - 1630-1650
10/23/2008 - 1630-1650
Gap Interval Mark Left Lane Changes Right Lane Changes
(seconds) Frequency Frequency
Mi Mi2 fi fiMi fiMi
2 fi fiMi fiMi
2
< 0.20 0.10 0.010 0 0.000 0.000 0 0.000 0.000
0.20 - 0.40 0.30 0.090 0 0.000 0.000 1 0.300 0.090
0.40 - 0.60 0.50 0.250 1 0.500 0.250 2 1.000 0.500
0.60 - 0.80 0.70 0.490 1 0.700 0.490 3 2.100 1.470
0.80 - 1.00 0.90 0.810 1 0.900 0.810 4 3.600 3.240
1.00 - 1.20 1.10 1.210 1 1.100 1.210 12 13.200 14.520
1.20 - 1.40 1.30 1.690 2 2.600 3.380 13 16.900 21.970
1.40 - 1.60 1.50 2.250 1 1.500 2.250 8 12.000 18.000
1.60 - 1.80 1.70 2.890 2 3.400 5.780 5 8.500 14.450
1.80 - 2.00 1.90 3.610 3 5.700 10.830 3 5.700 10.830
2.00 - 2.20 2.10 4.410 0 0.000 0.000 5 10.500 22.050
2.20 - 2.40 2.30 5.290 1 2.300 5.290 1 2.300 5.290
2.40 - 2.60 2.50 6.250 0 0.000 0.000 3 7.500 18.750
2.60 - 2.80 2.70 7.290 1 2.700 7.290 3 8.100 21.870
2.80 - 3.00 2.90 8.410 1 2.900 8.410 2 5.800 16.820
3.00 - 3.20 3.10 9.610 1 3.100 9.610 1 3.100 9.610
3.20 - 3.40 3.30 10.890 1 3.300 10.890 1 3.300 10.890
3.40 - 3.60 3.50 12.250 0 0.000 0.000 2 7.000 24.500
3.60 - 3.80 3.70 13.690 0 0.000 0.000 0 0.000 0.000
3.80 - 4.00 3.90 15.210 0 0.000 0.000 2 7.800 30.420
4.00 - 4.20 4.10 16.810 0 0.000 0.000 0 0.000 0.000
4.20 - 4.40 4.30 18.490 0 0.000 0.000 1 4.300 18.490
4.40 - 4.60 4.50 20.250 1 4.500 20.250 1 4.500 20.250
4.60 - 4.80 4.70 22.090 0 0.000 0.000 0 0.000 0.000
≥ 4.80 4.90 24.010 0 0.000 0.000 1 4.900 24.010
Σ: 18 35.200 86.740 74 132.400 308.020
μ: 1.96 1.79
σ: 1.026 0.987
Using of intelligent communicational devices in controlling road structural weights
www.iosrjournals.org 78 | Page
Table 4
STATISTICS FROM RAW OBSERVATIONS
Combined Periods
Lane Change Direction: Left Right
Sample Size: nL: 61 nR: 168
Avarage Gap Size: μL: 2.02 sec. μR: 1.71 sec.
Standard Deviation: σL: 1.242 sec. σR: 1.032 sec.
Off-Peak Period
10/20/2008 - 0900-0930
10/23/2008 - 1500-1600
Lane Change Direction: Left Right
Sample Size: nL: 43 nR: 94
Avarage Gap Size: μL: 2.05 sec. μR: 1.64 sec.
Standard Deviation: σL: 1.329 sec. σR: 1.063 sec.
Peak Period
10/20/2008 - 1600-1615
10/20/2008 - 1630-1650
10/23/2008 - 1630-1650
Lane Change Direction: Left Right
Sample Size: nL: 18 nR: 74
Avarage Gap Size: μL: 1.94 sec. μR: 1.79 sec.
Standard Deviation: σL: 1.033 sec. σR: 0.993 sec.
Table 5 - Chi Squared Test Results
Observed
Frequencies
Expected
Probability
Expected
FrequenciesError Index
Observed
Frequencies
Expected
Probability
Expected
FrequenciesError Index
Oi p(g≤Ti) = 1-e-Ti/β
Ei = p(g≤Ti)N (Ei-Oi)2/Ei Oi p(g≤Ti) = 1-e
-Ti/βEi = p(g≤Ti)N (Ei-Oi)
2/Ei
≤ 0.20 0 0.119 7 7.274 0 0.137 23 22.975
≤ 0.40 0 0.224 14 13.681 1 0.255 43 40.832
≤ 0.60 2 0.317 19 15.531 8 0.357 60 44.997
≤ 0.80 7 0.398 24 12.311 23 0.445 75 35.789
≤ 1.00 14 0.470 29 7.507 41 0.521 87 24.685
≤ 1.20 20 0.533 33 4.824 68 0.586 98 9.434
≤ 1.40 27 0.589 36 2.216 88 0.643 108 3.700
≤ 1.60 31 0.638 39 1.609 101 0.692 116 1.987
≤ 1.80 34 0.681 42 1.371 110 0.734 123 1.430
≤ 2.00 39 0.719 44 0.540 122 0.770 129 0.423
≤ 2.20 40 0.753 46 0.761 129 0.802 135 0.239
≤ 2.40 41 0.782 48 0.944 132 0.829 139 0.376
≤ 2.60 42 0.808 49 1.079 138 0.852 143 0.186
≤ 2.80 43 0.831 51 1.167 142 0.872 147 0.142
≤ 3.00 45 0.851 52 0.922 148 0.890 149 0.015
≤ 3.20 48 0.869 53 0.472 150 0.905 152 0.027
≤ 3.40 50 0.885 54 0.290 153 0.918 154 0.009
≤ 3.60 51 0.898 55 0.263 155 0.929 156 0.008
≤ 3.80 52 0.910 56 0.225 156 0.939 158 0.019
≤ 4.00 53 0.921 56 0.181 159 0.947 159 0.000
≤ 4.20 55 0.931 57 0.055 161 0.954 160 0.003
≤ 4.40 57 0.939 57 0.001 162 0.961 161 0.002
≤ 4.60 61 0.946 58 0.187 165 0.966 162 0.045
≤ 4.80 61 0.953 58 0.144 166 0.971 163 0.053
≤ 5.00 61 0.958 58 0.111 168 0.975 164 0.110
Х2(hat) 73.668 Х2(hat) 187.486
Х2(table) 77.931 Х2(table) 197.064
Critical Gap = β = 1.58 Critical Gap = β = 1.36
n = 61 n = 168
l = 1 l = 1
ν = 59 ν = 166
α = 5% α = 5%
Right Lane Change Maneuvers
Since χ2(hat) is less than the
threashold error χ2(table),
exponential distribution accurately
models the observed gap
acceptances for right-handed lane
change maneuvers.
(sec)
Ti
Since χ2(hat) is less than the
threashold error χ2(table),
exponential distribution accurately
models the observed gap
acceptances for left-handed lane
change maneuvers.
Left Lane Change ManeuversGap Length
Using of intelligent communicational devices in controlling road structural weights
www.iosrjournals.org 79 | Page
Figure 1- Typical View from TxDOT Video Camera
Figure 2
Figure 3
Figure 4
Using of intelligent communicational devices in controlling road structural weights
www.iosrjournals.org 80 | Page
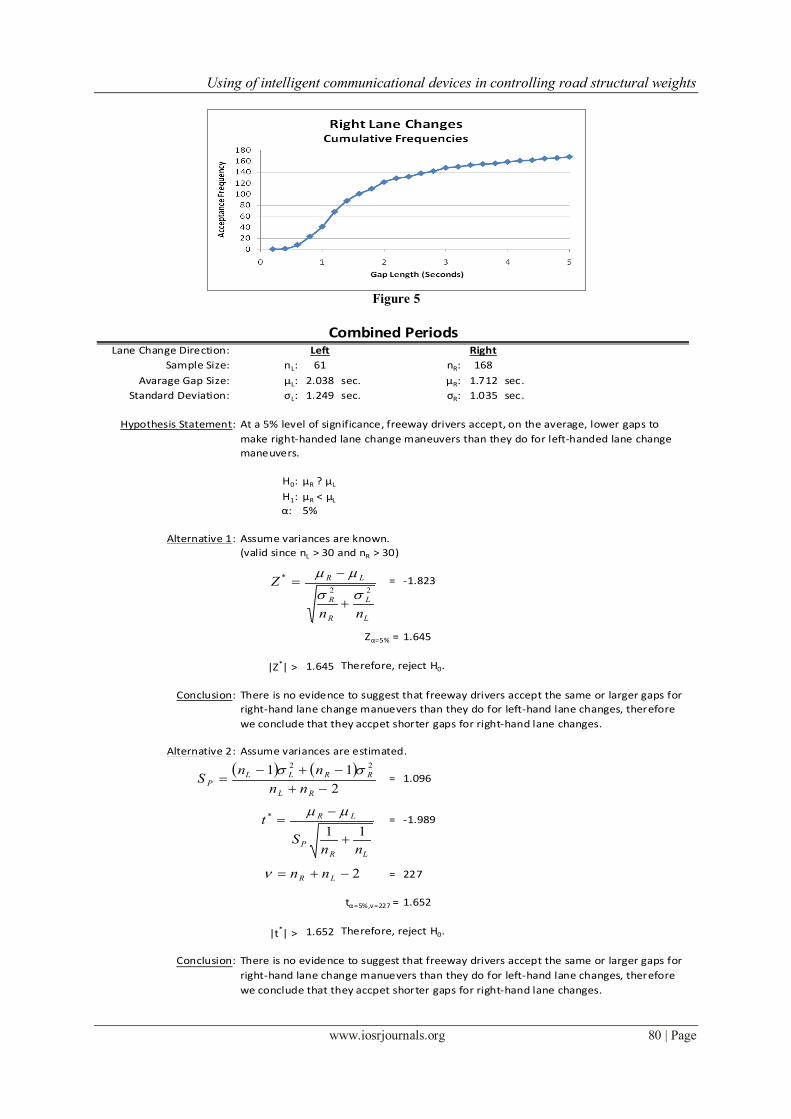
Figure 5
Lane Change Direction:
Sample Size: nL: 61 nR: 168
Avarage Gap Size: μL: 2.038 sec. μR: 1.712 sec.
Standard Deviation: σL: 1.249 sec. σR: 1.035 sec.
Hypothesis Statement:
H0: μR ? μL
H1: μR < μL
α: 5%
Alternative 1: Assume variances are known.
(valid since nL > 30 and nR > 30)
= -1.823
Zα=5% = 1.645
|Z*| > 1.645 Therefore, reject H0.
Conclusion:
Alternative 2: Assume variances are estimated.
= 1.096
= -1.989
= 227
tα=5%,ν=227 = 1.652
|t*| > 1.652 Therefore, reject H0.
Conclusion:
At a 5% level of significance, freeway drivers accept, on the average, lower gaps to
make right-handed lane change maneuvers than they do for left-handed lane change
maneuvers.
There is no evidence to suggest that freeway drivers accept the same or larger gaps for
right-hand lane change manuevers than they do for left-hand lane changes, therefore
we conclude that they accpet shorter gaps for right-hand lane changes.
Combined Periods
There is no evidence to suggest that freeway drivers accept the same or larger gaps for
right-hand lane change manuevers than they do for left-hand lane changes, therefore
we conclude that they accpet shorter gaps for right-hand lane changes.
Left Right
L
L
R
R
LR
nn
Z22
*
2
1122
RL
RRLLP
nn
nnS
LR
P
LR
nnS
t11
*
2 LR nn
Using of intelligent communicational devices in controlling road structural weights
www.iosrjournals.org 81 | Page
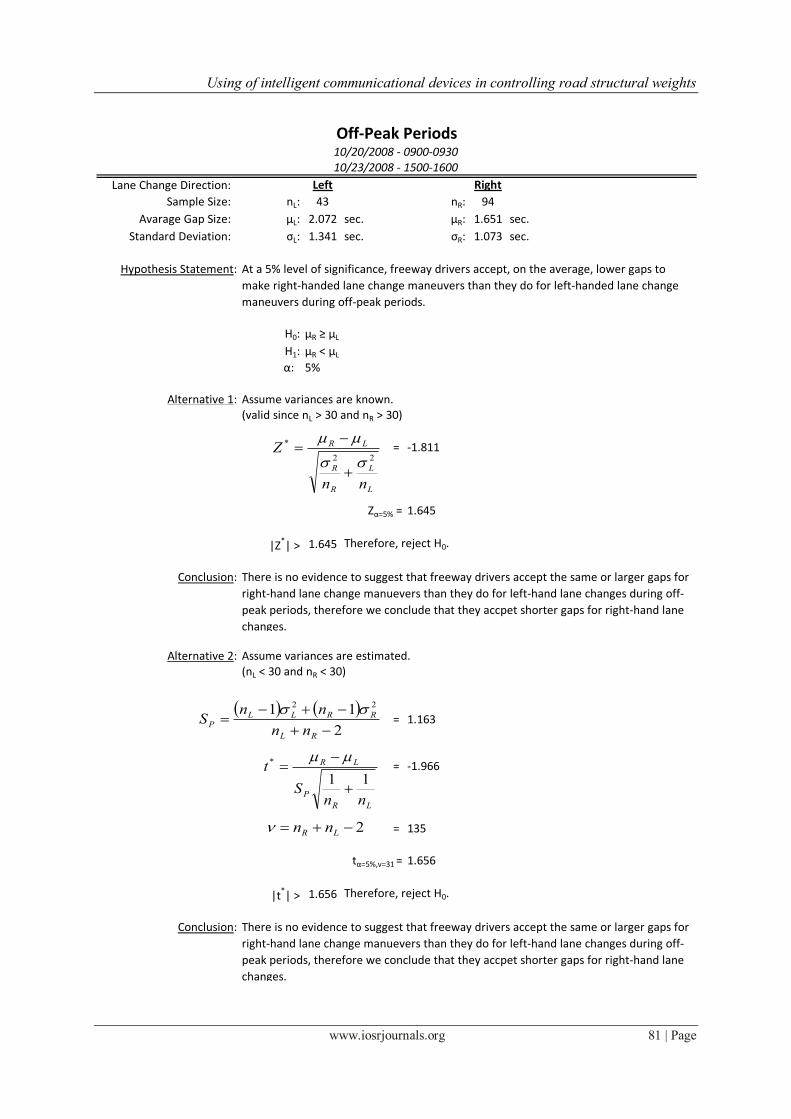
Lane Change Direction:
Sample Size: nL: 43 nR: 94
Avarage Gap Size: μL: 2.072 sec. μR: 1.651 sec.
Standard Deviation: σL: 1.341 sec. σR: 1.073 sec.
Hypothesis Statement:
H0: μR ≥ μL
H1: μR < μL
α: 5%
Alternative 1: Assume variances are known.(valid since nL > 30 and nR > 30)
= -1.811
Zα=5% = 1.645
|Z*| > 1.645 Therefore, reject H0.
Conclusion:
Alternative 2: Assume variances are estimated.(nL < 30 and nR < 30)
= 1.163
= -1.966
= 135
tα=5%,ν=31 = 1.656
|t*| > 1.656 Therefore, reject H0.
Conclusion:
Off-Peak Periods
Left Right
There is no evidence to suggest that freeway drivers accept the same or larger gaps for
right-hand lane change manuevers than they do for left-hand lane changes during off-
peak periods, therefore we conclude that they accpet shorter gaps for right-hand lane
changes.
10/20/2008 - 0900-093010/23/2008 - 1500-1600
There is no evidence to suggest that freeway drivers accept the same or larger gaps for
right-hand lane change manuevers than they do for left-hand lane changes during off-
peak periods, therefore we conclude that they accpet shorter gaps for right-hand lane
changes.
At a 5% level of significance, freeway drivers accept, on the average, lower gaps to
make right-handed lane change maneuvers than they do for left-handed lane change
maneuvers during off-peak periods.
2
11 22
RL
RRLLP
nn
nnS
LR
P
LR
nnS
t11
*
2 LR nn
L
L
R
R
LR
nn
Z22
*
Using of intelligent communicational devices in controlling road structural weights
www.iosrjournals.org 82 | Page
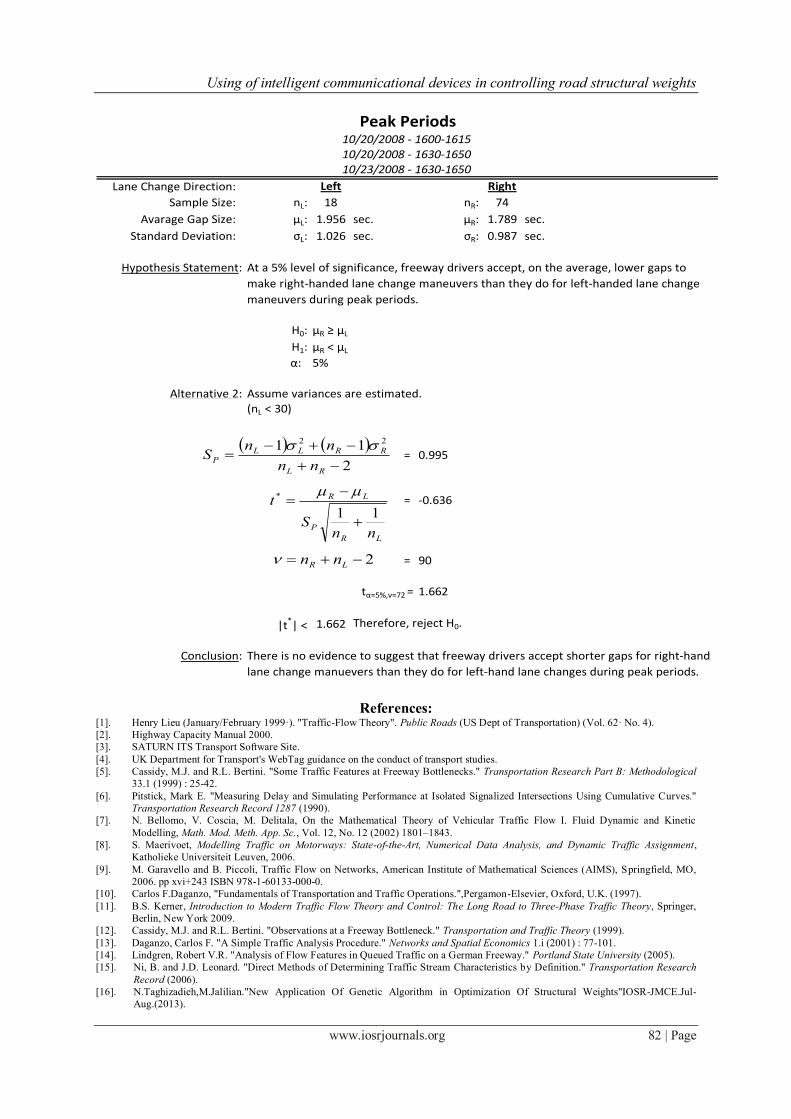
Lane Change Direction:
Sample Size: nL: 18 nR: 74
Avarage Gap Size: μL: 1.956 sec. μR: 1.789 sec.
Standard Deviation: σL: 1.026 sec. σR: 0.987 sec.
Hypothesis Statement:
H0: μR ≥ μL
H1: μR < μL
α: 5%
Alternative 2: Assume variances are estimated.(nL < 30)
= 0.995
= -0.636
= 90
tα=5%,ν=72 = 1.662
|t*| < 1.662 Therefore, reject H0.
Conclusion: There is no evidence to suggest that freeway drivers accept shorter gaps for right-hand
lane change manuevers than they do for left-hand lane changes during peak periods.
10/20/2008 - 1630-165010/23/2008 - 1630-1650
Left Right
Peak Periods10/20/2008 - 1600-1615
At a 5% level of significance, freeway drivers accept, on the average, lower gaps to
make right-handed lane change maneuvers than they do for left-handed lane change
maneuvers during peak periods.
2
11 22
RL
RRLLP
nn
nnS
LR
P
LR
nnS
t11
*
2 LR nn
References: [1]. Henry Lieu (January/February 1999·). "Traffic-Flow Theory". Public Roads (US Dept of Transportation) (Vol. 62· No. 4).
[2]. Highway Capacity Manual 2000.
[3]. SATURN ITS Transport Software Site.
[4]. UK Department for Transport's WebTag guidance on the conduct of transport studies.
[5]. Cassidy, M.J. and R.L. Bertini. "Some Traffic Features at Freeway Bottlenecks." Transportation Research Part B: Methodological
33.1 (1999) : 25-42.
[6]. Pitstick, Mark E. "Measuring Delay and Simulating Performance at Isolated Signalized Intersections Using Cumulative Curves."
Transportation Research Record 1287 (1990).
[7]. N. Bellomo, V. Coscia, M. Delitala, On the Mathematical Theory of Vehicular Traffic Flow I. Fluid Dynamic and Kinetic
Modelling, Math. Mod. Meth. App. Sc., Vol. 12, No. 12 (2002) 1801–1843.
[8]. S. Maerivoet, Modelling Traffic on Motorways: State-of-the-Art, Numerical Data Analysis, and Dynamic Traffic Assignment,
Katholieke Universiteit Leuven, 2006.
[9]. M. Garavello and B. Piccoli, Traffic Flow on Networks, American Institute of Mathematical Sciences (AIMS), Springfield, MO,
2006. pp xvi+243 ISBN 978-1-60133-000-0.
[10]. Carlos F.Daganzo, "Fundamentals of Transportation and Traffic Operations.",Pergamon-Elsevier, Oxford, U.K. (1997).
[11]. B.S. Kerner, Introduction to Modern Traffic Flow Theory and Control: The Long Road to Three-Phase Traffic Theory, Springer,
Berlin, New York 2009.
[12]. Cassidy, M.J. and R.L. Bertini. "Observations at a Freeway Bottleneck." Transportation and Traffic Theory (1999).
[13]. Daganzo, Carlos F. "A Simple Traffic Analysis Procedure." Networks and Spatial Economics 1.i (2001) : 77-101.
[14]. Lindgren, Robert V.R. "Analysis of Flow Features in Queued Traffic on a German Freeway." Portland State University (2005).
[15]. Ni, B. and J.D. Leonard. "Direct Methods of Determining Traffic Stream Characteristics by Definition." Transportation Research
Record (2006).
[16]. N.Taghizadieh,M.Jalilian."New Application Of Genetic Algorithm in Optimization Of Structural Weights"IOSR-JMCE.Jul-
Aug.(2013).