Embed Size (px)
Citation preview

Underwater Concrete Technologies in Marine Construction Projects
Sam X. YaoBen C. Gerwick, Inc.

Concrete Production from a Floating Batch Plant

Conventional Tremie Placement

Concrete Delivery on Transit Mixers

Placing Concrete from a Delivery Barge

Tremie Placement with Suspended Pipes

Underwater Concrete Construction Technologies
Concrete Mix Proportions
Workability and Rheology
Underwater Concrete Construction
Concrete Production/Transportation
Concrete Placement Planning
Concrete Placement Procedures
Inspection and Quality Control
Mass Tremie Concrete Properties
Thermal Behavior
Laitance, Bleeding, Segregation
Form Pressure
Strength Development
Finish and Protection

Performance Requirements for Underwater Concrete in Structural Applications
• Flowability and Self-Compaction• Workability Retention within Work Window• Cohesion Against Washout, Segregation, and
Laitance Formation• Low Bleeding• Low Heat of Hydration• Controlled Set Time• Compressive Strength• Adequate Bond

Washout Test and Slump Test
Slump vs. Slump Flow

Mock-up Tremie Concrete Test

Mock-up Tremie Concrete Test

Principal Parameters in Mix Design• Particle Packing Characteristics - Sand
Content, Gradation, Size, and Shape
• The water-to-fine ratio - Enough Fine to Make It Flowable and Cohesive (0.85-1.0 by volume)
• Cementittious Material Content – High VolumeFly Ash plus Silica Fume
• Dispersion characteristics - Proper Use of Chemical Admixtures – HRWR and Set-retarder

Tremie Concrete Placement Planning – An Overview
Concrete Production & Delivery: Method & Rate
Allowable Flow DistancePlacement Area Configuration
Allowable Work Window
Concrete Placement Sequence
Tremie Pipe Layout
Tremie Placement Rate& Procedure
Form Pressure
Concrete Flow Pattern
Form DesignSlope, Vent, Laitance Collector Quality of In-Situ Concrete
StrengthUniformity
Bond
Quality control plan:Testing, sounding, inspection
RISK FACTORS•Prodcution & Delivery Logistics•Loss of Flowability•Washout - Laitance•Segregation, Bleeding•Trapping of Water•Excessive Disturbance•Erosion
Concrete Protection

Initiation of Tremie PlacementInitiation of Placement using the Dry Pipe Method with a End Plate as the Seal

Hydrostatic Balance Pointc
Rwc
WFDWhWH ++
=**'
H = (Wch+WwD+FR) / Wc

Flow Patterns of Tremie Copncrete
Layered Flow -Excessive Laitance
Bulging Flow -Minimum Laitance

Tremie Pipe Spacing
3-5 Times Depth of Tremie Pours

Placement Sequence
Simultaneous Placement Method Advanced Slope Method

Removal of Laitance Underwater

Lower Monumental Dam

Hydraulic Flow Pattern in Stilling Basin

Pomona Dam Stilling BasinHydraulic Model Study

Kinzua Stilling Basin
18 monthsafter repair

Erosion Damage

Erosion Damage Repair

Erosion Repair within a Cofferdam

Undrewater Repair of a Dam

Tremie Concrete over Rock Anchor

Coarse Aggregates
Specific Gravity: 2.85
Absorption: 1.1%
Maximum Nominal Size: 3/4-inch
Appearance: Clean and round-shaped with smooth surface texture

Fine Aggregates
Specific Gravity: 2.72
Fineness Modulus: 2.9”
Absorption: 3.0%
Natural River Sand

Gradations of Aggregates
Grading Curve
0
10
20
30
40
50
60
70
80
90
100
1-1/2"1"3/4"1/2"3/8"#4#8#16#30#50#100#200
Sieve Number
Perc
enta
ge P
assi
ngSand
Gravel
Combined Sand and
Gravel
Volume Ratio of Fine Aggregates to Total Aggregates: 47%
Volume Ratio of Coarse Aggregates to Total Solids: 42%

High Volume Fly Ash Concrete for Underwater Repair
• Reducting the heat of hydration in mass concrete
• Increasing concrete flowability without compromising cohesion
• Facilitating concrete flowability retention and extended set time

Mix ProportionsMix No. 1 Mix No. 2 Mix No. 3(52% F.A) (25% F.A) (control)
Cement Type II, lb./cy 390 580 740Fly Ash, lb./cy 350 160 0Micro Silica, lb./cy 40 40 40Coarse Agg, lb./cy 1.625 1,659 1,688Fine Agg, lb./cy 1,367 1,396 1,420Water, lb./cy 301.8 302.5 303.3Rheomac UW, oz/cwt 85.8 85.8 85.8Delvo, oz/cwt 117 117 117Glenium, oz/cy 102.6 156 189

Compressive Strength Development
0.0
2000.0
4000.0
6000.0
8000.0
10000.0
12000.0
0 10 20 30 40 50 60 70 80 90
Age (days)
Ave
rage
Com
pres
sive
Stre
ngth
(psi
)
Mix 3
Mix 1
Mix 2

Workability TestInitial Concrete Slump – 10” to 10-3/4”
Initial Slump Flow – 21” to 26”
Minimum Requirement for Achieving 1:10 Slope on Top Surface of the Concrete Pours – 10” Slump and 20” Slump Flow

Workability Retention TestSlump after 60 minutes – 10” to 10-3/4”
Slump flow after 60 min. – 21” to 26”
Anticipated work window for a truck of concrete - 45 minutes

Set Time Test
Mix No. 1 Set Time > 12 hour
Mix No. 2 and No. 3 Set Time = 7 hour
Anticipated Concrete Placement Duration: 12 hours

Tremie Concrete Placement at the Dam Site

Tremie Concrete Placement Sequence

Tremie Concrete Slump

Tremie Concrete Placement

Concrete Cores

Conventional Dam Construction

Cofferdam Failure

Conventional Lock Construction

Cofferdam Overtopping

Cleanup After the Flood

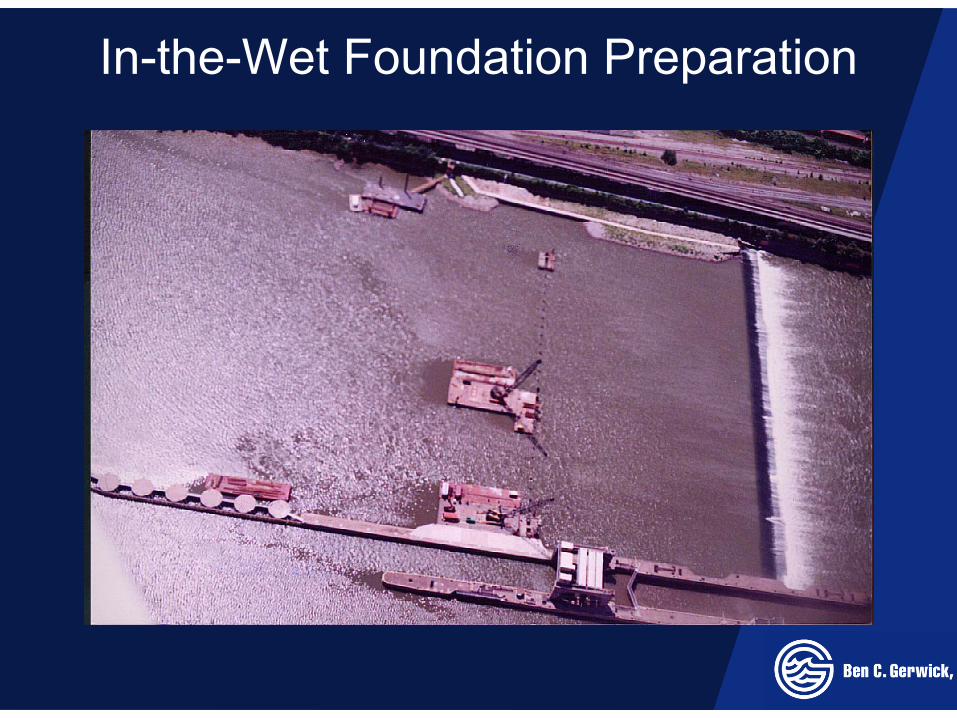
Braddock Dam

Towing and Positioning
Float-In Dam .ppt
Braddock Dam - Illustration

Grouting
Float-In Dam .ppt
Braddock

Concrete Infill
Float-In Dam .ppt
Braddock Dam – Stage 5

Mile 11.2Monongahela River
Ohio River
Allegheny River
N3 Miles
27.5 River Miles from Fabrication Site to Outfitting Pier
Braddock L/D
Mile 12.8
Duquesne RIDC(Outfitting Pier)
Leetsdale(Fabrication Site)
Mile 14.7
Mile 0.0
PittsburghPittsburgh
Mile 6.2
Emsworth L/D
Mile 13.3
Dashields L/D
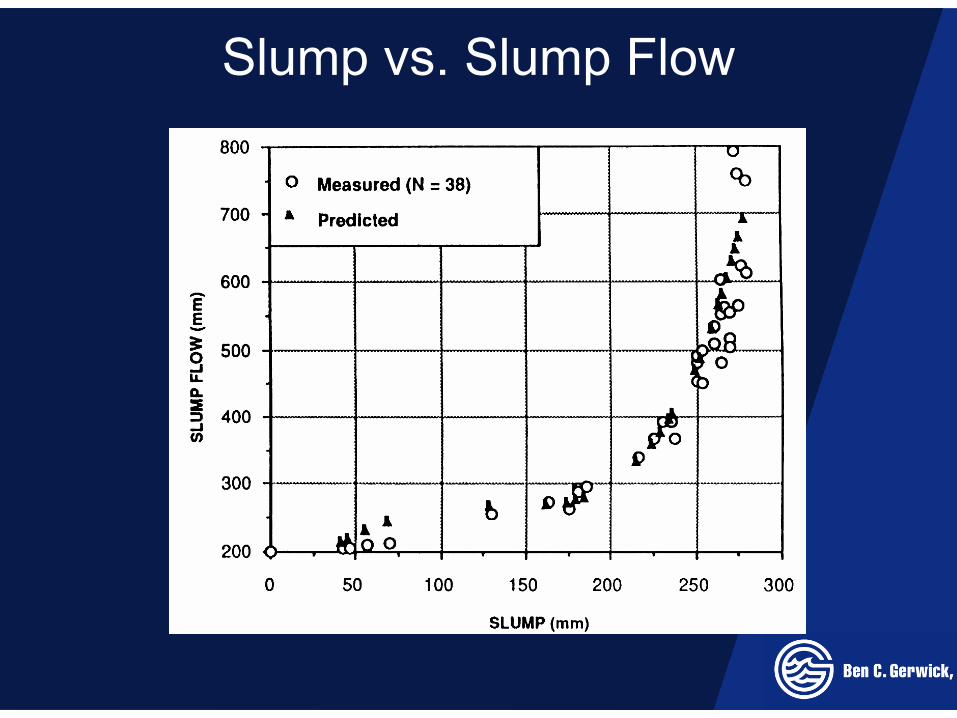
In-the-Wet Foundation Preparation

Underwater Foundations
FLOW
PILE DRIVINGBARGE
SCREEDBARGE
Concurrent Operations:• Dredge/Backfill• Place Base Stone• Screed Stone• Install Piers

Launch Basin
Segment 1Segment 2
Fabrication Site
Braddock Dam

Top Slab Fabrication

Segment 1 in Launch Basin

Transport of Dam Segment 1

Towing and Setting a Float-in Dam

Braddock Dam

Braddock Dam
Savings:1 Year
$5 Million

Construction Complete

Florida Keys

Coral Reef in Florida Keys

One of the Ground Sites

Damaged Coral Reef

Repair Design

Precast Repair Module

Repair of Corral Reef in Florida Keys

Setting a Precast Module

Floating Batch Plants

Adding Nitrogen Cooling Agent

Repair of Coral Reef in Florida KeysPumping Concrete Underwater

Placing Underwater Concrete

Placing Concrete in Large Holes of Corral

Finishing Underwater Concrete

Project Location

Coachella Canal Engineering Data
• Construction period 1938-1948 • Length 123 mi • Diversion capacity 2,500 cfs • Typical section, earth lined:• Bottom width 40-60 ft • Side slopes 2:1 • Water depth 10.3 ft • Lining, clay-blanket 12 in • Typical section, concrete lined:• Bottom width 12 ft • Side slopes 1.5 :1 • Water depth 10.8 ft• Lining thickness 3.5 in

Salton Sea/Coachella Canal
The Coachella Canal.
One of numerous geothermal plants on the eastern side of the Salton Sea.
Bombay Beach at Salton Sea.
Coachella Canal Bathers.

Installation of Liner and Concrete Overlay
• Kiewit received a $5.2 Million Contract to Install 1.5 miles test section at Coachella Canal.
• Paving half of a section at a time
• Average Speed: 4-ft per minute

Canal Lining Design

Trial Testing
• Liner: 30 mil thick PVC geomembrane backed with a nonwovengeotextile
• Nonwoven fabric prevent slippage of concrete during placement and strengthen the liner
• Vibrator on slip form to consolidate and maintain concrete flow

Completion of the Lining Construction