Embed Size (px)
Citation preview
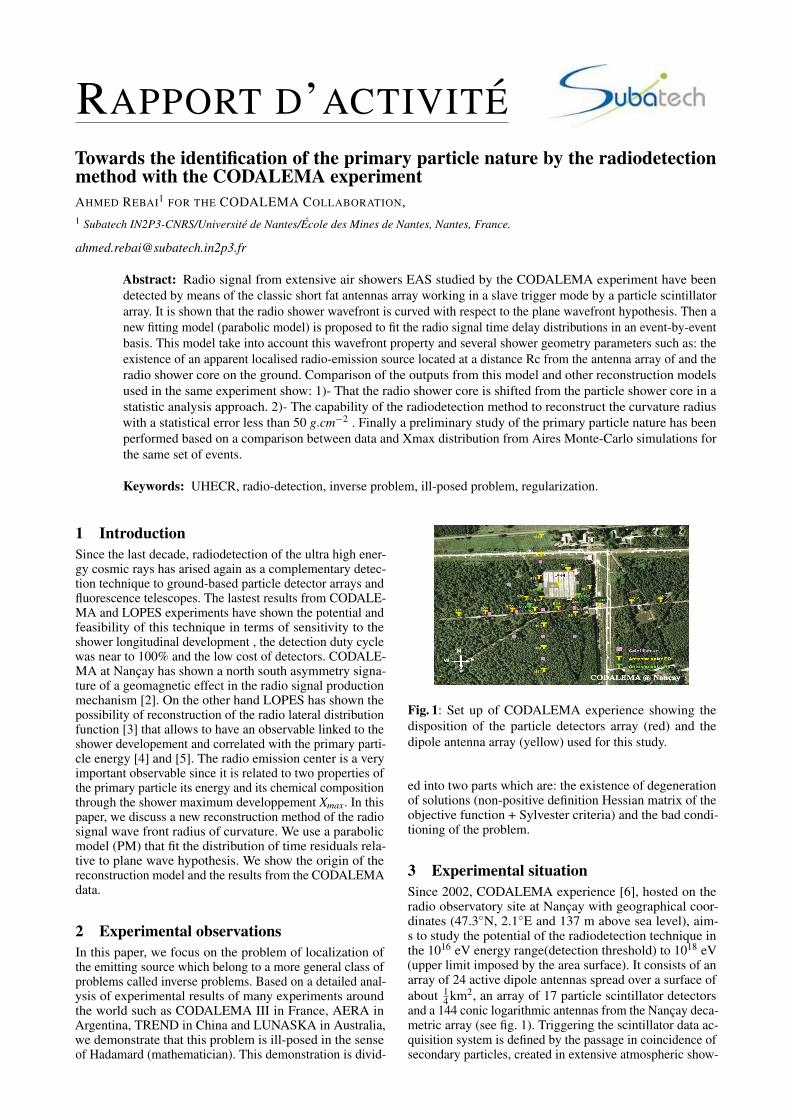
RAPPORT D’ACTIVITETowards the identification of the primary particle nature by the radiodetectionmethod with the CODALEMA experimentAHMED REBAI1 FOR THE CODALEMA COLLABORATION,1 Subatech IN2P3-CNRS/Universite de Nantes/Ecole des Mines de Nantes, Nantes, France.
Abstract: Radio signal from extensive air showers EAS studied by the CODALEMA experiment have beendetected by means of the classic short fat antennas array working in a slave trigger mode by a particle scintillatorarray. It is shown that the radio shower wavefront is curved with respect to the plane wavefront hypothesis. Then anew fitting model (parabolic model) is proposed to fit the radio signal time delay distributions in an event-by-eventbasis. This model take into account this wavefront property and several shower geometry parameters such as: theexistence of an apparent localised radio-emission source located at a distance Rc from the antenna array of and theradio shower core on the ground. Comparison of the outputs from this model and other reconstruction modelsused in the same experiment show: 1)- That the radio shower core is shifted from the particle shower core in astatistic analysis approach. 2)- The capability of the radiodetection method to reconstruct the curvature radiuswith a statistical error less than 50 g.cm−2 . Finally a preliminary study of the primary particle nature has beenperformed based on a comparison between data and Xmax distribution from Aires Monte-Carlo simulations forthe same set of events.
Keywords: UHECR, radio-detection, inverse problem, ill-posed problem, regularization.
1 IntroductionSince the last decade, radiodetection of the ultra high ener-gy cosmic rays has arised again as a complementary detec-tion technique to ground-based particle detector arrays andfluorescence telescopes. The lastest results from CODALE-MA and LOPES experiments have shown the potential andfeasibility of this technique in terms of sensitivity to theshower longitudinal development , the detection duty cyclewas near to 100% and the low cost of detectors. CODALE-MA at Nancay has shown a north south asymmetry signa-ture of a geomagnetic effect in the radio signal productionmechanism [2]. On the other hand LOPES has shown thepossibility of reconstruction of the radio lateral distributionfunction [3] that allows to have an observable linked to theshower developement and correlated with the primary parti-cle energy [4] and [5]. The radio emission center is a veryimportant observable since it is related to two properties ofthe primary particle its energy and its chemical compositionthrough the shower maximum developpement Xmax. In thispaper, we discuss a new reconstruction method of the radiosignal wave front radius of curvature. We use a parabolicmodel (PM) that fit the distribution of time residuals rela-tive to plane wave hypothesis. We show the origin of thereconstruction model and the results from the CODALEMAdata.
2 Experimental observationsIn this paper, we focus on the problem of localization ofthe emitting source which belong to a more general class ofproblems called inverse problems. Based on a detailed anal-ysis of experimental results of many experiments aroundthe world such as CODALEMA III in France, AERA inArgentina, TREND in China and LUNASKA in Australia,we demonstrate that this problem is ill-posed in the senseof Hadamard (mathematician). This demonstration is divid-
Fig. 1: Set up of CODALEMA experience showing thedisposition of the particle detectors array (red) and thedipole antenna array (yellow) used for this study.
ed into two parts which are: the existence of degenerationof solutions (non-positive definition Hessian matrix of theobjective function + Sylvester criteria) and the bad condi-tioning of the problem.
3 Experimental situationSince 2002, CODALEMA experience [6], hosted on theradio observatory site at Nancay with geographical coor-dinates (47.3◦N, 2.1◦E and 137 m above sea level), aim-s to study the potential of the radiodetection technique inthe 1016 eV energy range(detection threshold) to 1018 eV(upper limit imposed by the area surface). It consists of anarray of 24 active dipole antennas spread over a surface ofabout 1
4 km2, an array of 17 particle scintillator detectorsand a 144 conic logarithmic antennas from the Nancay deca-metric array (see fig. 1). Triggering the scintillator data ac-quisition system is defined by the passage in coincidence ofsecondary particles, created in extensive atmospheric show-
Rebai A. Towards the primary particle identification by the CODALEMA experimentRAPPORT D’ACTIVITE
er, through each of the 5 central particle detectors. Trig-ger detection threshold energy is equal to 5.1015 eV. Theradio waves forms in each antenna is recorded in a 0-250MHz frequency band during a 2.5 µs time window witha 1GS/s sampling rate. Radio events that are detected bydipole antenna array in coincidence with atmospheric show-er events are identified during offline analysis [6] [2]. Afterthis analysis phase, a data set containing the parameters ofthe shower reconstructed using the information providedby the particle detectors (arrival times distribution, arrivaldirections, shower core on the ground and energy) and a setof observables for each radio antennas (arrival times distri-bution, radio signal amplitude) and the observables of thereconstructed shower by the use of radio data alone (arrivaltime, direction arrival, radio shower core on the ground,energy) are obtained event by event. These observationsare used to study the curvature of the radio wave front thatcould be one of the discriminating variables the nature ofthe primary (estimate of Xmax).
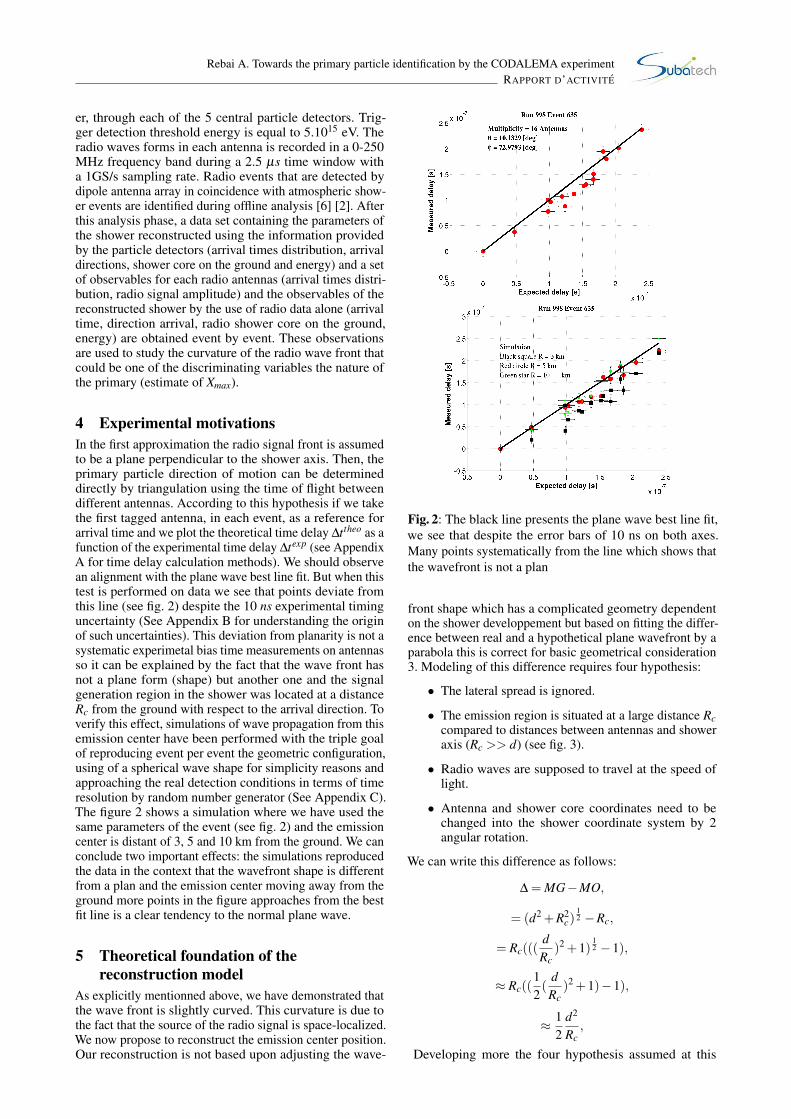
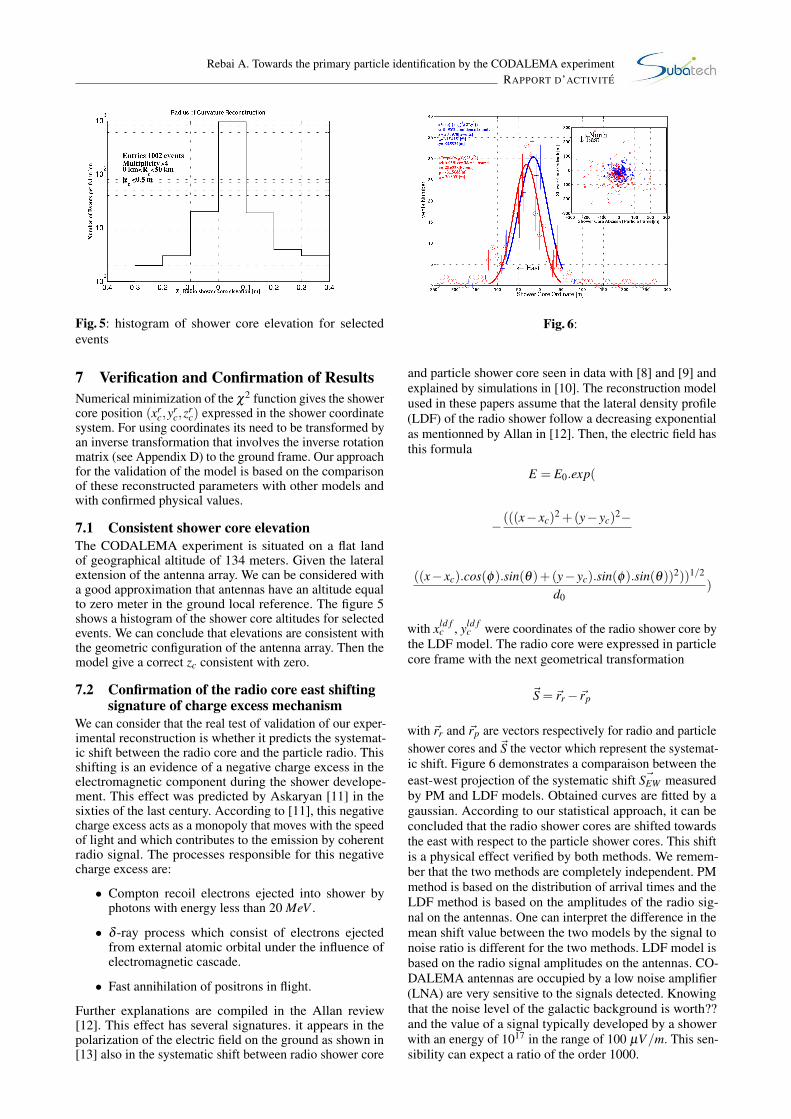
4 Experimental motivationsIn the first approximation the radio signal front is assumedto be a plane perpendicular to the shower axis. Then, theprimary particle direction of motion can be determineddirectly by triangulation using the time of flight betweendifferent antennas. According to this hypothesis if we takethe first tagged antenna, in each event, as a reference forarrival time and we plot the theoretical time delay ∆ttheo as afunction of the experimental time delay ∆texp (see AppendixA for time delay calculation methods). We should observean alignment with the plane wave best line fit. But when thistest is performed on data we see that points deviate fromthis line (see fig. 2) despite the 10 ns experimental timinguncertainty (See Appendix B for understanding the originof such uncertainties). This deviation from planarity is not asystematic experimetal bias time measurements on antennasso it can be explained by the fact that the wave front hasnot a plane form (shape) but another one and the signalgeneration region in the shower was located at a distanceRc from the ground with respect to the arrival direction. Toverify this effect, simulations of wave propagation from thisemission center have been performed with the triple goalof reproducing event per event the geometric configuration,using of a spherical wave shape for simplicity reasons andapproaching the real detection conditions in terms of timeresolution by random number generator (See Appendix C).The figure 2 shows a simulation where we have used thesame parameters of the event (see fig. 2) and the emissioncenter is distant of 3, 5 and 10 km from the ground. We canconclude two important effects: the simulations reproducedthe data in the context that the wavefront shape is differentfrom a plan and the emission center moving away from theground more points in the figure approaches from the bestfit line is a clear tendency to the normal plane wave.
5 Theoretical foundation of thereconstruction model
As explicitly mentionned above, we have demonstrated thatthe wave front is slightly curved. This curvature is due tothe fact that the source of the radio signal is space-localized.We now propose to reconstruct the emission center position.Our reconstruction is not based upon adjusting the wave-
Fig. 2: The black line presents the plane wave best line fit,we see that despite the error bars of 10 ns on both axes.Many points systematically from the line which shows thatthe wavefront is not a plan
front shape which has a complicated geometry dependenton the shower developpement but based on fitting the differ-ence between real and a hypothetical plane wavefront by aparabola this is correct for basic geometrical consideration3. Modeling of this difference requires four hypothesis:
• The lateral spread is ignored.
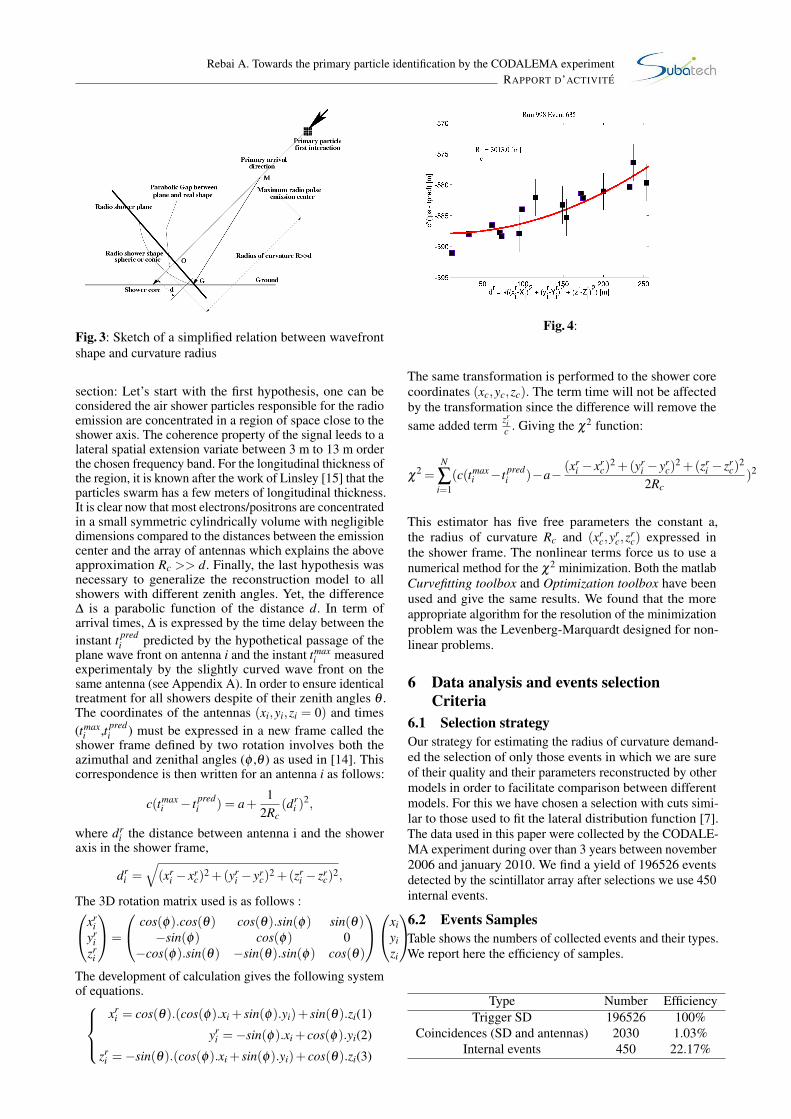
• The emission region is situated at a large distance Rccompared to distances between antennas and showeraxis (Rc >> d) (see fig. 3).
• Radio waves are supposed to travel at the speed oflight.
• Antenna and shower core coordinates need to bechanged into the shower coordinate system by 2angular rotation.
We can write this difference as follows:
∆ = MG−MO,
= (d2 +R2c)
12 −Rc,
= Rc(((dRc
)2 +1)12 −1),
≈ Rc((12(
dRc
)2 +1)−1),
≈ 12
d2
Rc,
Developing more the four hypothesis assumed at this
Rebai A. Towards the primary particle identification by the CODALEMA experimentRAPPORT D’ACTIVITE
Fig. 3: Sketch of a simplified relation between wavefrontshape and curvature radius
section: Let’s start with the first hypothesis, one can beconsidered the air shower particles responsible for the radioemission are concentrated in a region of space close to theshower axis. The coherence property of the signal leeds to alateral spatial extension variate between 3 m to 13 m orderthe chosen frequency band. For the longitudinal thickness ofthe region, it is known after the work of Linsley [15] that theparticles swarm has a few meters of longitudinal thickness.It is clear now that most electrons/positrons are concentratedin a small symmetric cylindrically volume with negligibledimensions compared to the distances between the emissioncenter and the array of antennas which explains the aboveapproximation Rc >> d. Finally, the last hypothesis wasnecessary to generalize the reconstruction model to allshowers with different zenith angles. Yet, the difference∆ is a parabolic function of the distance d. In term ofarrival times, ∆ is expressed by the time delay between theinstant t pred
i predicted by the hypothetical passage of theplane wave front on antenna i and the instant tmax
i measuredexperimentaly by the slightly curved wave front on thesame antenna (see Appendix A). In order to ensure identicaltreatment for all showers despite of their zenith angles θ .The coordinates of the antennas (xi,yi,zi = 0) and times(tmax
i ,t predi ) must be expressed in a new frame called the
shower frame defined by two rotation involves both theazimuthal and zenithal angles (φ ,θ ) as used in [14]. Thiscorrespondence is then written for an antenna i as follows:
c(tmaxi − t pred
i ) = a+1
2Rc(dr
i )2,
where dri the distance between antenna i and the shower
axis in the shower frame,
dri =
√(xr
i − xrc)
2 +(yri − yr
c)2 +(zr
i − zrc)
2,
The 3D rotation matrix used is as follows :xri
yri
zri
=
cos(φ).cos(θ) cos(θ).sin(φ) sin(θ)−sin(φ) cos(φ) 0
−cos(φ).sin(θ) −sin(θ).sin(φ) cos(θ)
xiyizi
The development of calculation gives the following systemof equations.
xri = cos(θ).(cos(φ).xi + sin(φ).yi)+ sin(θ).zi(1)
yri =−sin(φ).xi + cos(φ).yi(2)
zri =−sin(θ).(cos(φ).xi + sin(φ).yi)+ cos(θ).zi(3)
Fig. 4:
The same transformation is performed to the shower corecoordinates (xc,yc,zc). The term time will not be affectedby the transformation since the difference will remove thesame added term zr
ic . Giving the χ2 function:
χ2 =
N
∑i=1
(c(tmaxi −t pred
i )−a− (xri − xr
c)2 +(yr
i − yrc)
2 +(zri − zr
c)2
2Rc)2
This estimator has five free parameters the constant a,the radius of curvature Rc and (xr
c,yrc,z
rc) expressed in
the shower frame. The nonlinear terms force us to use anumerical method for the χ2 minimization. Both the matlabCurvefitting toolbox and Optimization toolbox have beenused and give the same results. We found that the moreappropriate algorithm for the resolution of the minimizationproblem was the Levenberg-Marquardt designed for non-linear problems.
6 Data analysis and events selectionCriteria
6.1 Selection strategyOur strategy for estimating the radius of curvature demand-ed the selection of only those events in which we are sureof their quality and their parameters reconstructed by othermodels in order to facilitate comparison between differentmodels. For this we have chosen a selection with cuts simi-lar to those used to fit the lateral distribution function [7].The data used in this paper were collected by the CODALE-MA experiment during over than 3 years between november2006 and january 2010. We find a yield of 196526 eventsdetected by the scintillator array after selections we use 450internal events.
6.2 Events SamplesTable shows the numbers of collected events and their types.We report here the efficiency of samples.
Type Number EfficiencyTrigger SD 196526 100%
Coincidences (SD and antennas) 2030 1.03%Internal events 450 22.17%
Rebai A. Towards the primary particle identification by the CODALEMA experimentRAPPORT D’ACTIVITE
Fig. 5: histogram of shower core elevation for selectedevents
7 Verification and Confirmation of ResultsNumerical minimization of the χ2 function gives the showercore position (xr
c,yrc,z
rc) expressed in the shower coordinate
system. For using coordinates its need to be transformed byan inverse transformation that involves the inverse rotationmatrix (see Appendix D) to the ground frame. Our approachfor the validation of the model is based on the comparisonof these reconstructed parameters with other models andwith confirmed physical values.
7.1 Consistent shower core elevationThe CODALEMA experiment is situated on a flat landof geographical altitude of 134 meters. Given the lateralextension of the antenna array. We can be considered witha good approximation that antennas have an altitude equalto zero meter in the ground local reference. The figure 5shows a histogram of the shower core altitudes for selectedevents. We can conclude that elevations are consistent withthe geometric configuration of the antenna array. Then themodel give a correct zc consistent with zero.
7.2 Confirmation of the radio core east shiftingsignature of charge excess mechanism
We can consider that the real test of validation of our exper-imental reconstruction is whether it predicts the systemat-ic shift between the radio core and the particle radio. Thisshifting is an evidence of a negative charge excess in theelectromagnetic component during the shower develope-ment. This effect was predicted by Askaryan [11] in thesixties of the last century. According to [11], this negativecharge excess acts as a monopoly that moves with the speedof light and which contributes to the emission by coherentradio signal. The processes responsible for this negativecharge excess are:
• Compton recoil electrons ejected into shower byphotons with energy less than 20 MeV .
• δ -ray process which consist of electrons ejectedfrom external atomic orbital under the influence ofelectromagnetic cascade.
• Fast annihilation of positrons in flight.
Further explanations are compiled in the Allan review[12]. This effect has several signatures. it appears in thepolarization of the electric field on the ground as shown in[13] also in the systematic shift between radio shower core
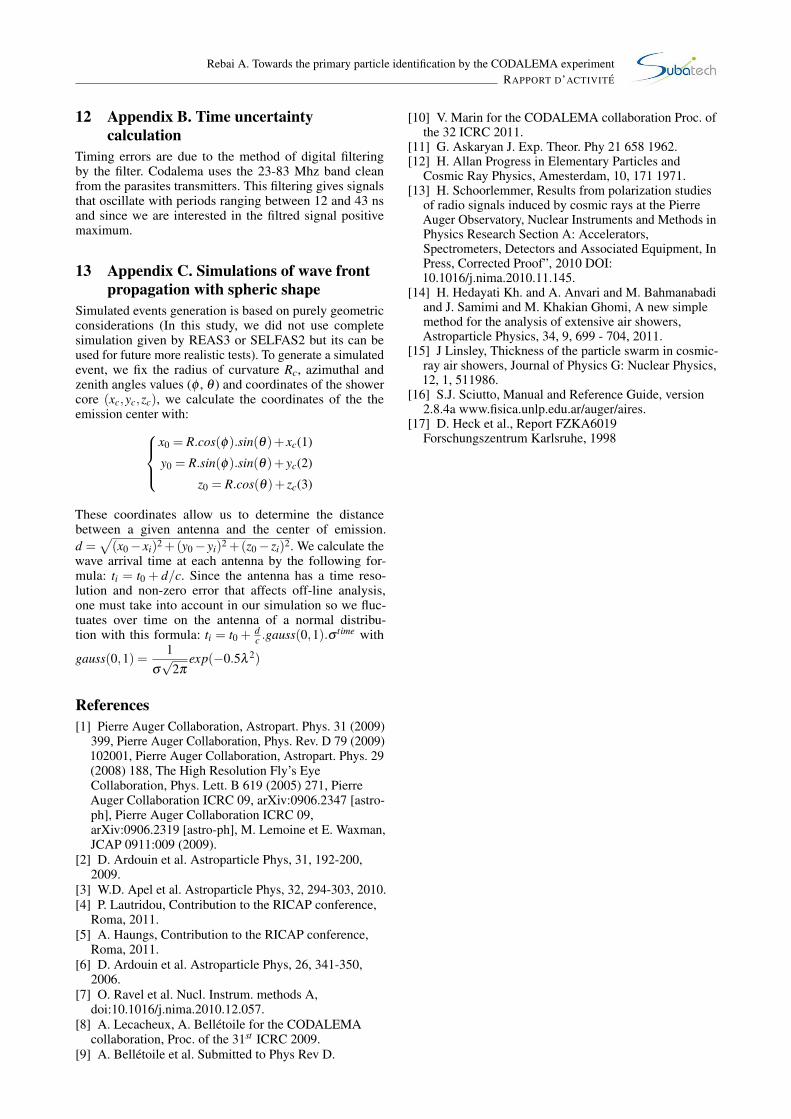
Fig. 6:
and particle shower core seen in data with [8] and [9] andexplained by simulations in [10]. The reconstruction modelused in these papers assume that the lateral density profile(LDF) of the radio shower follow a decreasing exponentialas mentionned by Allan in [12]. Then, the electric field hasthis formula
E = E0.exp(
− (((x− xc)2 +(y− yc)
2−
((x− xc).cos(φ).sin(θ)+(y− yc).sin(φ).sin(θ))2))1/2
d0)
with xld fc , yld f
c were coordinates of the radio shower core bythe LDF model. The radio core were expressed in particlecore frame with the next geometrical transformation
~S = ~rr−~rp
with ~rr and ~rp are vectors respectively for radio and particleshower cores and ~S the vector which represent the systemat-ic shift. Figure 6 demonstrates a comparaison between theeast-west projection of the systematic shift ~SEW measuredby PM and LDF models. Obtained curves are fitted by agaussian. According to our statistical approach, it can beconcluded that the radio shower cores are shifted towardsthe east with respect to the particle shower cores. This shiftis a physical effect verified by both methods. We remem-ber that the two methods are completely independent. PMmethod is based on the distribution of arrival times and theLDF method is based on the amplitudes of the radio sig-nal on the antennas. One can interpret the difference in themean shift value between the two models by the signal tonoise ratio is different for the two methods. LDF model isbased on the radio signal amplitudes on the antennas. CO-DALEMA antennas are occupied by a low noise amplifier(LNA) are very sensitive to the signals detected. Knowingthat the noise level of the galactic background is worth??and the value of a signal typically developed by a showerwith an energy of 1017 in the range of 100 µV/m. This sen-sibility can expect a ratio of the order 1000.

Rebai A. Towards the primary particle identification by the CODALEMA experimentRAPPORT D’ACTIVITE
Fig. 7:
Fig. 8:
Fig. 9: Histogram of the radius of curvature for 1010 eventsshow a peak at about 4 km.
Fig. 10: Correlation between Rc et θ . The mean value of Rcincrease with the zenithal angle.
8 Results of the Curvature Radiusreconstruction
9 Towards a primary particle natureidentification with the radio method
9.1 Atmospheric density profileThe earth’s atmosphere acts like a layer of matter with1000g.cm−2 of thickness. The earth’s atmosphere acts likea volume of detection where the primary particle depositsits energy as huge number of secondary. Then, any attemptfor the determination of chemical composition of UHECRpasses through the fine understanding of the atmospheredensity variation as function of the altitude above thesea level exactly at the experiment site in France. Forthese reasons, the atmospheric density profile is a highlyrequired knowledge for converting the reconstructed radiusof curvature into the shower maximum Xmax using thisformula:
X radiomax =
f Linsley(Rc.cos(θ)))cos(θ))
where fLinsley is a function following the Linsley’s param-eterization which divides the atmosphere into five layersand give a realistic approximation. So we have compileddata from the US standard atmosphere cited in Aires us-er manual [16] and from the middle europe atmosphere in7 months implemented in Corsika package [17]. We haveused the Linsley’s parameterization [16]. Our compilationshows that both atmospheres have very similar character-istics (see fig. 11). The same figure shows that the error inthe Xmax estimation due to the atmosphere collected datais the order of σatm = 45g.cm−2 which represents a first
Rebai A. Towards the primary particle identification by the CODALEMA experimentRAPPORT D’ACTIVITE
Fig. 11: (Above) Compilation of data that represent the ver-tical atmospheric depth according to the altitude above thesea level with respect to the Linsley’s parameterization. At-mospheric data are collected from the US standard atmo-sphere (dash black curve) [16] and the middle Europe at-mosphere with measurements at 7 different months (col-ored solid curve) [17]. (Below) Comparison between thesame data taking as reference the US standard atmosphereXEU −XUS.
source of systematic error on the our chemical compositionestimation.
9.2 Composition results:Preliminaryil est tres important d’interpreter les courbes d’identificationavec les simulations et les resultats theoriques je dois ap-prendre comment mettre les droites theoriques SIBYL etQSJET. je dois aussi lire la these de Frank Schrodder.
10 Conclusions11 Appendix A. Calculation method for
theoretical and experimental time delays11.1 Theoretical time delay calculationWe assume here that the signal propagation is carried outwith a constant speed which is the speed of light in thevacuum c and in the hypothesis that the radio signal wavefront is a plan perpendicular to the arrival direction. Theplan equation can be written as:
u.x+ v.y+w.z+d = 0,
with (u,v,w) = (cos(φ).sin(θ),sin(φ).sin(θ),cos(θ)) arethe coordinates of the unit vector ~n normal to the plane.
Fig. 12: For 38 events, we use two reconstruction methodsspheric and parabolic.
Fig. 13:
Now we take the first tagged antenna (fta) as reference tocalculate the constant d. the equation becomes:
u.x+ v.y+w.z− (u.x f ta + v.y f ta +w.z f ta) = 0,
The distance between this plane and the other taggedantennas located at positions (xi,yi,zi) with i = 1, ...,N isgiven by this formula:
di =|u.xi + v.yi +w.zi− (u.x f ta + v.y f ta +w.z f ta)|√
u2 + v2 +w2
The arrival time of the plan on each antenna is given bysimple division of the distance di by c then:
t predi = t f ta +
di
c.
this formula allows to reproduce the plane wave propaga-tion from the first tagged antenna until other antennas. The-oretical delay is then written:
∆ttheoi = t pred
i − t f ta =di
c.
11.2 Experimental time delay calculationThe filtered signals maximum in each antenna enable thedetermination of the experimental arrival time the real timenoted tmax
i . Experimental delay is then written:
∆texpi = tmax
i − tmaxf ta =
di
c.
∆ttheoi and ∆texp
i are used in the begining of this paper forshowing the deviation from the plane wave model.
Rebai A. Towards the primary particle identification by the CODALEMA experimentRAPPORT D’ACTIVITE
12 Appendix B. Time uncertaintycalculation
Timing errors are due to the method of digital filteringby the filter. Codalema uses the 23-83 Mhz band cleanfrom the parasites transmitters. This filtering gives signalsthat oscillate with periods ranging between 12 and 43 nsand since we are interested in the filtred signal positivemaximum.
13 Appendix C. Simulations of wave frontpropagation with spheric shape
Simulated events generation is based on purely geometricconsiderations (In this study, we did not use completesimulation given by REAS3 or SELFAS2 but its can beused for future more realistic tests). To generate a simulatedevent, we fix the radius of curvature Rc, azimuthal andzenith angles values (φ , θ ) and coordinates of the showercore (xc,yc,zc), we calculate the coordinates of the theemission center with:
x0 = R.cos(φ).sin(θ)+ xc(1)
y0 = R.sin(φ).sin(θ)+ yc(2)
z0 = R.cos(θ)+ zc(3)
These coordinates allow us to determine the distancebetween a given antenna and the center of emission.d =
√(x0− xi)2 +(y0− yi)2 +(z0− zi)2. We calculate the
wave arrival time at each antenna by the following for-mula: ti = t0 + d/c. Since the antenna has a time reso-lution and non-zero error that affects off-line analysis,one must take into account in our simulation so we fluc-tuates over time on the antenna of a normal distribu-tion with this formula: ti = t0 + d
c .gauss(0,1).σ time with
gauss(0,1) =1
σ√
2πexp(−0.5λ 2)
References[1] Pierre Auger Collaboration, Astropart. Phys. 31 (2009)
399, Pierre Auger Collaboration, Phys. Rev. D 79 (2009)102001, Pierre Auger Collaboration, Astropart. Phys. 29(2008) 188, The High Resolution Fly’s EyeCollaboration, Phys. Lett. B 619 (2005) 271, PierreAuger Collaboration ICRC 09, arXiv:0906.2347 [astro-ph], Pierre Auger Collaboration ICRC 09,arXiv:0906.2319 [astro-ph], M. Lemoine et E. Waxman,JCAP 0911:009 (2009).
[2] D. Ardouin et al. Astroparticle Phys, 31, 192-200,2009.
[3] W.D. Apel et al. Astroparticle Phys, 32, 294-303, 2010.[4] P. Lautridou, Contribution to the RICAP conference,
Roma, 2011.[5] A. Haungs, Contribution to the RICAP conference,
Roma, 2011.[6] D. Ardouin et al. Astroparticle Phys, 26, 341-350,
2006.[7] O. Ravel et al. Nucl. Instrum. methods A,
doi:10.1016/j.nima.2010.12.057.[8] A. Lecacheux, A. Belletoile for the CODALEMA
collaboration, Proc. of the 31st ICRC 2009.[9] A. Belletoile et al. Submitted to Phys Rev D.
[10] V. Marin for the CODALEMA collaboration Proc. ofthe 32 ICRC 2011.
[11] G. Askaryan J. Exp. Theor. Phy 21 658 1962.[12] H. Allan Progress in Elementary Particles and
Cosmic Ray Physics, Amesterdam, 10, 171 1971.[13] H. Schoorlemmer, Results from polarization studies
of radio signals induced by cosmic rays at the PierreAuger Observatory, Nuclear Instruments and Methods inPhysics Research Section A: Accelerators,Spectrometers, Detectors and Associated Equipment, InPress, Corrected Proof”, 2010 DOI:10.1016/j.nima.2010.11.145.
[14] H. Hedayati Kh. and A. Anvari and M. Bahmanabadiand J. Samimi and M. Khakian Ghomi, A new simplemethod for the analysis of extensive air showers,Astroparticle Physics, 34, 9, 699 - 704, 2011.
[15] J Linsley, Thickness of the particle swarm in cosmic-ray air showers, Journal of Physics G: Nuclear Physics,12, 1, 511986.
[16] S.J. Sciutto, Manual and Reference Guide, version2.8.4a www.fisica.unlp.edu.ar/auger/aires.
[17] D. Heck et al., Report FZKA6019Forschungszentrum Karlsruhe, 1998


![Current status of the CODALEMA/EXTASIS experiments · EXTASIS, triggered by the CODALEMA scintillators, detects since 2016 the air shower electric eld in [1;6] MHz. We also expect](https://img.pdfslide.us/doc/110x75/60bad6563682363d04139d27/current-status-of-the-codalemaextasis-experiments-extasis-triggered-by-the-codalema.jpg)