Embed Size (px)
Citation preview

Prof. Dr. Hari K. ShresthaNepal Engineering College
December 16, 2015New Delhi, India
Ongoing activity of “Hydropower development in the context of climate change: Exploring conflicts & fostering cooperation across scales & boundaries in the Eastern Himalayas”
(CoCooN-CCMCC Project)
Developing regional collaboration in river basin management in response to climate change: Final Workshop
The impact of hydropower projects on water availability in Tamor Basin, Koshi, in the context of climate change
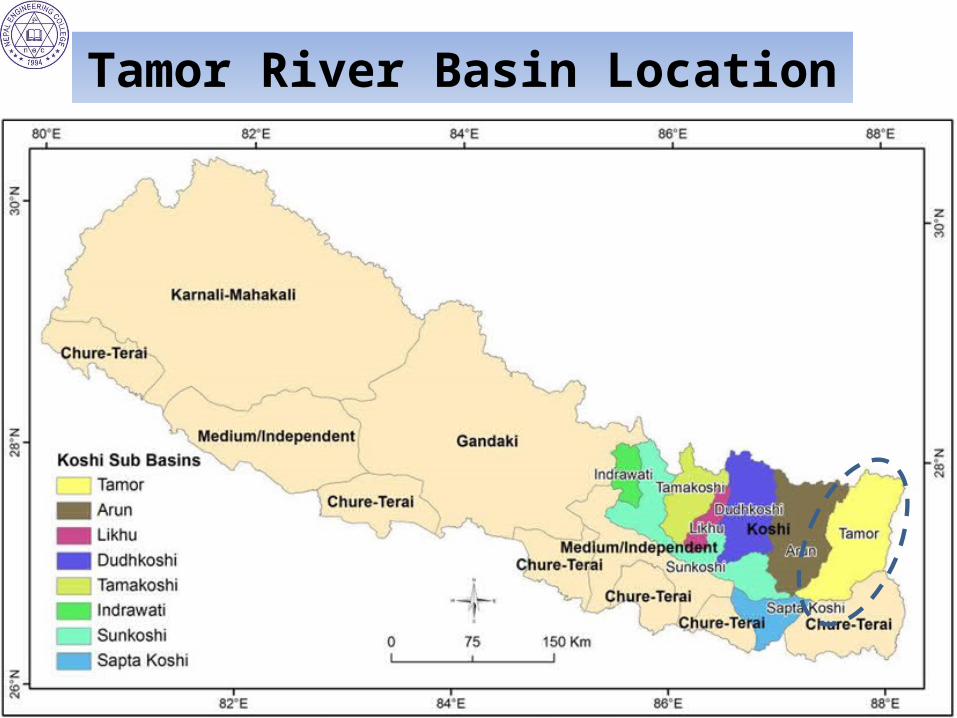
Tamor River Basin Location

Satellite image of Tamor River Basin Rivers in Tamor River Basin
Tamor River Basin: Background Info
(Pathak, 2014)

Location of past disaster events in the Tamor Basin (DesInventar, 2011)
Regional Geological Map of the Tamor Basin
Tamor River Basin: Background Info
(Pathak, 2014)

Land use map of the Tamor Basin
Landslide hazard map of the Tamor Basin
Tamor River Basin: Background Info
(Pathak, 2014)

No basin specific dataHydrological Similarity
of nearby stations

Trend of average annual flow (m3/s)
Trend of peak flow (m3/s)
River flow is decreasing in Teesta.

Panday et al., 2013
Daily
mea
n di
scha
rge
(m3 /
s)
Decreasing River flow at Tamor (Majhitar) Data source: DHM
River flow is decreasing in Tamor.

Climate Change Projection of Hewa Sub-basin, Tamor Basin, Nepal
Data Source: DHM/ADB
Projection: Precis A1B Scenario
Type: Daily Bias Corrected
Hydrological Model: VMOD

JanFe
bMar
AprMay
Jun JulAug
Sep Oct Nov
Dec0
0.51
1.52
2.53
3.54
2.24
3.523.22
2.33
1.15
1.821.98 1.86 1.88
2.59
3.27 3.23
Increase in average temperature (2050's)Station: Melung
Month
Incr
ease
in a
vera
ge T
empe
r-at
ure
0C
Projected Average Temperature Change in MelungProjected: 2050’sRange: +1.15 to + 3.52 0CAverage: + 2.42 0CLocation: Melung Meteorology station
Melung
Phidim

Jan Feb Mar Apr May Jun Jul Aug Sep Oct Nov Dec0
1
2
3
4
5
2.54
4.28
3.34
1
1.77 1.671.44
1.811.94
1.77
2.452.72
Increase in average temperature (2050's)Station: Phidim
Month
Incr
ease
in a
vera
ge T
empe
ratu
re 0
C
Projected Average Temperature Change in PhidimProjected: 2050’s, Range: +1.0 to + 4.28 0CAverage: + 2.22 0C, Location: Phidim Meteorology station

Changes in Rainfall MelungAnnual Rainfall: + 12.5 %Monsoon rainfall: +16%Winter: -26.6% PhidimAnnual Rainfall: + 21 %Monsoon rainfall: +24.6%Winter: -26%
Jan Feb Mar Apr May Jun Jul Aug Sep Oct Nov Dec0
100
200
300
400
500
600
700Melung Rainfall , mm
Rain
fall,
mm
Jan Feb Mar Apr May Jun Jul Aug Sep Oct Nov Dec0
50100150200250300350400
Phidim Rainfall, mmRa
infa
ll, m
m
CC 2050’s
CC 2050’s
Rainfall will reduce in dry period and increase in wet period. Not a good news.

Upper Hewa KholaAnnual average flow: + 22 %Rainy season average flow: +33%Winter: -5.3%Pre-rainy season average flow: -24%Post-rainy season average flow: +20%
Lower Hewa KholaAnnual average flow: + 34 %Rainy season average flow: +50%Winter: -8%Pre-rainy season average flow: -19%Post-rainy season average flow: +28%

Summary of CC modeling
• Decrease in dry season flow → water availability for HPP and other productive uses decrease → potential source of conflict
• Increase in wet season flow → flood, landslide, debris flow, river bed aggradation, reservoir fill up
• Increase in temperature, number of high temperature days will increase → decrease in production, increase in evapotranspiration rate
• 24-hr max rainfall of 100 years return period now in 10 years• Flow duration curve shift → Q40 value will decrease• HFL level and scour depth will increase → need to design
structures accordingly, traditional design may not work
Blurred figureBlurred data

Approximate HPP locations in Hewa Khola Basin, Tamor, Nepal
Hewa Khola
Pheme Khola

Layout of Lower Hewa HPP → More than five km of dry river stretch in the absence of e-flow

November 18, 2015: Hewa discharge: 4.5 m3/s, Pheme Discharge: 2.0 m3/s. Difference between estimated/adopted and real river flow affects water availability for HPPs and other productive uses of water, and can cause conflict.

Factors considered: monthly variations in (a) river flow, (b) e-flow, (c) crop cycle/type, (d) population increase, (e) water supply, (f) rainfall(g) industrial and “other” water needs, (h) return flow and (i) CC.

Concept too simple?Does not consider details of each parameter?Compromise accuracy?Has to be, in the beginning, if it is to be adapted/implemented by policy makers and decision makers.
Activities related to linkage between Hydropower and Water Availability
• Environmental Flows Assessment (EFA) syllabus prepared (jointly with IWMI), approved by Pokhara University: expected to have sustained impact as some of the graduates will eventually work in water management sector
• EFA training conducted jointly with IWMI and participated by policy makers and HPP designers; lower level officers convinced; discussion with decision makers under progress
• CC modeling to estimate changes in river flows• Water requirement estimation based on crop cycle, crop type and other
livelihood activities• Conceptual water availability accepted by district level officers, further
works needed for implementation by DDC and MoSTE• Primary data monitoring started, for data quality check

Planned Activities• Additional hydro-meteorological data collection, interaction
with local residents on perceived CC and impact on livelihood• E-flows assessment seminar• Interaction with DoED, NEA and MoSTE on adoption of e-
flows assessment method for HPPs• Interaction with MoSTE and DDC officials on HPP water
availability assessment method• Revise trend and CC modeling• Finalize tool to estimate water availability for HPPs, in each
basin.

Regional Collaboration in response to CC
• Policy analysis related to hydropower and water availability jointly by institutes in Nepal and India
• Biophysical issues, like e-flow, hydropower tunnel-spring relation jointly being studied, and data shared between Nepal and India; Pani-satsang, e-flows training to policy makers organized jointly, CC model outputs shared.
• Post-doc candidates having study sites in Nepal and India.• Hydropower proponents, HPP designers and policy makers
represented in joint discussions.• Hoping to raise level of mutual confidence, which is the
fundamental issue in developing regional collaboration in river basin management.

The activities related to the CoCooN-CCMCC Project is funded through Netherlands Organization for Scientific Research (NWO) by the Department of International Development (DFID), UK.
Thank you.For further query: email: [email protected]


![Workshop Hydropower and Fish.pptx [Schreibgeschützt] - Workshop Hydropower and Fish... · Workshop Hydropower and Fish Existing hydropower facilities: ... spawning grounds and shelter](https://img.pdfslide.us/doc/110x75/5a8733247f8b9afc5d8da3c5/workshop-hydropower-and-fishpptx-schreibgeschtzt-workshop-hydropower-and-fishworkshop.jpg)