Embed Size (px)
Citation preview
RELIABILITY ANALYSIS OF REINFORCED CONCRETE
SHALLOW FOOTINGS DESIGNED USING BNBC 2006
SUKANTA KUMER SHILL
DEPARTMENT OF CIVIL ENGINEERING
DHAKA UNIVERSITY OF ENGINEERING AND TECHNOLOGY, GAZIPUR
FEBRUARY, 2015

i
RELIABILITY ANALYSIS OF REINFORCED CONCRETE
SHALLOW FOOTINGS DESIGNED USING BNBC 2006
A Thesis
by
SUKANTA KUMER SHILL
Submitted to the Department of Civil Engineering,
Dhaka University of Engineering and Technology (DUET), Gazipur-1700
in partial fulfillment of the degree of
MASTER OF SCIENCE IN CIVIL ENGINEERING
FEBRUARY, 2015

The thesis titled "Reliability Analysis of Reinforced Concrete Shallow
Footings Designed Using BNBC 2006" submitted by Sukanta Kumer Shill,
Student Number-092107P, and Session:2009-2010 has been accepted as satisfactory in
partial fulfillment of the requirement for the degree of Master of Science in Civil
Engineering on 20 February 2015.
BOARD OF EXAMINERS:
: Chairman
Department of Civil EngineeringDUET, Gazipur-1700.
: Member
ProfessorDepartment of Civil EngineeringDUET, Gazipur-1700.
: Member
Associate ProfessorDepartment of Civil EngineeringDUET, Gazipur-1700.
Member(Supervisor)
: Member (External)
Department of Civil Engineering
BUET. Dhaka-1000.
Dr. Md. Khasro MiahProfessor & Head
Dr. M6hammad A6dur Rashid
Dr. Md. Nazr[rl IslamProfessorDepartment of Civil Engineering
DUE\Gazipur-1700.
mmel Hoque
iii
CANDIDATE’S DECLARATION
It is hereby declared that this thesis or any part of it has not been submitted elsewhere for
the award of any degree.
Signature of the candidate
(Sukanta Kumer Shill)

iv
(Dedicated to my Parents)
v
ACKNOWLEDGEMENT
The author expresses his sincere appreciation to Supervisor, Dr. Md. Mozammel Hoque
Associate Professor, Department of Civil Engineering, Dhaka University of Engineering
& Technology (DUET), Gazipur, for his cordial guidance and support during my research
efforts and course work. His keen interest and valuable suggestions, constructive
criticisms and proper advice at every stage made this research valuable. I would like to
thank Prof. Dr. Mohammad Abdur Rashid for his guidance and for serving on the
committee. I would also like to thank Prof. Dr. Ganesh Chandra Saha for his guidance
inside and outside the classroom. Most importantly I would like to thank my wife
Anindita Roy for her continual support.
My sincere appreciation also goes to Prof. Dr. Mehedi Ahmed Ansary for his valuable
comments on the research work and serving as committee member. I would also like to
thank Prof. Dr. Khasro Miah, Head, Department of civil Engineering and Prof. Dr. Nazrul
Islam, Department of civil Engineering. Finally, the author expresses his gratitude and
appreciation to his beloved parents and family members, without my parents blessing the
research work was not possible successfully.
vi
ABSTRACT Uncertainties in designing structures and its supporting foundations are inevitable in
nature. Despite of the uncertainties, deterministic values are used in designing
structures and its supporting foundations. Due to presence of uncertainties in various
parameters accounting for the analysis and design, it is very difficult to measure safety
for any structure from deterministic analysis. So the main objective of this research is
to evaluate the safety in terms of reliability of RC shallow footings design using BNBC
2006. To achieve the goal, three model buildings (six, eight and ten storied) have been
designed following the provisions of the Bangladesh National Building Code (BNBC),
2006. The bearing capacity failure of footing, punching shear failure of concrete, one
way shear failure and flexural failure of footings are used as performance functions. In
reliability analysis, the statistical parameters of design variables are selected from
available literatures. Monte Carlo Simulation (MCS) method has been used in the
study. Finally, the reliability index for different failure modes such as flexural failure,
one way shear failure, punching shear failure, and bearing failure of soil are determined
and compared with standard expected values. From the analytical investigation, it is
found that the reliability of footings for different failure modes is different. The
reliability against soil bearing capacity is lower than the reliability against structural
failure of footing designed (BNBC), 2006. The reliability index against soil bearing
capacity varies from 2.29 to 2.46 for COV of soil of 40% using a factor of safety of
2.50 under earthquake load. The reliability index for punching shear varies from 2.52 to
3.26 under earthquake load. The failure probability of shallow footings due to one way
shear and flexural moment has been found satisfactory accounting for the gravity loads
in combination with the effect of seismic load. However, the performance of RC
shallow footing designed using BNBC, 2006 is below average under gravity loads only
as evaluated in the study. On the other hand, the performance of RC shallow footing
designed using BNBC, 2006 is poor under the earthquake load. On the basis of the
results obtained in the analytical investigation of the study, a factor of safety 3.50
instead of 2.50 is recommended for footing design, because, it is seen that the
performance of shallow footing designed using FS = 3.50 is above average. It is also
observed that the reliability of footings depends highly on the live load to dead load
ratio. The reliability of footings under earthquake loads decreases with the increase of
COV of earthquake load.
vii
CONTENTS
Page No.
TITLE PAGE i
CERTIFICATION PAGE ii
DECLARATION iii
DEDICATION iv
ACKNOWLEDGEMENT v
ABSTRACT vi
CONTENTS vii
LIST OF FIGURES x
LIST OF TABLES xiii
Chapter 1 INTRODUCTION
1.1 Background 1
1.2 Objectives of the research 3
1.3 Methodology 3
1.3.1 Basic variables 4
1.3.2 Limit state function 4
1.3.3 Monte Carlo Simulation 5
1.3.4 Reliability analysis 5
1.4 Scope and limitation 7
1.5 Contents of the study 7
Chapter 2 ANALYSIS of MODEL BUILDINGS
2.1 Introduction 9
2.2 Model building 9
2.2.1 Building geometry 10
2.2.2 Cross sectional dimension 11
2.3 Finite element modeling 12
2.3.1 Slab modeling 14
2.3.2 Beam modeling 15
2.3.3 Column modeling 15

viii
2.3.4 Foundation modeling 15
2.4 Loads and other considerations 16
2.4.1 Dead load 16
2.4.2 Live loads 17
2.4.3 Earthquake loads 17
2.4.4 Load combinations 18
2.4.5 Materials properties 18
2.5 Results of deterministic analysis 18
2.6 Design of isolated shallow footings 19
2.6.1 Allowable bearing capacity of soil using SPT 19
2.6.2 Determination of Footing Sizes 20
2.6.3 Structural Design of RC Shallow Footing 21
2.7 Results 24
Chapter 3 STATISTICS of LOAD and RESISTANCE
3.1 Introduction 29
3.2 General load models 29
3.2.1 Dead load model 29
3.2.2 Live load models 30
3.2.3 Earthquake load model 32
3.3 Model of resistance 33
3.3.1 Compressive Strength of Concrete 33
3.3.2 Yield Strength of Reinforcing Steel 34
3.3.3 Bearing Capacity of Soil 34
Chapter 4 RELIABILITY ANALYSIS of FOOTINGS
4.1 Introduction 36
4.2 Reliability analysis 36
4.2.1 Monte Carlo Simulation 37
4.2.2 Random variables 38
4.2.3 Geotechnical versus structural variability 41
4.2.4 Limit state function 41
4.3 Result and discussion 45

ix
4.3.1 Failure probability of footings considering gravity
load
45
4.3.2 Failure probability of footings considering gravity
plus earthquake Load
47
4.3.3 Reliability of footings considering gravity loads 49
4.3.4 Reliability of Footings considering gravity plus
earthquake loads
51
4.3.5 Live load to dead load ratio 52
4.3.6 Effect of COV of soil on the reliability of footings
under gravity loads
54
4.3.7 Effect of COV of soil on the reliability of footings
under earthquake load
57
4.3.8 Effect of Factor of Safety on the reliability under
gravity loads
59
4.3.9 Effect of Factor of Safety on the reliability under
earthquake loads
62
4.3.10 Effect of COV of live load on the reliability of
footings under gravity load
65
4.3.11 Effect of COV of live load on the reliability under
earthquake load
69
4.3.12 Effect of COV of earthquake load on the reliability
against soil bearing capacity of footings
73
4.4 Conclusions 76
Chapter 5 CONCLUSIONS and RECOMMENDATIONS
5.1 Introduction 78
5.2 Specific conclusion 78
5.3 Recommendation for further study 79
REFFERENCES 80
SYMBOLS and NOTATIONS 86
APPENDIX
x
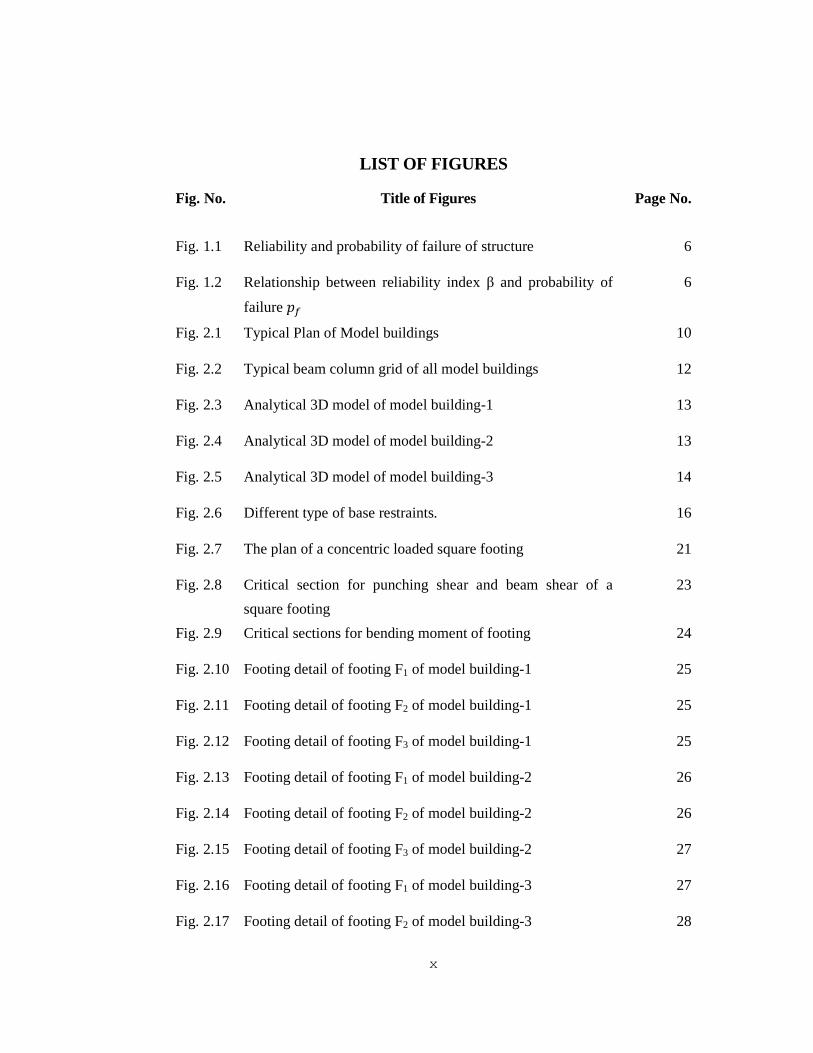
LIST OF FIGURES
Fig. No. Title of Figures
Page No.
Fig. 1.1 Reliability and probability of failure of structure 6
Fig. 1.2 Relationship between reliability index β and probability of
failure ��
6
Fig. 2.1 Typical Plan of Model buildings 10
Fig. 2.2 Typical beam column grid of all model buildings 12
Fig. 2.3 Analytical 3D model of model building-1 13
Fig. 2.4 Analytical 3D model of model building-2 13
Fig. 2.5 Analytical 3D model of model building-3 14
Fig. 2.6 Different type of base restraints. 16
Fig. 2.7 The plan of a concentric loaded square footing 21
Fig. 2.8 Critical section for punching shear and beam shear of a
square footing
23
Fig. 2.9 Critical sections for bending moment of footing 24
Fig. 2.10 Footing detail of footing F1 of model building-1 25
Fig. 2.11 Footing detail of footing F2 of model building-1 25
Fig. 2.12 Footing detail of footing F3 of model building-1 25
Fig. 2.13 Footing detail of footing F1 of model building-2 26
Fig. 2.14 Footing detail of footing F2 of model building-2 26
Fig. 2.15 Footing detail of footing F3 of model building-2 27
Fig. 2.16 Footing detail of footing F1 of model building-3 27
Fig. 2.17 Footing detail of footing F2 of model building-3 28
xi
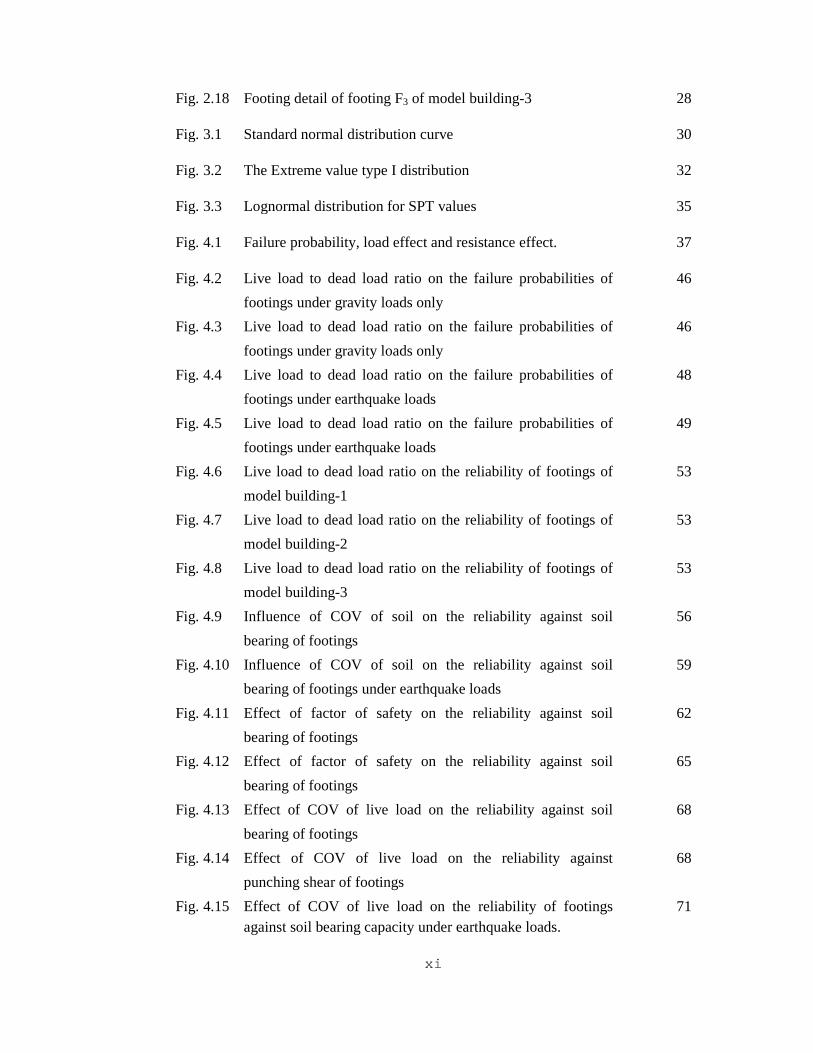
Fig. 2.18 Footing detail of footing F3 of model building-3 28
Fig. 3.1 Standard normal distribution curve 30
Fig. 3.2 The Extreme value type I distribution 32
Fig. 3.3 Lognormal distribution for SPT values 35
Fig. 4.1 Failure probability, load effect and resistance effect. 37
Fig. 4.2 Live load to dead load ratio on the failure probabilities of
footings under gravity loads only
46
Fig. 4.3 Live load to dead load ratio on the failure probabilities of
footings under gravity loads only
46
Fig. 4.4 Live load to dead load ratio on the failure probabilities of
footings under earthquake loads
48
Fig. 4.5 Live load to dead load ratio on the failure probabilities of
footings under earthquake loads
49
Fig. 4.6 Live load to dead load ratio on the reliability of footings of
model building-1
53
Fig. 4.7 Live load to dead load ratio on the reliability of footings of
model building-2
53
Fig. 4.8 Live load to dead load ratio on the reliability of footings of
model building-3
53
Fig. 4.9 Influence of COV of soil on the reliability against soil
bearing of footings
56
Fig. 4.10 Influence of COV of soil on the reliability against soil
bearing of footings under earthquake loads
59
Fig. 4.11 Effect of factor of safety on the reliability against soil
bearing of footings
62
Fig. 4.12 Effect of factor of safety on the reliability against soil
bearing of footings
65
Fig. 4.13 Effect of COV of live load on the reliability against soil
bearing of footings
68
Fig. 4.14 Effect of COV of live load on the reliability against
punching shear of footings
68
Fig. 4.15 Effect of COV of live load on the reliability of footings against soil bearing capacity under earthquake loads.
71
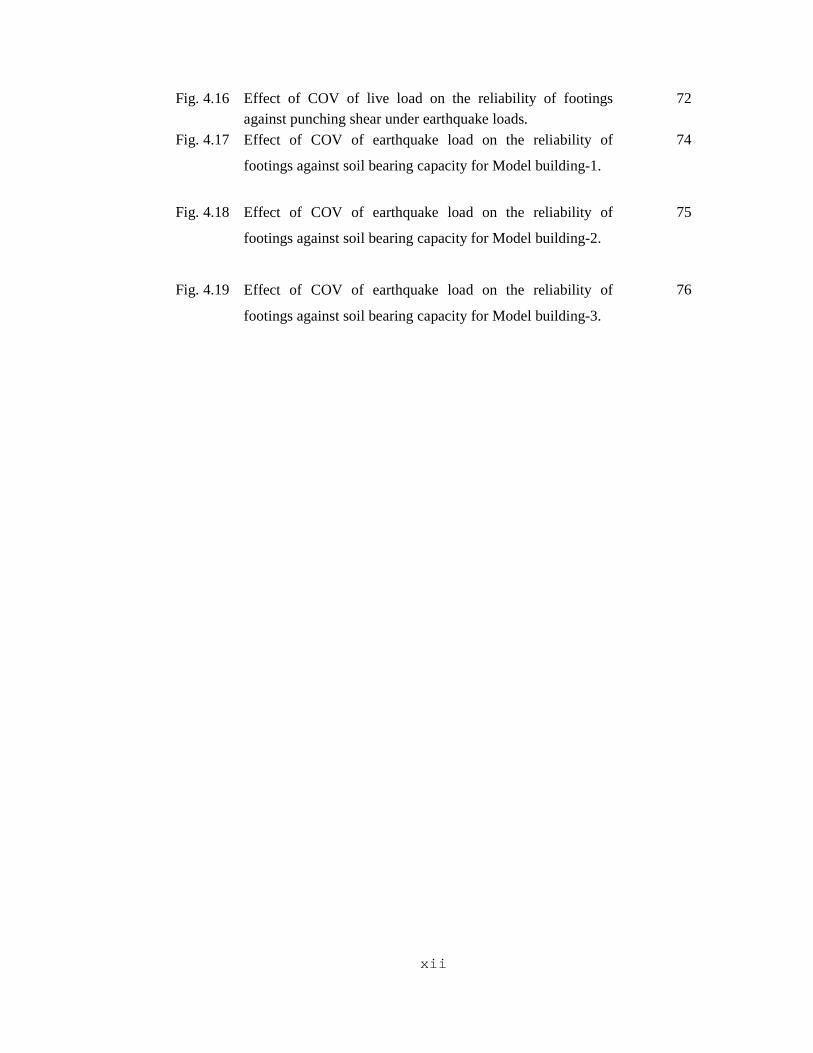
xii
Fig. 4.16 Effect of COV of live load on the reliability of footings against punching shear under earthquake loads.
72
Fig. 4.17 Effect of COV of earthquake load on the reliability of
footings against soil bearing capacity for Model building-1.
74
Fig. 4.18 Effect of COV of earthquake load on the reliability of
footings against soil bearing capacity for Model building-2.
75
Fig. 4.19 Effect of COV of earthquake load on the reliability of
footings against soil bearing capacity for Model building-3.
76

xiii
LIST OF TABLES
Table No. Title of Tables
Page No.
Table 1.1 The range of geotechnical reliability index (US Army
Corps of Engineers 1997).
6
Table 2.1 Building geometries of three Model Buildings 11
Table 2.2 Cross sectional dimensions of structural members of the
model building
11
Table 2.3 The material strengths are considered in the design 18
Table 2.4 Axial loads of columns of model building-1 19
Table 2.5 Axial loads of columns of model building-2 19
Table 2.6 Axial loads of columns of model building-3 19
Table 2.7 Footing schedule of model building-1 24
Table 2.8 Footing schedule of model building-2 26
Table 2.9 Footing schedule of model building-3 27
Table 3.1 Statistical parameters of dead load 30
Table 3.2 Coefficient of variation of maximum 50-year live load 31
Table 3.3 Statistical parameters of maximum 50-year earthquake
load
32
Table 3.4 Statistical parameters of concrete strength 33
Table 3.5 Statistical parameters of yield strength of steel 34
Table 3.6 The statistical variation of SPT of soil 34
Table 4.1 Basic variables for reliability evaluation of footings 40
Table 4.2 Failure probabilities of footings of model building-1 under
gravity loads
45
Table 4.3 Failure probabilities of footings of model building-2 under
gravity loads
45
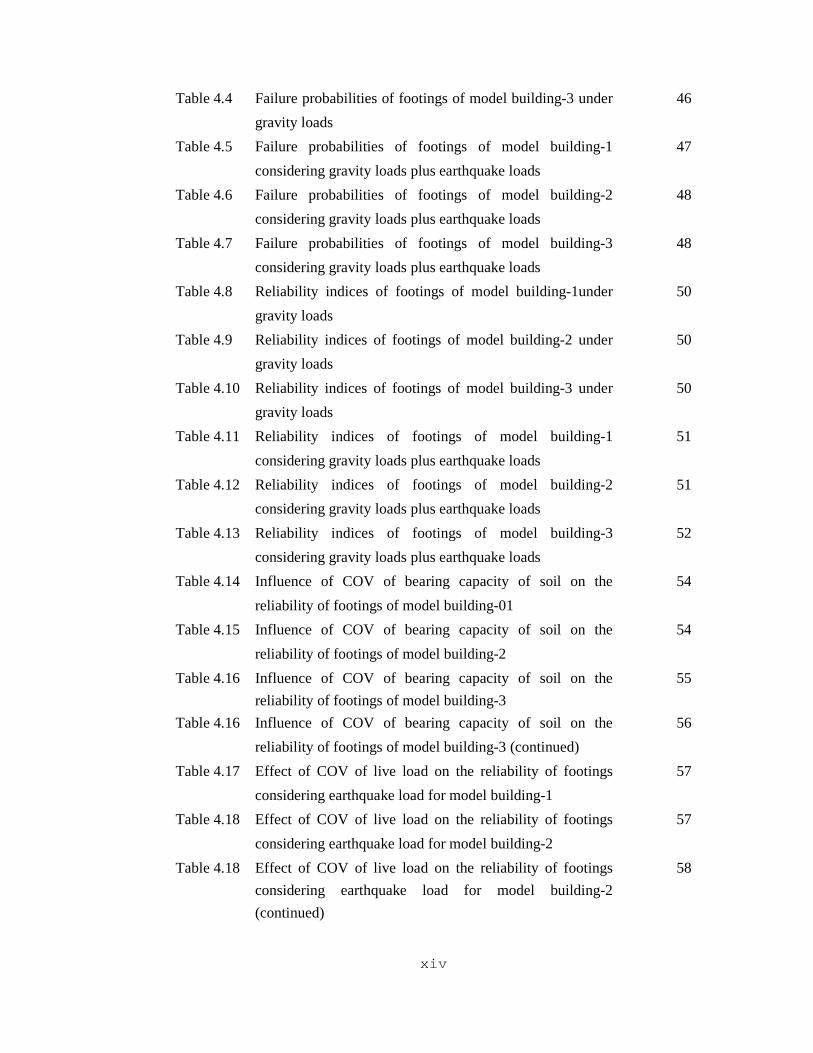
xiv
Table 4.4 Failure probabilities of footings of model building-3 under
gravity loads
46
Table 4.5 Failure probabilities of footings of model building-1
considering gravity loads plus earthquake loads
47
Table 4.6 Failure probabilities of footings of model building-2
considering gravity loads plus earthquake loads
48
Table 4.7 Failure probabilities of footings of model building-3
considering gravity loads plus earthquake loads
48
Table 4.8 Reliability indices of footings of model building-1under
gravity loads
50
Table 4.9 Reliability indices of footings of model building-2 under
gravity loads
50
Table 4.10 Reliability indices of footings of model building-3 under
gravity loads
50
Table 4.11 Reliability indices of footings of model building-1
considering gravity loads plus earthquake loads
51
Table 4.12 Reliability indices of footings of model building-2
considering gravity loads plus earthquake loads
51
Table 4.13 Reliability indices of footings of model building-3
considering gravity loads plus earthquake loads
52
Table 4.14 Influence of COV of bearing capacity of soil on the
reliability of footings of model building-01
54
Table 4.15 Influence of COV of bearing capacity of soil on the
reliability of footings of model building-2
54
Table 4.16 Influence of COV of bearing capacity of soil on the
reliability of footings of model building-3
55
Table 4.16 Influence of COV of bearing capacity of soil on the
reliability of footings of model building-3 (continued)
56
Table 4.17 Effect of COV of live load on the reliability of footings
considering earthquake load for model building-1
57
Table 4.18 Effect of COV of live load on the reliability of footings
considering earthquake load for model building-2
57
Table 4.18 Effect of COV of live load on the reliability of footings
considering earthquake load for model building-2
(continued)
58

xv
Table 4.19 Effect of COV of live load on the reliability of footings
considering earthquake load for model building-3
58
Table 4.20 Effect of Factor of Safety on the reliability against bearing
failure of soil of model building-1
60
Table 4.21 Effect of Factor of Safety on the reliability against bearing
failure of soil of model building-2
60
Table 4.21 Effect of Factor of Safety on the reliability against bearing
failure of soil of model building-2 (continued)
61
Table 4.22 Effect of Factor of Safety on the reliability against bearing
failure of soil of model building-3
61
Table 4.23 Effect of Factor of Safety on the reliability against bearing
failure of soil of model building-1under earthquake load
63
Table 4.24 Effect of Factor of Safety on the reliability against bearing
failure of soil of model building-2 under earthquake load
63
Table 4.24 Effect of Factor of Safety on the reliability against bearing
failure of soil of model building-2 under earthquake load
(continued)
64
Table 4.25 Effect of Factor of Safety on the reliability against bearing
failure of soil of model building-3 under earthquake load
64
Table 4.26 Influence of COV of live load on the reliability of footings
of model building-01
66
Table 4.27 Influence of COV of live load on the reliability of footings
of model building-02
66
Table 4.27 Influence of COV of live load on the reliability of footings
of model building-02 (continued)
67
Table 4.28 Influence of COV of live load on the reliability of footings
of model building-03
67
Table 4.29 Effect of COV of live load on the reliability of footings
considering earthquake load for model building-1
69
Table 4.30 Effect of COV of live load on the reliability of footings
considering earthquake load for model building-2
70
Table 4.31 Effect of COV of live load on the reliability of footings
considering earthquake load for model building-3
70
Table 4.31 Effect of COV of live load on the reliability of footings
considering earthquake load for model building-3 (cont.)
71

xvi
Table 4.32 Effect of COV of earthquake load on the reliability of
footings for model building-1
73
Table 4.33 Effect of COV of earthquake load on the reliability of
footings for model building-2
74
Table 4.34 Effect of COV of earthquake load on the reliability of
footings for model building-3
75

1
Chapter 1
INTRODUCTION
1.1 BACKGROUND
Probability-based design of structure became practically realizable in the 1970's and
its conceptual framework was developed by Ang and Cornell (Ang and Cornell,
1974), influenced by Freudenthal's pioneering work on structural safety (A.M.
Freudenthal, 1947). Applications of reliability concepts in geotechnical engineering
have been reported by Ang and Tang (1975), Vanmarcke (1977a & b), Whitman
(1984), Li and Lumb (1987), Oka and Wu (1990), Mostyn and Li (1993), Tang
(1993), Christian et al. (1994) and Chowdhury and Xu (1995), Morgenstern (1997),
Phoon and Kulhawy (1999a & b), Duncan (2000), Lacasse (2001), Phoon et al.
(2003b), Christian (2004),etc. Engineers face uncertainties at all phases of a project.
Uncertainties in designing structures and its supporting foundations are invariable in
nature. Due to presence of uncertainties in different parameters accounting for the
analysis and design of any structure, it is very difficult to measure absolute safety for
any structure using deterministic analysis. Therefore, one of the most important ways
to specify a rational criterion for ensuring the safety of a structure is its reliability or
probability of failure. Uncertainties are always inherent in loads and resistance of
structure. Because of the presence of uncertainty in the effect of loading and in the
effect of resistance, the structural members as well as their foundation are certainly
uncertain. Consequently, structures and their supporting foundation should be
designed to serve their functions with a definite reliability or a definite probability of
failure. However, engineering community, building users and owner of building
always expects any building or non building structure and its supporting foundation to
be designed with a reasonable margin of safety. In practices, these expectations are
considered by following code requirements. Code requirements have enveloped to
include design criteria that taken into account some of the sources of uncertainty in
design. Such criteria are often referred to as reliability based design criteria. The
reliability of a structure is its ability to fulfill its design purpose for some specified
design lifetime (Nowak and Collins, 2000). Reliability is often understood to equal
the probability that a structure will not fail to perform its intended function. The term
failure of structure does not necessarily mean catastrophic failure but is used to

2
indicate that the structure does not perform as desired. In structural reliability
calculation, the probability of failure is taken as quantitative measure of structural
safety. Probability of failure is calculated by subtracting the reliability value from
unity. In this case probabilistic concepts are used in reliability analysis of any
structure. Using structural reliability theory, the level of reliability of the existing
structures which are designed following any specific standard or code can be
evaluated. Structural reliability concept can be applied to the design of new structure.
Structural reliability theory also can be applied for calibrating codes, developing
partial safety factors with an accepted level of reliability in engineering fields.
Presently, Norway, Canada, United State of America, United Kingdom follows the
reliability based design of structure, and other countries which are in the process of
modifying their standards (R. Ranganathan, 1999).
So far, it is generally believed that compared to super structures, foundations and
geotechnical structures have more uncertainty in the resistance side than the load side.
Consequently, many design codes in various parts of the world are now under revision
from the allowable or the working stress design format (ASD or WSD) to the Load
and Resistance Factor Design format (LRFD) based on reliability. A RC isolated
column footing may fail either due to punching shear, flexural shear, and flexural
moment, are termed as structural failure, or bearing capacity and excessive settlement
of foundation, are termed as geotechnical failure. If any one of the aforesaid failure
occurs, ultimately the foundation fails. A foundation failure leads the complete
collapse of the structure. The failure probability or the reliability of shallow isolated
column footing depends on any of the possible aforementioned failure modes.
Therefore, it is essential to determine the reliability or margin of safety and
corresponding failure probability of shallow foundation taking all the probabilities of
foundation failure into considerations.
Recent design codes are based on probabilistic model of loads and resistances. As for
instance, American Institute for Steel Construction (AISC) uses Load and Resistance
Factor Design (LRFD) for steel construction (AISC, 1986, 1994), Ontaio Highway
Bridge design code for bridges (OHBDC, 1979, 1983, 1991), American Association
of State Highway for Transportation Officials LRFD code (AASHTO, 1994, 1998),
Canadian Highway Bridge Design Code (1998), and many European codes (e.g.,

3
CEC, 1984). So far the reliability of structure designed following Bangladesh
National Building Code (BNBC), 2006 has not yet been evaluated. So, the principal
aim of this research to evaluate the reliability of Reinforced Concrete (RC) shallow
footings for lightly loaded industrial building designed following BNBC, 2006.
1.2 OBJECTIVES OF THE RESEARCH
The main objective is to evaluate the reliability and corresponding failure probability
of RC isolated shallow footings for lightly loaded industrial buildings designed
following BNBC, 2006.
The research has following specific objectives:
(i) To evaluate the reliability of RC shallow footings of industrial
buildings designed following BNBC, 2006.
(ii) To evaluate the effect of factor of safety on the reliability of shallow
footings under earthquake load.
1.3 METHODOLOGY
First of all three model buildings are selected. Then the model buildings are analyzed
and designed following the provision of Bangladesh National Building Code (BNBC),
2006. After that, foundations of all model buildings are designed as isolated RC
shallow footing following the recommendation specified in BNBC, 2006 for footing
design. The size of footing is determined using SPT data which is commonly used in
Bangladesh. Statistical parameters of design variables are selected from established
literature. Then the failure probabilities of footings are calculated using Monte Carlo
Simulation (MCS) method. However, the most common methods are based on the
limit state function of reliability analysis are namely, First Order Reliability Methods
(FORM), Second Order Reliability Method (SORM) and Simulation techniques.
FORM and SORM reliability methods have been developed to approximately
evaluate the probability of failure or probability volume in the failure region. In this
research Monte Carlo Simulation (MCS) is used to evaluate the reliability of isolated
RC shallow footings. The Monte Carlo simulation is very powerful and useful
technique for performing probabilistic analysis. The Monte Carlo method is based on
the generating of some values numerically without actually doing any physical testing
4
for given distribution functions. The procedure used for obtaining reliability and
corresponding failure probability of RC shallow footing is briefly discussed in
following section.
1.3.1 Basic Variables
The analysis and design parameters of building such as different types of loads and
strength properties of materials which related to resistance are the random variables
considered in this study. The variability concerning sectional dimensions such as the
height and width of a section, the depth of concrete cover and the amount of
reinforcement are ignored due to the less significant effects (Frangopol et al., 1996).
The variability of the fundamental random variables belongs to loads and three basic
materials: concrete, reinforcing steel and soil are used in this research. The dead load,
live load and earthquake loads are considered as random variable of load. For
concrete, compressive strength and modulus of elasticity are considered as the
fundamental random variables. The fundamental random variables related to
reinforcing steel are yield strength and modulus of elasticity. The bearing capacity of
soil based on SPT N-value is used as the fundamental random variable.
1.3.2 Limit State Function
The loads �� and resistance �� are treated as random variables. A random variable is a
parameter that can take different values which are not predictable. However, the
distribution of the frequency of occurrence of those random values can be
characterized using a distribution function (e.g., normal, lognormal, etc.) and
statistical parameters such as the mean and standard deviation. The probability of
failure �� is represented in the reliability analysis by the reliability index β. The
reliability index � represents the distance measured in standard deviations between
the mean safety margin and the failure limit is shown in Fig.1.1. The load and
resistance factors are set such that the probability of failure (i.e., failure occurs when �� − �� is less than zero) as determined from the reliability analysis. The performance
function or limit state function is expressed as g, where � = ��-��, when� < 0, the
foundation fails and when� ≥ 0, the foundation safe.

5
1.3.3 Monte Carlo Simulation
Monte Carlo is the most robust simulation method in which samples are generated
with respect to the probability density of each variable ( Massih et al., 2008). For each
sample, the response of the system is calculated. An unbiased estimator of the failure
probability is given by
�� = ��∑ �(��)���� … … … … … .. … … … … … … … … … … … … … .. …. (1.1)
Where, N = Number of sample. The coefficient of variation of the estimator is given
by
���(��) = �(����)��� ��… … … … … … … … … … … … … … … … … … … (1.2)
1.3.4 Reliability Analysis
In reliability theory the uncertainties in loads and resistance parameter to be
quantified and manipulated consistently in a manner that is free from self-
contradiction. A simple application of reliability theory is shown in Fig. 1.1 to define
some of the key terms used in Reliability Based Design (RBD). Uncertain design
quantities, such as the loads �� and resistance �� are treated as random variables,
while design risk is quantified by the probability of failure��. The basic reliability
problem is to evaluate �� from some pertinent statistics of load and resistance which
typically include the mean and the standard deviation, and possibly the probability
density function. A simple closed-form solution for�� is available if both �� and
resistance �� are normally distributed. For this condition, the safety margin (� = �� −��) also is normally distributed with the following mean and standard deviation: For
normally distributed R and the probability of failure ��and reliability index � are
given below: �� = �(� ≤ 0) = ф(−�) = 1 − ф(�) … … … … … … … … … … … … …. .(1.3)
� = !"�!#�$"%&$#%'… … … … … … … … … … … … … … … . … … … … … …(1.4)
Where, �( = )* = mean value of resistance
�( = )+ =mean value of Loads

6
Fig. 1.1: Reliability and probability of failure of structure
The reliability indices for most geotechnical components and systems lie between 1
and 5, corresponding to probabilities of failure ranging from about 0.16 to 3 × 10⁻⁷, as
shown in Fig. 1.2 and table 1.1 (US Army Corps of Engineers 1997).
Fig. 1.2: Relationship between reliability index β and probability of failure ��
Table1.1: The range of geotechnical reliability index (US Army Corps of Engineers
1997).
Reliability Index, β
Probability of failure �� = Φ(−�) Expected Performance level
1.0 0.16 Hazardous
1.5 0.07 Unsatisfactory 2.0 0.023 Poor
2.5 0.006 Below average
3.0 0.0001 Above average
4.0 0.00003 Good
5.0 0.0000003 High
7
1.4 SCOPE AND LIMITATION
Three model buildings are considered to evaluate the reliability of RC isolated
shallow footings. The coefficient of variation (COV) of loads such as dead load, live
load and earthquake load are considered in calculating reliability of footing. The COV
for earthquake load is used in this research which is in context of America. Due to
unavailability of variability of earthquake loads in respect of Bangladesh, the author
used uncertainty factor from established literature. Due to deficiency of wind data
(mean, standard deviation) for Bangladesh wind load is not considered in this
research. The statistical variation of materials such as variability of concrete and steel
is based on previous available literature which is not in context of Bangladesh. The
variability in bearing capacity of soil is also based on previous literature which is
published in different foreign journal.
1.5 CONTENTS OF THE STUDY
The principal aim of this research is to evaluate the reliability and corresponding
failure probability of isolated shallow footing designed following BNBC, 2006. In
order to maintain a systematic way and clarity in the presentation of this research, the
contents of the study is summarized as follows:
Chapter II deals with a brief description of model building. The typical plan of model
building and their geometry, cross sectional dimensions of structural elements of
model buildings are presented in this chapter. The Finite Element Modeling (FEM) of
model buildings and different loads on model buildings are also presented in this
chapter. The materials properties of RC structure and deterministic analysis of axial
force of columns of all model buildings are discussed in this chapter. Design of
shallow footings and bearing capacity of shallow footings are also discussed in this
section.
Chapter III deals with the loads and resistance model. Different probabilistic loads
models for instance dead load, live load and earthquake load are presented in this
chapter. The probabilistic models of yield strength of steel, ultimate strength of
concrete and bearing capacity based on SPT value of soil are presented as resistance
model in this chapter.
8
Chapter IV presents the analysis of reliability and corresponding failure probability of
footings. The chapter deals with the model uncertainty factors, basic variable and their
coefficient of variation (COV), Monte Carlo Simulation (MCS), performance function
or limit state function, reliability theory of footing, results and the effect of live load
to dead load ratio on the reliability of footings. The chapter also deals with the
relation between factor of safety and reliability index of shallow footings design
following BNBC, 2006. Effect of COV of live load on the reliability of footings
considering earthquake loads are also presented in this chapter.
Chapter V presents the conclusion of this research. The chapter also presents
recommendation for further study. Some specific conclusions based on objective of
this research are presented in this chapter.
9
Chapter 2
ANALYSIS OF MODEL BUILDING
2.1 INTRODUCTION
Structure that enclose a space and are used for various occupancies shall be called
building structure (BNBC, 2006). The chapter deals with information regarding the
model buildings. For simplicity of analysis model buildings are considered in this
study. However, lightly loaded manufacturing building (occupancy G) is considered
as model buildings. Three model buildings are analyzed considering gravity loads as
well as lateral loads following BNBC, 2006 and presented in the chapter. The analysis
of all model buildings are performed considering finite element models using ETABS
program.
2.2 MODEL BUILDINGS
The plan of beam column grids of the model buildings along with three dimensional
finite element model is presented in this section. The author considered model
buildings instead of real building to make the analysis simplicity. The model building
having 03 bays in x direction and 03 bays in y direction of six storey as shown in
Fig. 2.3 is considered as model building-1. The model building having 03 bays in x
direction and 03 bays in y direction of eight storey as shown in Fig. 2.5 is considered
as model building-2. The model building having 03 bays in x direction and 03 bays in
y direction of ten storey as shown in Fig. 2.7 is considered as model building-3. The
span length of each panel of three model buildings is considered as 6.0 m which is
commonly used in industrial building of Bangladesh. Typical floor height is fixed at
3.50 m for all model buildings. The location of model building is considered at Zone
II in context of Bangladesh. However, a lightly loaded manufacturing building is
considered as model building. According to BNBC, 2006, the building is classified as
occupancy G. The structural form of model building is an intermediate moment
resisting frame system considering RC floor panel supported by beam all sides. In this
case all corner columns are grouped in C1, all exterior columns are grouped in C2 and
all interior columns are grouped in C3. The column numbers and dimension of panel
are shown in Fig. 2.1.
10
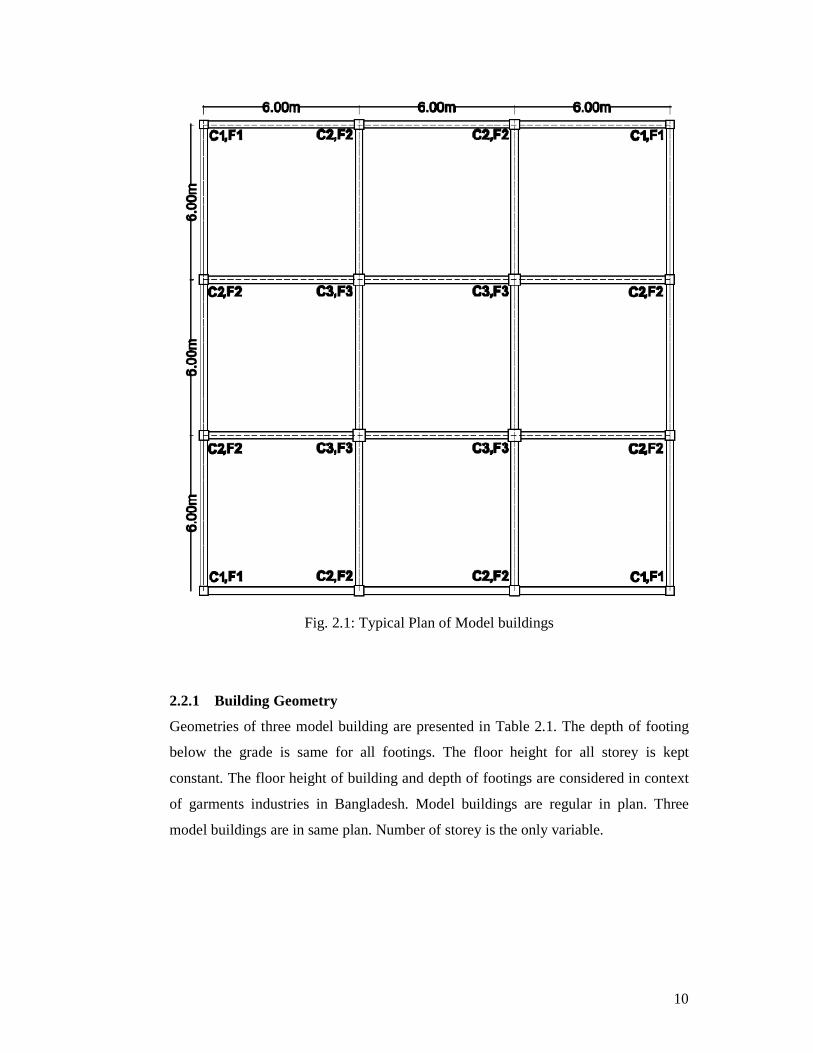
Fig. 2.1: Typical Plan of Model buildings
2.2.1 Building Geometry
Geometries of three model building are presented in Table 2.1. The depth of footing
below the grade is same for all footings. The floor height for all storey is kept
constant. The floor height of building and depth of footings are considered in context
of garments industries in Bangladesh. Model buildings are regular in plan. Three
model buildings are in same plan. Number of storey is the only variable.

11
Table 2.1: Building geometries of three model buildings
Building ID
No. of Span in x-Direction
No. of Span in y-Direction
Span Length in
both direction
Depth of Footing
Typical Storey Height
No. of Storey
(Nos.) (Nos.) (m) (m) (m) (Nos.) Model
building-1 3 3 6 2.44 3.5 6
Model building-2
3 3 6 2.44 3.5 8
Model building-3
3 3 6 2.44 3.5 10
2.2.2 Cross Sectional Dimension
The thickness of all floor slabs is determined considering serviceability criteria. The
thickness of floor slab also checked against flexural moment and flexural shear. The
entire cross sectional sizes of beam are calculated limiting the maximum deflection at
mid span and from flexural moment. The depth of beam also checked considering
flexural shear at critical section. The column dimensions are determined considering
the load combination specified in BNBC, 2006. The reduction of live load is used to
determine the cross sectional sizes of column. All columns are designed as RC tied
short column. The cross sectional dimension of all structural members of the model
building is presented in Table 2.2
Table 2.2: Cross sectional dimensions of structural members of the model building
Building ID thickness
of all
floor
Slabs
cross
section of
all floor
beams
cross
section of
all grade
beams
Cross section of Columns
C-1 C-2 C-3
(mm) (mm) (mm) (mm) (mm) (mm)
Model
building-1
150 300 x500 300 x500 375x375 450x450 500x500
Model
building-2
150 300 x500 300 x500 400x400 500x500 550x550
Model
building-3
150 300 x500 300 x500 500x500 550x550 600x600

2.3 FINITE ELEMENT MODEL
Prior to analysis, structural engineer needs to model the
is the process of creation of idealized and simplified representation of structural
behavior and it is an essential step in structural analysis and design. Errors and
inadequacies in modeling may cause serious design defects a
analysis. In this study, the buildings are modeled as finite element modeling using
ETABS nonlinear V9.6. The typical beam slab floor system is presented in Fig 2.2 for
all model buildings and the three dimensional finite element compute
presented in Fig 2.3 for model building
model building-3, respectively.
Fig.2.2 Typical beam column grid of all model buildings
FINITE ELEMENT MODELING
Prior to analysis, structural engineer needs to model the building. Structural modeling
is the process of creation of idealized and simplified representation of structural
behavior and it is an essential step in structural analysis and design. Errors and
inadequacies in modeling may cause serious design defects and difficulties in
analysis. In this study, the buildings are modeled as finite element modeling using
ETABS nonlinear V9.6. The typical beam slab floor system is presented in Fig 2.2 for
all model buildings and the three dimensional finite element compute
presented in Fig 2.3 for model building-1, Fig 2.4 for model building-2, Fig 2.5 for
3, respectively.
Fig.2.2 Typical beam column grid of all model buildings
building. Structural modeling
is the process of creation of idealized and simplified representation of structural
behavior and it is an essential step in structural analysis and design. Errors and
nd difficulties in
analysis. In this study, the buildings are modeled as finite element modeling using
ETABS nonlinear V9.6. The typical beam slab floor system is presented in Fig 2.2 for
all model buildings and the three dimensional finite element computer model is
2, Fig 2.5 for

Fig.2.3 Analytical 3D model of model building
Fig.2.4 Analyti
Fig.2.3 Analytical 3D model of model building-1
Fig.2.4 Analytical 3D model of model building-2

14
Fig. 2.5 Analytical 3D model of model building-3
2.3.1 Slab modeling
A proper modeling of the slab is very important for both linear and nonlinear analyses
of building structures. Reinforced concrete (RC) slabs are modeled utilizing different
finite elements like shell, membrane or plate elements. Shell type behavior of RC slab
means that both in-plane membrane stiffness and out-of-plane plate bending stiffness
are provided for the section. Membrane type behavior of RC slab means that only in-
plane membrane stiffness is provided for the section. Plate type behavior of RC slab
means that only out-of-plane plate bending stiffness is provided for the section. The
shell has six degrees of freedom at each node and an in-plane rotational degree of
freedom. Since the floor system is composed of two way slab panels, and a two way
slab is bent into dished shape, so, the shell element can be used efficiently for the
analysis of RC slabs. Therefore, in this study, all the RC floor slabs are modeled as

15
shell element. However, in case of one way slab and cantilever slab, one can use
membrane element to model the RC slab.
2.3.2 Beam modeling
The entire floor beams and all grade beams are modeled as line type beam element
considering shear deformation by using Integrated Building Design Software,
ETABS. All beams are continuous and producing Intermediate Moment Resisting
Frame (IMRF) by connecting columns.
2.3.3 Column modeling
All columns are modeled as line type column element and producing Intermediate
Moment Resisting Frame (IMRF) by connecting beams at different elevation.
2.3.4 Foundation Modeling
Base restraint conditions of column of any building structures can have significant
effect on the loads and behaviors of moment resisting frames. For purpose of
determining seismic loads, it is permitted to consider the structure to be fixed at the
base (ASCE7, 2005). Alternatively, where foundation flexibility is considered for the
linear analysis procedures, the linear load-deformation behavior of foundations shall
be represented by an equivalent linear stiffness using soil properties that are
compatible with the soil strain levels associated with the design earthquake motion
(ASCE7, 2005). Modeling of foundation using pinned restraints at the base of the
columns is shown in Fig. 2.6 (a), is typical for frames that do not extend through
floors below grade. This assumption results in the most flexible column base restraint.
Pinned restraints at the column bases will also simplify the design of the footing. One
drawback to the pinned base condition is that the drift of the frame, especially the
inter-story drift in the lowest story, is more difficult to control within code-allowable
limits. In addition, a pinned base may lead to development of soft or weak stories
(ASCE7, 2005). Fig. 2.6 illustrates four types of base restraint conditions that may be
considered in foundation modeling. If the drift of the structure exceeds acceptable
limits, then rotational restraint can be increased at the foundation by a variety of
methods, as illustrated in Fig. 2.6 (b), (c), and (d). Therefore, the foundation elements
must also be capable of delivering the forces to the supporting soil.

16
Fig. 2.6: Different type of base restraints
However, in this study the entire footings are modeled as fixed base to account the
seismic force in column and footing.
2.4 LOADS AND OTHER CONSIDERATIONS
To analyze and design the model building structure according to BNBC, 2006
occupancy G, the following loads are considered:
2.4.1 Dead load
Dead load is the gravitational load due to the self weight of structural and
nonstructural components of a building, e.g., Columns, beams, structural walls, floors,
ceilings, floor finishing, permanent partitions and fixed service equipment, etc.
Permanent dead loads are:
a) Self weight of structural members
b) Floor Finish = 1 kN/m2
c) Loads from permanent periphery wall (125mm thick wall) = 7.5 kN/m
d) Ceiling load = 250 N/m2
Unit weight of materials & the calculation of design dead load shall be according to
BNBC, 2006.
17
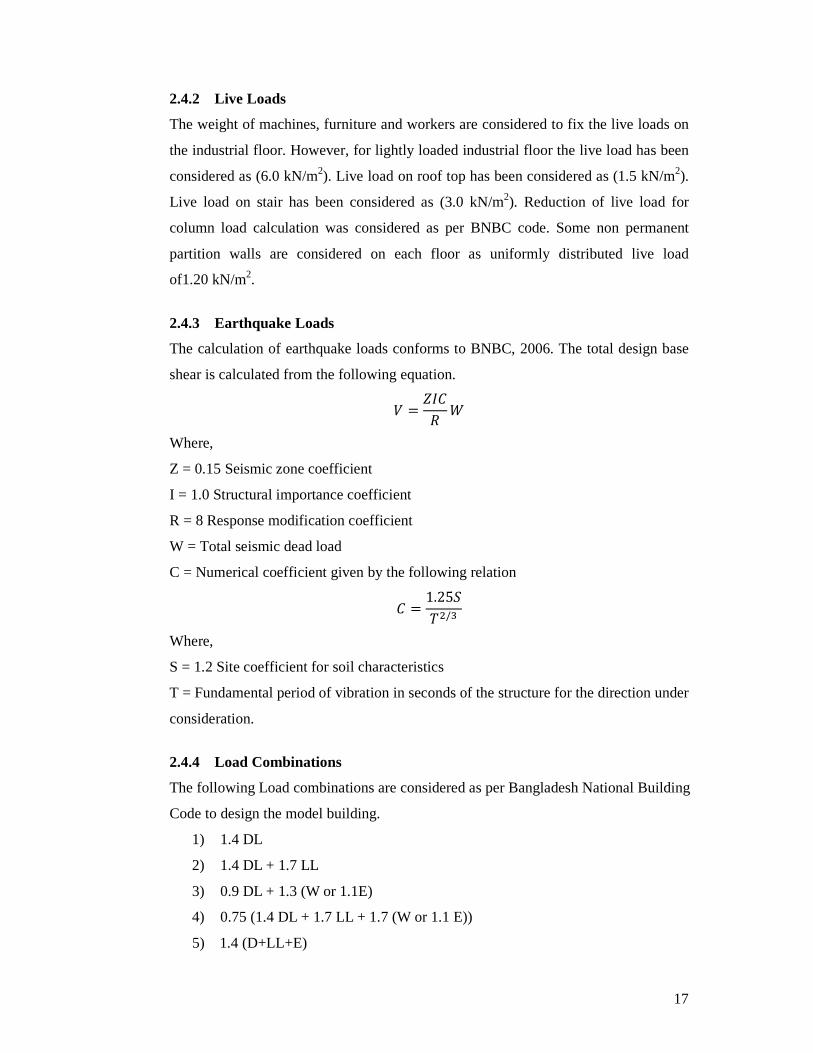
2.4.2 Live Loads
The weight of machines, furniture and workers are considered to fix the live loads on
the industrial floor. However, for lightly loaded industrial floor the live load has been
considered as (6.0 kN/m2). Live load on roof top has been considered as (1.5 kN/m2).
Live load on stair has been considered as (3.0 kN/m2). Reduction of live load for
column load calculation was considered as per BNBC code. Some non permanent
partition walls are considered on each floor as uniformly distributed live load
of1.20 kN/m2.
2.4.3 Earthquake Loads
The calculation of earthquake loads conforms to BNBC, 2006. The total design base
shear is calculated from the following equation.
� = -��� .
Where,
Z = 0.15 Seismic zone coefficient
I = 1.0 Structural importance coefficient
R = 8 Response modification coefficient
W = Total seismic dead load
C = Numerical coefficient given by the following relation
� = 1.25234/6
Where,
S = 1.2 Site coefficient for soil characteristics
T = Fundamental period of vibration in seconds of the structure for the direction under
consideration.
2.4.4 Load Combinations
The following Load combinations are considered as per Bangladesh National Building
Code to design the model building.
1) 1.4 DL
2) 1.4 DL + 1.7 LL
3) 0.9 DL + 1.3 (W or 1.1E)
4) 0.75 (1.4 DL + 1.7 LL + 1.7 (W or 1.1 E))
5) 1.4 (D+LL+E)

18
2.4.5 Materials properties
The material strength plays a vital role in design of building structure. And the
strength deformation characteristics of the building structures depend largely on the
stress strain characteristics of the materials. The material strengths are considered in
the design of the model building structures are as shown in the Table 2.3.
Table 2.3: The material strengths are considered in the design
Structural elements
For all Model buildings Unit weight of concrete
Concrete (Mpa) Reinforcing Steel (Mpa)
789 :8 7; :< kN/m3
Footing 24 23456 415 2x10⁵ 24
Column 24 23456 415 2x10⁵ 24
Beam 24 23456 415 2x10⁵ 24
Slab 24 23456 415 2x10⁵ 24
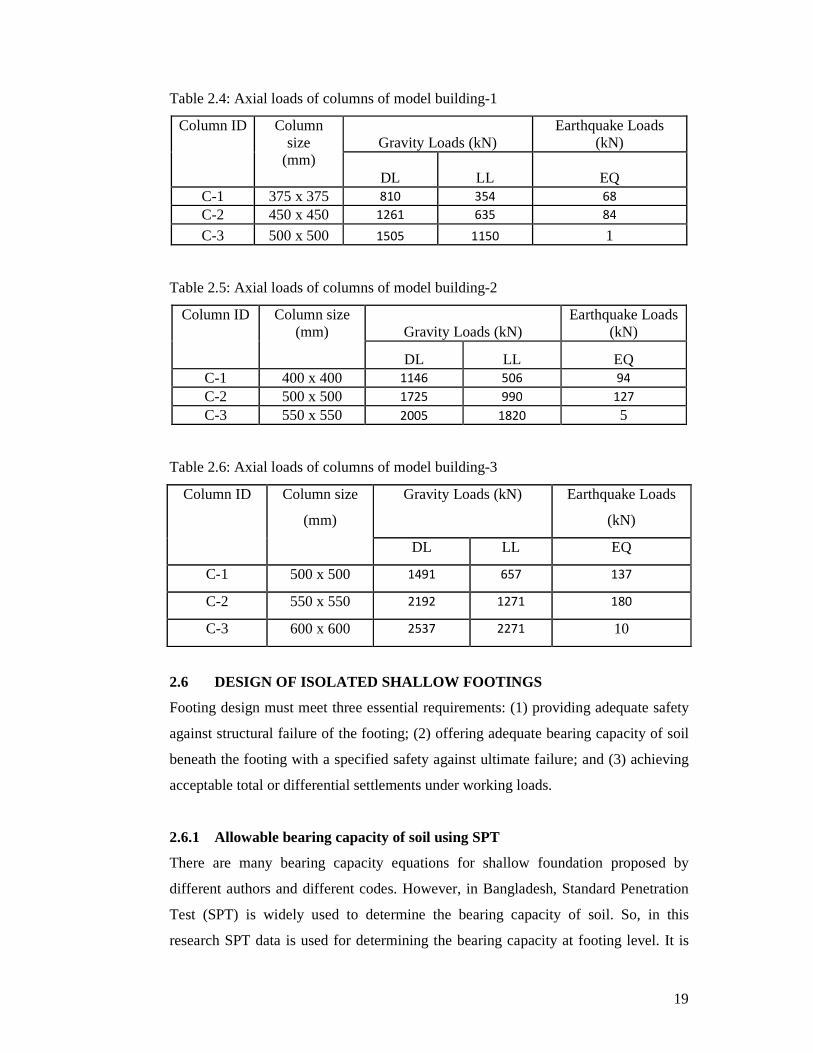
2.5 RESULTS OF DETERMINISTIC ANALYSIS
After the deterministic analysis of model building using Etabs V9.6 program, it is
seen that the building does not show any torsional irregularities. The slab of model
building is adequate considering serviceability and flexural moment. The entire floor
beam as well as grade beams is also adequate. The cross sectional dimensions of
columns under the group C1, C2 and C3 are sufficient using main steel ratio of 1.5%
to 2.0%. All structural elements of model building are safe and adequate. However,
the axial loads of different columns of different model buildings at footing level are
presented in table 2.4, table 2.5 and table 2.6, respectively.
19
Table 2.4: Axial loads of columns of model building-1
Column ID Column size
(mm) Gravity Loads (kN)
Earthquake Loads (kN)
DL LL EQ C-1 375 x 375 810 354 68
C-2 450 x 450 1261 635 84
C-3 500 x 500 1505 1150 1
Table 2.5: Axial loads of columns of model building-2
Column ID Column size (mm) Gravity Loads (kN)
Earthquake Loads (kN)
DL LL EQ C-1 400 x 400 1146 506 94
C-2 500 x 500 1725 990 127
C-3 550 x 550 2005 1820 5
Table 2.6: Axial loads of columns of model building-3
Column ID Column size
(mm)
Gravity Loads (kN) Earthquake Loads
(kN)
DL LL EQ
C-1 500 x 500 1491 657 137
C-2 550 x 550 2192 1271 180
C-3 600 x 600 2537 2271 10
2.6 DESIGN OF ISOLATED SHALLOW FOOTINGS
Footing design must meet three essential requirements: (1) providing adequate safety
against structural failure of the footing; (2) offering adequate bearing capacity of soil
beneath the footing with a specified safety against ultimate failure; and (3) achieving
acceptable total or differential settlements under working loads.
2.6.1 Allowable bearing capacity of soil using SPT
There are many bearing capacity equations for shallow foundation proposed by
different authors and different codes. However, in Bangladesh, Standard Penetration
Test (SPT) is widely used to determine the bearing capacity of soil. So, in this
research SPT data is used for determining the bearing capacity at footing level. It is
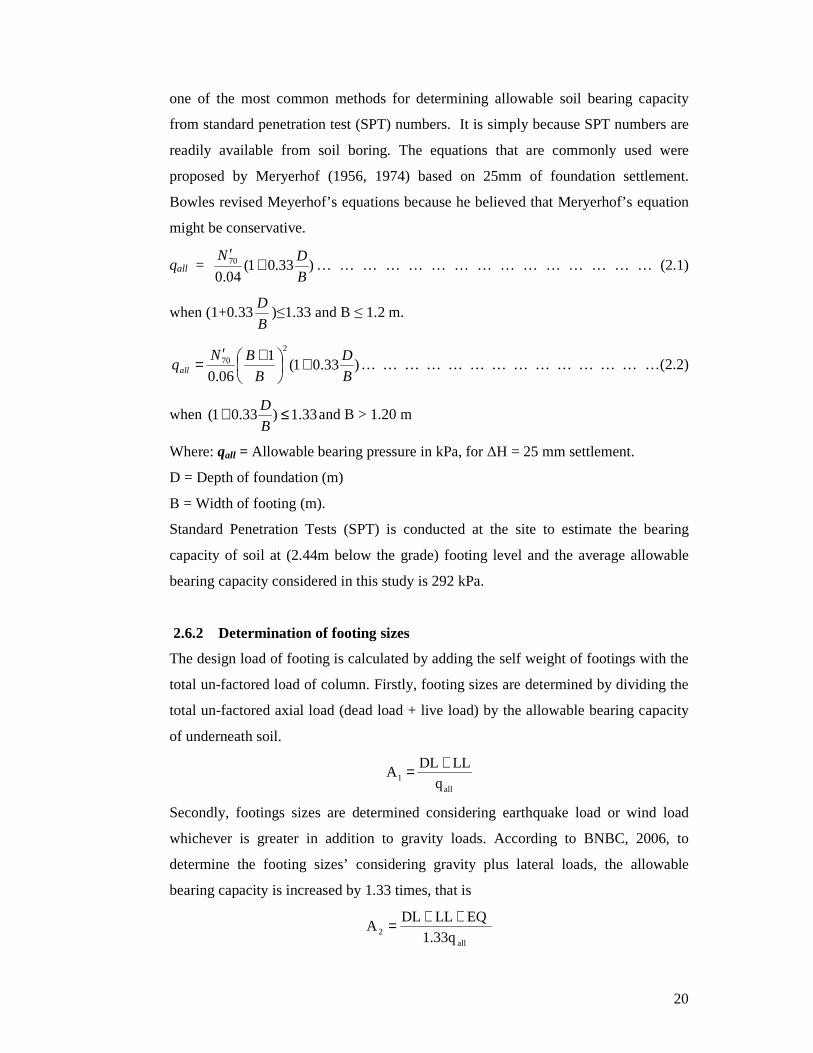
20
one of the most common methods for determining allowable soil bearing capacity
from standard penetration test (SPT) numbers. It is simply because SPT numbers are
readily available from soil boring. The equations that are commonly used were
proposed by Meryerhof (1956, 1974) based on 25mm of foundation settlement.
Bowles revised Meyerhof’s equations because he believed that Meryerhof’s equation
might be conservative.
qall = )33.01(04.070
B
DN+
′… … … … … … … … … … … … … … … (2.1)
when (1+0.33B
D)≤1.33 and B ≤ 1.2 m.
)33.01(1
06.0
2
70
B
D
B
BNqall +
+′= … … … … … … … … … … … … … …(2.2)
when 33.1)33.01( ≤+B
Dand B > 1.20 m
Where: qall = Allowable bearing pressure in kPa, for ∆H = 25 mm settlement.
D = Depth of foundation (m)
B = Width of footing (m).
Standard Penetration Tests (SPT) is conducted at the site to estimate the bearing
capacity of soil at (2.44m below the grade) footing level and the average allowable
bearing capacity considered in this study is 292 kPa.
2.6.2 Determination of footing sizes
The design load of footing is calculated by adding the self weight of footings with the
total un-factored load of column. Firstly, footing sizes are determined by dividing the
total un-factored axial load (dead load + live load) by the allowable bearing capacity
of underneath soil.
all1 q
LLDLA
+=
Secondly, footings sizes are determined considering earthquake load or wind load
whichever is greater in addition to gravity loads. According to BNBC, 2006, to
determine the footing sizes’ considering gravity plus lateral loads, the allowable
bearing capacity is increased by 1.33 times, that is
all2 1.33q
EQLLDLA
++=

21
Where, A= Area of Footing
DL+LL = Gravity loads
EQ or W = Lateral loads
qall = Allowable bearing capacity of soil
Hence, greater area is selected as footing area. Then for square footing, footing
dimension= = √?. Therefore a plan of square footing is presented in Fig 2.7
Fig.2.7: The plan of a concentric loaded square footing
2.6.3 Structural design of RC shallow footing
After the selection of plan dimensions (B and L) of a spread footing or width of square
footing, the footing is need to be designed for flexural moment , flexural shear and
punching shear which is called structural design. The pressure distribution beneath
footings is influenced by the interaction of the footing rigidity with the soil type,
stress–state, and time response to stress. However, it is common practice to use the
linear pressure distribution beneath rigid footings. The thickness of footing (t) for
spread footings is usually controlled by shear stresses. Two-way action shear always
controls the thickness for centrally loaded square footings. However, wide-beam shear
may control the depth for rectangular footings when the L/B ratio is greater than about
1.2 and may control for other L/B ratios when there is overturning or eccentric
loading. According to BNBC, 2006, the structural design of concentric loaded column
footing should have following essential steps:
i) Evaluate the net factored soil pressure.
Evaluate the net factored soil pressure by dividing the factored column loads by the
chosen footing area, or
@A� = �.BCD&�.EDDFGD − HI … … … … … … … … …. … … … … … … … … … .(2.3)
22
@A4 = J.EK(�.BCD&�.EDD&�.E(�.�L))FGD − HI … … … … … … … … …. … … … … …(2.4)
Where, @A�= net upward soil pressure due to gravity loads only. @A4= net upward soil pressure considering seismic loading
γ = unit weight of soil
D = depth of footing
ii) Check footing thickness for punching shear.
Since huge soil pressures are developed under the footing, high shear stresses are
produced and since shear reinforcement is not normally used in footing, shear rather
than moment commonly governed in determining the minimum required thickness of
footing. The thickness of the footing must be set so that the shear capacity of the
concrete equals or exceeds the critical shear forces produced by factored loads. The
critical section for punching shear is located at a distance M4 from the column faces and
usually takes the shape of the column. Footing thickness is adequate for resisting
punching shear once�A ≤ ∅�8. The critical punching shear force can be calculated
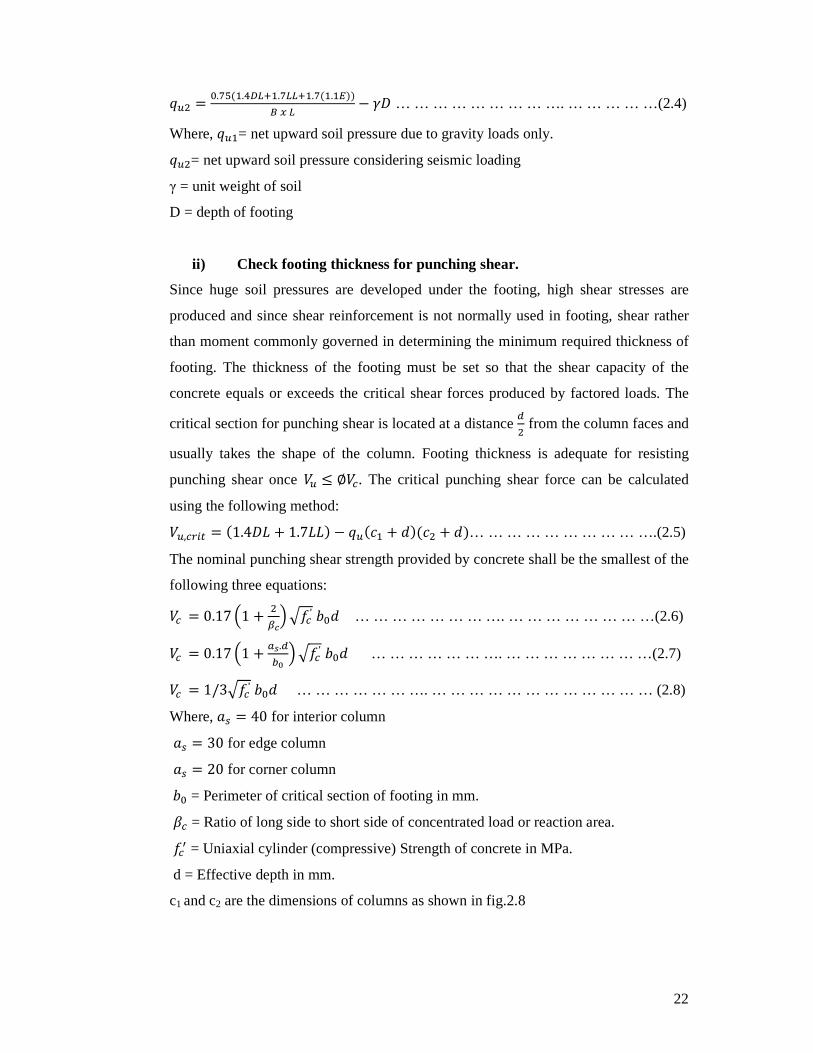
using the following method: �A,8P�Q = (1.4IS + 1.7SS) − @A(V� + W)(V4 + W)… … … … … … … … … ….(2.5)
The nominal punching shear strength provided by concrete shall be the smallest of the
following three equations:
�8 = 0.17 X1 + 4YZ[\78́ ^JW … … … … … … … …. … … … … … … … …(2.6)
�8 = 0.17 X1 + _`.Mab [\78́ ^JW … … … … … … …. … … … … … … … …(2.7)
�8 = 1/3\78́ ^JW … … … … … … …. … … … … … … … … … … … … (2.8)
Where, d< = 40 for interior column
d< = 30 for edge column
d< = 20 for corner column ^J = Perimeter of critical section of footing in mm.
�8 = Ratio of long side to short side of concentrated load or reaction area.
789 = Uniaxial cylinder (compressive) Strength of concrete in MPa.
d = Effective depth in mm.
c1 and c2 are the dimensions of columns as shown in fig.2.8

23
Fig. 2.8: Critical section for punching shear and beam shear of a square footing
iii) Check footing thickness for beam shear in each direction.
If �A ≤ ∅�8, thickness will be adequate for resisting beam shear without using shear
reinforcement. The critical section for beam shear is located at distance d from
column faces. Hence, the factored shear force is given by:
�A = @A= eXD�f4 [ − Wg… … …. … … … … … … … … … … … …… … … .. (2.9)
And, the nominal shearing force resisted by concrete is given as �8 = 0.17\789bd
iv) Compute the area of flexural reinforcement in each direction.
The critical section for bending is located at face of column, or wall, as specified by
BNBC, 2006. Figure 2.9 shows critical sections for flexure for footings supporting
concrete column.

24
Fig. 2.9: Critical sections for bending moment of footing
The bending moment at critical section for square footing is calculated by using the
following relation
hA,8P�Q = @A F4 XD�84 [4… …. … … … … … … … … … … … …… … … … (2.10)
Then the thickness of footing is checked against flexural moment. If the thickness is
adequate, the area of steel is calculated for both directions considering the critical
bending moment. The minimum amount of area of steel is calculated from the
following equation
?<,i�j = J.44B��Zk�l ^W ≥ �.6m�; … … … … … … … … … … … …… … … … …(2.11)
2.7 RESULTS
After the geotechnical design and the structural design of footings following BNBC,
2006, the following footing schedules are obtained for model buildings and presented
in Table 2.5, Table 2.6 and Table 2.7, respectively.
Table 2.7: Footing schedule of model building-1
Footing
ID
Footing Sizes Footing
Thickness
Depth of
Footing
Steel Reinforcement in both
Direction Width Length
(m) (m) (mm) (m)
F1 2.02 2.02 435 2.44 Φ16mm @ 165 mm c/c
F2 2.58 2.58 536 2.44 Φ16mm @ 127 mm c/c
F3 3.05 3.05 665 2.44 Φ16mm @ 100 mm c/c

25
Fig. 2.10: Footing detail of footing F1 of model building-1
Fig. 2.11: Footing detail of footing F2 of model building-1
Fig. 2.12: Footing detail of footing F3 of model building-1
The structural designs of the footings are shown in Fig. 2.10, Fig. 2.11 and Fig. 2.12.
for model building-1, Fig. 2.13, Fig. 2.14 and Fig. 2.15 for model building-2 and Fig.
2.16, Fig. 2.17 and Fig. 2.18 for model building-3.
16mm @165 mm c/c2.44m
2.02m x 2.02m
GL
435mm
16mm @127 mm c/c2.44m
2.58m x 2.58m
GL
536mm
16mm @100 mm c/c2.44m
3.05m x 3.05m
GL
665mm
26
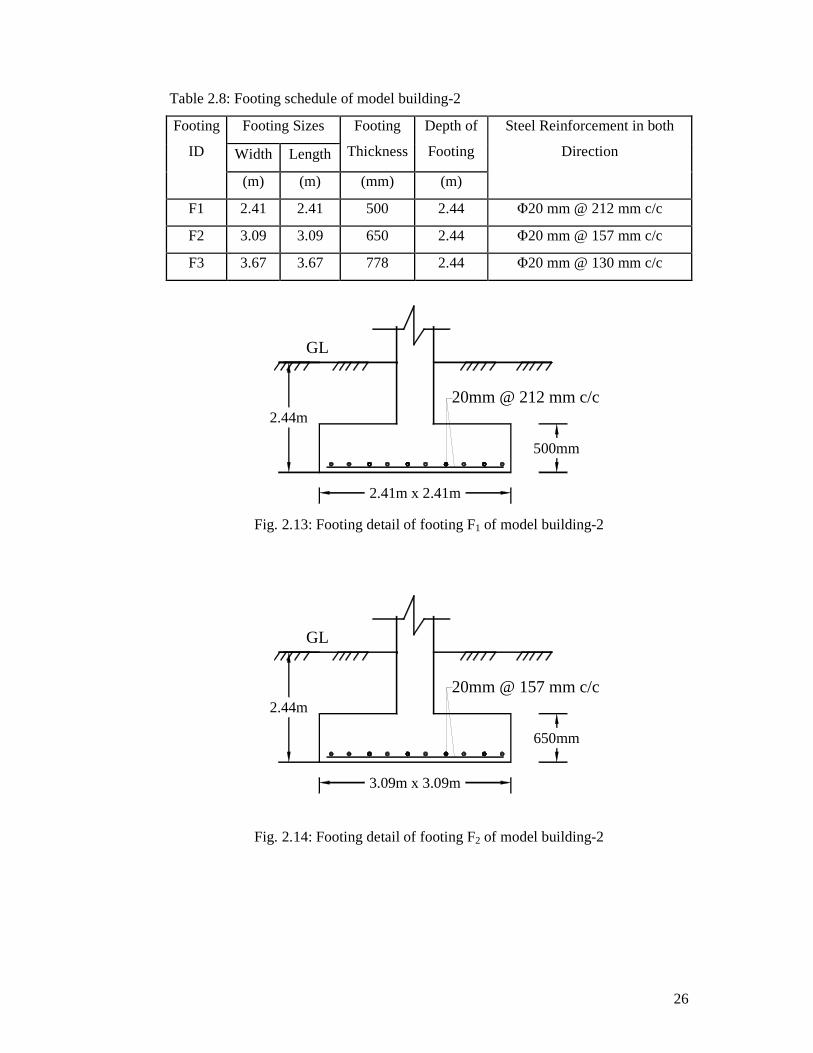
Table 2.8: Footing schedule of model building-2
Footing
ID
Footing Sizes Footing
Thickness
Depth of
Footing
Steel Reinforcement in both
Direction Width Length
(m) (m) (mm) (m)
F1 2.41 2.41 500 2.44 Φ20 mm @ 212 mm c/c
F2 3.09 3.09 650 2.44 Φ20 mm @ 157 mm c/c
F3 3.67 3.67 778 2.44 Φ20 mm @ 130 mm c/c
Fig. 2.13: Footing detail of footing F1 of model building-2
Fig. 2.14: Footing detail of footing F2 of model building-2
20mm @ 212 mm c/c2.44m
2.41m x 2.41m
GL
500mm
20mm @ 157 mm c/c2.44m
3.09m x 3.09m
GL
650mm

27
Fig. 2.15: Footing detail of footing F3 of model building-2
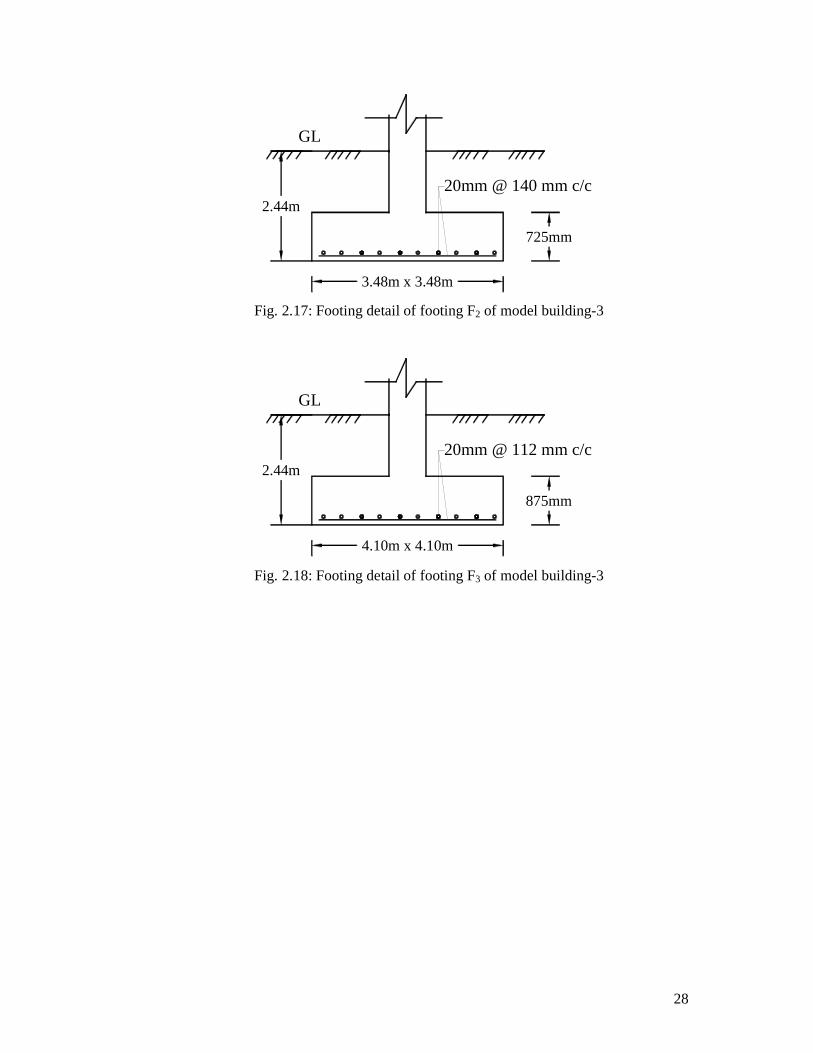
Table 2.9: Footing schedule of model building-3
Footing
ID
Footing Sizes Footing
Thickness
Depth of
Footing
Steel Reinforcement in both
Direction Width Length
(m) (m) (mm) (m)
F1 2.74 2.74 550 2.44 Φ20mm @ 190 mm c/c
F2 3.48 3.48 725 2.44 Φ16mm @ 140 mm c/c
F3 4.10 4.10 875 2.44 Φ20mm @ 112 mm c/c
Fig. 2.16: Footing detail of footing F1 of model building-3
20mm @ 130 mm c/c2.44m
3.67m x 3.67m
GL
778mm
20mm @ 190 mm c/c2.44m
2.74m x 2.74m
GL
550mm
28
Fig. 2.17: Footing detail of footing F2 of model building-3
Fig. 2.18: Footing detail of footing F3 of model building-3
20mm @ 140 mm c/c2.44m
3.48m x 3.48m
GL
725mm
20mm @ 112 mm c/c2.44m
4.10m x 4.10m
GL
875mm
29
Chapter 3
STATISTICS OF LOAD and RESISTANCE
3.1 INTRODUCTION
To analyze and design of any structure, designers must have understanding about the
magnitudes and type of the loads that are expected to act on the structure during its
life time. This chapter discusses different types of loads commonly considered in the
analysis and design of building structures in Bangladesh and some probabilistic
models of these loads that are used in reliability based design methods. The chapter
also deals with the probabilistic models of yield strength of steel, ultimate strength of
concrete and bearing capacity of soil based on SPT value.
3.2 GENERAL LOAD MODELS
The accurate evaluation of gravity loads and lateral loads for proper assessment of
maximum loads that a structure will have to carry during its lifetime are very
important for safe and economical design. Normally many types of loads act on
structure. These loads can be classified into three categories based on the types of
statistical data available and the characteristics of the load phenomenon (Nowak and
Collins, 2000):
Type I: - dead load and sustained live load
Type II: - severe wind, snow load, and transient live load
Type III: - earthquake and tornadoes.
Basically actual loading is the combination of concentrated loads, non-uniformly
distributed loads and uniformly distributed loads. On the other hand the loading is
simplified for analysis purpose into uniformly distributed. However, to proceed with a
reliability analysis we need at least mean and variance or standard deviation or
coefficient of variation for loads (Nowak and Collins, 2000).
3.2.1 Dead Load Model
The dead load considered in design is usually the gravity load due to the self weight
of structural and non structural elements permanently connected to the structure. Dead
loads are typically treated as normal random variables. Usually it is assumed that the
total dead load, DL remains constant throughout the life of structure (Nowak and
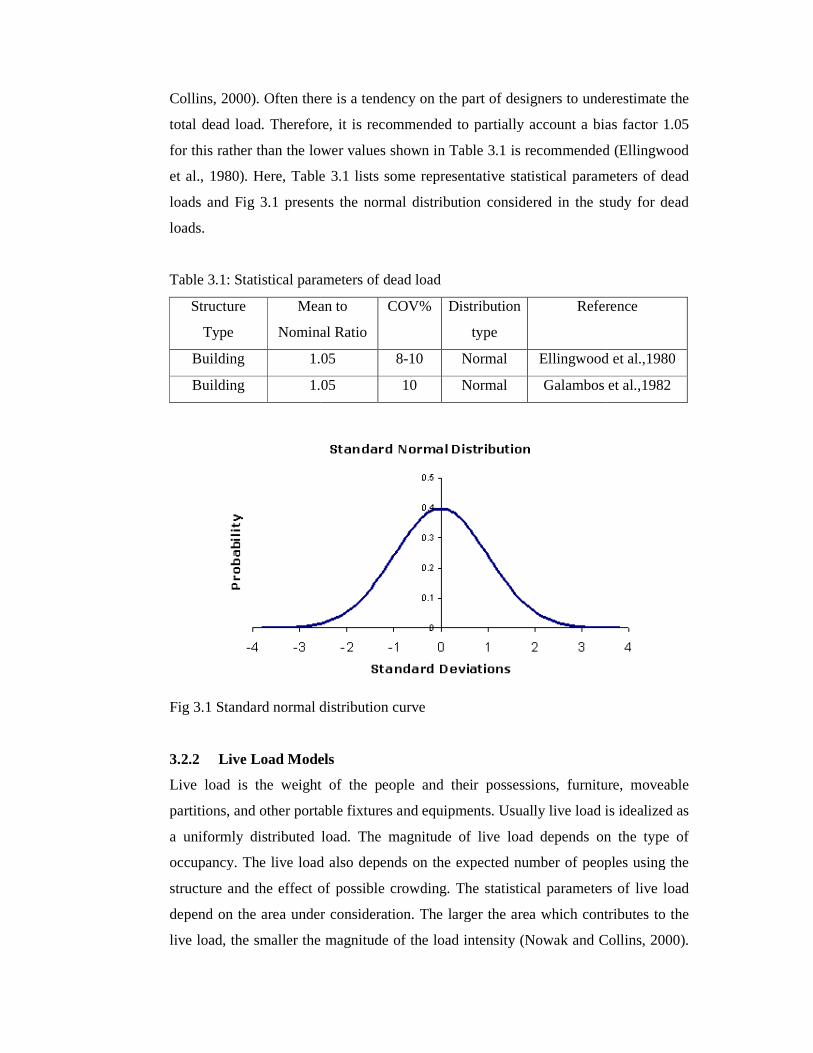
Collins, 2000). Often there is a tendency on the part of designers to underestimate the
total dead load. Therefore, it is rec
for this rather than the lower values shown in Table 3.1 is recommended (Ellingwood
et al., 1980). Here, Table 3.1 lists some representative statistical parameters of dead
loads and Fig 3.1 presents the norm
loads.
Table 3.1: Statistical parameters of dead load
Structure
Type
Mean to
Nominal Ratio
Building 1.05
Building 1.05
Fig 3.1 Standard normal distribution curve
3.2.2 Live Load Models
Live load is the weight of the people and their possessions, furniture, moveable
partitions, and other portable fixtures and equipments. Usually live load is idealized as
a uniformly distributed load. The magnitude of live load depends on the type of
occupancy. The live load also depends on the expected number of peoples using the
structure and the effect of possible crowding. The statistical parameters of live load
depend on the area under consideration. The larger the area which contributes to the
live load, the smaller the magnitude of the load intensity (Nowak and Collins, 2000).
Collins, 2000). Often there is a tendency on the part of designers to underestimate the
total dead load. Therefore, it is recommended to partially account a bias factor 1.05
for this rather than the lower values shown in Table 3.1 is recommended (Ellingwood
et al., 1980). Here, Table 3.1 lists some representative statistical parameters of dead
loads and Fig 3.1 presents the normal distribution considered in the study for dead
Table 3.1: Statistical parameters of dead load
Mean to
Nominal Ratio
COV% Distribution
type
Reference
1.05 8-10 Normal Ellingwood et al.,1980
1.05 10 Normal Galambos et al.,1982
Fig 3.1 Standard normal distribution curve
Live Load Models Live load is the weight of the people and their possessions, furniture, moveable
partitions, and other portable fixtures and equipments. Usually live load is idealized as
a uniformly distributed load. The magnitude of live load depends on the type of
ancy. The live load also depends on the expected number of peoples using the
structure and the effect of possible crowding. The statistical parameters of live load
depend on the area under consideration. The larger the area which contributes to the
ad, the smaller the magnitude of the load intensity (Nowak and Collins, 2000).
Collins, 2000). Often there is a tendency on the part of designers to underestimate the
ommended to partially account a bias factor 1.05
for this rather than the lower values shown in Table 3.1 is recommended (Ellingwood
et al., 1980). Here, Table 3.1 lists some representative statistical parameters of dead
al distribution considered in the study for dead
Reference
Ellingwood et al.,1980
Galambos et al.,1982
Live load is the weight of the people and their possessions, furniture, moveable
partitions, and other portable fixtures and equipments. Usually live load is idealized as
a uniformly distributed load. The magnitude of live load depends on the type of
ancy. The live load also depends on the expected number of peoples using the
structure and the effect of possible crowding. The statistical parameters of live load
depend on the area under consideration. The larger the area which contributes to the
ad, the smaller the magnitude of the load intensity (Nowak and Collins, 2000).
31
The reduction factors for live load intensity as a function of influence area (ASCE7-
95). From the statistical point of view, it is convenient to consider two types of live
load: sustained live load and transient live load. The sustained live load is the load
that can be expected to exist as a usual situation (nothing extraordinary). Transient
live load is the weight of people and their possessions that might exist during an
unusual case, such as an emergency, when everybody gathers in one room, or when
all furniture is stored in one room. Since the load is infrequent and its occurrence is
difficult to predict, it is called transient load. For design purpose, it is necessary to
consider the expected combination of sustained live load and transient live load that
may occur during the building’s design lifetime (50-100years). The combined
maximum live load can be modeled by as extreme type I distribution (Ellingwood, et
al 1980). Table 3.2 presents the coefficient of variation of maximum 50-years live
load.
Table 3.2 Coefficient of variation of maximum 50-year live load
Influence area (m2) Distribution type COV% Reference
18.60
93
465
930
Extreme Type-I
14-23
13-18
10-16
9-16
Ellingwood et al.,1980
The National Bureau of Standards (NBS) has published the results of the first
extensive load survey of office buildings in the U.S., wherein the data on unit floor
loads were presented for various conditions. The live load in office buildings fit a type
I extreme value distribution (Ellingwood et al., 1980). The mean of the 50 year
maximum value is given by-
:[S] = SJ[0.25 + �K√p] … … … … … … … … … … … … … … … … … … .. (3.1)
in which SJ= basic unreduced live load;
A = influence (rather than tributary) area expressed in square feet.
However, in order to evaluate the reliability of the Code-based design, E[L] is varied
by specifying a live-to-dead load ratio in order to cover a wide range of possible live
loads. In this manner, numerous design situations and corresponding reliability
analyses are performed. If this ratio is denoted byq, then the design live load intensity
L is given by-

32
S = q.rℎ<… … … … … … … … … … … … … … … … … … … … … … (3.2)
Where, (rℎ<) is the dead load per unit floor area. The design live load intensity of
Eq. (3.1) is also used as the expected value, E[L], for the reliability analysis. A
coefficient of variation (COV) of 25 percent is assigned to L (Ellingwood et al.) using
a type I extreme value distribution to describe the probabilistic nature of the
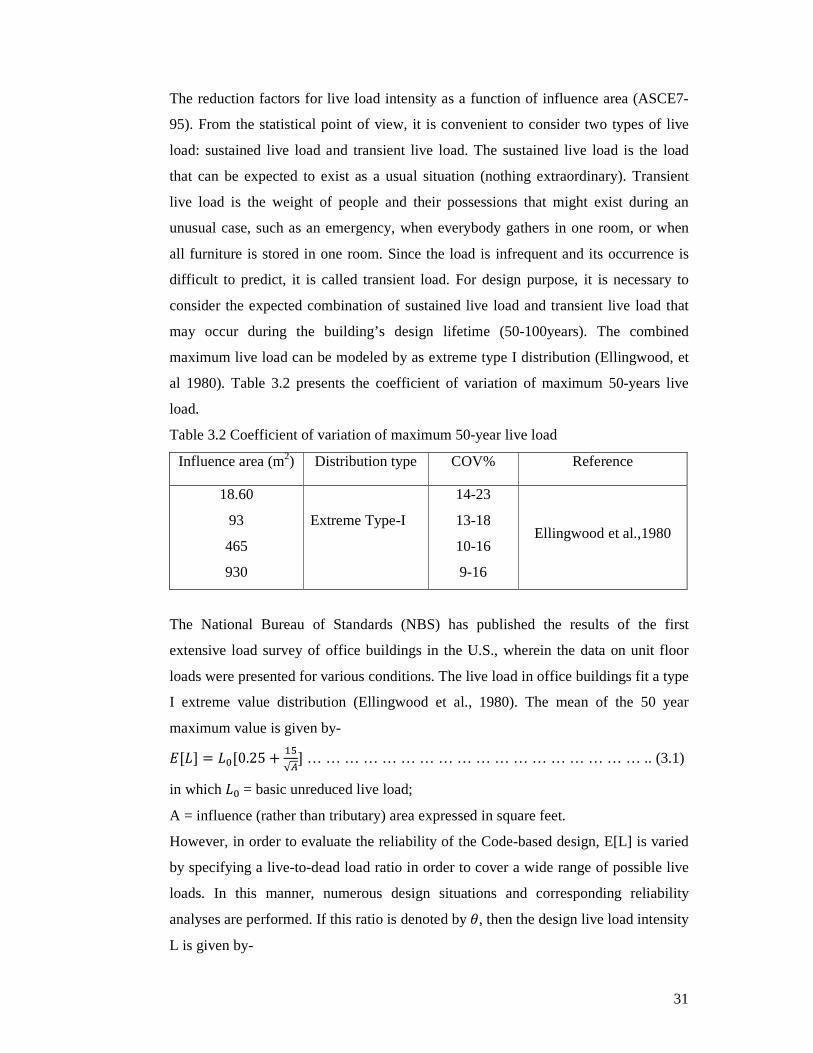
maximum live load. Fig. 3.2 presents the Extreme value type-I distribution.
Fig. 3.2 The Extreme value type-I distribution.
3.2.4 Earthquake Load Model Earthquake load is well presented by Extreme Type I distribution with mean-to-nominal
ratio of 1.0 and coefficient of variation of 138 percent (Ellingwood et al., 1980).
Table 3.3 Statistical parameters of maximum 50-year earthquake load
Load Type Distribution
type
Mean to
Nominal
Ratio
COV% Reference
Earthquake
load
extreme type I 1.0 1.38 Ellingwood et
al.,1980
Earthquake
load
extreme type I 0.3 0.7 Nowak,1994
3.3 MODEL OF RESISTANCE
Resistance of RC structural member depends on the ultimate strength of concrete,
yield strength of steel reinforcement, cross sectional dimension of the elements, unit
weight of concrete, modulus of elasticity of steel and concrete. These strength

33
parameters are variable in nature. The variability of the fundamental random variables
belonging to three basic materials: concrete, reinforcing steel and soil are used in this
research. In the case of concrete, compressive strength and modulus of elasticity are
considered as the random variables. In the case of reinforcing steel, yield strength and
modulus of elasticity are considered as the random variables. For soil SPT or N-value
is used as fundamental random variable.
3.3.1 Compressive Strength of Concrete
The mean and coefficient of variation of concrete in compressive and tensile strength
depends highly on the specified strength of the concrete that is 789 of the mix (Nowak
and Collins, 2000). The coefficients of variation, COV of the in situ compressive
strength for concrete grades 35 and 20 MPa are estimated to be 15% and 18%,
respectively (Mirza et al. 1979). The concrete strength follows a normal distribution
(Mirza et al. 1979). Ellingwood estimated the COV to be 20.7% under average control
of concrete. For the compressive strength of concrete, normal probability distribution
has been found best suitable by many investigators (Mirza, 1996; Mirza et al, 1979).
In this study, the Coefficient of Variation (COV) is selected as 0.18 (Ellingwood et al,
1980) for 24 MPa concrete. Table 3.5 represents the mean and coefficient of variation
of concrete proposed by different authors.
Table 3.4 Statistical parameters of concrete strength
Property Mean COV% Reference
f′c= 20 MPa
f′c= 27MPa
f′c= 35 MPa
For average control
19 MPa
23 MPa
28 MPa
---
18
18
15
20.7
Mirza et al., 1979 and Ellingwood et al.,
1980
Ellingwood et al., 1980
Mirza et al., 1979 and Ellingwood et al.,
1980
Ellingwood, 1978
3.3.2 Yield Strength of Reinforcing Steel
Different statistical distribution for the yield strength of reinforcing steel has been
proposed by different researchers: Low and Hao (2001) (normal); Galambos and
Ravindra (1978) (lognormal), and Mirza and McGregor (1979) (beta distribution).
34
However, the normal distribution is more appropriate for yield strength of
reinforcement at 95% confidence level (Arafah, 1997). Hence, the normal distribution
for yield strength of reinforcing steel is used in this study. Galambos and Ravindra
(1978) recommended COV for yield strength of steel equal to 8-12%. The mean and
coefficient of variation of yield strength for 60 grade steel are 465 MPa and 9.8%
(Mirza and MacGregor, 1979). Ito and Sumikama studied typical statistics of yield
strength of grade 60 steel from several countries; results indicated that λ for yield
strength is between 1.08 and 1.19 whereas the COV is between 4.8 and 10.6 percents.
Considering the progress of manufacturer’s control over quality with time, a lower
value of COV i.e., 9.8% is selected for this study. The probabilistic parameters of
yield strength of steel reinforcement are listed in Table 3.6.
Table 3.5 Statistical parameters of yield strength of steel
Yield
strength
Distribution Mean value COV% Reference
40 grade
60 grade
Normal
Beta distribution
312 MPa
465 MPa
11.6
9.8
Ellingwood et al., 1980
Mirza et al. (1979)
3.3.3 Bearing Capacity of Soil
In a research study on Reliability Based Design (RBD) for foundations, (Phoon et al.
1995) estimated that the COV of the inherent variability COV for N were between
25% and 50% and the probability distribution for N is assumed to be lognormal
because: (1) most soil properties can be modeled adequately as lognormal random
variables (Spry et al. 1988); Phoon and Kulhawy 1999) and (2) negative values of N
are inadmissible. The resistance factors reported by Foye et al. (2006b) for the design
of rectangular shallow foundations on sand deposit at the ultimate limit state varied
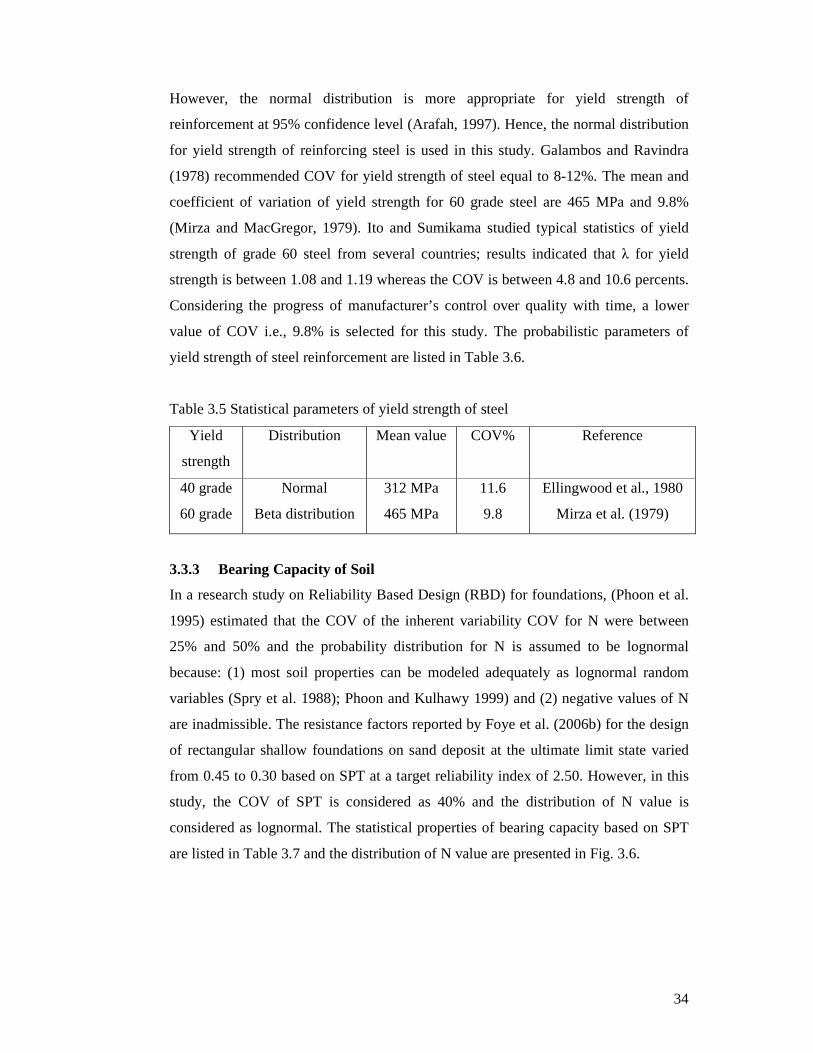
from 0.45 to 0.30 based on SPT at a target reliability index of 2.50. However, in this
study, the COV of SPT is considered as 40% and the distribution of N value is
considered as lognormal. The statistical properties of bearing capacity based on SPT
are listed in Table 3.7 and the distribution of N value are presented in Fig. 3.6.

35
Table 3.6: The statistical variation of SPT of soil
Soil Property Distribution Mean COV% Reference
SPT
(clay and
Sand)
Lognormal 10-70
blows/ft
(25-50)% Phoon and Kulhawy,
1999a
Fig. 3.3: Lognormal distribution for SPT values
RELIABILITY ANALYSIS
4.1 INTRODUCTION
Reliability of the footing is expressed
reliability index is related to the probability of failure of the footing (
reliability are complementary terms. Risk is unsatisfactory performance or probability
of failure. On the other hand, rel
of success. The chapter deals with the random variables considered in the study, limit
state function, calculation of probability of failures and evaluation of reliability of
shallow footings.
4.2 RELIABILITY ANALYSIS
The objective of the reliability analysis is to determine the probability of failure. The
probability of failure pf
yield a point in the failure domain, i.e.
… … … … … … …
Where, x = vector of basic variable; and G(x) limit state function defined such that the
region G(x)≤0 corresponds with the failure mode of interest. The corresponding
reliability index β can be calculated from
Where, �� inverse of the standard normal cumulative distribution function. In this
study, Monte Carlo simulations have been used to evaluate the reliability and
corresponding failure probability of footings.
index is shown in Fig. 4.1. Where, Q is the load effects and R is the effect of
resistance.
Chapter 4
RELIABILITY ANALYSIS OF FOOTINGS
INTRODUCTION
Reliability of the footing is expressed in the form of reliability index (
reliability index is related to the probability of failure of the footing (�reliability are complementary terms. Risk is unsatisfactory performance or probability
of failure. On the other hand, reliability is the satisfactory performance or probability
of success. The chapter deals with the random variables considered in the study, limit
state function, calculation of probability of failures and evaluation of reliability of
ELIABILITY ANALYSIS
The objective of the reliability analysis is to determine the probability of failure. The
is the probability that the realization of the basic variables
yield a point in the failure domain, i.e.
… … … … … … … … … … … … … … … … … … …
Where, x = vector of basic variable; and G(x) limit state function defined such that the
0 corresponds with the failure mode of interest. The corresponding
can be calculated from � = −Φ��t��u inverse of the standard normal cumulative distribution function. In this
study, Monte Carlo simulations have been used to evaluate the reliability and
corresponding failure probability of footings. The graphical presentation of reliability
x is shown in Fig. 4.1. Where, Q is the load effects and R is the effect of
in the form of reliability index (β). This ��). Risk and
reliability are complementary terms. Risk is unsatisfactory performance or probability
iability is the satisfactory performance or probability
of success. The chapter deals with the random variables considered in the study, limit
state function, calculation of probability of failures and evaluation of reliability of
The objective of the reliability analysis is to determine the probability of failure. The
is the probability that the realization of the basic variables
… … … … … … … … … … … … ... (4.1)
Where, x = vector of basic variable; and G(x) limit state function defined such that the
0 corresponds with the failure mode of interest. The corresponding
inverse of the standard normal cumulative distribution function. In this
study, Monte Carlo simulations have been used to evaluate the reliability and
The graphical presentation of reliability
x is shown in Fig. 4.1. Where, Q is the load effects and R is the effect of
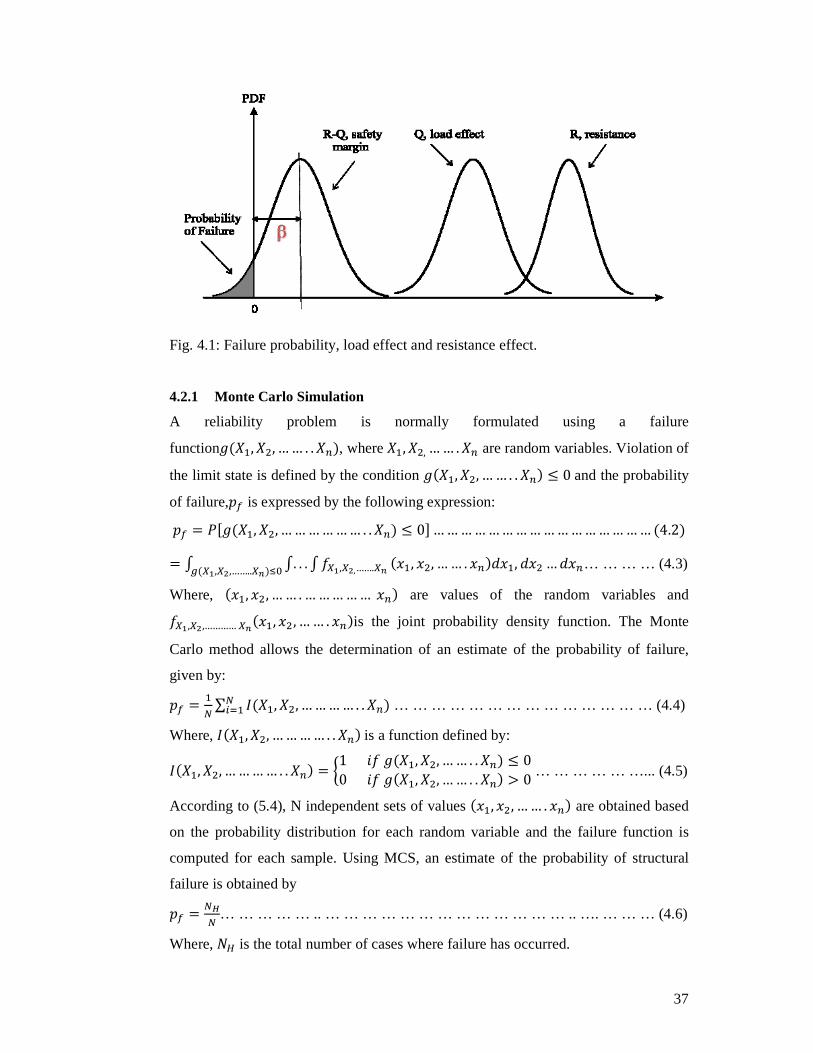
37
Fig. 4.1: Failure probability, load effect and resistance effect.
4.2.1 Monte Carlo Simulation
A reliability problem is normally formulated using a failure
function�(v�, v4, …… . . vj), where v�, v4,…… .vj are random variables. Violation of
the limit state is defined by the condition �(v�, v4, …… . . vj) ≤ 0and the probability
of failure,�� is expressed by the following expression:
�� = x[�(v�, v4, ……………… . . vj) ≤ 0]………………………………………… (4.2) = y y. . . y 7z{,z%,…….z| (��, �4, …… . �j)W��,}(z{,z%,……..z|)~J W�4…W�j… … … … (4.3)
Where, (��, �4, …… .…………… �j) are values of the random variables and 7z{,z%,…………z|(��, �4, …… . �j)is the joint probability density function. The Monte
Carlo method allows the determination of an estimate of the probability of failure,
given by:
�� = ��∑ �(v�, v4, ………… . . vj)���� … … … … … … … … … … … … … … (4.4)
Where, �(v�, v4, ………… . . vj)is a function defined by:
�(v�, v4, ………… . . vj) = �1�7�(v�, v4, …… . . vj) ≤ 00�7�(v�, v4, …… . . vj) > 0� … … … … … …... (4.5)
According to (5.4), N independent sets of values (��, �4, …… . �j) are obtained based
on the probability distribution for each random variable and the failure function is
computed for each sample. Using MCS, an estimate of the probability of structural
failure is obtained by
�� = ��� … … … … … .. … … … … … … … … … … … … … .. …. … … … (4.6)
Where, �� is the total number of cases where failure has occurred.

38
4.2.2 Random Variables
Dead load: Generally the total dead load, DL remains constant throughout the life of
structure (Nowak and Collins, 2000). In this study a coefficient of variation (COV) of
10 percent is assigned to dead load and distribution of dead load is considered as
normal distribution (Ellingwood, et al 1980).
Live load: The live load is considered as random variable in this study and that may
occur during the building’s design lifetime (50-100years). A coefficient of variation
(COV) of 25 percent is assigned to live load and distribution of live load is considered
as is Extreme type I distribution (Ellingwood, et al 1980).
Earthquake Load: The highly variable earthquake load is considered as random
variables in this research. A coefficient of variation (COV) of 138 percent is assigned
to earthquake load and distribution of live load is considered as is Extreme type I
distribution (Ellingwood, et al 1980).
Crushing strength of Concrete: The variability of concrete strength of cast in situ
normal weight concrete for loading rate similar to that of a cylinder test (1.68 MPa/s)
can be described by a normal distribution (Mirza et al.). The mean value of this
distribution is equal to 0.67578′ + 1100 ≤ 1.1578′ (psi) where, 78′ is the nominal
design strength. However, in this study the COV of 78′ is taken as 0.18 and
distribution for crushing strength of concrete is normal.
Yield strength of steel: The variability of static yield strength of reinforcing steel
based on nominal area of the bar cross section can be represent as beta distribution
(Mirza and MacGregor). The mean and coefficient of variation of yield strength for
60 grade steel are 465 MPa and 9.8% (Mirza and MacGregor, 1979). However in this
study only 60 grade steel is considered and corresponding mean and coefficient of
variation of yield strength is considered as 465 MPa and 9.8% respectively.
Bearing Capacity of Soil:
The COV of mixed soil is 0.41 (Reese et al.1974). The COV of sand is 0.41 with a
mean1.00 (Chen and Kulhawy, 1994). In a research study on Reliability Based Design
39
(RBD) for foundations, (Phoon et al. 1995) estimated that the COV of the inherent
variability COV for N were between 25 and 50% and the probability distribution for
N is assumed to be lognormal (Spry et al. 1988); (Phoon and Kulhawy 1999).
However, in this study, the COV of SPT is considered as 40% and the distribution of
N value is considered as lognormal
Structural model uncertainty factors. The structural model uncertainty is
characterized by the variability of the ratio B of the measured to predicted (or
nominal) resistance. Such an overall model factor can be incorporated in the
formulation of each limit state and treated as a random variable in the reliability
analysis. The normal distribution model is typically used to represent these modeling
factors whose mean and COV; depend on the limit-state considered.
Geotechnical Model uncertainty factors: A similar effort is underway to quantify
uncertainties associated with geotechnical calculation models. Although many
geotechnical calculation models are “simple”, reasonable predictions of fairly
complex soil-structure interaction behavior still can be achieved through empirical
calibrations. Because of our geotechnical heritage that is steeped in such empiricisms,
model uncertainties can be significant. Even a simple estimate of the average model
bias is crucial for reliability-based design. If the model is conservative, it is obvious
that the probabilities of failure calculated subsequently will be biased, because those
design situations that belong to the safe domain could be assigned incorrectly to the
failure domain, as a result of the built-in conservatism. Phoon and Kulhawy (2003)
presents a critical evaluation of model factors using an extensive database collected as
part of an EPRI (Electric Power Research Institute) research program on transmission
line structure foundations (Chen and Kulhawy, 1994). The basic random variables
considered in this study to evaluate the reliability are listed in table 4.1

40
Table 4.1: Basic variables for reliability evaluation of footings
Sl Xi Description Distribution Mean COV References
01 fy Yield strength of
steel
Normal Nominal 0.098 (Mirza et.al.
1979).
02 fcʹ Cylinder strength
of concrete
Normal Nominala 0.18 (Mirza et.al.,
1979).
03 \78′ concrete splitting
strength
Normal Nominal 0.18 (Mirza et.al.,
1979).
04 DL Dead Load Normal 1.05 0.1 (Ellingwood,
et al., 1980).
05 LL Live Load Extreme
Type I
Nominab 0.25 (Ellingwood,
et al., 1980).
06 EQ Earthquake Load Extreme
Type I
Nominal 1.38 (Ellingwood,
et al., 1980).
07 γ Unit weight of
soil
Normal Nominal 0.10 (Lee et
al.,1983)
08 Bf Flexural model
uncertainty
Normal 1.1 0.12 (MacGregor
et al., 1983)
09 Bv Shear model
uncertainty (ACI)
Normal 1.2 0.112 (R. Lu. et al.,
1994).
10 qu Soil capacity
based on N value
Lognormal 1.0 0.25-
0.50
Phoon and
Kulhawy
1999a.
11 Bv Punching shear
model uncertainty
for seismic loads
Normal 1.00 0.12 Luo et
al.,1995
12 Bv Punching shear
model uncertainty
for gravity loads
Normal 1.65 0.27 Luo et
al.,1995
Nominala = 0.67578′ + 1100 ≤ 1.1578′ in psi
Nominalb=:[S] = SJ[0.25 + �K√p] in which SJ= basic unreduced live load; A = influence (rather than
tributary) area expressed in square feet.

41
All variables are assumed to be mutually statistically independent. The nominal mean
values are obtained from the deterministic analysis of model building.
4.2.3 Geotechnical versus structural variability
The differences between geotechnical and structural variability’s have a significant
impact on the development of reliability-based design procedures for geotechnical
engineering. The uncertainties in structural resistances typically fall within a narrow
range of 10–25% for a wide range of materials (e.g., concrete, steel) and resistance
models (e.g., tension, flexure, shear). Note that the uncertainties in structural material
properties are even lower because the uncertainties in structural resistances also
include uncertainties arising from fabrication and modeling errors. The uncertainties
in structural loads generally depend on the source of the loadings (e.g., dead, live,
earthquake, wind). Typical COVs can be assigned to each of loading type. The COVs
are approximately 30%, with the exception of the nearly deterministic dead loads
(COV = 10%) and the highly variable earthquake loads (COV = 138%). The
uncertainty in a design soil property is a function of inherent soil variability,
measurement error, and transformation uncertainty. (Phoon et al. 1995). However, in
this research study the COV of the inherent variability COV for N value were
considered between 25% and 50%. As noted above, most of the COVs in structural
design are fairly small but the COVs in geotechnical design are large.
4.2.4 Limit State Function
The loads �� and resistance �� are treated as random variables. A random variable is a
parameter that can take different values that are not predictable. However, the
distribution of the frequency of occurrence of those random values can be
characterized using a distribution function (e.g., normal, lognormal, etc.) and
statistical parameters such as the mean and standard deviation. The probability of
failure, Pf, is represented in the reliability analysis by the reliability index β. The
reliability index β represents the distance measured in standard deviations between the
mean safety margin and the failure limit. The load and resistance factors are set such
that the probability of failure (i.e., failure occurs when R-Q is less than zero) as
determined from the reliability analysis, is acceptably small.
42
The limit-state functions ��(X) for the various failure modes are formulated as ��(v) = ��(v) − ��(�) where �� and �� denote the modal capacities and demands,
respectively, and are given below:
Bearing Capacity:
The performance function or limit state of interest for bearing capacity of soil can be
defined as following equation
� = (@A − H�) − �FGD… … … … … … … … … … … … … … … … … … …(4.7)
Where, (@A − H�) is the net ultimate bearing capacity of soil.
�FGD is the upward soil pressure below the base.
If g < 0, the footing fails. When, g ≥ 0 the footing is safe.
The equations that are commonly used to evaluate the allowable bearing capacity of
soil proposed by Meryerhof (1956, 1974) based on 25mm of foundation settlement.
Bowles revised Meyerhof’s equations because he believed that Meryerhof’s equation
might be conservative.
qall = )33.01(1
06.0
2
70
B
D
B
BN+
+′… … … … … … … … … … … … … …(4.8)
when (1+0.33B
D) ≤1.33 and B > 1.20 m
Where: qall = Allowable bearing pressure in kPa, for ∆H = 25 mm settlement.
D = Depth of foundation (m),
B = Width of footing (m).
According to BNBC, 2006, the factor of safety for shallow foundation is 2.50. Hence
the ultimate bearing capacity of soil is obtained, @A = @_���2.50.
Mean of resistance is taken as the mean of net ultimate bearing pressure, which is
obtained from SPT value, and COV of resistance is the same as COV of net ultimate
bearing pressure obtained from SPT value. Applied pressure of the footing Q is
assumed as a deterministic parameter, which is obtained by applying an appropriate
factor of safety.
43
Bending Moment:
Flexural design of a footing slab is just like a design of beam or one way slab. When a
reinforced concrete isolated column footing slab is loaded up to failure, three distinct
flexural failure modes are possible. The particular failure mode that occurs is dictated
by the percentage of reinforcement steel located in the tension zone. If the one way
slab is lightly reinforced, the slab will fail due to sudden yielding of the steel which
cannot carry the stress redistribution caused by the cracking of concrete; such a failure
is of the brittle type, characterized by a rapid crack development. If the slab is over
reinforced, the slab will fail by crushing of the concrete, also in a brittle fashion. The
following two limit-state functions define analytically the conditions of light and
heavy reinforcement:
�� = ?< − �.6m�l ^W… … … … … … … … … … … … … … … … … … … … .(4.9)
�4 = ?< − J.mKY{�Z′�l �JJ�JJ&�l ^W… … … … … … … … … … … … … … … … ...(4.10)
The condition g1 < 0 corresponds to a lightly reinforced member, whereas the
condition g2 > 0 indicates an over-reinforced member, since in the latter case the
tension reinforcement area As is larger than the balanced one. The beam is moderately
reinforced otherwise, namely when the condition {(g1>0) ∩ (g2<0)} holds. The
conditional probabilities of flexural failure given that the beam is lightly, moderately,
or over-reinforced are determined respectively by using the following limit-state
functions:
�6 = =� X1.25^ℎ4\78′[ − h… … … … … … … … … … … … … … … … .(4.11)
�B = =�?<7; XW − p`�l�.E�Z′a[ −h… … … … … … … … … … … … … … … …(4.12)
�K = =� X�6^W478′[ − h… … … … … … … … … … … … … … … … … … (4.13)
Where, M is the external bending moment produced by the upward soil pressure
beneath the footing. The model factors for g3, g4, and g5 should be treated as having
different means and COV. However, due to the scarcity of experimental data for
lightly and over-reinforced beams, the distribution parameters for the moderately
reinforced case have been adopted uniformly for the three cases. This approximation
is further justified by the negligible contribution of g3 and g5 to the failure probability.
Based on the results of the statistical studies reported by (MacGregor et al., 1983) on
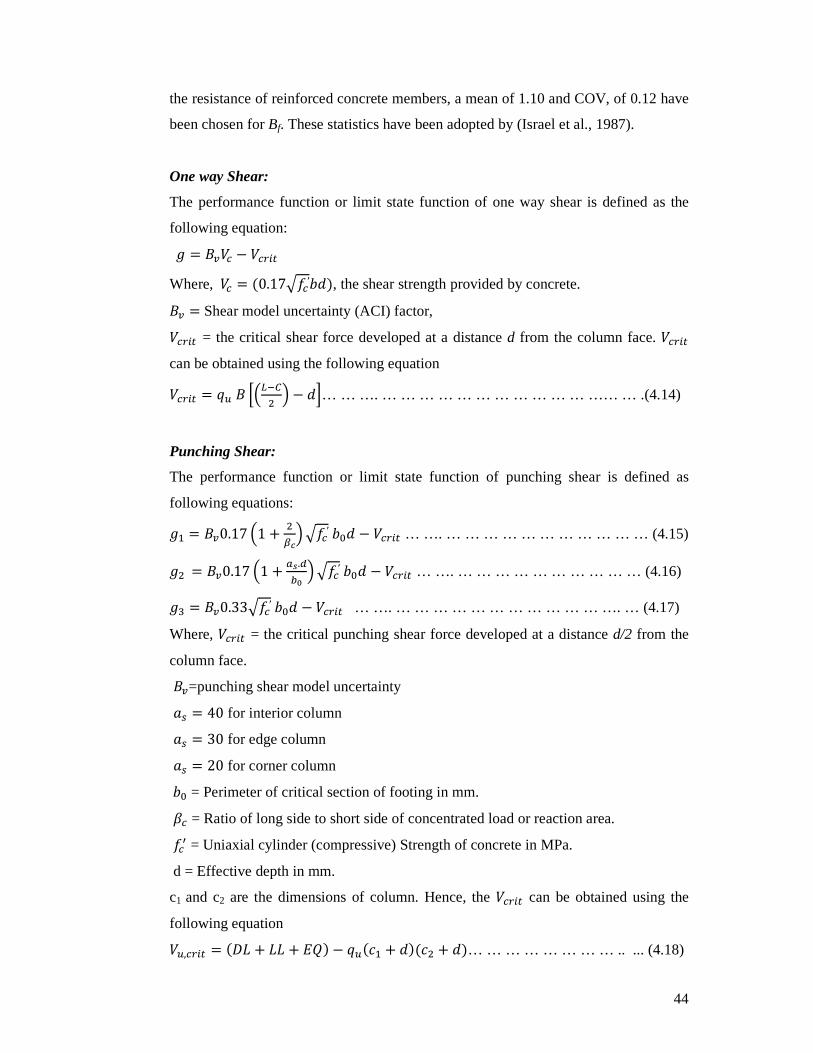
44
the resistance of reinforced concrete members, a mean of 1.10 and COV, of 0.12 have
been chosen for Bf. These statistics have been adopted by (Israel et al., 1987).
One way Shear:
The performance function or limit state function of one way shear is defined as the
following equation: � = =��8 − �8P�Q Where, �8 = (0.17\78′^W), the shear strength provided by concrete. =� = Shear model uncertainty (ACI) factor, �8P�Q = the critical shear force developed at a distance d from the column face. �8P�Q can be obtained using the following equation
�8P�Q = @A= eXD�f4 [ − Wg… … …. … … … … … … … … … … … …… … .(4.14)
Punching Shear:
The performance function or limit state function of punching shear is defined as
following equations:
�� = =�0.17 X1 + 4YZ[\78ʹ^JW − �8P�Q … …. … … … … … … … … … … … (4.15)
�4 = =�0.17 X1 + _`.Mab [\78ʹ^JW − �8P�Q … …. … … … … … … … … … … (4.16)
�6 = =�0.33\78ʹ^JW − �8P�Q … …. … … … … … … … … … … … …. … (4.17)
Where, �8P�Q = the critical punching shear force developed at a distance d/2 from the
column face.
=�=punching shear model uncertainty
d< = 40 for interior column
d< = 30 for edge column
d< = 20 for corner column ^J = Perimeter of critical section of footing in mm.
�8 = Ratio of long side to short side of concentrated load or reaction area.
789 = Uniaxial cylinder (compressive) Strength of concrete in MPa.
d = Effective depth in mm.
c1 and c2 are the dimensions of column. Hence, the �8P�Q can be obtained using the
following equation �A,8P�Q = (IS + SS + :�) − @A(V� + W)(V4 + W)… … … … … … … … .. ... (4.18)
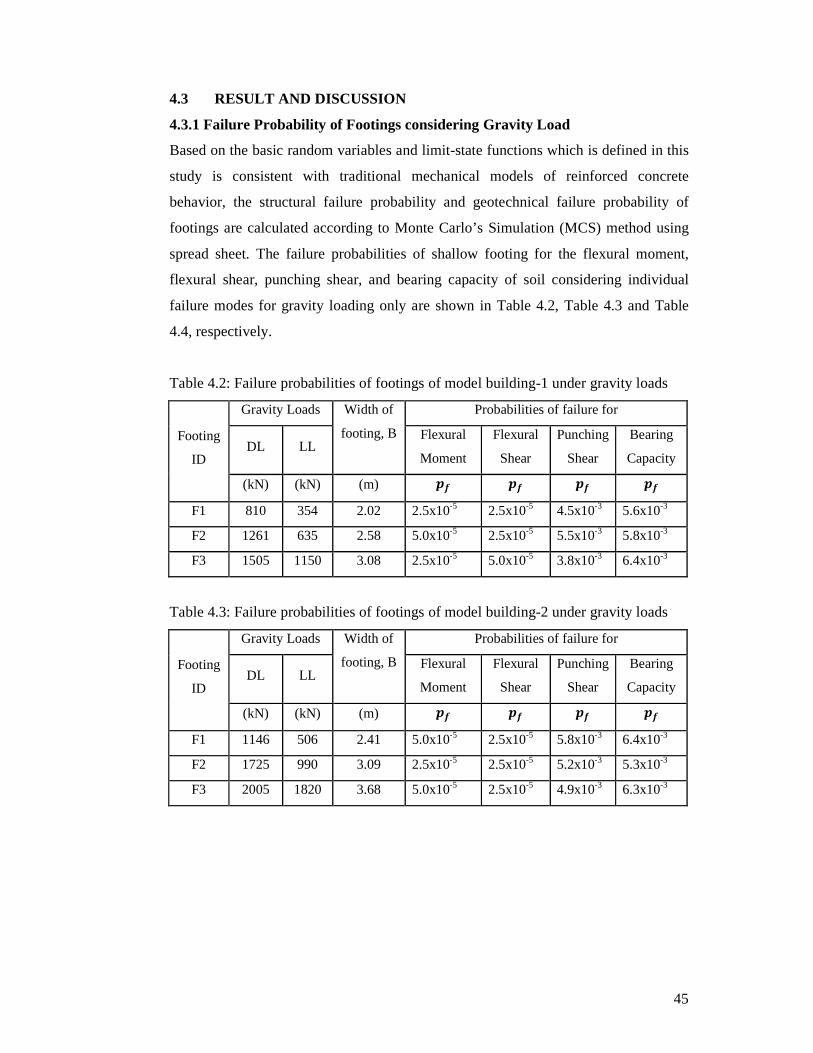
45
4.3 RESULT AND DISCUSSION
4.3.1 Failure Probability of Footings considering Gravity Load
Based on the basic random variables and limit-state functions which is defined in this
study is consistent with traditional mechanical models of reinforced concrete
behavior, the structural failure probability and geotechnical failure probability of
footings are calculated according to Monte Carlo’s Simulation (MCS) method using
spread sheet. The failure probabilities of shallow footing for the flexural moment,
flexural shear, punching shear, and bearing capacity of soil considering individual
failure modes for gravity loading only are shown in Table 4.2, Table 4.3 and Table
4.4, respectively.
Table 4.2: Failure probabilities of footings of model building-1 under gravity loads
Footing
ID
Gravity Loads Width of
footing, B
Probabilities of failure for
DL LL Flexural
Moment
Flexural
Shear
Punching
Shear
Bearing
Capacity
(kN) (kN) (m) �� �� �� ��
F1 810 354 2.02 2.5x10⁻⁵ 2.5x10⁻⁵ 4.5x10⁻³ 5.6x10⁻³
F2 1261 635 2.58 5.0x10⁻⁵ 2.5x10⁻⁵ 5.5x10⁻³ 5.8x10⁻³
F3 1505 1150 3.08 2.5x10⁻⁵ 5.0x10⁻⁵ 3.8x10⁻³ 6.4x10⁻³
Table 4.3: Failure probabilities of footings of model building-2 under gravity loads
Footing
ID
Gravity Loads Width of
footing, B
Probabilities of failure for
DL LL Flexural
Moment
Flexural
Shear
Punching
Shear
Bearing
Capacity
(kN) (kN) (m) �� �� �� ��
F1 1146 506 2.41 5.0x10⁻⁵ 2.5x10⁻⁵ 5.8x10⁻³ 6.4x10⁻³
F2 1725 990 3.09 2.5x10⁻⁵ 2.5x10⁻⁵ 5.2x10⁻³ 5.3x10⁻³
F3 2005 1820 3.68 5.0x10⁻⁵ 2.5x10⁻⁵ 4.9x10⁻³ 6.3x10⁻³

46
Table 4.4: Failure probabilities of footings of model building-3 under gravity loads
Footing
ID
Gravity Loads Width of
footing, B
Probabilities of failure for
DL LL Flexural
Moment
Flexural
Shear
Punching
Shear
Bearing
Capacity
(kN) (kN) (m) �� �� �� ��
F1 1491 657 2.74 5.0x10⁻⁵ 2.5x10⁻⁵ 5.5x10⁻³ 6.2x10⁻³
F2 2192 1271 3.48 5.0x10⁻⁵ 2.5x10⁻⁵ 5.1x10⁻³ 6.0x10⁻³
F3 2537 2271 4.10 2.5x10⁻⁵ 2.5x10⁻⁵ 5.1x10⁻³ 6.9x10⁻³
Fig. 4.2 Live load to dead load ratio on the failure probabilities of footings under
gravity loads only
Fig. 4.3 Live load to dead load ratio on the failure probabilities of footings under
gravity loads only
0.0E+00
1.0E-05
2.0E-05
3.0E-05
4.0E-05
5.0E-05
6.0E-05
7.0E-05
0.30 0.40 0.50 0.60 0.70 0.80 0.90 1.00
Pro
babi
litie
s of
failu
re
LL to DL ratio
Effect of LL to DL ratio on the failure probability of footing under gravity loads
Flexural failure
One way shear failure
0.0E+001.0E-032.0E-033.0E-034.0E-035.0E-036.0E-037.0E-038.0E-03
0.30 0.40 0.50 0.60 0.70 0.80 0.90 1.00
Fa
ilure
pro
babi
litie
s
LL to DL ratio
Effect of LL to DL ratio on the failure probabilities of footing under gravity loads
Punching failure
soil bearing failure

47
From the analytical investigation of this research presented in the Table 4.2, Table 4.3
and Table 4.4, it is seen that the failure probability of shallow footings against bearing
capacity of soil is higher than any other types of failure modes of footings. It is also
observed from Fig. 4.2 and Fig. 4.3 that the failure probability of shallow footings
against punching shear is higher than any other structural failure modes under the
gravity loads. The failure probability of shallow footings against one way shear and
flexural moment is not critical designed following BNBC, 2006.
4.3.2 Failure Probability of Footings considering Gravity plus earthquake Load
The structural failure probability and geotechnical failure probability of RC shallow
footings are calculated according to Monte Carlo’s Simulation (MCS) method using
spread sheet. The failure probabilities of shallow footing for the flexural moment,
flexural shear, punching shear, and bearing capacity of soil considering individual
failure modes for combined gravity load plus earthquake load are presented in Table
4.5, Table 4.6 and Table 4.7, respectively.
Table 4.5: Failure probabilities of footings of model building-1 considering gravity
loads plus lateral loads
Footing
ID
Gravity
Loads
EQ
Load
Width
of
footing,
B
Probabilities of failure for
DL LL Flexural
Moment
Flexural
Shear
Punching
Shear
Bearing
Capacity
(kN) (kN) (kN) (m) �� �� �� ��
F1 810 354 64 2.04 1.7x10⁻⁴ 2.5x10⁻⁵ 5.5x10⁻⁴ 9.6x10⁻³
F2 1261 635 84 2.60 1.0x10⁻⁴ 2.5x10⁻⁵ 8.0x10⁻⁴ 8.6x10⁻³
F3 1505 1150 1 3.08 2.5x10⁻⁵ 5.0x10⁻⁵ 9.1x10⁻⁴ 6.4x10⁻³
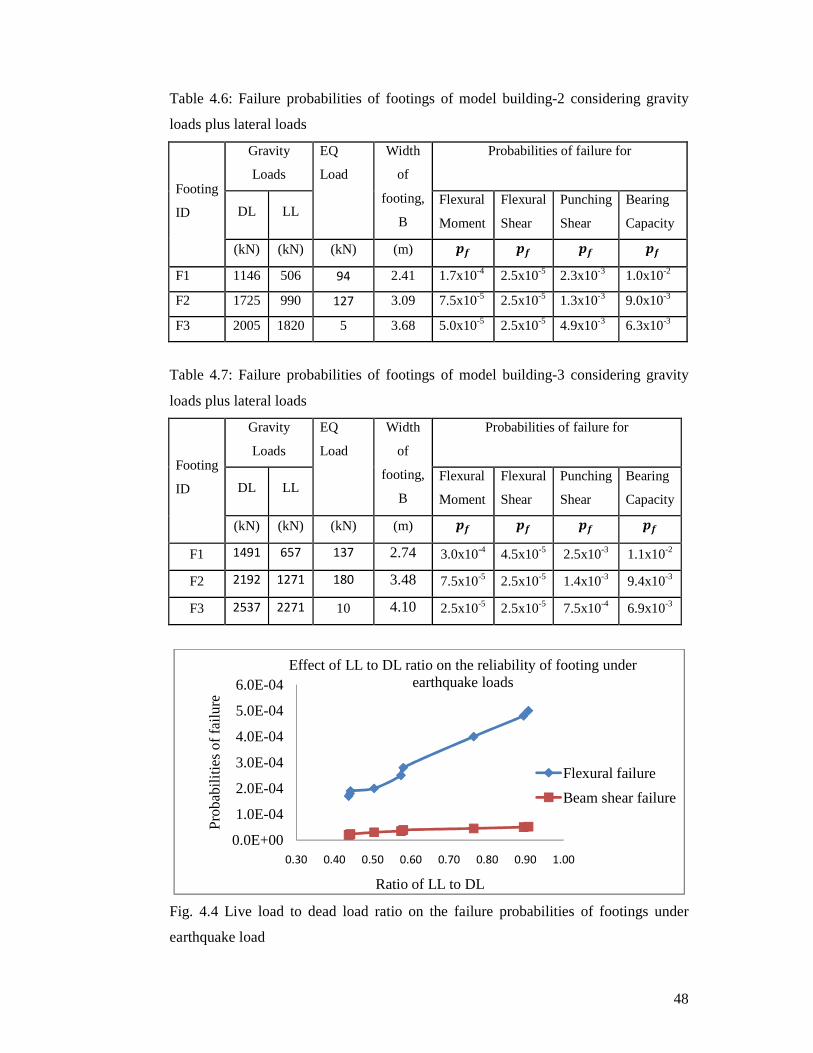
48
Table 4.6: Failure probabilities of footings of model building-2 considering gravity
loads plus lateral loads
Footing
ID
Gravity
Loads
EQ
Load
Width
of
footing,
B
Probabilities of failure for
DL LL Flexural
Moment
Flexural
Shear
Punching
Shear
Bearing
Capacity
(kN) (kN) (kN) (m) �� �� �� ��
F1 1146 506 94 2.41 1.7x10⁻⁴ 2.5x10⁻⁵ 2.3x10⁻³ 1.0x10⁻²
F2 1725 990 127 3.09 7.5x10⁻⁵ 2.5x10⁻⁵ 1.3x10⁻³ 9.0x10⁻³
F3 2005 1820 5 3.68 5.0x10⁻⁵ 2.5x10⁻⁵ 4.9x10⁻³ 6.3x10⁻³
Table 4.7: Failure probabilities of footings of model building-3 considering gravity
loads plus lateral loads
Footing
ID
Gravity
Loads
EQ
Load
Width
of
footing,
B
Probabilities of failure for
DL LL Flexural
Moment
Flexural
Shear
Punching
Shear
Bearing
Capacity
(kN) (kN) (kN) (m) �� �� �� ��
F1 1491 657 137 2.74 3.0x10⁻⁴ 4.5x10⁻⁵ 2.5x10⁻³ 1.1x10⁻²
F2 2192 1271 180 3.48 7.5x10⁻⁵ 2.5x10⁻⁵ 1.4x10⁻³ 9.4x10⁻³
F3 2537 2271 10 4.10 2.5x10⁻⁵ 2.5x10⁻⁵ 7.5x10⁻⁴ 6.9x10⁻³
Fig. 4.4 Live load to dead load ratio on the failure probabilities of footings under
earthquake load
0.0E+00
1.0E-04
2.0E-04
3.0E-04
4.0E-04
5.0E-04
6.0E-04
0.30 0.40 0.50 0.60 0.70 0.80 0.90 1.00
Pro
babi
litie
s of
failu
re
Ratio of LL to DL
Effect of LL to DL ratio on the reliability of footing under earthquake loads
Flexural failure
Beam shear failure
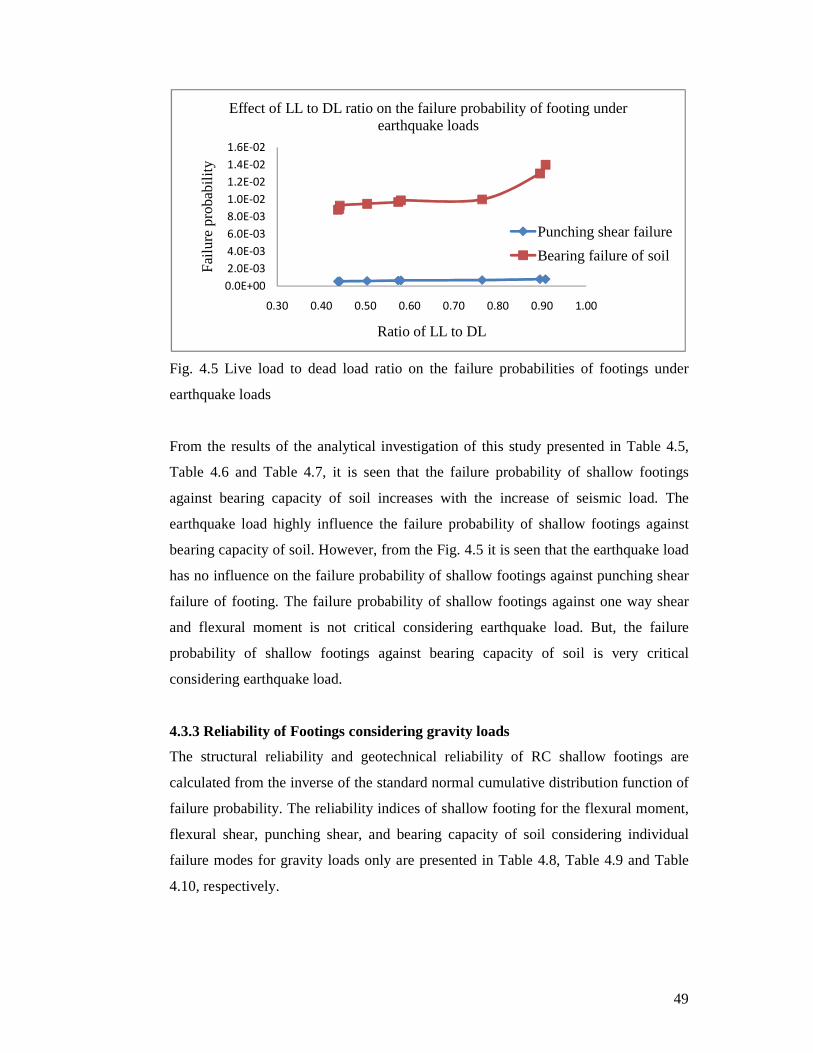
49
Fig. 4.5 Live load to dead load ratio on the failure probabilities of footings under
earthquake loads
From the results of the analytical investigation of this study presented in Table 4.5,
Table 4.6 and Table 4.7, it is seen that the failure probability of shallow footings
against bearing capacity of soil increases with the increase of seismic load. The
earthquake load highly influence the failure probability of shallow footings against
bearing capacity of soil. However, from the Fig. 4.5 it is seen that the earthquake load
has no influence on the failure probability of shallow footings against punching shear
failure of footing. The failure probability of shallow footings against one way shear
and flexural moment is not critical considering earthquake load. But, the failure
probability of shallow footings against bearing capacity of soil is very critical
considering earthquake load.
4.3.3 Reliability of Footings considering gravity loads
The structural reliability and geotechnical reliability of RC shallow footings are
calculated from the inverse of the standard normal cumulative distribution function of
failure probability. The reliability indices of shallow footing for the flexural moment,
flexural shear, punching shear, and bearing capacity of soil considering individual
failure modes for gravity loads only are presented in Table 4.8, Table 4.9 and Table
4.10, respectively.
0.0E+00
2.0E-03
4.0E-03
6.0E-03
8.0E-03
1.0E-02
1.2E-02
1.4E-02
1.6E-02
0.30 0.40 0.50 0.60 0.70 0.80 0.90 1.00
Fai
lure
pro
babi
lity
Ratio of LL to DL
Effect of LL to DL ratio on the failure probability of footing under earthquake loads
Punching shear failure
Bearing failure of soil
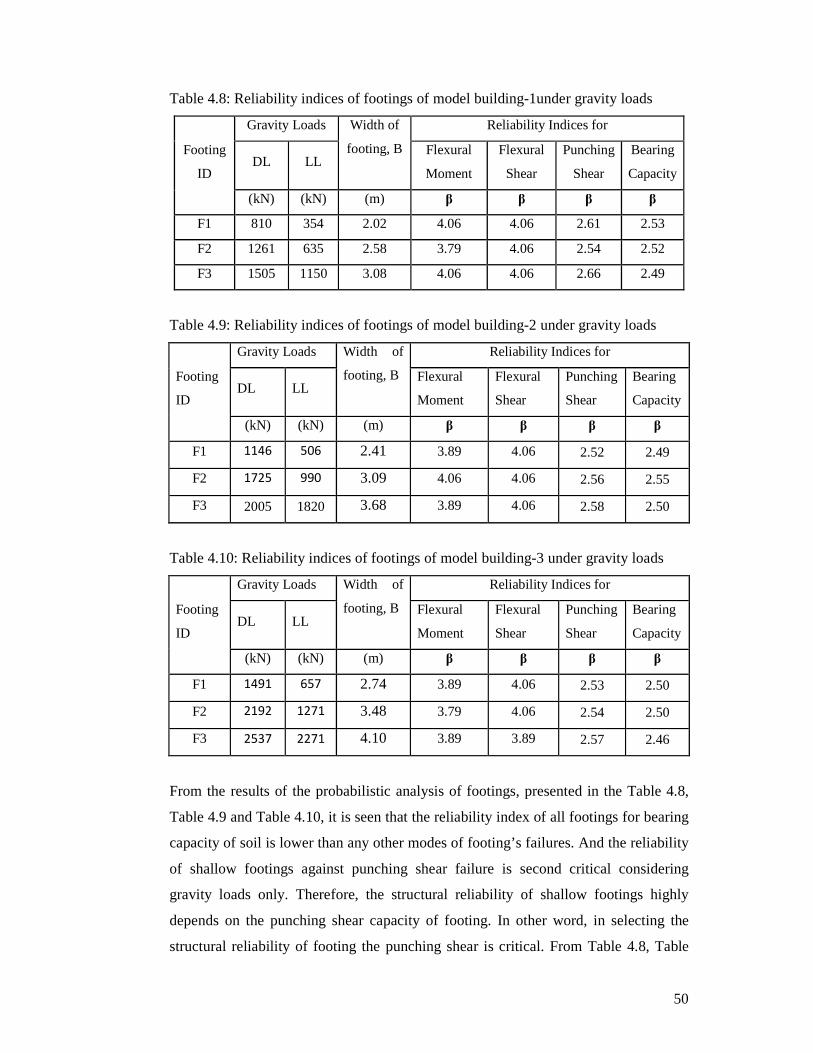
50
Table 4.8: Reliability indices of footings of model building-1under gravity loads
Footing
ID
Gravity Loads Width of
footing, B
Reliability Indices for
DL LL Flexural
Moment
Flexural
Shear
Punching
Shear
Bearing
Capacity
(kN) (kN) (m) β β β β
F1 810 354 2.02 4.06 4.06 2.61 2.53
F2 1261 635 2.58 3.79 4.06 2.54 2.52
F3 1505 1150 3.08 4.06 4.06 2.66 2.49
Table 4.9: Reliability indices of footings of model building-2 under gravity loads
Footing
ID
Gravity Loads Width of
footing, B
Reliability Indices for
DL LL Flexural
Moment
Flexural
Shear
Punching
Shear
Bearing
Capacity
(kN) (kN) (m) β β β β
F1 1146 506 2.41 3.89 4.06 2.52 2.49
F2 1725 990 3.09 4.06 4.06 2.56 2.55
F3 2005 1820 3.68 3.89 4.06 2.58 2.50
Table 4.10: Reliability indices of footings of model building-3 under gravity loads
Footing
ID
Gravity Loads Width of
footing, B
Reliability Indices for
DL LL Flexural
Moment
Flexural
Shear
Punching
Shear
Bearing
Capacity
(kN) (kN) (m) β β β β
F1 1491 657 2.74 3.89 4.06 2.53 2.50
F2 2192 1271 3.48 3.79 4.06 2.54 2.50
F3 2537 2271 4.10 3.89 3.89 2.57 2.46
From the results of the probabilistic analysis of footings, presented in the Table 4.8,
Table 4.9 and Table 4.10, it is seen that the reliability index of all footings for bearing
capacity of soil is lower than any other modes of footing’s failures. And the reliability
of shallow footings against punching shear failure is second critical considering
gravity loads only. Therefore, the structural reliability of shallow footings highly
depends on the punching shear capacity of footing. In other word, in selecting the
structural reliability of footing the punching shear is critical. From Table 4.8, Table

51
4.9 and Table 4.10, one can also understand that the overall reliability of shallow
footing depends greatly on the reliability index obtained against bearing failure of soil
designed following BNBC, 2006.
4.3.4 Reliability of Footings considering gravity plus earthquake loads
The structural reliability and geotechnical reliability of RC shallow footings are
calculated from the inverse of the standard normal cumulative distribution function of
failure probability. The reliability indices of shallow footing for the flexural moment,
flexural shear, punching shear, and bearing capacity of soil considering individual
failure modes for gravity loads plus the effect of seismic loads are presented in Table
4.11, Table 4.12 and Table 4.13, respectively.
Table 4.11: Reliability indices of footings of model building-1 considering gravity
loads plus earthquake loads
Footing
ID
Gravity
Loads
EQ
Load
Width
of
footing,
B
Reliability Indices for
DL LL Flexural
Moment
Flexural
Shear
Punching
Shear
Bearing
Capacity
(kN) (kN) (kN) (m) β β β β
F1 810 354 68 2.02 3.58 4.06 3.26 2.34
F2 1261 635 84 2.58 3.72 4.06 3.16 2.38
F3 1505 1150 1 3.08 4.06 4.06 3.20 2.48
Table 4.12: Reliability indices of footings of model building-2 considering gravity
loads plus earthquake loads
Footing
ID
Gravity
Loads
EQ
Load
Width
of
footing,
B
Reliability Indices for
DL LL Flexural
Moment
Flexural
Shear
Punching
Shear
Bearing
Capacity
(kN) (kN) (kN) (m) β β β β
F1 1146 506 94 2.41 3.58 4.06 2.84 2.32
F2 1725 990 127 3.09 3.79 4.06 2.60 2.36
F3 2005 1820 05 3.68 3.89 4.06 2.58 2.50

52
Table 4.13 Reliability indices of footings of model building-3 considering gravity
loads plus earthquake loads
Footing
ID
Gravity
Loads
EQ
Load
Width
of
footing,
B
Reliability Indices for
DL LL Flexural
Moment
Flexural
Shear
Punching
Shear
Bearing
Capacity
(kN) (kN) (kN) (m) β β β β
F1 1491 657 137 2.74 3.43 3.89 2.81 2.29
F2 2192 1271 180 3.48 3.79 4.06 2.97 2.35
F3 2537 2271 10 4.10 3.89 3.89 3.16 2.46
On the basis of the analytical results of this research presented in Table 4.11, Table
4.12 and Table 4.13 respectively, it is seen that the magnitude of earthquake load has
large influence on the reliability of footings against bearing failure of soil. The
reliability index of all footings against bearing capacity of soil decreases with the
increase of earthquake load. Only in the interior footings where the seismic load effect
is negligible, the bearing capacity reliability index remaining unchanged after seismic
loading is taken into account. The reliability indices against bearing capacity of soil
are deceased largely at exterior footings due to effect of earthquake loads. However,
the reliability of shallow footings against one way shear, flexural moment and
punching shear is not critical after the seismic load is taken into account.
4.3.5 Live load to dead load ratio
The effect of the load ratio that is mean live load to mean dead load ratio was
evaluated for shallow footings of each building. The influence of that load ratio on the
reliability of footing is presented in Fig 4.6, Fig.4.7 and Fig. 4.8, respectively. The
reliability indices decrease as the load ratio increase, due to larger variability of live
load, i.e., COV = 25% as compared to COV=10% for the dead load. It is observed
that the punching reliability and bearing capacity reliability decreases with the
increase of live load to dead load ratio. Whereas flexural reliability and one way shear
reliability has minor effect on the live load to dead load ratio.
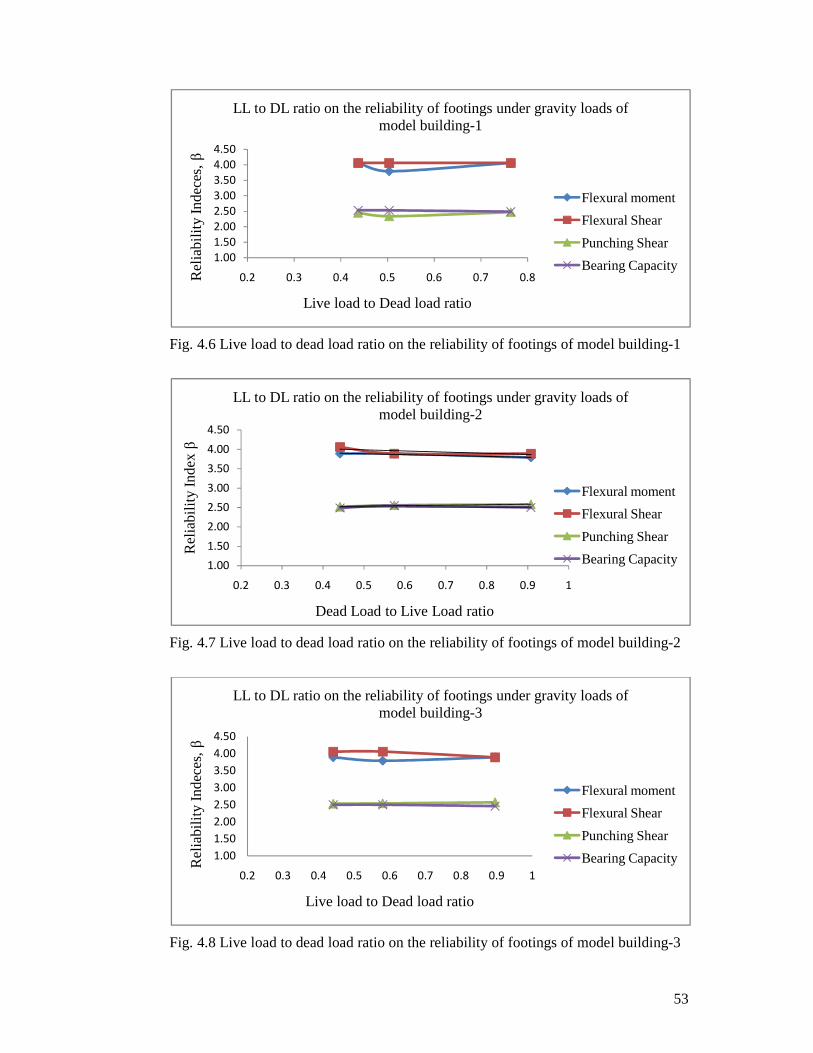
53
Fig. 4.6 Live load to dead load ratio on the reliability of footings of model building-1
Fig. 4.7 Live load to dead load ratio on the reliability of footings of model building-2
Fig. 4.8 Live load to dead load ratio on the reliability of footings of model building-3
1.00
1.50
2.00
2.50
3.00
3.50
4.00
4.50
0.2 0.3 0.4 0.5 0.6 0.7 0.8Rel
iabi
lity
Inde
ces,
β
Live load to Dead load ratio
LL to DL ratio on the reliability of footings under gravity loads of model building-1
Flexural moment
Flexural Shear
Punching Shear
Bearing Capacity
1.00
1.50
2.00
2.50
3.00
3.50
4.00
4.50
0.2 0.3 0.4 0.5 0.6 0.7 0.8 0.9 1
Rel
iabi
lity
Inde
x β
Dead Load to Live Load ratio
LL to DL ratio on the reliability of footings under gravity loads of model building-2
Flexural moment
Flexural Shear
Punching Shear
Bearing Capacity
1.00
1.50
2.00
2.50
3.00
3.50
4.00
4.50
0.2 0.3 0.4 0.5 0.6 0.7 0.8 0.9 1
Re
liabi
lity
Inde
ces,
β
Live load to Dead load ratio
LL to DL ratio on the reliability of footings under gravity loads of model building-3
Flexural moment
Flexural Shear
Punching Shear
Bearing Capacity
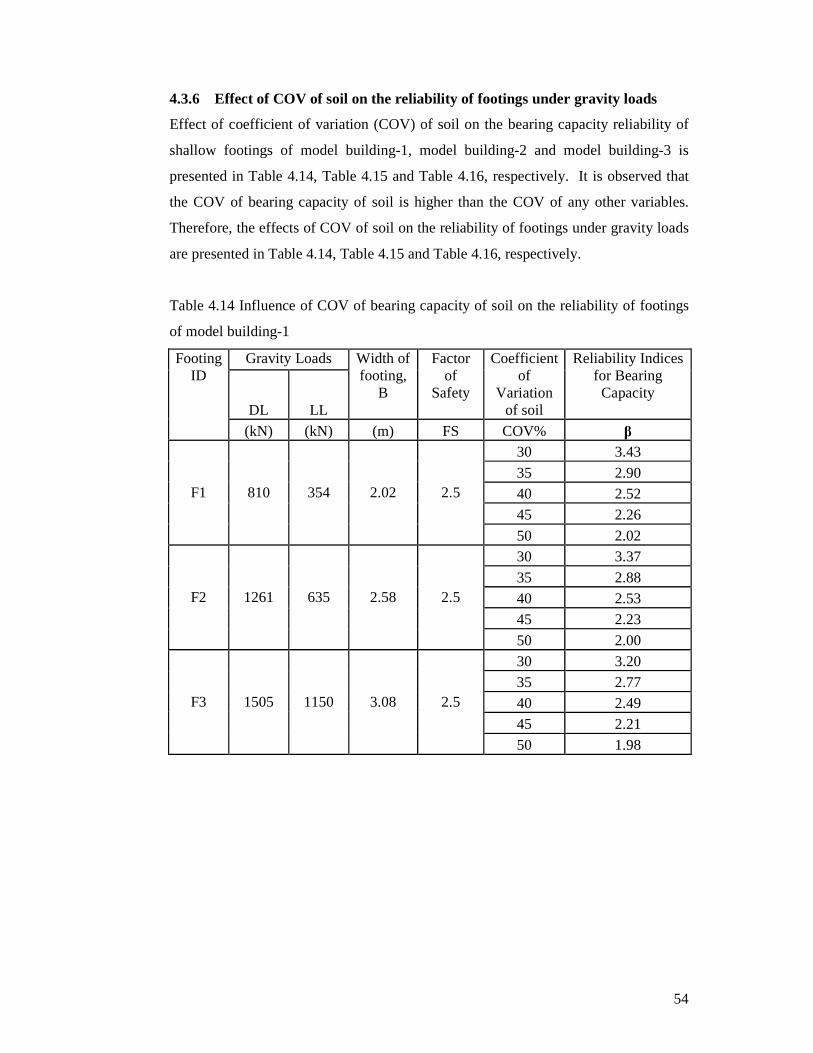
54
4.3.6 Effect of COV of soil on the reliability of footings under gravity loads
Effect of coefficient of variation (COV) of soil on the bearing capacity reliability of
shallow footings of model building-1, model building-2 and model building-3 is
presented in Table 4.14, Table 4.15 and Table 4.16, respectively. It is observed that
the COV of bearing capacity of soil is higher than the COV of any other variables.
Therefore, the effects of COV of soil on the reliability of footings under gravity loads
are presented in Table 4.14, Table 4.15 and Table 4.16, respectively.
Table 4.14 Influence of COV of bearing capacity of soil on the reliability of footings
of model building-1
Footing ID
Gravity Loads Width of footing,
B
Factor of
Safety
Coefficient of
Variation of soil
Reliability Indices for Bearing Capacity
DL LL
(kN) (kN) (m) FS COV% β
F1 810 354 2.02 2.5
30 3.43
35 2.90
40 2.52
45 2.26
50 2.02
F2 1261 635 2.58 2.5
30 3.37
35 2.88
40 2.53
45 2.23
50 2.00
F3 1505 1150 3.08 2.5
30 3.20
35 2.77
40 2.49
45 2.21
50 1.98

55
Table 4.15 Influence of COV of bearing capacity of soil on the reliability of footings
of model building-2
Footing ID
Gravity Loads Width of footing,
B
Factor of
Safety
Coefficient of
Variation of soil
Reliability Indices for Bearing Capacity
DL LL
(kN) (kN) (m) FS COV% β
F1 1146 506 2.41 2.5
30 3.40
35 2.89
40 2.51
45 2.20
50 2.08
F2 1725 990 3.09 2.5
30 3.33
35 2.82
40 2.54
45 2.21
50 2.01
F3 2005 1820 3.68 2.5
30 3.17
35 2.70
40 2.41
45 2.17
50 1.92
Table 4.16 Influence of COV of bearing capacity of soil on the reliability of footings
of model building-03
Footing ID
Gravity Loads Width of footing,
B
Factor of
Safety
Coefficient of
Variation of soil
Reliability Indices for Bearing Capacity
DL LL
(kN) (kN) (m) FS COV% β
F1 1491 657 2.74 2.5
30 3.41
35 2.85
40 2.53
45 2.16
50 1.98
F2 2192 1271 3.48 2.5
30 3.31 35 2.80
40 2.50
45 2.17
50 1.97
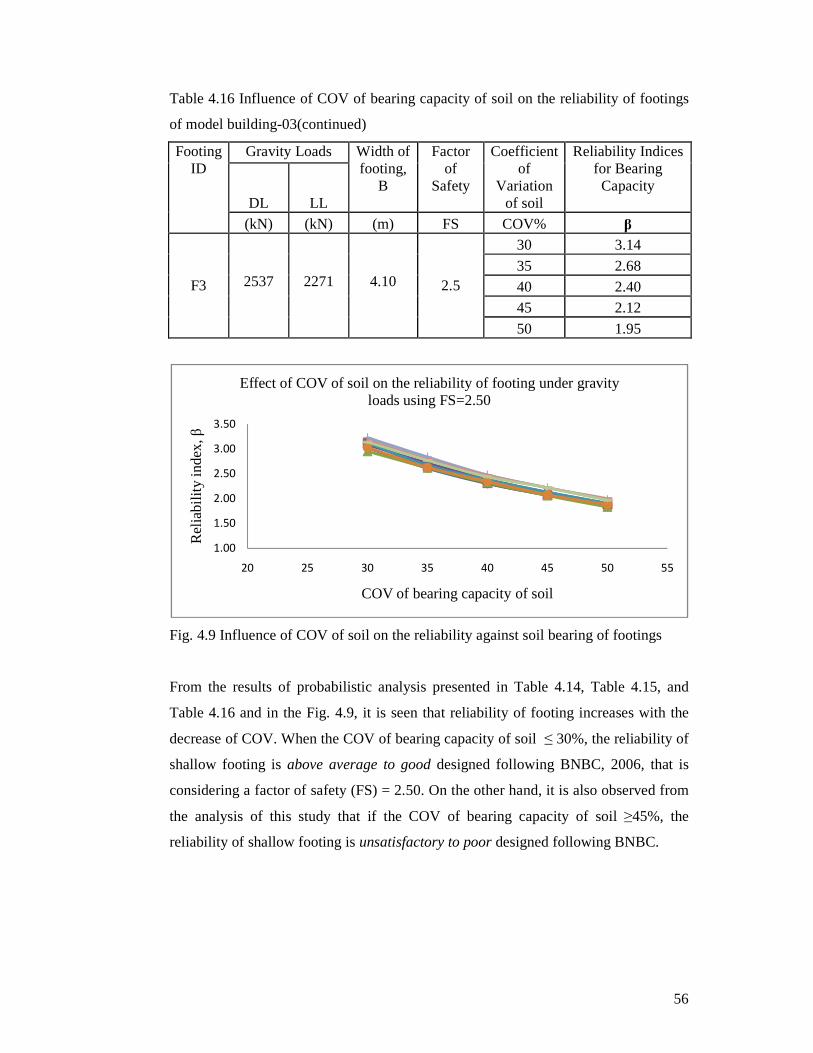
56
Table 4.16 Influence of COV of bearing capacity of soil on the reliability of footings
of model building-03(continued)
Footing ID
Gravity Loads Width of footing,
B
Factor of
Safety
Coefficient of
Variation of soil
Reliability Indices for Bearing Capacity
DL LL
(kN) (kN) (m) FS COV% β
F3 2537 2271 4.10 2.5
30 3.14
35 2.68
40 2.40
45 2.12
50 1.95
Fig. 4.9 Influence of COV of soil on the reliability against soil bearing of footings
From the results of probabilistic analysis presented in Table 4.14, Table 4.15, and
Table 4.16 and in the Fig. 4.9, it is seen that reliability of footing increases with the
decrease of COV. When the COV of bearing capacity of soil ≤ 30%, the reliability of
shallow footing is above average to good designed following BNBC, 2006, that is
considering a factor of safety (FS) = 2.50. On the other hand, it is also observed from
the analysis of this study that if the COV of bearing capacity of soil ≥45%, the
reliability of shallow footing is unsatisfactory to poor designed following BNBC.
1.00
1.50
2.00
2.50
3.00
3.50
20 25 30 35 40 45 50 55
Rel
iabi
lity
inde
x, β
COV of bearing capacity of soil
Effect of COV of soil on the reliability of footing under gravity loads using FS=2.50

57
4.3.7 Effect of COV of soil on the reliability of footings under earthquake load
Effect of coefficient of variation (COV) of soil on the bearing capacity reliability of
shallow footings considering earthquake loads of model building-1, model building-2
and model building-3 are presented in Table 4.17, Table 4.18 and Table 4.19,
respectively.
Table 4.17 Effect of COV of live load on the reliability of footings considering
earthquake load for model building-1
Footing ID
Loads Width of footing, B
Factor of
Safety
Coefficient of Variation of soil
Reliability Indices for
Bearing Capacity
DL LL EQ
(kN) (kN) (kN) (m) FS COV% β
F1 810 354 68 2.02 2.5
30 3.10
35 2.69
40 2.35
45 2.07
50 1.90
F2 1261 635 84 2.58 2.5
30 3.08
35 2.70
40 2.38 45 2.11
50 1.91
F3 1505 1150 01 3.08 2.5
30 3.15
35 2.77
40 2.46 45 2.24
50 2.02
Table 4.18 Effect of COV of live load on the reliability of footings considering
earthquake load for model building-2
Footing ID
Loads Width of footing, B
Factor of
Safety
Coefficient of Variation of
soil
Reliability Indices for
Bearing Capacity DL LL EQ
(kN) (kN) (kN) (m) FS COV% β
F1 1146 506 94 2.41 2.5
30 3.10
35 2.69
40 2.35
45 2.07
50 1.90

58
Table 4.18 Effect of COV of live load on the reliability of footings considering
earthquake load for model building-2 (continued)
Footing ID
Loads Width of footing, B
Factor of
Safety
Coefficient of Variation of
soil
Reliability Indices for
Bearing Capacity
DL LL EQ
(kN) (kN) (kN) (m) FS COV% β
F2 1725 990 127 3.09 2.5
30 3.08
35 2.70
40 2.38
45 2.11
50 1.91
F3 2005 1820 05 3.68 2.5
30 3.15
35 2.77
40 2.46
45 2.22
50 1.98
Table 4.19 Effect of COV of live load on the reliability of footings considering
earthquake load for model building-3
Footing ID
Loads Width of footing, B
Factor of
Safety
Coefficient of Variation of
soil
Reliability Indices for
Bearing Capacity DL LL EQ
(kN) (kN) (kN) (m) FS COV% β
F1 1491 657 137 2.74 2.5
30 3.07
35 2.71
40 2.38
45 2.01
50 1.88
F2 2192 1271 180 3.48 2.5
30 3.03
35 2.73
40 2.33 45 2.10
50 1.86
F3 2537 2271 10 4.10 2.5
30 3.11
35 2.71
40 2.42 45 2.18
50 1.95

59
Fig. 4.10 Influence of COV of soil on the reliability against soil bearing of footings
under earthquake loads
From the results of probabilistic analysis presented in Table 4.17, Table 4.18, and
Table 4.19 and in the Fig. 4.10, it is seen that reliability of footing decreases with the
increase of COV. When the COV of bearing capacity of soil ≤ 30%, the reliability of
shallow footing is above average under the earthquake loads designed following
BNBC, 2006. On the other hand, it is also observed from the analysis of this study
that if the COV of bearing capacity of soil ≥40%, the reliability of shallow footing is
unsatisfactory to poor designed following BNBC.
4.3.8 Effect of Factor of Safety on the reliability under gravity loads
The factor of safety (FS) in calculating the allowable soil bearing capacity has greater
influence on the reliability of footing. The effect of factor of safety in calculating the
allowable soil bearing capacity on the reliability of shallow footings of model
building-1, model building-2 and model building-3 are presented in Table 4.20,
Table 4.21 and Table 4.22, respectively.
1.00
1.50
2.00
2.50
3.00
3.50
25 30 35 40 45 50 55
Re
liabi
lity
inde
x
COV of soil
Effect of COV of soil on the reliability of footing under earthquake load using FS=2.50
mean soil bearing=292kPa
COV of EQ load=138%
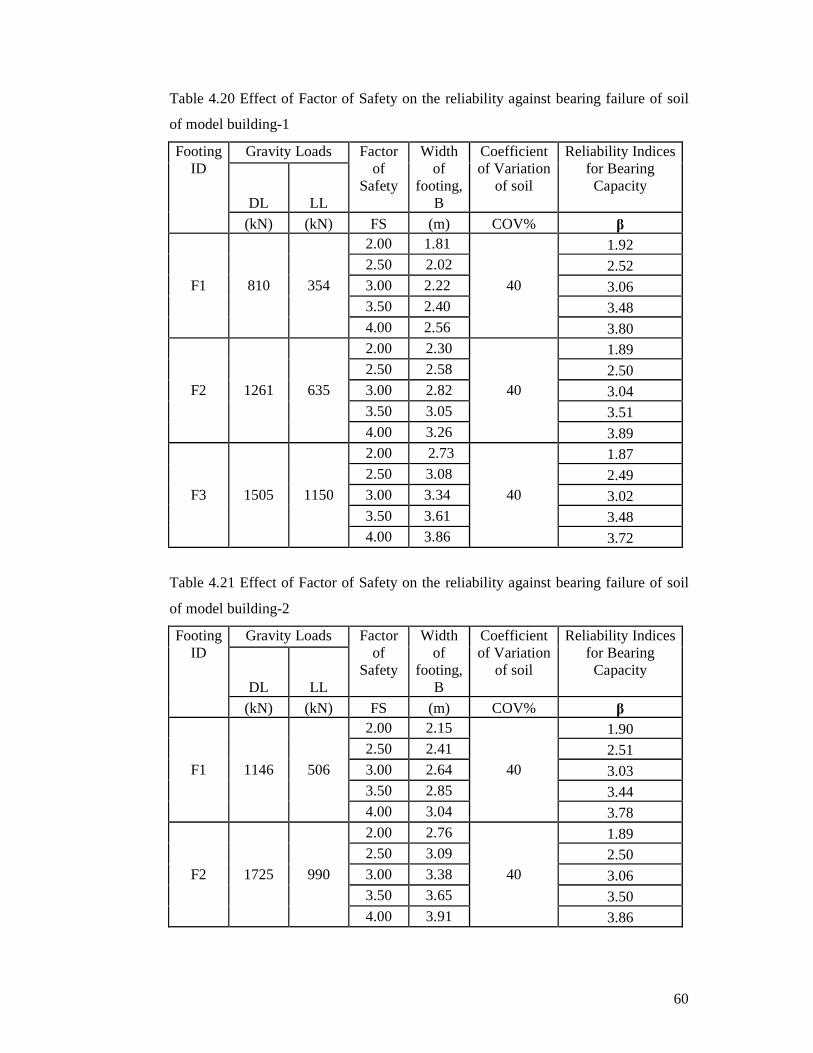
60
Table 4.20 Effect of Factor of Safety on the reliability against bearing failure of soil
of model building-1
Footing ID
Gravity Loads Factor of
Safety
Width of
footing, B
Coefficient of Variation
of soil
Reliability Indices for Bearing Capacity
DL LL
(kN) (kN) FS (m) COV% β
F1 810 354
2.00 1.81
40
1.92 2.50 2.02 2.52 3.00 2.22 3.06 3.50 2.40 3.48 4.00 2.56 3.80
F2 1261 635
2.00 2.30
40
1.89 2.50 2.58 2.50 3.00 2.82 3.04 3.50 3.05 3.51 4.00 3.26 3.89
F3 1505 1150
2.00 2.73
40
1.87 2.50 3.08 2.49 3.00 3.34 3.02 3.50 3.61 3.48 4.00 3.86 3.72
Table 4.21 Effect of Factor of Safety on the reliability against bearing failure of soil
of model building-2
Footing ID
Gravity Loads Factor of
Safety
Width of
footing, B
Coefficient of Variation
of soil
Reliability Indices for Bearing Capacity
DL LL
(kN) (kN) FS (m) COV% β
F1 1146 506
2.00 2.15
40
1.90 2.50 2.41 2.51 3.00 2.64 3.03 3.50 2.85 3.44 4.00 3.04 3.78
F2 1725 990
2.00 2.76
40
1.89 2.50 3.09 2.50 3.00 3.38 3.06 3.50 3.65 3.50 4.00 3.91 3.86
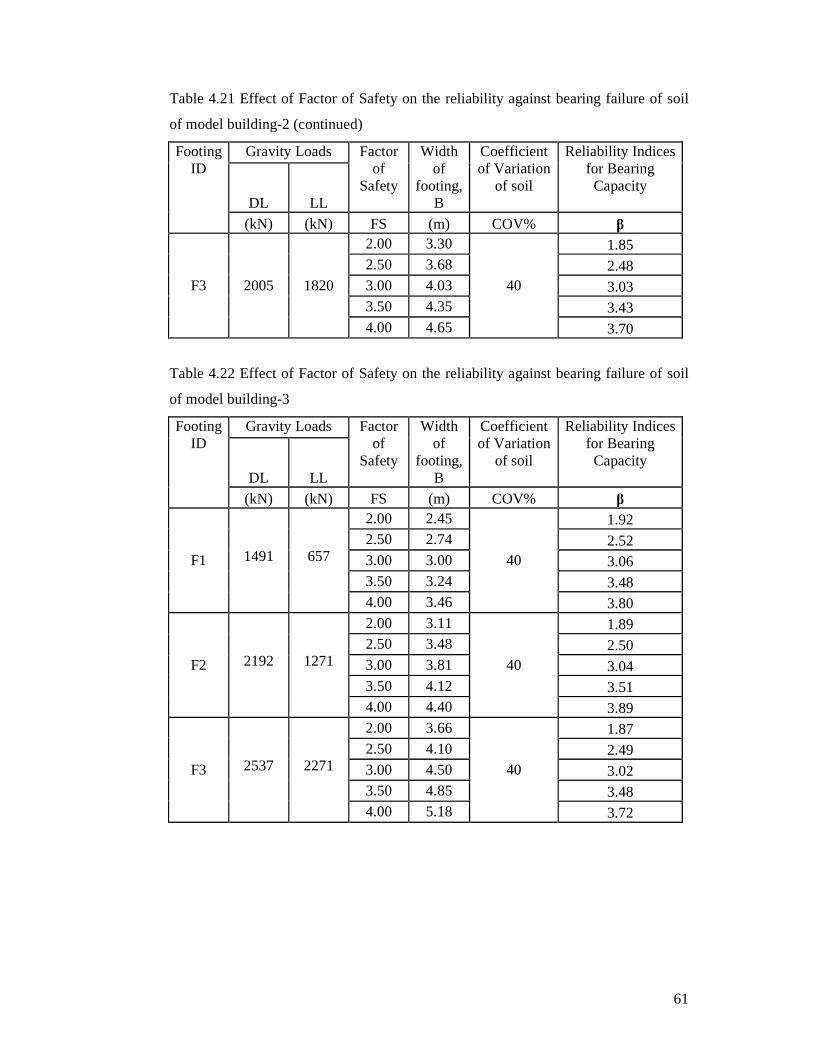
61
Table 4.21 Effect of Factor of Safety on the reliability against bearing failure of soil
of model building-2 (continued)
Footing ID
Gravity Loads Factor of
Safety
Width of
footing, B
Coefficient of Variation
of soil
Reliability Indices for Bearing Capacity
DL LL
(kN) (kN) FS (m) COV% β
F3 2005 1820
2.00 3.30
40
1.85 2.50 3.68 2.48 3.00 4.03 3.03 3.50 4.35 3.43 4.00 4.65 3.70
Table 4.22 Effect of Factor of Safety on the reliability against bearing failure of soil
of model building-3
Footing ID
Gravity Loads Factor of
Safety
Width of
footing, B
Coefficient of Variation
of soil
Reliability Indices for Bearing Capacity
DL LL
(kN) (kN) FS (m) COV% β
F1 1491 657
2.00 2.45
40
1.92 2.50 2.74 2.52 3.00 3.00 3.06 3.50 3.24 3.48 4.00 3.46 3.80
F2 2192 1271
2.00 3.11
40
1.89 2.50 3.48 2.50 3.00 3.81 3.04 3.50 4.12 3.51 4.00 4.40 3.89
F3 2537 2271
2.00 3.66
40
1.87 2.50 4.10 2.49 3.00 4.50 3.02 3.50 4.85 3.48 4.00 5.18 3.72

62
Fig. 4.11 Effect of factor of safety on the reliability against soil bearing of footings
From the analytical investigation of the study carried out in this research presented in
Table 4.20, Table 4.21 and Table 4.22, and in Fig. 4.11, it is seen that the reliability
index β against soil bearing capacity is 2.49 to 2.52 considering a factor of safety (FS)
= 2.5. The reliability index β = 2.49 to 2.52 indicates the performance of footing is
poor to below average (US Army Corps of Engineers 1997). If one can use a factor of
safety (FS) = 3.00 in footing design, the performance of footing will be above
average.
4.3.9 Effect of Factor of Safety on the reliability under earthquake loads
The factor of safety (FS) in calculating the allowable soil bearing capacity has greater
influence on the reliability of footing. The effect of factor of safety in calculating the
allowable soil bearing capacity on the reliability of shallow footings of model
building-1, model building-2 and model building-3 under the earthquake load is
presented in Table 4.23, Table 4.24 and Table 4.25, respectively.
1.00
1.50
2.00
2.50
3.00
3.50
4.00
1.00 1.50 2.00 2.50 3.00 3.50 4.00 4.50
Re
liabi
lity
indi
ces
Factor of Safety in soil bearing capacity
Effect of factor of safety on the reliability of footing against soil bearing capacity under gravity loads
Mean bearing capacity=292kPa
COV=40%

63
Table 4.23 Effect of Factor of Safety on the reliability against bearing failure of soil
of model building-1under earthquake load
Footing ID
Gravity Loads Factor of
Safety
Width of
footing, B
Coefficient of
Variation of soil
Reliability Indices for
Bearing Capacity
DL LL EQ
(kN) (kN) (kN) FS (m) COV% β
F1 810 354 68
2.00 1.81
40
1.74 2.50 2.02 2.34 3.00 2.22 2.88 3.50 2.40 3.40 4.00 2.56 3.77
F2 1261 635 84
2.00 2.30
40
1.72 2.50 2.58 2.40 3.00 2.82 2.85 3.50 3.05 3.37 4.00 3.26 3.73
F3 1505 1150 01
2.00 2.73
40
1.75 2.50 3.08 2.41 3.00 3.34 2.98 3.50 3.61 3.40 4.00 3.86 3.69
Table 4.24 Effect of Factor of Safety on the reliability against bearing failure of soil
of model building-2 under earthquake load
Footing ID
Gravity Loads Factor of
Safety
Width of
footing, B
Coefficient of
Variation of soil
Reliability Indices for
Bearing Capacity
DL LL EQ
(kN) (kN) (kN) FS (m) COV% β
F1 1146 506 94
2.00 2.15
40
1.73 2.50 2.41 2.37 3.00 2.64 2.85 3.50 2.85 3.28 4.00 3.04 3.72
F2 1725 990 127
2.00 2.76
40
1.75 2.50 3.09 2.40 3.00 3.38 2.83 3.50 3.65 3.30 4.00 3.91 3.72

64
Table 4.24 Effect of Factor of Safety on the reliability against bearing failure of soil
of model building-2under earthquake load (continued)
Footing ID
Gravity Loads Factor of
Safety
Width of
footing, B
Coefficient of
Variation of soil
Reliability Indices for
Bearing Capacity
DL LL EQ
(kN) (kN) (kN) FS (m) COV% β
F3 2005 1820 05
2.00 3.30
40
1.76 2.50 3.68 2.41 3.00 4.03 3.00 3.50 4.35 3.41 4.00 4.65 3.68
Table 4.25 Effect of Factor of Safety on the reliability against bearing failure of soil
of model building-3 under earthquake load
Footing ID
Gravity Loads Factor of
Safety
Width of
footing, B
Coefficient of
Variation of soil
Reliability Indices for
Bearing Capacity
DL LL EQ
(kN) (kN) (kN) FS (m) COV% β
F1 1491 657 137
2.00 2.45
40
1.70 2.50 2.74 2.33 3.00 3.00 2.84 3.50 3.24 3.24 4.00 3.46 3.71
F2 2192 1271 180
2.00 3.11
40
1.72 2.50 3.48 2.39 3.00 3.81 2.80 3.50 4.12 3.27 4.00 4.40 3.71
F3 2537 2271 10
2.00 3.66
40
1.73 2.50 4.10 2.41 3.00 4.50 2.89 3.50 4.85 3.28 4.00 5.18 3.67
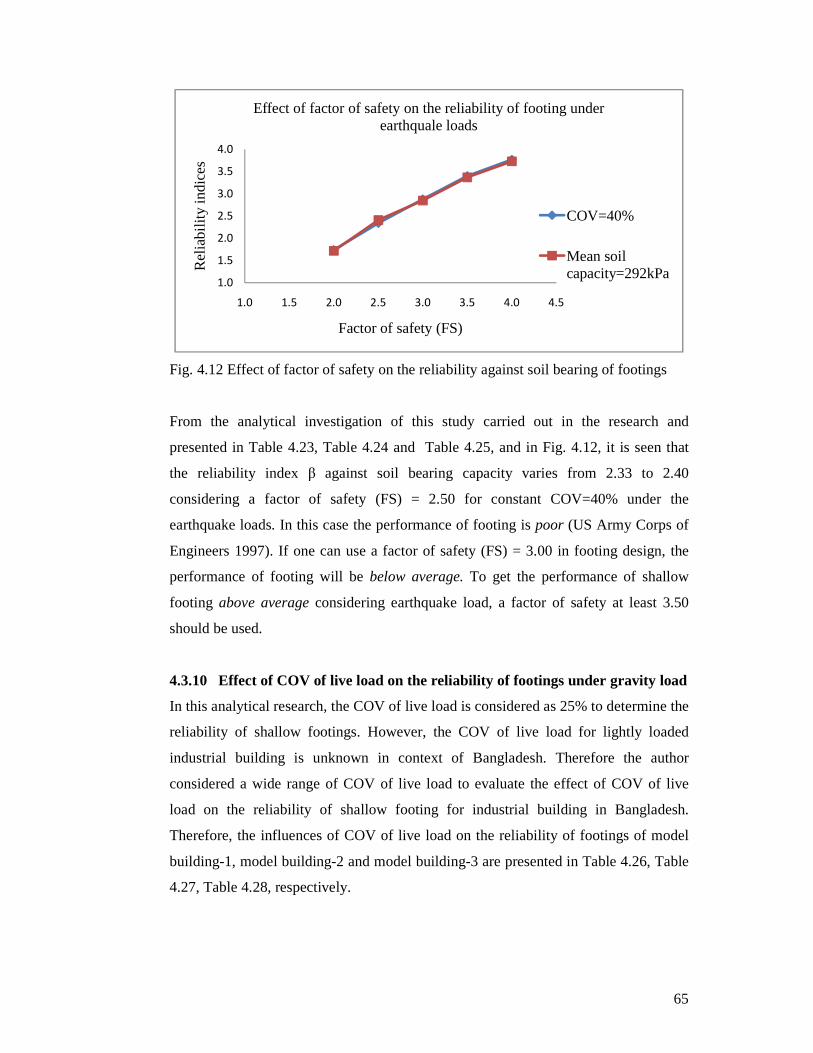
65
Fig. 4.12 Effect of factor of safety on the reliability against soil bearing of footings
From the analytical investigation of this study carried out in the research and
presented in Table 4.23, Table 4.24 and Table 4.25, and in Fig. 4.12, it is seen that
the reliability index β against soil bearing capacity varies from 2.33 to 2.40
considering a factor of safety (FS) = 2.50 for constant COV=40% under the
earthquake loads. In this case the performance of footing is poor (US Army Corps of
Engineers 1997). If one can use a factor of safety (FS) = 3.00 in footing design, the
performance of footing will be below average. To get the performance of shallow
footing above average considering earthquake load, a factor of safety at least 3.50
should be used.
4.3.10 Effect of COV of live load on the reliability of footings under gravity load
In this analytical research, the COV of live load is considered as 25% to determine the
reliability of shallow footings. However, the COV of live load for lightly loaded
industrial building is unknown in context of Bangladesh. Therefore the author
considered a wide range of COV of live load to evaluate the effect of COV of live
load on the reliability of shallow footing for industrial building in Bangladesh.
Therefore, the influences of COV of live load on the reliability of footings of model
building-1, model building-2 and model building-3 are presented in Table 4.26, Table
4.27, Table 4.28, respectively.
1.0
1.5
2.0
2.5
3.0
3.5
4.0
1.0 1.5 2.0 2.5 3.0 3.5 4.0 4.5
Rel
iabi
lity
indi
ces
Factor of safety (FS)
Effect of factor of safety on the reliability of footing under earthquale loads
COV=40%
Mean soil capacity=292kPa

66
Table 4.26 Influence of COV of live load on the reliability of footings of model
building-01
Footing ID
Gravity Loads Width of
footing, B
Factor of
Safety
Coefficient of
Variation of Live Load
Reliability Indices for
Bearing Capacity
Reliability Indices for Punching shear
DL LL
(kN) (kN) (m) FS COV% β β
F1 810 354 2.02 2.5
20 2.55 2.65
25 2.53 2.63
30 2.50 2.60
35 2.47 2.58
40 2.44 2.57
F2 1261 635 2.58 2.5
20 2.55 2.57
25 2.54 2.55
30 2.51 2.54
35 2.45 2.53
40 2.39 2.52
F3 1505 1150 3.08 2.5
20 2.53 2.65
25 2.50 2.64
30 2.42 2.63
35 2.37 2.59
40 2.34 2.58
Table 4.27 Influence of COV of live load on the reliability of footings of model
building-02
Footing ID
Gravity Loads Width of
footing, B
Factor of
Safety
Coefficient of
Variation of Live Load
Reliability Indices for
Bearing Capacity
Reliability Indices for Punching shear
DL LL
(kN) (kN) (m) FS COV% β β
F1 1146 506 2.41 2.5
20 2.54 2.64
25 2.52 2.62
30 2.51 2.60
35 2.48 2.58
40 2.43 2.57

67
Table 4.27 Influence of COV of live load on the reliability of footings of model
building-02 (continued)
Footing ID
Gravity Loads Width of
footing, B
Factor of
Safety
COV of Live Load
Reliability Indices for
Bearing Capacity
Reliability Indices for Punching shear DL LL
(kN) (kN) (m) FS COV% β β
F2 1725 990 3.09 2.5
20 2.55 2.57
25 2.54 2.55
30 2.52 2.54
35 2.46 2.53
40 2.40 2.52
F3 2005 1820 3.68 2.5
20 2.53 2.64
25 2.51 2.63
30 2.41 2.62
35 2.36 2.59
40 2.33 2.58
Table 4.28 Influence of COV of live load on the reliability of footings of model
building-03
Footing ID
Gravity Loads Width of
footing, B
Factor of
Safety
COV of Live Load
Reliability Indices for
Bearing Capacity
Reliability Indices for Punching
shear DL LL
(kN) (kN) (m) FS COV% β β
F1 1491 657 2.74 2.5
20 2.53 2.64
25 2.52 2.63
30 2.50 2.61
35 2.48 2.59
40 2.43 2.58
F2 2192 1271 3.48 2.5
20 2.54 2.56
25 2.53 2.55
30 2.51 2.54
35 2.46 2.51
40 2.39 2.50
F3 2537 2271 4.10 2.5
20 2.53 2.64
25 2.50 2.63
30 2.42 2.62
35 2.36 2.59
40 2.32 2.57
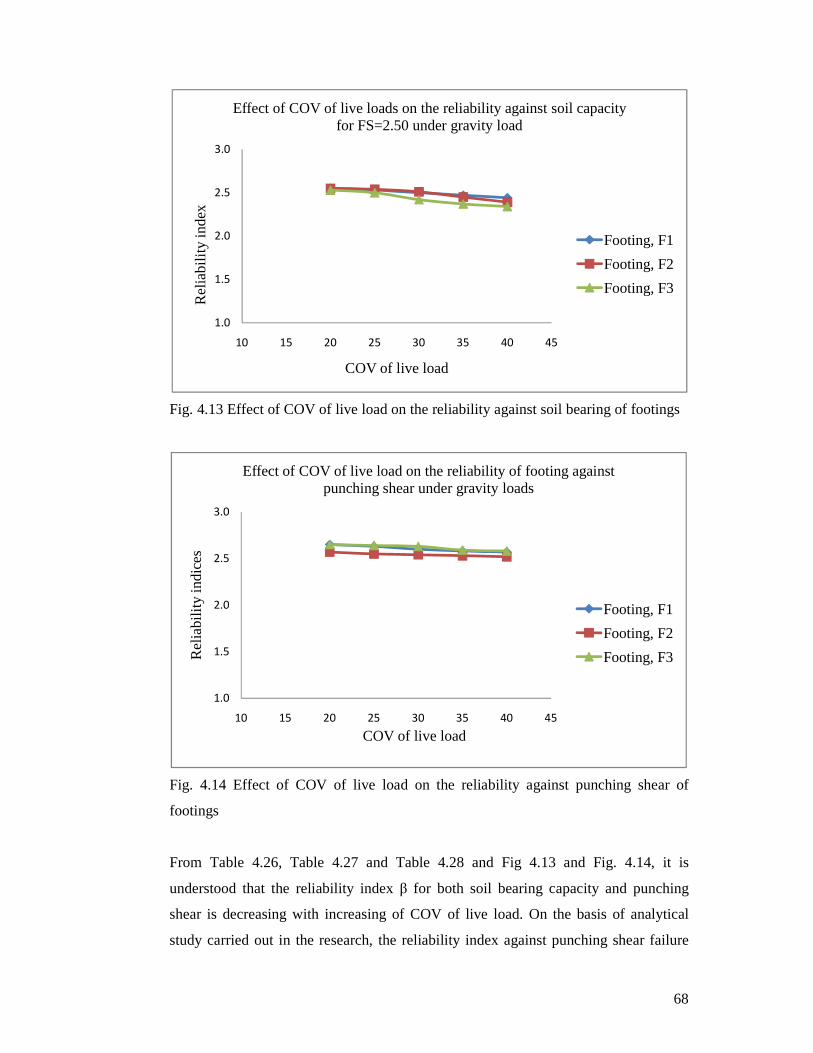
68
Fig. 4.13 Effect of COV of live load on the reliability against soil bearing of footings
Fig. 4.14 Effect of COV of live load on the reliability against punching shear of
footings
From Table 4.26, Table 4.27 and Table 4.28 and Fig 4.13 and Fig. 4.14, it is
understood that the reliability index β for both soil bearing capacity and punching
shear is decreasing with increasing of COV of live load. On the basis of analytical
study carried out in the research, the reliability index against punching shear failure
1.0
1.5
2.0
2.5
3.0
10 15 20 25 30 35 40 45
Re
liabi
lity
inde
x
COV of live load
Effect of COV of live loads on the reliability against soil capacity for FS=2.50 under gravity load
Footing, F1
Footing, F2
Footing, F3
1.0
1.5
2.0
2.5
3.0
10 15 20 25 30 35 40 45
Re
liabi
lity
indi
ces
COV of live load
Effect of COV of live load on the reliability of footing against punching shear under gravity loads
Footing, F1
Footing, F2
Footing, F3
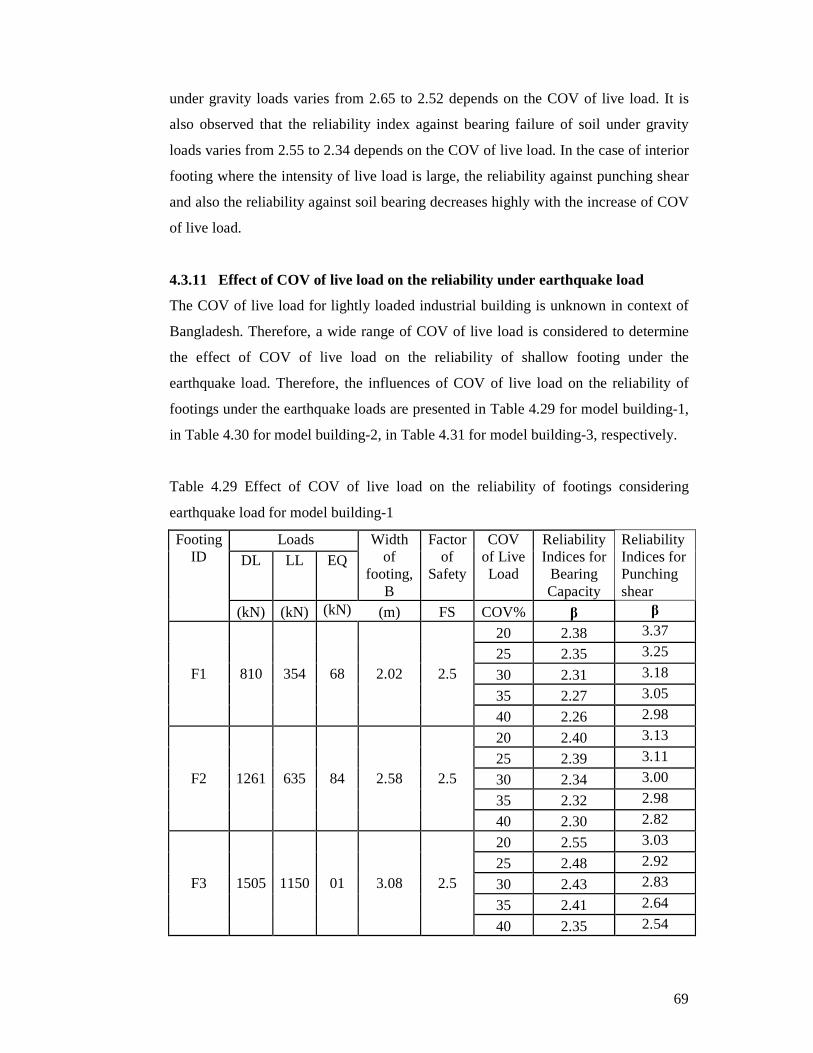
69
under gravity loads varies from 2.65 to 2.52 depends on the COV of live load. It is
also observed that the reliability index against bearing failure of soil under gravity
loads varies from 2.55 to 2.34 depends on the COV of live load. In the case of interior
footing where the intensity of live load is large, the reliability against punching shear
and also the reliability against soil bearing decreases highly with the increase of COV
of live load.
4.3.11 Effect of COV of live load on the reliability under earthquake load
The COV of live load for lightly loaded industrial building is unknown in context of
Bangladesh. Therefore, a wide range of COV of live load is considered to determine
the effect of COV of live load on the reliability of shallow footing under the
earthquake load. Therefore, the influences of COV of live load on the reliability of
footings under the earthquake loads are presented in Table 4.29 for model building-1,
in Table 4.30 for model building-2, in Table 4.31 for model building-3, respectively.
Table 4.29 Effect of COV of live load on the reliability of footings considering
earthquake load for model building-1
Footing ID
Loads Width of
footing, B
Factor of
Safety
COV of Live Load
Reliability Indices for
Bearing Capacity
Reliability Indices for Punching shear
DL LL EQ
(kN) (kN) (kN) (m) FS COV% β β
F1 810 354 68 2.02 2.5
20 2.38 3.37
25 2.35 3.25
30 2.31 3.18
35 2.27 3.05
40 2.26 2.98
F2 1261 635 84 2.58 2.5
20 2.40 3.13
25 2.39 3.11
30 2.34 3.00
35 2.32 2.98
40 2.30 2.82
F3 1505 1150 01 3.08 2.5
20 2.55 3.03
25 2.48 2.92
30 2.43 2.83
35 2.41 2.64
40 2.35 2.54
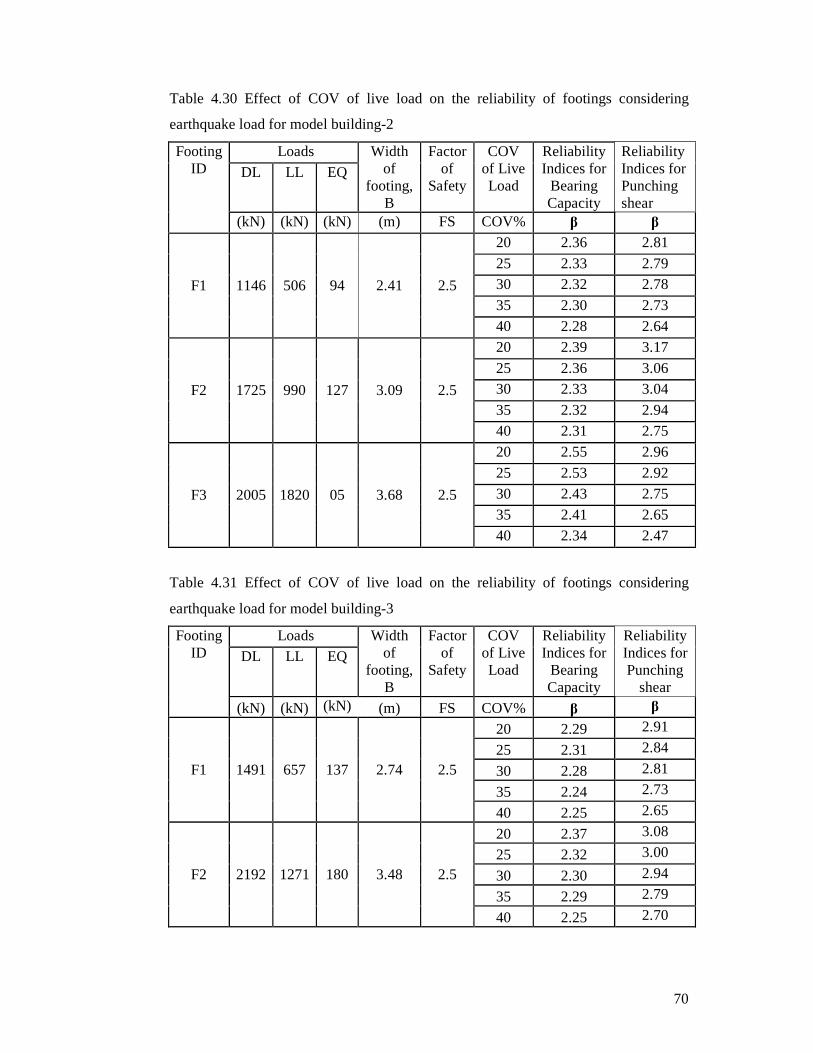
70
Table 4.30 Effect of COV of live load on the reliability of footings considering
earthquake load for model building-2
Footing ID
Loads Width of
footing, B
Factor of
Safety
COV of Live Load
Reliability Indices for
Bearing Capacity
Reliability Indices for Punching shear
DL LL EQ
(kN) (kN) (kN) (m) FS COV% β β
F1 1146 506 94 2.41 2.5
20 2.36 2.81
25 2.33 2.79 30 2.32 2.78
35 2.30 2.73
40 2.28 2.64
F2 1725 990 127 3.09 2.5
20 2.39 3.17
25 2.36 3.06 30 2.33 3.04
35 2.32 2.94
40 2.31 2.75
F3 2005 1820 05 3.68 2.5
20 2.55 2.96
25 2.53 2.92
30 2.43 2.75
35 2.41 2.65
40 2.34 2.47
Table 4.31 Effect of COV of live load on the reliability of footings considering
earthquake load for model building-3
Footing ID
Loads Width of
footing, B
Factor of
Safety
COV of Live Load
Reliability Indices for
Bearing Capacity
Reliability Indices for Punching
shear
DL LL EQ
(kN) (kN) (kN) (m) FS COV% β β
F1 1491 657 137 2.74 2.5
20 2.29 2.91
25 2.31 2.84
30 2.28 2.81
35 2.24 2.73
40 2.25 2.65
F2 2192 1271 180 3.48 2.5
20 2.37 3.08
25 2.32 3.00
30 2.30 2.94
35 2.29 2.79
40 2.25 2.70

71
Table 4.31 Effect of COV of live load on the reliability of footings considering
earthquake load for model building-3 (continued)
Footing ID
Loads Width of
footing, B
Factor of
Safety
COV of Live Load
Reliability Indices for
Bearing Capacity
Reliability Indices for Punching
shear
DL LL EQ
(kN) (kN) (kN) (m) FS COV% β β
F3 2537 2271 10 4.10 2.5
20 2.50 3.35
25 2.48 3.17
30 2.40 3.07
35 2.35 2.86
40 2.31 2.78
Fig. 4.15 Effect of COV of live load on the reliability of footings against soil bearing
capacity under earthquake loads.
1.0
1.5
2.0
2.5
3.0
10 15 20 25 30 35 40 45
Rel
iabi
lity
inde
x, β
COV of live load
Effect of COV of live load on the reliability against bearing failure of soil under earthquake loads
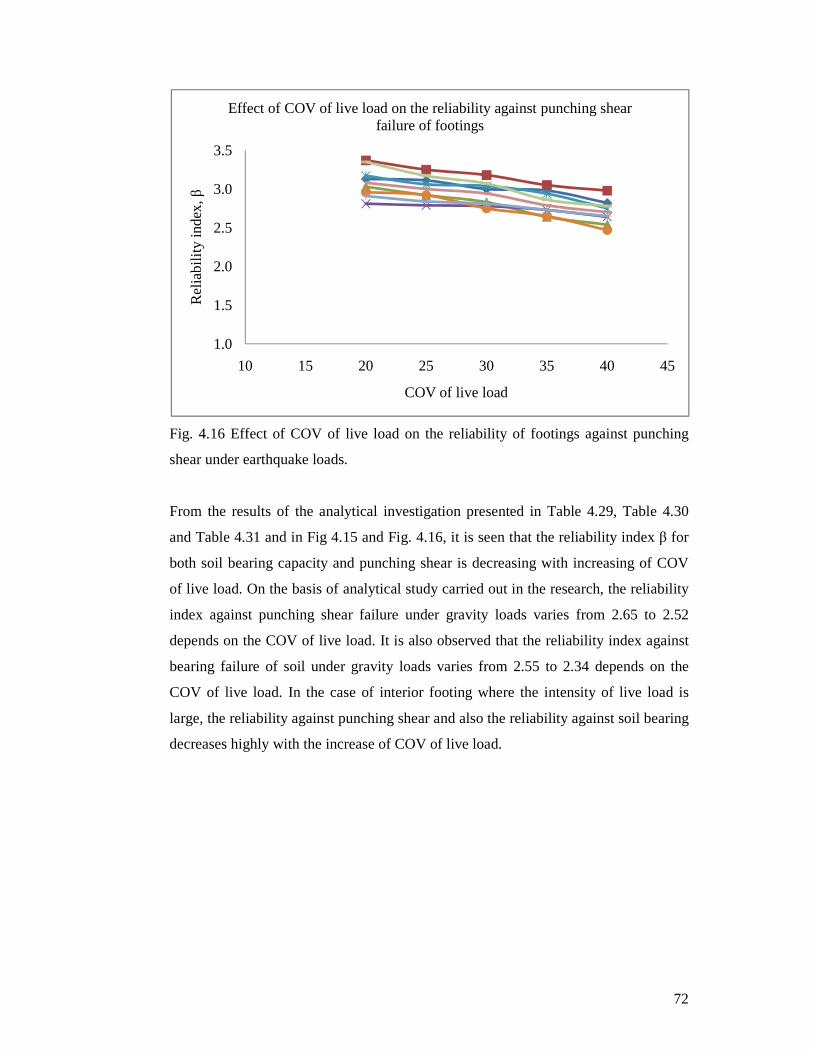
72
Fig. 4.16 Effect of COV of live load on the reliability of footings against punching
shear under earthquake loads.
From the results of the analytical investigation presented in Table 4.29, Table 4.30
and Table 4.31 and in Fig 4.15 and Fig. 4.16, it is seen that the reliability index β for
both soil bearing capacity and punching shear is decreasing with increasing of COV
of live load. On the basis of analytical study carried out in the research, the reliability
index against punching shear failure under gravity loads varies from 2.65 to 2.52
depends on the COV of live load. It is also observed that the reliability index against
bearing failure of soil under gravity loads varies from 2.55 to 2.34 depends on the
COV of live load. In the case of interior footing where the intensity of live load is
large, the reliability against punching shear and also the reliability against soil bearing
decreases highly with the increase of COV of live load.
1.0
1.5
2.0
2.5
3.0
3.5
10 15 20 25 30 35 40 45
Re
liabi
lity
inde
x, β
COV of live load
Effect of COV of live load on the reliability against punching shear failure of footings

73
4.3.12 Effect of COV of earthquake load on the reliability against soil bearing
capacity of footings
The COV of highly varied earthquake load is also unknown in context of Bangladesh.
Therefore, a wide range of COV of earthquake load is considered to evaluate the
effect of COV of earthquake load on the reliability of shallow footings under the
constant COV of soil capacity. However, the reliability of footings under the
earthquake loads having different COV values are presented in Table 4.32 for model
building-1, in Table 4.33 for model building-2, in Table 4.34 for model building-3,
respectively.
Table 4.32 Effect of COV of earthquake load on the reliability of footings for model
building-1
Footing ID
Loads Width of footing,
B
Factor of
Safety
COV of Earthquake
Load
Reliability against Bearing Capacity
DL LL EQ
(kN) (kN) (kN) (m) FS COV β
F1 810 354 68 2.02 2.5
0.60 2.38
0.80 2.36
1.00 2.33
1.20 2.32
1.40 2.31
F2 1261 635 84 2.58 2.5
0.60 2.44
0.80 2.39
1.00 2.37
1.20 2.36
1.40 2.35
F3 1505 1150 01 3.08 2.5
0.60 2.52
0.80 2.52
1.00 2.50
1.20 2.49 1.40 2.48

74
Fig. 4.17 Effect of COV of earthquake load on the reliability of footings against soil
bearing capacity for Model building-1.
Table 4.33 Effect of COV of earthquake load on the reliability of footings for model
building-2
Footing ID
Loads Width of footing,
B
Factor of
Safety
COV of Earthquake
Load
Reliability against Bearing Capacity
DL LL EQ
(kN) (kN) (kN) (m) FS COV β
F1 1146 506 94 2.41 2.5
0.60 2.39
0.80 2.37
1.00 2.36 1.20 2.35
1.40 2.30
F2 1725 990 127 3.09 2.5
0.60 2.40
0.80 2.39
1.00 2.37
1.20 2.36
1.40 2.35
F3 2005 1820 05 3.68 2.5
0.60 2.52
0.80 2.51
1.00 2.50
1.20 2.50
1.40 2.49
1.50
1.70
1.90
2.10
2.30
2.50
0.40 0.60 0.80 1.00 1.20 1.40 1.60
Rel
iabi
lity
Inde
x
COV of earthquake loads
Effect of COV of earthquake load on the reliability of footings using a FS=2.50 for constant COV of soil of 40%
Footing, F1
Footing, F2
Footing, F3

75
Fig. 4.18 Effect of COV of earthquake load on the reliability of footings against soil
bearing capacity for Model building-2.
Table 4.34 Effect of COV of earthquake load on the reliability of footings for model
building-3
Footing ID
Loads Width of footing, B
Factor of
Safety
COV of Earthquake
Load
Reliability against Bearing
Capacity DL LL EQ
(kN) (kN) (kN) (m) FS COV β
F1 1491 657 137 2.74 2.5
0.60 2.36
0.80 2.34
1.00 2.32 1.20 2.30
1.40 2.29
F2 2192 1271 180 3.48 2.5
0.60 2.40
0.80 2.35
1.00 2.34
1.20 2.33
1.40 2.32
F3 2537 2271 10 4.10 2.5
0.60 2.48
0.80 2.48
1.00 2.47
1.20 2.47
1.40 2.46
2.00
2.10
2.20
2.30
2.40
2.50
2.60
0.4 0.6 0.8 1 1.2 1.4 1.6
Rel
iabi
lity
Inde
x
COV of earthquake loads
Effect of COV of earthquake load on the reliability of footings using a FS=2.50 for constant COV of soil of 40%
Footing, F1
Footing, F2
Footing, F3

76
Fig. 4.19 Effect of COV of earthquake load on the reliability of footings against soil
bearing capacity for Model building-3.
It is seen from Table 4.32, Table 4.33 and Table 4.34 and in Fig 4.17, Fig.4.18 and
Fig. 4.19, that the reliability index β decreasing with increasing of COV of earthquake
load. On the basis of analytical study carried out in the research, the reliability index
of corner footings against bearing failure of soil under earthquake load are lower than
other footings of same building. In the case of interior footings where the intensity of
earthquake load is lower, the reliability of footings against soil bearing capacity is
approximately similar in both cases of gravity loads and under earthquake loads.
4.4 CONCLUSIONS
The structural failure probability and bearing failure probability of shallow footings
are calculated according to Monte Carlo’s Simulation (MCS) method using spread
sheet. The following conclusion can be drawn from the reliability analysis of RC
shallow footing:
(i) The failure probability of shallow footings against bearing capacity of soil
is higher than any other types of failure modes of footings.
(ii) The failure probability of shallow footings against punching shear is
higher than any other structural failure modes.
2.00
2.10
2.20
2.30
2.40
2.50
2.60
0.40 0.60 0.80 1.00 1.20 1.40 1.60
Rel
iabi
lity
Inde
x
COV of earthquake load
Effect of COV of earthquake load on the reliability of footings using a FS=2.50 for constant COV of soil of 40%
Footing, F1
Footing, F2
Footing, F3
77
(iii) The failure probability of shallow footings against one way shear and
flexural moment is not quite lower for gravity loads and the combined
gravity plus earthquake loads.
(iv) The failure probability of shallow footings against bearing capacity of soil
increases with the increase of earthquake load. However, the earthquake
load has no influence on the failure probability of shallow footings against
punching shear failure of footing.
(v) The reliability index of all footings for bearing capacity of soil is lower
than other modes of footing’s failures. And the reliability of shallow
footings against punching shear failure is second critical considering
gravity loads only. Therefore, the structural reliability of shallow footings
highly depends on the punching shear capacity of footing. In other word,
in selecting the structural reliability of footing the punching shear is
critical.
(vi) The reliability indices decrease as the load ratio increase, due to larger
variability of live load, i.e., COV = 25% as compared to COV=10% for the
dead load. It is observed that the punching reliability and bearing capacity
reliability decreases with the increase of live load to dead load ratio.
Whereas flexural reliability and one way shear reliability has minor effect
on the live load to dead load ratio.
(vii) The reliability increases with the decrease of COV of bearing capacity of
soil. When the COV of bearing capacity of soil is ≤ 30%, the reliability of
shallow footing is above average to good designed following BNBC.
(viii) The reliability index β for both soil bearing capacity and punching shear
are decreasing with increasing of COV of live load.
78
Chapter 5
CONCLUSIONS and RECOMMENDATIONS
5.1 INTRODUCTION
The main objective of the study was to evaluate the reliability of RC shallow footing
designed using Bangladesh National Building Code (BNBC), 2006. To evaluate the
reliability and corresponding failure probabilities of RC shallow footing, three model
buildings were analyzed and designed following BNBC, 2006. To achieve the
objectives of this research after the deterministic design of model buildings, the
reliability of footings of the model buildings was calculated using Monte Carlo
Simulation (MCS). The specific conclusions that are derived from the analytical
investigation carried out in the research is stated in the following sub-section.
5.2 SPECIFIC CONCLUSION
Based on the results obtained from the analytical investigation of the present study on
reliability analysis of reinforced concrete isolated shallow footings, the following
specific conclusions can be made:
(i) The reliability of footings for different failure modes is different. The
reliability against soil bearing capacity is lower than that of other failure
modes of footing designed following BNBC, 2006. The failure probability
of footings due to punching shear is larger than any other modes of
structural failure.
(ii) The failure probability of footings due to beam shear and flexural moment
is not quite low under combined gravity plus earthquake load.
(iii) The reliability decrease as the live load to dead load ratio increase, due to
larger variability of live load, that is COV = 25% as compared to
COV=10% for the dead load.
79
(iv) The reliability index β against soil bearing capacity varies from 2.49 to
2.55 using a factor of safety (FS = 2.50) under the gravity loads, while the
reliability index for that varies from 2.29 to 2.46 under earthquake load.
(v) The performance of RC shallow footings designed using BNBC, 2006 is
below average under the gravity loads, on the other hand, the performance
of footing designed using BNBC, 2006 is poor under the earthquake load.
(vi) From the results of analytical investigation of this study it is recommended
that a factor of safety (FS) = 3.50 may be used to increase the reliability of
footings under the earthquake load. Because the performance of shallow
footing designed considering FS=3.50 is above average under earthquake
load.
(vii) The reliability index for punching shear varies from 2.52 to 3.26
considering combined gravity plus earthquake loads.
(viii) The reliability of corner footings under earthquake load is lower than other
footings of same building. In the case of interior footings where
earthquake load is lower, the reliability of footings against soil bearing
capacity is approximately similar in both cases of gravity loads and under
earthquake loads.
5.3 RECOMMENDATION FOR FURTHER STUDY
The following recommendations are suggested for further study regarding the topic:
(i) The reliability of RC shallow footings can be calculated considering the effect
of wind loads.
(ii) The failure probability and corresponding reliability of RC shallow footing
may be evaluated taking the settlement of soil into account.

80
REFERENCES
A.H.-S. Ang and C.A. Cornell, 1974. Reliability bases of structure safety and design, J. Struct. Div., ASCE, 100(9), pp. 1755-1769.
A.M. Freudenthal, 1947. Safety of structures, Trans. ASCE, 112, pp. 125-180. Ang, A.H.-S. and Tang, W.H. 1975. Probability Concepts in Engineering Planning
and Design, Vol. 1, Basic Principles, John Wiley, New York.
Vanmarcke, E.H., 1977a. Probabilistic modeling of soil profiles, Journal of the Geotechnical Engineering Division, ASCE, Vol.103, No. GT11, pp.1227-1246.
Vanmarcke, E.H., 1977b. Reliability of Earth Slopes, Journal of the Geotechnical Engineering Division, ASCE, Vol. 103, No. GT11, pp. 1247-1265.
Whitman, R.V., 1984. Evaluating calculated risk in Geotechnical Engineering, The Seventeenth Terzaghi Lecture, Journal of Geotechnical Engineering, ASCE, Vol. 110, No. 2, pp. 145-188.
Li, K.S. and Lumb, P., 1987. Probabilistic design of slopes, Canadian Geotechnical
Journal, Vol. 24, No.4, pp.520-535. Oka, Y. and Wu, T. H.,1990. System reliability of slope stability. Journal of
Geotechnical Engineering, ASCE, Vol. 116, No. 8, pp. 1185-1189. Mostyn, G.R. and Soo, S. , 1992. The effect of auto-correlation on the probability of
failure of slopes, In Proceedings of 6th Australian-New Zealand Conference on Geomechanics, pp.542-546.
Tang, W. H., 1993. Recent developments in geotechnical reliability. In Probabilistic
Methods in Geotechnical Engineering, Rotterdam, pp. 3-27. Christian, J. T., Ladd, C. C., and Baecher, G. B., 1994. Reliability applied to slope
stability analysis. Journal of Geotechnical Engineering, ASCE, Vol. 120, No. 12, pp. 2180-2207.
Chowdhury, R. N. and Xu, D. W., 1995. Geotechnical system reliability of slopes,
Reliability Engineering and System Safety, Vol. 47, No. 3, pp. 141-151. Morgenstern, N.R., 1997. Towards landslide risk assessment in practice, Landslide
risk assessment (Eds. Cruden and Fell), Balkema, Rotterdam, pp. 15-24.
Phoon, K.K. and Kulhawy, F.H., 1999a. Characterization of geotechnical variability,
Canadian Geotechnical Journal, Vol. 36, pp. 612-624.
81
Phoon, K.K. and Kulhawy, F.H., 1999b. Evaluation of geotechnical property
variability, Canadian Geotechnical Journal, Vol. 36, pp. 625-639. Duncan, J.M., 2000. Factors of safety and reliability in geotechnical engineering,
Journal of Geotechnical and Geoenvironmental Engineering, ASCE, Vol.126, No.4, pp. 307-316.
Lacasse, S., 2001. Terzaghi lecture, unpublished.
Phoon, K.K., Becker, D.E., Kulhawy, F.H., Honjo, Y, Ovesen, N.K., and Lo, S.R., 2003b. Why Consider Reliability Analysis for Geotechnical Limit State Design?, LSD2003: International Workshop on Limit State Design in Geotechnical Engineering Practice, Phoon, Honjo & Gilbert (eds), World Scientific Publishing Company.
Christian, J.T. (2004). Geotechnical Engineering Reliability: How well do we know what we are doing?, Geotechnical and Geoenvironmental Engineering, ASCE, Vol. 130, No.10, pp. 985-1003.
Nowak, A. S., Collins K. R., 2000. Reliability of Structures, McGraw-Hill International Editions, Civil Engineering Series, Singapore.
Ranganathan, R., 1999. Structural Reliability Analysis and Design, Jaico Publishing House, Mumbai.
AISC Steel Construction Manual, 2005. 13th edition, American Institute of Steel Construction, Chicago.
CSA, 1998. Canadian Highway Bridge Design Code, Canadian Standards Association, Rexdale, Ontario, Canada.
AASHTO, 1994. AASHTO LRFD Bridge Design Specifications, American Association of State Highway and Transportation Officials, Washington, 1994.
AASHTO, 1997. Guide Specifications for Seismic Isolation Design, American Association of State Highway and Transportation Officials, Washington.
BNBC, 2006. Bangladesh National Building Code. Housing and Building Research Institute, Mirpur, Dhaka, and Bangladesh Standards and Testing Institution, Tejgaon Dhaka, 2nd edition.
USACE, 1997. Engineering and design: Introduction to probability and reliability methods for use in geotechnical engineering. U.S. Army Corps of Engineers, Engineer Technical Letter 1110–2–547, Dept. of the Army, Washington, D.C.
ASCE7-05, 2005. Minimum Design Loads for Buildings and Other Structures, American Society of Civil Engineers.

82
ETABS V9.7.4 Extended 3D Analysis of Building Systems Software, Computers and Structures, Nonlinear Version 9.7.4, Inc.: Berkeley, CA.
Ellingwood, B., Galambos, T. V., McGregor, J. G., Cornell, C. A., 1980. Development of a Probability Based Load Criterion for American National Standard A58, NBS Special Report 577, U.S. Department of Commerce, National Bureau of Standards.
Galambos, T. V., Ellingwood, B., MacGregor, J. G., and Cornell, C. A., 1982. Probability-based load criteria: assessment of current design practice. J. Struct. Div., ASCE, 108(5), 959–977.
ASCE 7-95, 1995. Minimum design loads for buildings and other structures, American society of civil engineers, ASCE, NY.
Nowak, A.S., 1994, Load Model for Bridge Design Code, Canadian Journal of Civil Engineering, Vol. 21, pp. 36-49.
Mirza S. A., Hatzinikolas, M., MacGregor, J. G., 1979. Statistical Descriptions of the Strength of Concrete, Journal of Structural Division, ASCE, Vol. 105, No. ST6, June, pp.1021-1037.
Mirza S. A., 1996. Reliability based design of reinforced concrete columns, Journal of structural safety, v.18 n 2/3.
Mirza, S. and MacGregor, J., 1979. Variability of Mechanical Properties of Reinforcing Bars, J. Struct. Div., ASCE, Vol. 105, No. St 5, May, pp. 921-937.
Low, H. Y. and Hao, H., 2001. Reliability analysis of reinforced concrete slabs under explosive loading, Struct. Safety, 23, pp. 157–178.
Galambos, T.V. & Ravindra, M.K., 1978. Properties of steel for use in LRFD. Journal of the Structural Division 104(9), pp. 1459-1468.
Arafah, A., 1997. Statistics for Concrete and Steel Quality in Saudi Arabia, Magazine of Concrete Research, London, Vol. 49, No. 180, September, pp. 185-194.
Phoon, K. K., Kulhawy, F. H., and Grigoriu, M. D., 1995. Reliability based foundation design for transmission line structures. Rep. No. TR-105000, Electric Power Research Institute, Palo Alto, Calif.
Spry, M. J., Kulhawy, F. H., and Grigoriu, M. D., 1988. Reliability based foundation design for transmission line structures: Geotechnical site characterization strategy. Rep. No. EL-5507(1), Electric Power Research Institute, Palo Alto, Calif.
Phoon, K.-K. & Kulhawy, F.H., 1999. Evaluation of geotechnical property variability. Canadian Geotechnical Journal, 36(4), pp.625–639.

83
Foye, K.C., Salgado, R. & Scott, B., 2006b. Resistance Factors for Use in Shallow Foundation LRFD. Journal of Geotechnical and Geoenvironmental Engineering, 132(9), pp.1208–1218.
Phoon, K. K. & Kulhawy, F. H., 1999a. Characterization of geotechnical variability, Canadian Geotech. J. 36(4): pp. 612-624.
Reese, L. C., Cox, W. R. & Coop, F. D., 1974. Analysis of laterally loaded piles in sand. In Proc. 6th 20th Offshore Tech. Conf. (2): pp. 473 - 483, Houston.
Chen, Y-J. & Kulhawy, F. H., 1994. Case history evaluation of behavior of drilled shafts under axial and lateral loading. Report TR-104601, Electric Power Research Institute, Palo Alto.
Kulhawy, F. H. & Phoon, K. K.,1996. Engineering judgment in the evolution from deterministic to reliability-based foundation design. In Uncertainty in the Geologic Environment - From Theory to Practice (GSP 58), ASCE: 29-48, New York.
Phoon, K. K. & Kulhawy, F. H., 2002. EPRI study on LRFD and MRFD for transmission line structure foundations. In Proc. Intl. Workshop on Foundation Design Codes & Soil Investigation in view of International Harmonization & Performance Based Design, Kamakura.
Lee, I. K., White, W. & Ingles, O. G., 1983. Geotechnical Engineering. Boston, Pitman.
Phoon, K.-K., and Kulhawy, F.H. , 2003. Evaluation of model uncertainties for reliability-based foundation design. In Applications of statistics and probability in civil engineering. Edited by A. Der Kiureghian, S. Madanat, and J.M. Pestana. Millpress, Rotterdam, the Netherlands. pp. 1351–1356.
J.G. MacGregor, S.A. Mirza and B.R. Ellingwood, 1983. Statistical analysis of resistance of reinforced and prestressed concrete members, ACI J., 80(3) 167-176.
Renjian Lu, Yuanhui Luo, Joel P. Conte,1994. Reliability evaluation of reinforced concrete beams, Journal of structural safety, ELSIVER, vol. 4, pp. 277-298.
Luo et al., 1995. Seismic Reliability Assessment of Existing R/C Flat-Slab Buildings, Journal of Structural Engineering, ASCE, October.
Y.H. Luo, A. Durani and J. Conte, 1995. Seismic reliability assessment of R.C. flat slab buildings, Journal of Structural Engineering, vol.121, No.10, October, ASCE, pp.1522- 1530.
Aydemir, C. & Zorbozan, M., 2012. Uncertainty Analysis of Flexural Overstrength Ratio for RC Columns. Journal of Structural Engineering, 138(8), pp.1042–1053.
84
Cardoso, J.B. et al., 2008. Structural reliability analysis using Monte Carlo simulation and neural networks. Advances in Engineering Software, 39(6), pp. 505–513.
Foye, K.C., Salgado, R. & Scott, B., 2006a. Assessment of Variable Uncertainties for Reliability-Based Design of Foundations. Journal of Geotechnical and Geoenvironmental Engineering, 132(9), pp.1197–1207.
Low, B.K., 2005. Reliability-based design applied to retaining walls. Géotechnique, 55(1), pp.63–75.
Ellingwood, B.R., 2001. Earthquake risk assessment of building structures. Reliability Engineering & System Safety, 74(3), pp.251–262
Low, B.K. & Tang, W.H., 1997. Probabilistic slope analysis using Janbu’s generalized procedure of slices. Computers and Geotechnics, 21(2), pp.121–142.
Phoon, K.-K., Kulhawy, F.H. & Grigoriu, M.D., 2000. Reliability-based design for transmission line structure foundations. Computers and Geotechnics, 26(3-4), pp.169–185.
Wang, Y. & Kulhawy, F.H., 2008. Reliability Index for Serviceability Limit State of Building Foundations. Journal of Geotechnical and Geoenvironmental Engineering, 134(11), pp.1587–1594.
Lu, W., 2006. Failure probabilities of reinforced concrete column footings. Journal of the Chinese Institute of Engineers, 29(4), pp.733–739
Ellingwood, B., 1978. Reliability Basis of Load and Resistance Factors for Reinforced Concrete Design, NBS Building Science Series 110, National Bureau of Standards, Washington, D.C., Feb.
Diniz, S.M.C. & Frangopol, D.M., 1997. Reliability Bases for High-Strength Concrete Columns. Journal of Structural Engineering, 123(10), pp.1375–1381.
Dueñas-Osorio, L. & Padgett, J.E., 2011. Seismic Reliability Assessment of Bridges with User-Defined System Failure Events. Journal of Engineering Mechanics, 137(10), pp.680–690.
Ito, K., and Sumikama, A., 1985. "Probabilistic Study of Reduction Coefficient for Balanced Steel Ratio in the ACI Code, " ACI Journal, Septemper-October, pp. 701-709.
Guo, Y., Trejo, D. & Yim, S., 2014. New Model for Estimating the Time-Variant Seismic Performance of Corroding RC Bridge Columns. Journal of Structural Engineering, pp.401-415
Scott, B., Kim, B.J. & Salgado, R., 2003. Assessment of Current Load Factors for Use in Geotechnical Load and Resistance Factor Design. Journal of Geotechnical and Geoenvironmental Engineering, 129(4), pp.287–295

85
B.R. Ellingwood and A.H.-S. Ang, 1974. Risk-based evaluation of design criteria, J. Struct. Div. ASCE, 100(9),1771-1788.
M. Israel, B. Ellingwood and R. Corotis,1987. Reliability-based code formulation for reinforced concrete buildings, J. Struct. DiLl., ASCE, 113(10), pp. 2235-2251.
Benjamin, J.R. and Cornel, C.A. “Probability, Statistics and decision for civil engineering”, McGraw-Hill, New York.
Low, B. K., and Phoon, K. K.,2002. Practical first-order reliability computations using spreadsheet. Proc., Probabilistics in Geotechnics:Technical and Economic Risk Estimation, 39–46.
86
SYMBOLS and NOTATIONS
fy Yield strength of steel
fcʹ Cylinder strength of concrete
\78′ A measure of concrete splitting strength
DL Dead Load
LL Live Load
EQ Earthquake Load
γ Unit weight of soil
Bf Flexural model uncertainty
Bv Shear model uncertainty (ACI)
Bv Punching shear model uncertainty for seismic loads
Bv Punching shear model uncertainty for gravity loads
qu Bearing capacity of soil based on N value
��� Inverse of the standard normal cumulative distribution function
CDF Cumulative distribution function
COV Coefficient of variation
pdf Probability density function
FORM First Order Reliability Method
SORM Second Order Reliability Method
MCS Monte Carlo Simulation �� Load Variable �� Resistance variable � Reliability index �� Probability of failure
g Performance function �� Mean value of resistance �� Mean value of Loads
BNBC Bangladesh National Building Code
SPT Standard Penetration Test
D Depth of foundation
B Width of footing