Embed Size (px)
Citation preview
ISSN (ONLINE): 2395-695X
ISSN (PRINT): 2395-695X
International Journal of Advanced Research in Basic Engineering Sciences and Technology (IJARBEST) Vol. 2, Issue 12, December 2016
Arul Marcel Moshi. A ; Hari Kamal Pitchiah © IJARBEST PUBLICATIONS
Quantification of Rate of Air Pollution By Means of
Statistical Data Collections from Hospitals
1Arul Marcel Moshi.A and 2Hari Kamal Pitchiah 1Assistant professor, Department of Mechanical Engineering, National Engineering College, Kovilpatti – 628 503.
2UG Scholar, Department of Mechanical Engineering, National Engineering College, Kovilpatti – 628 503.
Corresponding Author – [email protected]
Abstract- To develop efficient strategies for pollution control, it is essential to assess
both the costs of control and the benefits that may result. These benefits will often include
improvements in public health, including reductions in both morbidity and premature
mortality. Until recently, there has been little guidance about how to calculate the benefits
of air pollution controls and how to use those estimates to assign priorities to different air
pollution control strategies. In this work, a method is described for quantifying the benefits
of reduced ambient concentrations of pollutants (such as ozone and particulate matter)
typically found in urban areas worldwide. The method applies the data on Jakara, Indonesia,
an area characterized by little wind, high population density (8 million people), congested
roads, and ambient air pollution. The magnitude of the benefits of pollution control depends
on the level of air pollution, the expected effects on health of the pollutants (dose-response),
the size of the population affected, and the economic value of these effects. In the case of
Jakarta, the methodology suggests that reducing exposure to lead and nitrogen dioxide
should also be a high priority. An important consequence of ambient lead pollution is a
reduction in learning abilities for children, measured as I.Q. loss. Apart from that, reducing
the proportion of respirable particles can reduce the amount of illness and premature
mortality.
Key words: air pollution, ozone, particulate matter, respirable particles, lead, nitrogen
dioxide.
I. INTRODUCTION
Until recently, there has been little guidance about the calculation of the social costs of air
pollution and about using these costs to evaluate alternative air pollution control strategies. With
limited resources, rational decision-making requires some quantification of the potential benefits
of controlling air pollution. These benefits are dependent on the expected health effects of the
pollutant, the magnitude of the effect in response to air pollution (dose-response), the economic
valuation of the adverse effect, and the existence of subpopulations particularly sensitive to air
pollution. Information about health and economic effects of air pollution needs to be categorized
for pollutants commonly discharged by mobile and stationary sources. This work describes a
method for determining quantitative estimates of the benefits of reducing ambient concentrations
of five pollutants: particulate matter, sulfur dioxide, nitrogen dioxide, ozone and lead. This
1
ISSN (ONLINE): 2395-695X
ISSN (PRINT): 2395-695X
International Journal of Advanced Research in Basic Engineering Sciences and Technology (IJARBEST) Vol. 2, Issue 12, December 2016
Arul Marcel Moshi. A ; Hari Kamal Pitchiah © IJARBEST PUBLICATIONS
methodology is then applied to Jakara, Indonesia. A brief review of the effects of carbon monoxide
and carbon dioxide is also provided. Once the benefits (both quantified and unquantified) of
control are calculated, they can be incorporated in decisions about prioritizing control strategies.
For cost-benefit analysis of air pollution control, a common denomination for various health
effects would be used. It could be based on willingness to pay, medical treatment costs and the
value of lost productive days and years. Such valuation is beyond the scope of this paper, however.
It should be acknowledged, however, that large uncertainties about the existence and
magnitude of the health effects of air pollution continue to exist. Therefore, the analysis provided
below should be viewed as an attempt to present the most likely and well-documented health
impacts for which quantitative information exists.
In the past, the U.S. Environmental Protection Agency has estimated the health and welfare
effects of air pollution in its Regulatory Impact Analysis for national ambient air quality standards,
as required by the Presidential Executive Order #12291 issued in 1981. Additional information
and methodological improvements were incorporated in the subsequent analysis of economic
benefits of air quality programs in selected U.S. locations. Recently, broad estimates of the health
benefits of controlling ozone and particulate matter were provided for both the U.S. and for the
ambitious control plans being considered in Southern California.
The analysis reported here uses a similar approach to estimate health effects of criteria
pollutants in Jakarta, with two improvements: the most recent set of research findings are utilized
and a full range of health endpoints are included. Dose-response functions that relate various health
outcomes to air pollution are taken from the available peer reviewed literature. Estimates of
selected health effects of air pollution are generated by applying these functions to ambient levels
either observed from monitoring stations located throughout the city or estimated from available
dispersion models. Using results from both time-series and cross-sectional epidemiologic analyses
from the United States, Canada, and Britain, effects are estimated for such health outcomes as
premature mortality, hospital visits and admissions, emergency room visits, restrictions in activity,
acute respiratory symptoms, acute bronchitis in children, asthma attacks, IQ loss, and blood
pressure changes. At this time, however, because of uncertainties about the coverage and
representativeness of the existing monitors in the city, and about the applicability of health studies
undertaken in the U.S. to the developing world, the results should be viewed as providing only
general estimates of the impacts of air pollution.
II. METHODOLOGY AND BASELINE ASSUMPTIONS FOR ESTIMATING HEALTH EFFECTS
The estimation of the health and economic effects of air pollution involves the use of
methodology similar to that used by the U.S. Environmental Protection Agency (EPA) in their
Regulatory Impact Analysis for a new national air quality standard for particulate matter.
Estimation techniques are also derived from the analyses of economic benefits of air quality
control programs in selected U.S. locations. To estimate the economic value associated with
changes in air pollution, four factors must be determined: the dose-response relationships, the
susceptible populations, the relevant change in air pollution, and an economic valuation of the
health endpoints. In this work, health effects for a range of health outcomes are provided, while
valuation of these is not performed.
2
ISSN (ONLINE): 2395-695X
ISSN (PRINT): 2395-695X
International Journal of Advanced Research in Basic Engineering Sciences and Technology (IJARBEST) Vol. 2, Issue 12, December 2016
Arul Marcel Moshi. A ; Hari Kamal Pitchiah © IJARBEST PUBLICATIONS
The first step is to develop estimates of the effects of air pollution on various health
outcomes. Dose-response functions chat relate health impacts to ambient levels of air pollution are
taken from the published epidemiologic literature. This step involves calculating the partial
derivative (or slope, b) of the dose-response function, to provide an estimate of the change in the
prevalence of a given health effect associated with a change in outdoor air quality (A). Sufficient
information is provided in this report to understand the sources of the selected dose-response
functions, but a more complete review of the literature can be obtained in the EPA scientific review
of the health effects of criteria pollutants?
The next step involves multiplying this slope by the relevant population that is believed to
be exposed and susceptible to the air pollutant effect under consideration (POP@. For certain
pollution-related health effects this may include the entire exposed population; for other effects
there may be particularly sensitive subgroups such as children or asthmatics.
A third step in the calculation of health effects of air pollution involves the change in air
quality (dA) under consideration. The actual change is dependent on both the policy issue under
consideration and the available data. For example, it may be relevant to consider the change from
current air pollution levels to some ambient air quality standard, either a local one, the EPA
standard, or the WHO air quality guideline. A second change that might be relevant for
consideration is a given percent reduction, such as 10 percent. A third method of determining the
relevant change in air pollution is to assume that air quality changes in some simple proportion to
the change in emissions, as in a simple linear rollback model. In that case, a 10 reduction in the
total tonnage of particulate emissions, for example, is assumed to reduce ambient particulate air
pollution and health effects by 10 percent. Finally, the ambient changes associated with a given
change in a stationary or area-wide pollution source can be calculated through use of computer
models, if the necessary data are available.
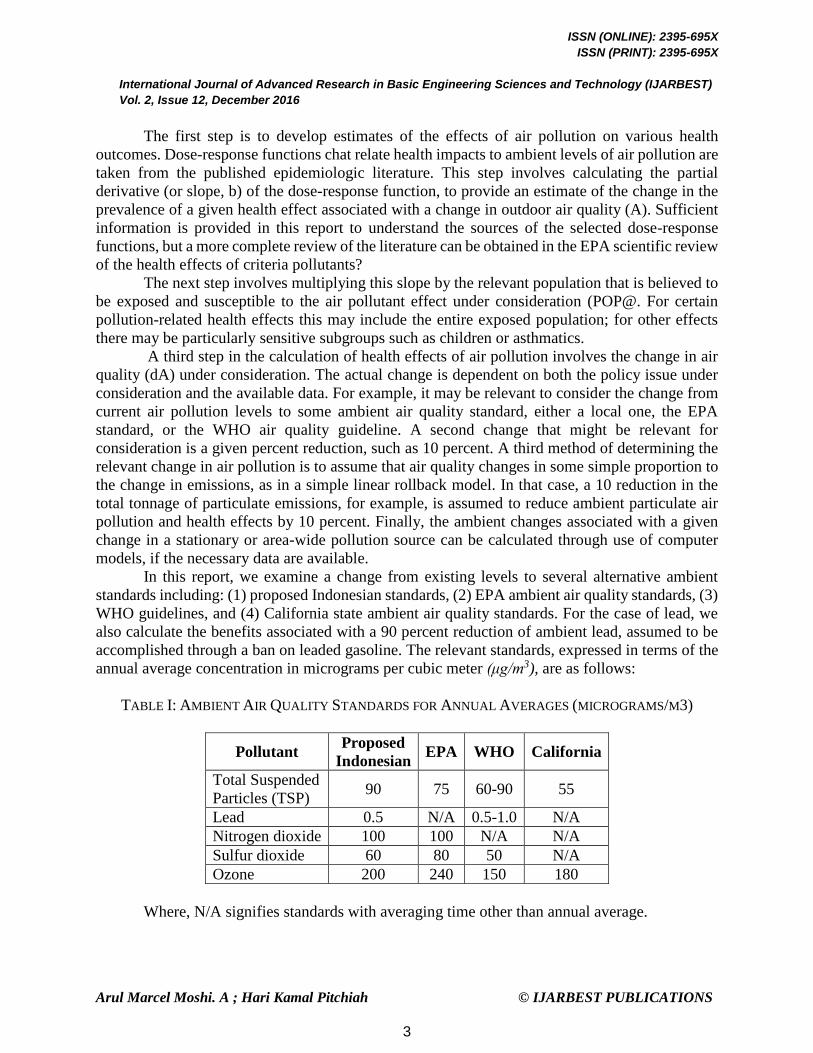
In this report, we examine a change from existing levels to several alternative ambient
standards including: (1) proposed Indonesian standards, (2) EPA ambient air quality standards, (3)
WHO guidelines, and (4) California state ambient air quality standards. For the case of lead, we
also calculate the benefits associated with a 90 percent reduction of ambient lead, assumed to be
accomplished through a ban on leaded gasoline. The relevant standards, expressed in terms of the
annual average concentration in micrograms per cubic meter (μg/m3), are as follows:
TABLE I: AMBIENT AIR QUALITY STANDARDS FOR ANNUAL AVERAGES (MICROGRAMS/M3)
Pollutant Proposed
Indonesian EPA WHO California
Total Suspended
Particles (TSP) 90 75 60-90 55
Lead 0.5 N/A 0.5-1.0 N/A
Nitrogen dioxide 100 100 N/A N/A
Sulfur dioxide 60 80 50 N/A
Ozone 200 240 150 180
Where, N/A signifies standards with averaging time other than annual average.
3
ISSN (ONLINE): 2395-695X
ISSN (PRINT): 2395-695X
International Journal of Advanced Research in Basic Engineering Sciences and Technology (IJARBEST) Vol. 2, Issue 12, December 2016
Arul Marcel Moshi. A ; Hari Kamal Pitchiah © IJARBEST PUBLICATIONS
2.1 Baseline Assumptions
An important question in all of the health effects estimates is whether a threshold level
exists, below which health effects no longer occur, or whether the slope of the dose-response
function diminishes significantly at lower concentrations. There is a presumption by some that a
threshold exists at the EPA air quality standard, or at the WHO ambient guidelines for criteria
pollutants. Most of the studies reported here have estimated linear or log-linear functions
suggesting a continuum of effects down to the lowest levels, and have not specifically identified a
threshold level. When efforts have been made to identify a threshold, little conclusive evidence
has been found that one exists. In fact, many recent epidemiologic studies report an association
between air pollution and health at ambient concentrations at or below the current federal standard.
The former Administrator of the EPA has stated, in a heterogeneous population it is unlikely that,
for any pollutant, there will be a single scientifically defensible threshold applicable to all people.
Instead, there will be a series of thresholds for different sensitive populations and a threshold of
zero for some people. Therefore, for this report, we calculate the effects of bringing pollution down
to alternative standards, without taking a position on what would happen at even lower pollution
levels.
A basic assumption of the model is that the association between air pollution and health
estimated in the cited studies can be applied to estimate the health impact in Jakarta. These studies
show that when the readings at fixed site monitors change, there is a change in the observed
incidence of many health effects. Although the monitors do not measure actual exposures, they do
provide a general measure of air quality which is obviously related to ultimate exposure. The use
of these results implicitly assumes a similar distribution of baseline factors - health status (e.g.,
incidence of chronic disease), chemical composition of pollutants, occupational exposures,
seasonality, time spent out of doors, general activity and that results from other studies can be
applied to the study area. As described in greater detail in Section V, since the baseline health
status in developing countries tends to be poorer than that experienced in the western, developed
world, this assumption will likely lead to an underestimate of the more severe health outcomes.
Another source of underestimation will be present since the population is assigned a pollution
concentration based on their residential location. Effects of air pollution will be higher if the person
commutes to the central business district and the subsequent higher exposures are incorporated
into the analysis. Therefore, the quantitative assessment of health effects presented below is likely
to be underestimates.
2.2 Review of health effects and provision of dose-response functions
For this report, dose-response functions have been identified and adapted from published
epidemiologic and economics literature. These functions allow the estimation of the change in
health effects that would be expected to occur with changes in ambient pollution levels. For each
health effect, a range is presented within which the estimated effect is likely to fall. The central
estimate is typically selected from the middle of the range reported in a given study, or is based on
the most recent study using the most reliable estimation methods available. When several different
studies are available for a given health effect, the range reflects the variation in results observed
across the studies. When only one study is available, the range is based on the statistical confidence
that can be placed on the reported results.
4
ISSN (ONLINE): 2395-695X
ISSN (PRINT): 2395-695X
International Journal of Advanced Research in Basic Engineering Sciences and Technology (IJARBEST) Vol. 2, Issue 12, December 2016
Arul Marcel Moshi. A ; Hari Kamal Pitchiah © IJARBEST PUBLICATIONS
The reported epidemiologic investigations involve two principal study designs: statistical
inference based on time-series and cross-sectional data sets. Time-series analysis examines
changes in a health outcome within a specific area as air pollution levels fluctuate over time. A
cross-sectional analysis compares the rate or prevalence of given health outcomes across several
locations for a given point in time. The time-series studies have the distinct advantage of reducing
or eliminating the problems associated with confounding or omitted variables, a common concern
in the cross-sectional studies. Since the population characteristics are basically constant over the
study period, the only factors that may vary with daily mortality are environmental and
meteorologic conditions. In general, researchers are able to more easily elicit tie effects of air
pollution and weather on health in the time-series studies. Therefore, this review focuses primarily
on time-series studies. The use and extrapolation of results from time-series analysis, however, is
predicated on its applicability to other areas and for ocher time periods.
III. DEVELOPMENT OF DOSE-RESPONSE ESTIMATES
3.1 Particulate Matter
Epidemiologic studies provide dose-response relationships between concentrations of
ambient particulate matter and several adverse health outcomes including: mortality, respiratory
hospital admissions, emergency room visits, and restricted activity days for adults, lower
respiratory illness for children, asthma attacks, and chronic disease. Among these studies,
statistically significant relationships have been found using several alternative measures of
particulate matter, including TSP, fine particles (particles less than 2.5 microns in diameter),
British smoke, coefficient of haze (COH) and sulfates.
3.1.1 Respiratory Hospital Admission
Plagiannakos and Parker used pooled cross-sectional and time-series data for nine counties
in their study for the period 1976 to 1982 Southern Ontario, Canada. A statistically significant
relationship was found between the incidences of hospital admissions due to respiratory diseases
(RHA). Additional evidence for an effect of particulates on hospital admissions is provided by a
study by Pope.' In this study a statistically significant association was found between monthly
RHA, including admissions for pneumonia, asthma and bronchitis, and monthly average PM1O in
two valleys in Utah studied between 1985 and 1989. Ozone concentrations were close to baseline
during the winter seasons when both PM1O and RHA were elevated so the effect appears to be
mostly related to particles.
3.1.2 Emergency Room Visits
Samet et al., analyzed the relationship between emergency room visits (ERV) and air
pollution levels in Steubenville, Ohio, an industrial town in the mid western United States. Daily
ERV (mean 94.3) at the primary hospital in the area were matched with daily levels of total
suspended particulates (TSP), sulfur dioxide levels, and nitrogen dioxide levels for March, April,
5
ISSN (ONLINE): 2395-695X
ISSN (PRINT): 2395-695X
International Journal of Advanced Research in Basic Engineering Sciences and Technology (IJARBEST) Vol. 2, Issue 12, December 2016
Arul Marcel Moshi. A ; Hari Kamal Pitchiah © IJARBEST PUBLICATIONS
October, and November of 1974 through 1977. Daily ERV were regressed on maximum
temperature and each of the pollutants in separate runs. The particulates and sulfur dioxide
coefficients were statistically significant in separate regression, but these measures were highly
correlated.
3.1.3 Restricted Activity Days
Restricted activity days (RAD) include days spent in bed, days missed from work, and
other days when activities are significantly restricted due to illness. Ostro examined the
relationship between adult RAD in a two week period and fine particles (FP. diameter less than
2.5 microns) in the same two week period for 49 metropolitan areas in the United States. The RAD
data were from the Health Interview Survey conducted annually by the National Center for Health
Statistics. The FP data were estimated from visual range data available for airports in each area.
Since fine particles have a more significant impact on visual range than do large suspended
particles, a direct relationship can be estimated between visual range and FP.
3.1.4 Lower Respiratory Illness in Children
Estimates of lower respiratory illness in children are based on an analysis by Dockery et
al., of children in six cities in the United States. The study related TSP, PM15, PM2.5 and sulfate
levels to the presence of chronic cough, bronchitis, and a composite index of respiratory illness
(prevalence of cough, bronchitis, or respiratory illness) as measured during health examinations of
samples of children in each city. A logistic regression analysis was used to estimate the relationship
between the probability of an illness being present and the average of the 24-hour mean
concentrations during the year preceding the health examination. Due to the likely overlap of the
health endpoint measures, only the results for bronchitis is used, noting that this could include
chronic cough or a more general respiratory illness. The results are applied to the population age
17 and below (17.07 percent of the total population)
3.1.5 Asthma Attacks
Several studies have related air pollution to increases in exacerbation of asthma. For
example, in a study of asthmatics in Los Angeles, Whittermore and Korn reported a relationship
between exacerbations of asthma and daily concentrations of TSP and ozone using logistic
regression analysis. Also, Ostro et al. recently reported an association between several different
air pollutants, including sulfates, and increases in asthma attacks among adults residing in Denver.
Additional evidence for an effect of particulate matter on asthmatic children is provided by Pope
et al., This study examines the effects of air pollution on a clinic-based sample and from a school-
based (and relatively untreated) sample. Associations were reported between particulate matter,
measured as PM10, and both respiratory symptoms and the use of medication.
6
ISSN (ONLINE): 2395-695X
ISSN (PRINT): 2395-695X
International Journal of Advanced Research in Basic Engineering Sciences and Technology (IJARBEST) Vol. 2, Issue 12, December 2016
Arul Marcel Moshi. A ; Hari Kamal Pitchiah © IJARBEST PUBLICATIONS
3.1.6 Respiratory Symptoms
Respiratory symptoms are an additional measure of acute effects of air pollution. Results
of Krupnick et al., can be used to determine the effects of particulate matter. This study examined
the daily occurrence of upper and lower respiratory symptom among a panel of adults in Southern
California. A Markov process model was developed to determine the effects of air pollution on
health which incorporated the probability of illness on the prior day and controlled for
autocorrelation. Among the pollutants examined independently, coefficient of haze (COH) was
found to be statistically associated with the probability of reporting a symptom (b=0.0126, s.e. =
.0032). Data from the study suggest a ratio of COH (units/100 ft) and TSP of 0.116. The marginal
effect of COH was calculated by incorporating the stationary probabilities as described in the
paper.
3.1.7 Chronic Bronchitis
Recent epidemiologic studies have related long-term exposure of air pollution to a higher
prevalence of chronic respiratory disease or significant decrements in lung function. For example,
Detels et al., found that residents living in the Los Angeles air basin who were expressed over a
long period of time to relatively high levels of particulates and oxides of sulfur and nitrogen had
significantly lower lung function than a cohort less exposed. Abbey et al., conducted a study on
6,600 Seventh Day Adventists, nonsmokers who had lived for at least 11 years in California. In
this study, participants above age 25 (n=3914) were matched with 10 years of exposure to ambient
pollutants based on their monthly residential location.
3.2 Sulfur Dioxide
Effects of sulfur dioxide (SO2 on the respiratory system have been observed after either
short term (less than one hour average) or longer term (24-hour average or longer) exposures.
Several recent epidemiologic studies indicate that changes in 24-hour average exposure to S02 my
affect lung function, the incidence of respiratory symptoms and diseases, and risks of mortality.
These studies have been conducted in different geographic locations and climates, and with
different populations and co varying pollutants. Although many of these investigations also
indicate that particulate matter or ozone was associated with these adverse health outcomes,
several studies appear to show an effect of SO2 alone. Furthermore, in some of the publications
reporting an effect of both S02 and particulates, they are highly correlated, but in others, the
correlation of the daily levels is only weak to moderate. Thus, it is possible to infer an effect of
SOQ or a sulfur species highly related to SO.
TABLE II: EFFECTS OF 10 PGLM3 CHANGE IN SO2 CONCENTRATIONS
Central Estimate Higher Estimate
Mortality(percent change) 0.48 1.21
Respiratory Symptoms
1,000 child/year 0.18 0.26
Chest Discomfort/adult/year 0.10 0.15
7
ISSN (ONLINE): 2395-695X
ISSN (PRINT): 2395-695X
International Journal of Advanced Research in Basic Engineering Sciences and Technology (IJARBEST) Vol. 2, Issue 12, December 2016
Arul Marcel Moshi. A ; Hari Kamal Pitchiah © IJARBEST PUBLICATIONS
3.3 Ozone
Ozone is the primary component of photochemical smog. As such, it has been associated
with several adverse respiratory outcomes including increased upper and lower respiratory
symptoms, eye irritation (oxidants), restrictions in activity, and exacerbation of asthma. Most of
the evidence of the effects of ozone is derived from clinical studies in which subjects are exposed
to a known amount of ozone in a controlled setting. For example, healthy individuals may be
exposed to moderate levels of ozone in a chamber while engaging in moderate exercise.
Unfortunately, these studies usually focus on changes in lung function and less so on increases in
symptoms. Also, it is difficult to develop dose-response functions from some of these studies or
extrapolate from their findings to the free-living population. However, several epidemiologic
studies are available and provide a basis for dose-response estimates.
3.3.1 Respiratory Hospital Admissions
Current evidence indicates that ozone may be associated with hospital admissions related
to respiratory disease (RHA)35- This possibility is supported by findings from panel studies of
asthmatics indicating that exacerbations occur in response to ozone. Clearly, some of these
exacerbations may result in either emergency room visits or hospital admissions. Unfortunately,
because of the high covariation between ozone and other pollutants in the summer when most of
the studies have been undertaken, it is difficult to determine the effect on RHA attributable to
ozone alone. However, by using information from several studies, it is possible to begin to
apportion the effects of the different pollutants. Thurston et al.53 found a significant association
between RHA and both ozone and sulfates in New York City (the Bronx) and Buffalo in the
summer 1988- In this analysis, corrections for autocorrelation and day-of-week effects were made.
At the mean, the effect of ozone was approximately twice the effect observed for sulfates. Burnett
et al.4 also reported a statistically significant association between hospital admissions and both
ozone and sulfates in Ontario, Canada for the years 1983 through 1988. Their findings suggest that
the ozone effect was approximately 3 times that of sulfates, based on a regression equation that
included both pollutants. Therefore, it is reasonable to apportion the effects of RHA based on the
relative coefficients in Thurston et al. The average of the coefficients for the two cities in that
paper is 2L .3 RHA per day/ million/ppm ozone, which becomes the central estimate, with a
standard error of 10.9.
TABLE III: EFFECTS OF 1 PPM CHANGE IN OZONE
Central Estimate High Estimate
Hospital Admissions/persons 0.0077 0.012
Minor Restrictions in Activity/person 34.0 51.0
Respiratory Symptoms/person 54.75 96.6
Eye Irritation/adult 26.6 29.9
Asthma Exacerbation/asthmatic 68.44 189.8
8
ISSN (ONLINE): 2395-695X
ISSN (PRINT): 2395-695X
International Journal of Advanced Research in Basic Engineering Sciences and Technology (IJARBEST) Vol. 2, Issue 12, December 2016
Arul Marcel Moshi. A ; Hari Kamal Pitchiah © IJARBEST PUBLICATIONS
IV. CONCLUSION
The rate of pollution is increasing day by day due to the development of technology
and various processes which gives us an inevitable condition is inevitable. It is necessary to keep
an eye on the pollution levels and its effects by comparing it with certain standard level so as to
make sure that the pollution is subjugated below the parlous level. The above literature gives a
brief idea about the pollution levels of certain hospital in an area which could be used further as a
reference for other pollution sources to limit the emission below the perilous stage. The state of
jeopardy can be brought under control if we follow standardization in pollution levels and give us
prior idea about preempting the recurrence of the particular pollution sources. On the whole,
pollution is going to be a vital threat for the living beings in our planet and it will ruin various
ecosystems explicitly if it is not taken into our serious consideration.
REFERENCES
[1] Richa Rai, Madhu Rajput, Madhoolika Agrawal and S.B. Agrawal “GASEOUS AIR POLLUTANTS: A
REVIEW ON CURRENT AND FUTURE TRENDS OF EMISSIONS AND IMPACT ON
AGRICULTURE” Journal of Scientific Research Banaras Hindu University, Varanasi. Vol. 55, 2011 : 77-
102
[2] Maisonet M, Correa A, Misra D, Jaakkola JJ “A review of the literature on the effects of ambient air pollution
on fetal growth “US National Library of Medicine National Institutes of Health; Environ Res. 2004
May;95(1):106-15.
[3] Cooke TF “Indoor air pollutants. A literature review “US National Library of Medicine National Institutes
of Health Rev Environ Health. 1991; 9(3):137-60.
[4] Mildred Maisonet, Adolfo Correa, Dawn Misra and Jouni J.K. Jaakkolaf “A review of the literature on the
effects of ambient air pollution on fetal growth” Environmental Research 95 (2004) 106–115.
[5] Bhat Mohd Skinder, Afeefa Qayoom Sheikh, Ashok K. “Pandit and Bashir Ahmad GanaiBrick kiln emissions
and its environmental impact: A Review” Journal of Ecology and the Natural Environment Vol. 6(1), pp. 1-
11, January 2014.
9


![WELCOME [candler.emory.edu] Student Handbook updat… · Web viewFirst, the word pollution means that something is bad or negative in some way. Further, all studies agree that pollution](https://img.pdfslide.us/doc/110x75/5d0a4a9088c993b67a8b8741/welcome-student-handbook-updat-web-viewfirst-the-word-pollution-means-that.jpg)