Embed Size (px)
Citation preview

http://www.iaeme.com/IJCIET/index.
International Journal of Civil Engineering and Technology (IJCIET)Volume 8, Issue 1, January 2017, pp.
Available online at http://www.iaeme.com/IJCIET/issues.asp?JType=IJCIET&VType=8&IType=1
ISSN Print: 0976-6308 and ISSN Online: 0976
© IAEME Publication Scopus
PREDICTION OF ROAD ACCID
FOR INDIAN
Research Scholar, School
Rajeev Gandhi Memorial college of Engineering and Technology,
Professor
Vasi Reddy
Professor, Department of Civil Engineering,
Jawaharlal Nehru Technolo
ABSTRACT
The objective of this research article is
variables of a section of four
models that explains the relationship between frequency of accident count and highway safety
variables. The Highway traverses mainly through a plain terrain of mostly agricultural areas.
The study is for newly constructing Four
(Chagalamarri) to 359.9(Kurnool)
accidents. The predictive ability using Multiple linear regression model is under two
categories: First for the 2 lane sections and second for 4 lane sections separately. The
validation tools were applied to examine the ability of models to predict accidents.
Key words: Accident Prediction Model,
Cite this Article B.Naga Kiran, Dr. N. Kumara Swamy and Dr. C. Sashidhar, Prediction o
Road Accident Modelling For Indian National Highways
Engineering and Technology, 8(1), 2017, pp.
http://www.iaeme.com/IJCIET/issues.
IJCIET/index.asp 789
International Journal of Civil Engineering and Technology (IJCIET) Volume 8, Issue 1, January 2017, pp. 789–802 Article ID: IJCIET_08_01_093
http://www.iaeme.com/IJCIET/issues.asp?JType=IJCIET&VType=8&IType=1
SSN Online: 0976-6316
Scopus Indexed
ICTION OF ROAD ACCIDENT MODELLING
INDIAN NATIONAL HIGHWAYS
B.Naga Kiran
Research Scholar, School of Civil Engineering,
Rajeev Gandhi Memorial college of Engineering and Technology,
Nandyal, Andhrapradesh, India
Dr. N. Kumara Swamy
Professor, Department of Civil Engineering,
Reddy Venkataadri Institute of Technology,
Guntur, Andhrapradesh, India
Dr. C. Sashidhar
Professor, Department of Civil Engineering,
Jawaharlal Nehru Technological University,
Anantapur, Andhra Pradesh, India
The objective of this research article is to identify the most critical safety influencing
variables of a section of four-lane National Highway-18(old)/40(New)
plains the relationship between frequency of accident count and highway safety
. The Highway traverses mainly through a plain terrain of mostly agricultural areas.
The study is for newly constructing Four-Lane road between chainage 224.000
(Kurnool) to identify all safety deficiencies responsible for road
accidents. The predictive ability using Multiple linear regression model is under two
categories: First for the 2 lane sections and second for 4 lane sections separately. The
validation tools were applied to examine the ability of models to predict accidents.
iction Model, Multiple Linear Regression, Model Validation
B.Naga Kiran, Dr. N. Kumara Swamy and Dr. C. Sashidhar, Prediction o
Road Accident Modelling For Indian National Highways. International Journal of Civil
, 8(1), 2017, pp. 789–802.
http://www.iaeme.com/IJCIET/issues.asp?JType=IJCIET&VType=8&IType=1
http://www.iaeme.com/IJCIET/issues.asp?JType=IJCIET&VType=8&IType=1
ENT MODELLING
NATIONAL HIGHWAYS
Rajeev Gandhi Memorial college of Engineering and Technology,
to identify the most critical safety influencing
through statistical
plains the relationship between frequency of accident count and highway safety
. The Highway traverses mainly through a plain terrain of mostly agricultural areas.
Lane road between chainage 224.000
to identify all safety deficiencies responsible for road
accidents. The predictive ability using Multiple linear regression model is under two
categories: First for the 2 lane sections and second for 4 lane sections separately. The
validation tools were applied to examine the ability of models to predict accidents.
Multiple Linear Regression, Model Validation.
B.Naga Kiran, Dr. N. Kumara Swamy and Dr. C. Sashidhar, Prediction of
International Journal of Civil
asp?JType=IJCIET&VType=8&IType=1
Prediction of Road Accident Modelling For Indian National Highways
http://www.iaeme.com/IJCIET/index.asp 790 [email protected]
1. INTRODUCTION
As per the official records 1,41,526 persons were died and 4,77,731 were injured in road traffic
accidents in India in 2014(NCRB 2015).Hence Road safety Management has emerged as a topic of
discussion for researchers all over the world. The traffic police are the source for giving information
relating to road traffic injuries in India, based on the cases reported them. The burden of road traffic
injuries has increased over the last 20 years in India. National Safety policies are to be promoted to
ensure improvements in traffic safety. As per the reports of MORTH and NCRB (National crime
Record Bureau, the data can be useful up to 20% only and the remaining 80% is unreliable
information which should not be used for analysis. The faults in the reports probably occur from a
wrong coding of the victims status which needs to be reviewed &revised.
The fatalities are more than doubled between 1991 and 2014 in big cities of India. In Rajastan,
Maharastra, Orissa and Tripura fatalities increased by 4 to 6 times and in Assam, Gujarat, Punjab and
Haryana 8-10 times increased in the same period. Much concentration need to be put to street and
highways designs which influence on vulnerable road user safety ,because present policies do not
appear to be giving needed effect. Number of deaths were increased between 1996 to 2014 in almost
all cities in India Survey reports suggested that in Agra and Ludhiana lower volumes vehicle velocities
can be higher at night because sufficient lighting system is not available and there is limited
checking’s of drivers under the influence of alcohol.
In India, national highways are only 15% of the total length but account for 33% of the fatalities.
The expressway are only to a length of 1000kms in 2014 in the country but a high death rate of 1.8 per
Km per year.68% of persons are getting killed on highways in India by the vulnerable road users.
Rear end crashes including with parked vehicles are high on all types of highways. Safety should
be enhanced by separating roads for slow and fast moving vehicles on the same roads. An independent
road safety Agency is to be established in India to set standards, to monitor and implements.
Multi disciplinary research centers are to be established to get more innovative results. Highway
designs must be adequate with safe facilities for slow traffic and separate paths are to be provided for
bicycle lanes and disabled pedestrians.
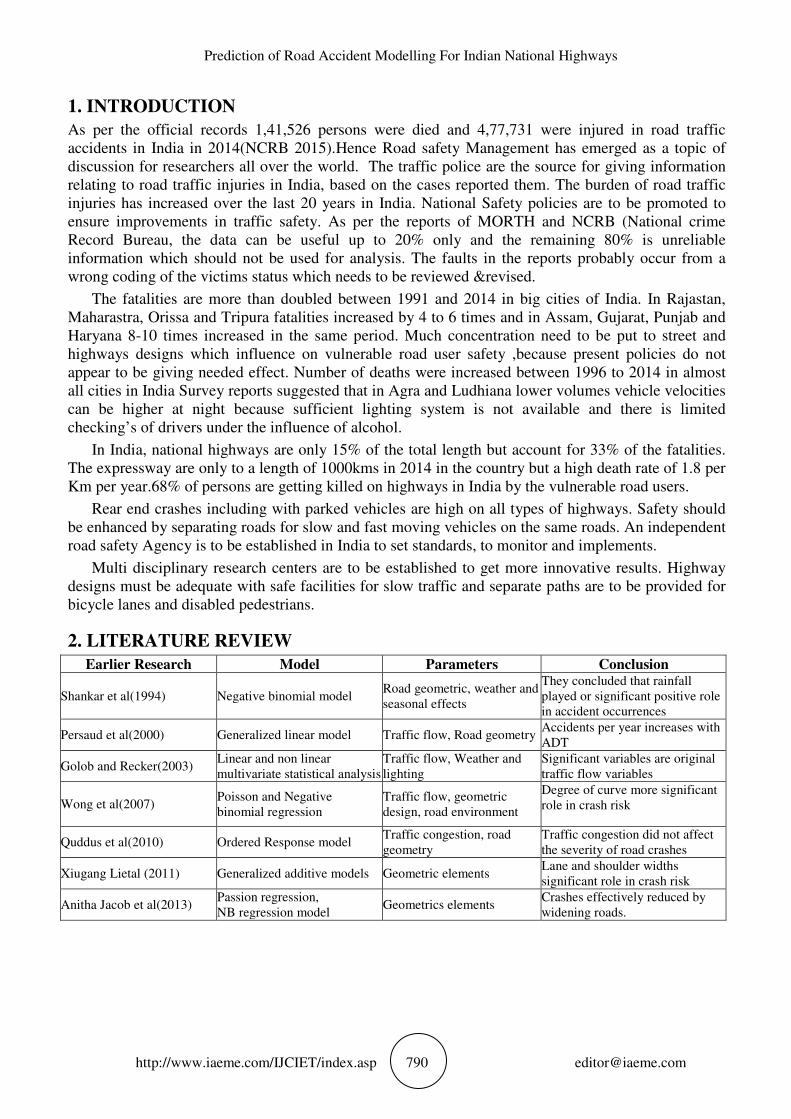
2. LITERATURE REVIEW
Earlier Research Model Parameters Conclusion
Shankar et al(1994) Negative binomial model Road geometric, weather and
seasonal effects
They concluded that rainfall
played or significant positive role
in accident occurrences
Persaud et al(2000) Generalized linear model Traffic flow, Road geometry Accidents per year increases with
ADT
Golob and Recker(2003) Linear and non linear
multivariate statistical analysis
Traffic flow, Weather and
lighting
Significant variables are original
traffic flow variables
Wong et al(2007) Poisson and Negative
binomial regression
Traffic flow, geometric
design, road environment
Degree of curve more significant
role in crash risk
Quddus et al(2010) Ordered Response model Traffic congestion, road
geometry
Traffic congestion did not affect
the severity of road crashes
Xiugang Lietal (2011) Generalized additive models Geometric elements Lane and shoulder widths
significant role in crash risk
Anitha Jacob et al(2013) Passion regression,
NB regression model Geometrics elements
Crashes effectively reduced by
widening roads.
B.Naga Kiran, Dr. N. Kumara Swamy and Dr. C. Sashidhar
http://www.iaeme.com/IJCIET/index.
3. STUDY AREA
Government of India through NHAI has taken up the development, maintenan
national highways under NHDP phase
where the intensity of traffic has increased significantly and to augment the capacity for safe and
efficient movement of traffic.
National highway number 18 starts from Chittoor
length of highway is located in Andhra Pradesh and it passes
Allagadda (247.7), Nandya l (282.2),
Kurnool district. Most of this national highway study segments falls in rural areas
85%).The study area for this project is newly constructing four lane road between chainage
Chagalamarri (224.000) to Kurnool
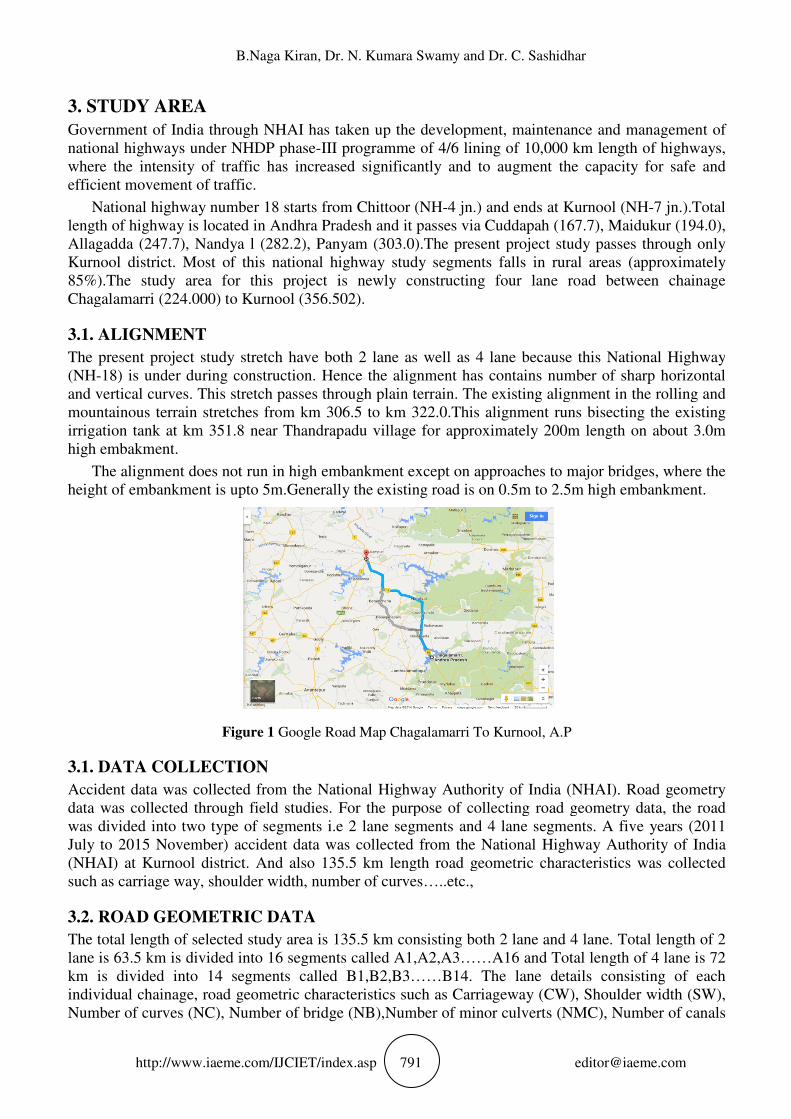
3.1. ALIGNMENT
The present project study stretch
(NH-18) is under during construction. Hence the alignment has contains number of sharp horizontal
and vertical curves. This stretch passes thr
mountainous terrain stretches from km 306.5 to km 322.0.This alignment runs bisecting the existing
irrigation tank at km 351.8 near Thandrapadu village for approximately 200m length on about 3.0
high embakment.
The alignment does not run in high embankment except on approaches to major bridges, where the
height of embankment is upto 5m.Generally the existing road is o
Figure 1 Google Road Map Chagalamarri To Kur
3.1. DATA COLLECTION
Accident data was collected from the National Highway Authority of India
data was collected through field studies. For the purpose of collecting road geometry data, the road
was divided into two type of segments i.e 2 lane segments and 4 lane segments. A five years
July to 2015 November) accident data was collected from the National Highway Authority of India
(NHAI) at Kurnool district. And also 135.5 km length road geometric characteristics was col
such as carriage way, shoulder width, number of curves…..etc.,
3.2. ROAD GEOMETRIC DATA
The total length of selected study area is 135.5 km co
lane is 63.5 km is divided into 16 segments called
km is divided into 14 segments called B1,B2,B3……B14. The
individual chainage, road geometric
Number of curves (NC), Number of
B.Naga Kiran, Dr. N. Kumara Swamy and Dr. C. Sashidhar
IJCIET/index.asp 791
Government of India through NHAI has taken up the development, maintenan
national highways under NHDP phase-III programme of 4/6 lining of 10,000 km length of highways,
where the intensity of traffic has increased significantly and to augment the capacity for safe and
highway number 18 starts from Chittoor (NH-4 jn.) and ends at Kurnool
length of highway is located in Andhra Pradesh and it passes via Cuddapah (167.7),
(282.2), Panyam (303.0).The present project study
Kurnool district. Most of this national highway study segments falls in rural areas
85%).The study area for this project is newly constructing four lane road between chainage
Chagalamarri (224.000) to Kurnool (356.502).
have both 2 lane as well as 4 lane because this National Highway
18) is under during construction. Hence the alignment has contains number of sharp horizontal
and vertical curves. This stretch passes through plain terrain. The existing alignment in the rolling and
mountainous terrain stretches from km 306.5 to km 322.0.This alignment runs bisecting the existing
irrigation tank at km 351.8 near Thandrapadu village for approximately 200m length on about 3.0
The alignment does not run in high embankment except on approaches to major bridges, where the
height of embankment is upto 5m.Generally the existing road is on 0.5m to 2.5m high embankment.
Google Road Map Chagalamarri To Kurnool, A.P
Accident data was collected from the National Highway Authority of India (NHAI). Road geometry
data was collected through field studies. For the purpose of collecting road geometry data, the road
segments i.e 2 lane segments and 4 lane segments. A five years
July to 2015 November) accident data was collected from the National Highway Authority of India
(NHAI) at Kurnool district. And also 135.5 km length road geometric characteristics was col
such as carriage way, shoulder width, number of curves…..etc.,
3.2. ROAD GEOMETRIC DATA
The total length of selected study area is 135.5 km consisting both 2 lane and 4 lane.
lane is 63.5 km is divided into 16 segments called A1,A2,A3……A16 and Total length of 4 lane is 72
km is divided into 14 segments called B1,B2,B3……B14. The lane details consisting of each
individual chainage, road geometric characteristics such as Carriageway (CW),
of bridge (NB),Number of minor culverts (NMC),
B.Naga Kiran, Dr. N. Kumara Swamy and Dr. C. Sashidhar
Government of India through NHAI has taken up the development, maintenance and management of
III programme of 4/6 lining of 10,000 km length of highways,
where the intensity of traffic has increased significantly and to augment the capacity for safe and
4 jn.) and ends at Kurnool (NH-7 jn.).Total
67.7), Maidukur (194.0),
present project study passes through only
Kurnool district. Most of this national highway study segments falls in rural areas (approximately
85%).The study area for this project is newly constructing four lane road between chainage
have both 2 lane as well as 4 lane because this National Highway
18) is under during construction. Hence the alignment has contains number of sharp horizontal
ough plain terrain. The existing alignment in the rolling and
mountainous terrain stretches from km 306.5 to km 322.0.This alignment runs bisecting the existing
irrigation tank at km 351.8 near Thandrapadu village for approximately 200m length on about 3.0m
The alignment does not run in high embankment except on approaches to major bridges, where the
n 0.5m to 2.5m high embankment.
A.P
(NHAI). Road geometry
data was collected through field studies. For the purpose of collecting road geometry data, the road
segments i.e 2 lane segments and 4 lane segments. A five years (2011
July to 2015 November) accident data was collected from the National Highway Authority of India
(NHAI) at Kurnool district. And also 135.5 km length road geometric characteristics was collected
nsisting both 2 lane and 4 lane. Total length of 2
,A3……A16 and Total length of 4 lane is 72
lane details consisting of each
(CW), Shoulder width (SW),
(NMC), Number of canals
Prediction of Road Accident Modelling For Indian National Highways
http://www.iaeme.com/IJCIET/index.asp 792 [email protected]
(NCS),Number of junctions(NJ),Number of minor roads (MR),Width at minor roads
(WMR),Roadmarkings(RM),Roadsigns(RS),Roadcondition(RC),Shouldertype(ST),Shoulder
condition(SC),Land use(LU).
Majority of these two lane and four lane study stretch was straight. The total number of curves in
entire two lane stretch are 46.And the total number of curves in only 4 lane segments are 62. The
carriageway for two lane segments varies 8.7m,8.5m,8.0m….etc., While in case of four lane
carriageway varies 16.0m,14.0m,14.2m……etc., The shoulder width varies in two lane segments is
0.9m,1.2m..etc., The shoulder width varies in four lane segments 1.4m,1.5m etc.,
4. MODL DEVELOPMENT
Multiple linear Regression: The Normal linear regression model having (Y) as Response variable and
X. The Normal MRM (Multiple Regression model) developed to understand the relationship b/w a set
of variables that shows in a data set.
Y=βO+β1X+u.... 1
Y=f(X) +U
Where X1, X2---= explanatory variables
β1 β2=estimated model coefficients
U=Random error term (Assumed to be distributed Normally with variance and mean zero)
βO =Regression Constant
f(X)=Population regression function
This shows that Y has to be distributed normally with mean population regression function and
variance. Even though the development of model and Interpretation is so simple: its use in Accident
Analysis is restricted due to the following drawbacks
• Some variables are not follow normal distribution
• Response variable(Y) cannot have a negative value and, Accidents are countable events.
Even with above drawbacks this Multiple Regression model has been Implemented (Or) tried in
this Research paper. The model can be Implemented (Or) tried whenever a set of data from bigger area
is used for Modelling because the presence of a huge no of small effects acting Independently and
additively can be assumed to follow normal distribution.(Central Limittheore)
5. VALIDATION OF MODEL
The validity of model is carried out as follows:
• By finding the Coefficient of Determination (R2).
• By the comparison of results of total number of accidents found by model with the data obtained from
NHAI.
Coefficient of Determination (R2):
• It is defined as a ratio of the explained variance to the total variance of the independent variable y. The
value ofR2 lies between 0 and 1, the closer it is to 1, The better is the model.
The following fig 2 shows Sixteen two lane segments road geometric characteristics on
Minitab(17.0)software contains C1 as a dependent variable(Number of accidents) and
C2,C3……..C15 as a independent variables. In two lane road geometric segments only fourteen
independent variabls was selected for regression input.

B.Naga Kiran, Dr. N. Kumara Swamy and Dr. C. Sashidhar
http://www.iaeme.com/IJCIET/index.
Figure 2 Accidents Alo
Figure 3 Two Lane Segment Output Summary (Analysis)
B.Naga Kiran, Dr. N. Kumara Swamy and Dr. C. Sashidhar
IJCIET/index.asp 793
Accidents Along with Geometric Charcteristics on Two Lane Segments
Two Lane Segment Output Summary (Analysis)
B.Naga Kiran, Dr. N. Kumara Swamy and Dr. C. Sashidhar
ng with Geometric Charcteristics on Two Lane Segments

Prediction of Road Accident Modelling For Indian National Highways
http://www.iaeme.com/IJCIET/index.
Figure 4 Two Lane Segment Output Summary (Coeeficents)
The above figures 3&4 indicates regression data output on Minitab 17.0 version. In this dat
refers to Response(Number of accidents NA ).and C2, C3 ,C4 ,C5, C6…….. are refers to
Predictors(CW,SW,NC,NB…… etc).
6. MULTIPLE REGRESSION
The following model was selected as the best fit model, satisfying both statistica
as practical considerations. Sensitivity studies were conducted to calibrate the model and also study
the effect of each variable on the urban road accidents
Figure 5 Normal Probability Plot
f Road Accident Modelling For Indian National Highways
IJCIET/index.asp 794
Two Lane Segment Output Summary (Coeeficents)
indicates regression data output on Minitab 17.0 version. In this dat
Number of accidents NA ).and C2, C3 ,C4 ,C5, C6…….. are refers to
(CW,SW,NC,NB…… etc).
MULTIPLE REGRESSION MODEL (FOR TWO LANE SEGMEN
The following model was selected as the best fit model, satisfying both statistica
as practical considerations. Sensitivity studies were conducted to calibrate the model and also study
the effect of each variable on the urban road accidents.
Normal Probability Plot for Two Lane Segments
f Road Accident Modelling For Indian National Highways
Two Lane Segment Output Summary (Coeeficents)
indicates regression data output on Minitab 17.0 version. In this data C1
Number of accidents NA ).and C2, C3 ,C4 ,C5, C6…….. are refers to
(FOR TWO LANE SEGMENTS)
The following model was selected as the best fit model, satisfying both statistical (R2 = 0.912) as well
as practical considerations. Sensitivity studies were conducted to calibrate the model and also study
B.Naga Kiran, Dr. N. Kumara Swamy and Dr. C. Sashidhar
http://www.iaeme.com/IJCIET/index.
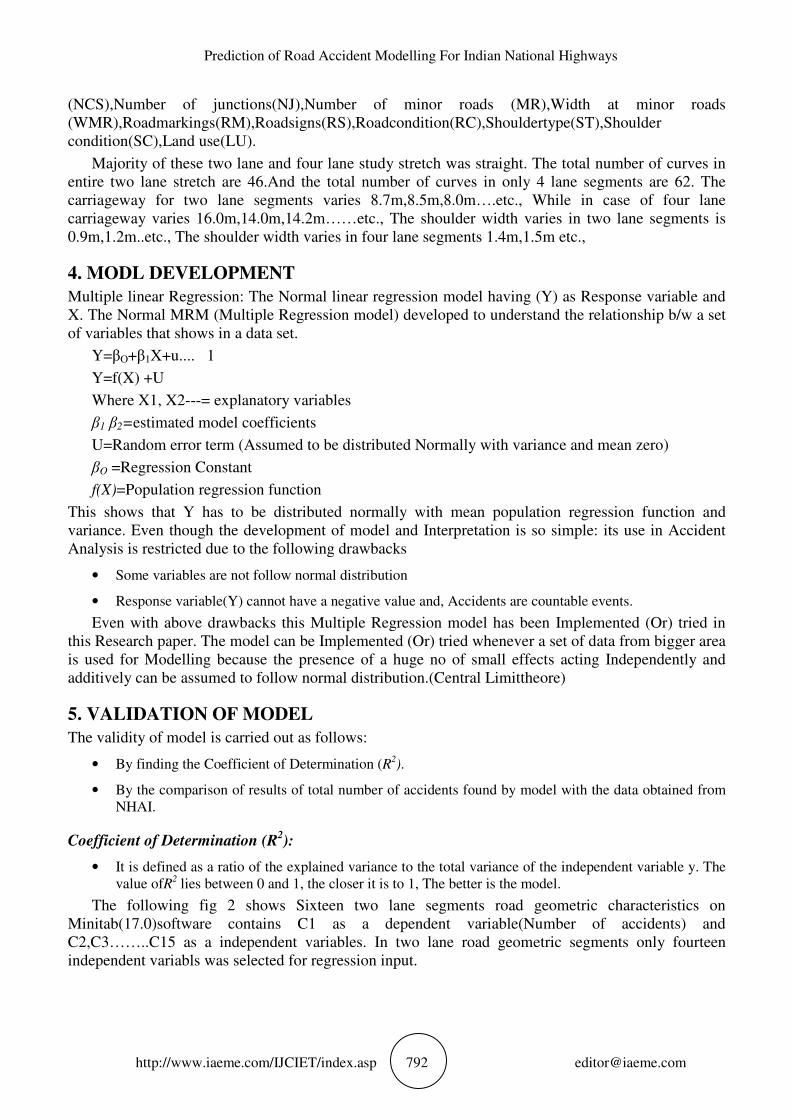
Figure 6
Figure 7 Residuals Versus Order For Two Lane Segments
EQUATION:
Y =-84.8+5.7CW-20.63SW+2.94NC-
16.6NJ+13.7NMR+1.93WMR+2.4RM30.7RS+8.69RC+21.9ST+4.6SC.
B.Naga Kiran, Dr. N. Kumara Swamy and Dr. C. Sashidhar
IJCIET/index.asp 795
Residuals Versus Fits For Two Lane Segments
Residuals Versus Order For Two Lane Segments
-19.5NB-5.5NMC+7.7NCS-
16.6NJ+13.7NMR+1.93WMR+2.4RM30.7RS+8.69RC+21.9ST+4.6SC.
B.Naga Kiran, Dr. N. Kumara Swamy and Dr. C. Sashidhar
16.6NJ+13.7NMR+1.93WMR+2.4RM30.7RS+8.69RC+21.9ST+4.6SC.
Prediction of Road Accident Modelling For Indian National Highways
http://www.iaeme.com/IJCIET/index.
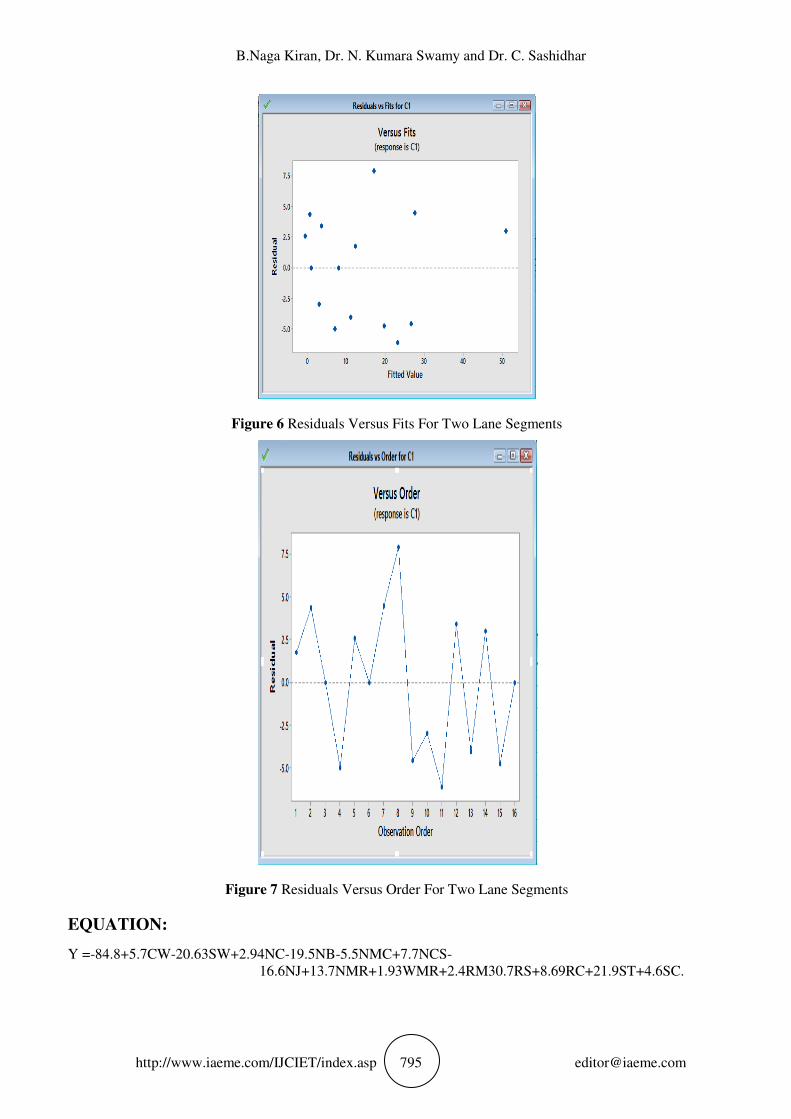
Table 1 Comparision
SL OBSERVED VALUES
1 14
2 5
3 1
4 2
5 2
6 8
7 32
8 25
9 22
10 0
11 17
12 7
13 7
14 54
15 15
16 8
The following fig 8 shows fourteen four
Minitab(17.0)software contains C1 as a dependent variable(Number of accidents) and
C2,C3……..C15 as a independent variables. In two lane road geometric segments only twelve
independent variabls was selected for regression input.
Figure 8 Accidents Along With Geometric Charcteristics On Four Lane Segments
f Road Accident Modelling For Indian National Highways
IJCIET/index.asp 796
Comparision of Observed and Predicted Number of Accidents
OBSERVED VALUES PREDICTD VALUES DIFFERENCE
11.601
0.19
0.72
6.67
0.92
2.75
5.3
16
26.2
26.5
22.6
3.3
10.66
45.87
14
2.6
wing fig 8 shows fourteen four lane segments road geometric characteristics on
Minitab(17.0)software contains C1 as a dependent variable(Number of accidents) and
a independent variables. In two lane road geometric segments only twelve
independent variabls was selected for regression input.
Accidents Along With Geometric Charcteristics On Four Lane Segments
f Road Accident Modelling For Indian National Highways
f Accidents
DIFFERENCE
2.399
4.81
0.28
4.67*
1.08
5.25
26.7
9
24.2
26.5
5.6
3.7
3.66
8.13
1
2
lane segments road geometric characteristics on
Minitab(17.0)software contains C1 as a dependent variable(Number of accidents) and
a independent variables. In two lane road geometric segments only twelve
Accidents Along With Geometric Charcteristics On Four Lane Segments

B.Naga Kiran, Dr. N. Kumara Swamy and Dr. C. Sashidhar
http://www.iaeme.com/IJCIET/index.
Figure 9 Four Lane Segment Out Put Summary (
Figure 10 Four Lane Segment
B.Naga Kiran, Dr. N. Kumara Swamy and Dr. C. Sashidhar
IJCIET/index.asp 797
Four Lane Segment Out Put Summary (Analysis)
Four Lane Segment Output Summary (Coefficents)
B.Naga Kiran, Dr. N. Kumara Swamy and Dr. C. Sashidhar
Output Summary (Coefficents)

Prediction of Road Accident Modelling For Indian National Highways
http://www.iaeme.com/IJCIET/index.
Figure 11 Normal Probability Plot For Four Lane Segments
Figure 12
f Road Accident Modelling For Indian National Highways
IJCIET/index.asp 798
Normal Probability Plot For Four Lane Segments
12 Residuals versus Fits For Four Lane Segments
f Road Accident Modelling For Indian National Highways
Normal Probability Plot For Four Lane Segments
B.Naga Kiran, Dr. N. Kumara Swamy and Dr. C. Sashidhar
http://www.iaeme.com/IJCIET/index.
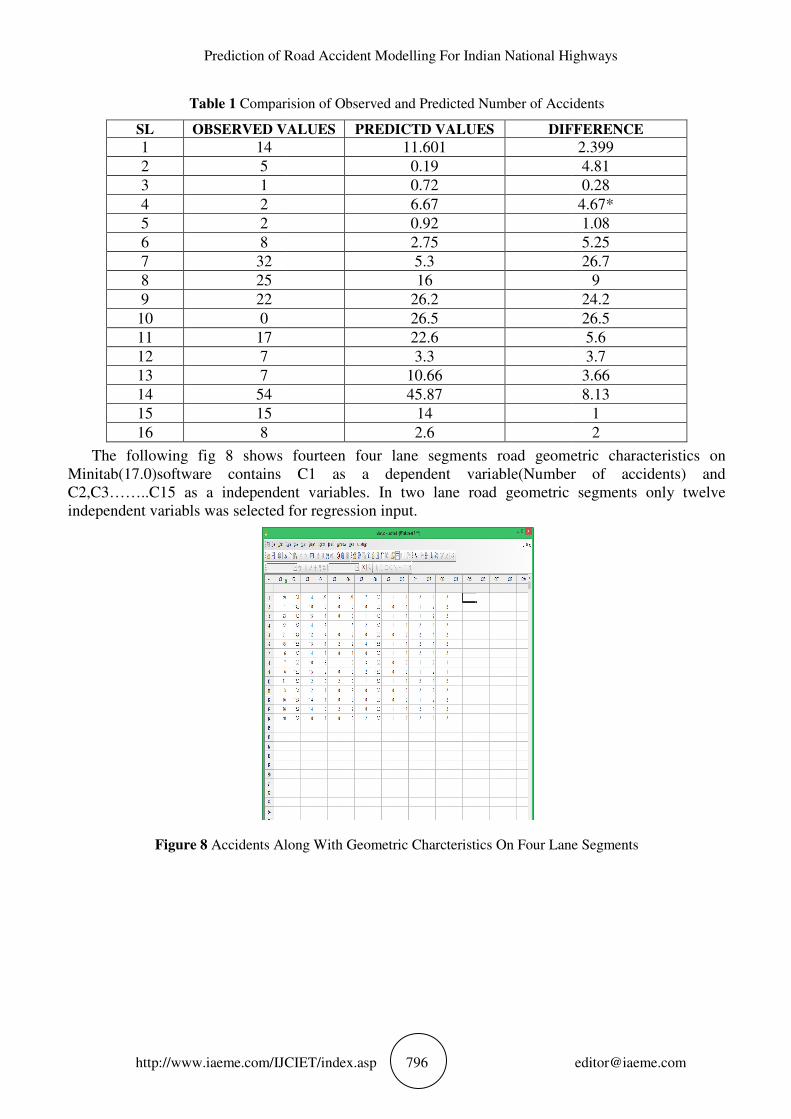
Figure 13
EQUATION
Y=0+14.35CW-82.7SW+11.26NC27.3NB+3.44NMC25.5NMR+1.24WMR+56.9RM
21.2SC
Table 2 Comparision of Observed Predicted Accidents
SL NO OBSERVED VALUES
1 49
2 1
3 23
4 42
5 21
6 45
7 6
8 7
9 6
10 11
11 3
12 16
13 16
14 40
B.Naga Kiran, Dr. N. Kumara Swamy and Dr. C. Sashidhar
IJCIET/index.asp 799
Figure 13 Residuals Versus Order For Four Lane Segments
82.7SW+11.26NC27.3NB+3.44NMC25.5NMR+1.24WMR+56.9RM-
Comparision of Observed Predicted Accidents
OBSERVED VALUES PREDICTED VALUES
49 46.8
0.2
23 18.8
42 43
21 17.5
45 42.6
9.4
6.2
6.3
11 13.5
2.8
16 19.2
16 12.3
40 39.5
B.Naga Kiran, Dr. N. Kumara Swamy and Dr. C. Sashidhar
-5.6RS-43.1RC-13.1ST-
ERROR
2.2
0.8
4.2
1
3.5
2.4
3.4
0.8
0.3
2.5
0.2
3.2
3.7
0.5

Prediction of Road Accident Modelling For Indian National Highways
http://www.iaeme.com/IJCIET/index.asp 800 [email protected]
Figure 14 Comparision of Observed and Predicted Number of Accidents of Two Lane Segments.
Figure 15 Comparision of Observed and Predicted Number of Accidents of Four Lane Segments
7. DISCUSSIONS
1. The model developed can be used for the highways having conditions similar to the study and can help
to take right decision in the direction of accidents management i.e. to decide and implement remedial
measures in the field of traffic safety.
2. For safety diagnosis and specially, identification of dangerous zones in network by ranking the sites by
their accident rates, the model can be very helpful.
3. The model can be used for evaluation of the effectiveness of a safety measure by comparing the
accident rates of two compatible samples of sites before and after the implementation and to predict
accidents, their nature, causes and pattern.
4. Also, the effect of various parameters like carriage width, shoulder width, number of minor roads,
number of curves etc; on the road traffic accidents can be studied with the help of model.
0
10
20
30
40
50
60
A1
A2
A3
A5
A5
A6
A7
A8
A9
A1
0
A1
1
A1
2
A1
3
A1
4
A1
5
A1
6
OBSERVED VALUES PREDICTED VALUES
0
10
20
30
40
50
60
B1 B2 B3 B4 B5 B6 B7 B8 B9 B10B11B12B13B14
OBSERVED VALUES PREDICTED VALUES
B.Naga Kiran, Dr. N. Kumara Swamy and Dr. C. Sashidhar
http://www.iaeme.com/IJCIET/index.asp 801 [email protected]
5. More over, the results can act as a quick guideline for road network planning and the authorities
concerned with accident mitigation measures.
8. CONCLUSIONS
Accident prediction model (APM) is developed by using multiple regression analysis for NH-18 From
chainage 224.7(at Chagalamarri) To 359.9(at Kurnool) based on the factors influencing road accident.
For two lane segments the dependent variable used in the model is number of accidents(Y). The
independent variables used in the as Carriageway (CW),Shoulder width(SW),Number of curves(NC),
Number of bridges(NB),Number of minor culverts (NMC), Number of canals (NCS), Number of
junctions(NJ), Number of minor roads (MR),Width at minor roads (WMR), Road markings
(RM),Road signs (RS), Road condition (RC),Shoulder type(ST),Shoulder condition(SC), Land
use(LU).
The model developed from the above variables is
Y=-84.8+5.7CW-20.63SW+2.94NC-19.5NB-5.5NMC+7.7NCS-
16.6NJ+13.7NMR+1.93WMR+2.4RM30.7RS+8.69RC+21.9ST+4.6SC.
The coefficient of determination (R2) obtained is 0.912.
1. For four lane segments the dependent variable used in the model is number of accidents(Y). The
independent variables used in the as Carriageway (CW),Shoulder width(SW),Number of curves(NC),
Number of bridges(NB),Number of minor culverts (NMC),Number of minor roads (MR),Width at
minor roads (WMR), Road markings (RM),Road signs (RS), Road condition (RC), Shoulder type(ST),
Shoulder condition (SC),Land use(LU).
The model developed from the above variables is
Y=0+14.35CW82.7SW+11.26NC27.3NB+3.44NMC25.5NMR+1.24WMR+56.9RM-5.6RS-43.1RC-13.1ST-
21.2SC.
The coefficient of determination (R2) obtained is 0.979.
1. It has been clearly demonstrated that regression analysis has been successfully applied to formulate a
prediction model for system testing defects. By using statistical approach such as regression analysis,
the research can justify the reasons and significance of metrics from requirement, design and coding
phase in predicting defects for system testing. Moreover, it is also explained that in order to have a
good model, the prediction must fall between a defined minimum and maximum range so that it is
feasible to incorporate and implement defect prediction as part of software development process,
particularly test process.
2. Accident data from NHAI suggestion that there is a lack of proper in design of road and education to
road way safety. These weaknesses can be minimized through comprehensive corrective measures.
Local community initiatives to improve the conditions are very sparse and it is also conducted that
much greater effort, desirably with the support from international agencies and specialized institutes is
needed in combating the problem. Importantly, such effort would require considerable resources
particularly trained local personal, safety specialization and researchers so as to buildup indigenous
capacity and attain sustainable safety program.
3. It is suggested to further refine the model reported in this study using more number of variables (eg:
Traffic volume , Spot speed…..etc) to get a more realistic picture in predicting or forecasting accidents,
though accidents occurrence is random phenomenon and therefore we can not exactly predict future
trends by using any model or theory, but it is a very handy tool in the hands of planners and decision
makes to take remedial measures in advance by studying future trends using such models, to take
mitigation measures to minimize the accident rate to certain extent and to take other safety measures.

Prediction of Road Accident Modelling For Indian National Highways
http://www.iaeme.com/IJCIET/index.asp 802 [email protected]
REFERENCES
[1] Shankar, V., Mannering, F. and Woodrow, B., Effect of roadway geometrics and environmental
factors on rural freeway accident frequencies, Accident Analysis and Prevention, Volume 27, pp.
371–389,1994.
[2] Golob, T.F.,Recker, W.W.,2003,Relationship among urban freeway accidents, traffic Flow,
Weather, and lighting conditions J.Transp. Engg 129,342–353
[3] Wong, S.C., Sze, N.N. and Li Y.C., Contributory factors to traffic crashes at signalized
intersections in Hong Kong, Accident Analysis and Prevention, Vol.39, pp.1107-1113, 2007.
[4] Quddus, A.M., Chao Wang and Stephen, G. I., Road traffic congestion and crash severity:
Econometric analysis using ordered response models, Journal of Transportation Engineering,
ASCE, Vol. 136, No.5, pp. 424-435, 2010.
[5] Xiugang Li, Dominique, L., and Yunlong, Z., Development of accident modification factors for
rural frontage road segments in Texas using Generalized Additive Models, Journal of
Transportation Engineering, ASCE, Vol. 137. pp. 74-83, 2011.
[6] Gëzim Hoxha and Nijazi Ibrahimi, Implementation of Graphical - Analytical Method In
Determination of Speed of Vehicle In Case of Road Accident and Comparing of Results with The
Software Method. International Journal of Civil Engineering and Technology, 4(6), 2013, pp. 69–
77.
[7] Y. P. Raiwani and Pragya Baluni, Extraction of Road Accident Patterns In Uttarakhand Using
Neural Network. International Journal of Civil Engineering and Technology, 5(8), 2014, pp. 159–
168.
[8] Anitha Jacob, M.V.R.Anjaneyulu., Development of cras prediction models for Two lane Rural
highways using Regression Analysis, Highway Research journal, January-June 2013
[9] National Highway Authority of India, Nandyal. A.P
[10] http//data.gov.in./road accidents
[11] IRC 53-1982 for road accident form