Embed Size (px)
Citation preview
Place logo
or logotype here,
otherwise
delete this.
2008
S M T W T F S
1 2 3 4 5 6 7
8 9 10 11 12 13 14
15 16 17 18 19 20 21
22 23 24 25 26 27 28
29 30
Place logo
or logotype here,
otherwise
delete this.
Place logo or logotype here, otherwise delete this.
january
2008
S M T W T F S
1 2 3 4 5
6 7 8 9 10 11 12
13 14 15 16 17 18 19
20 21 22 23 24 25 26
27 28 29 30 31
05-11-2013
Name:
Hafiz Luqman Khalil (032)
Place Photo Here, Otherwise Delete Box
5th Semester, Chemical Engineering
Topic:
Methods of Particle Size
Measurement
Particle Technology
Submitted to:
Engr. Mohammad Waqas Qamar
06-11-2013
Particle Size Distribution
The size of the nanoparticles is a very important parameter as there is an optimal
size for each application. For example, for in vivo experiments, it must be taken into
account that to cross the blood brain barrier, the nanoparticles have to be in a
range of 15-50 nm whereas to pass through the endothelium, they must be smaller
than 150 nm. On the other hand, depending on the size of the particles, the organs
where they accumulate are different. Thus, particles between 30 to 150 nm are
retained in the heart, stomach and kidney whereas particles between 150 -300
usually stay in liver and spleen. Another example is when magnetic particles are
used as carriers for the purification of biomolecules. In this case, sizes above 40 nm
are necessary in order to have a good migration toward the magnet. Size distribution is also an important parameter which allows understanding the
heterogeneity of particle sizes in a mixture. A particle sample is mono disperse if all
particles present the same size, whereas, a sample of particles that have variable
sizes is known as poly disperse.
The analysis of both parameters is very interesting from the point of view of the
applications and the synthesis of the particles, as it helps to understand what
happens during the optimization process, when some synthesis parameters are
modified.
By far the most important physical property of particulate samples is particle size.
Measurement of particle size distributions is routinely carried out across a wide
range of industries and is often a critical parameter in the manufacture of many
products. The particle size distribution has a direct influence on material properties
such as:
Reactivity or dissolution rate - e.g. catalysts, tablets.
Stability in suspension – e.g. sediments, paints.
Efficacy of delivery – e.g. asthma inhalers.
Texture and feel – e.g. food ingredients.
Appearance – e.g. powder coatings and inks.
Flow ability and handling – e.g granules.
Viscosity – e.g. nasal sprays.
Packing density and porosity – e.g ceramics.
Measuring particle size distributions and understanding how they affect your
products and processes can be critical to the success of many manufacturing
businesses. Malvern Instruments offers leading instrumentation for all types of
particle size analysis and characterization from sub-nanometer to millimeters in
particle size.
Methods for Determining Particle Size
1. Microscopy
2. Sieving
3. Sedimentation techniques
4. Electrical sensing zone method – Coulter Counter
5. Laser Diffraction Method
6. Permeametry Technique
Microscopy
Optical microscopy (1-150µm)
Electron microscopy (0.001µ-)
Being able to examine each particle individually has led to microscopy being considered as an absolute measurement of particle size.
Can distinguish aggregates from single particles
When coupled to image analysis computers each field can be examined, and a distribution obtained.
Number distribution
Most severe limitation of optical microscopy is the depth of focus being about 10µm at x100 and only 0.5µm at x1000.
With small particles, diffraction effects increase causing blurring at the edges - determination of particles < 3µm is less and less certain.
Manual Optical Microscopy
Advantages
o Relatively inexpensive o Each particle individually examined - detect aggregates, 2D shape, colour,
melting point etc. o Permanent record - photograph o Small sample sizes required
Disadvantages
o Time consuming - high operator fatigue - few particles examined o Very low throughput o No information on 3D shape o Certain amount of subjectivity associated with sizing - operator bias
Transmission and Scanning Electron Microscopy
Advantages
o Particles are individually examined o Visual means to see sub-micron specimens o Particle shape can be measured
Disadvantages
o Very expensive o Time consuming sample preparation o Materials such as emulsions difficult/impossible to prepare o Low throughput - Not for routine use
Automatic and Image Analysis Microscopes
Advantages
o Faster and less operator fatigue than manual o No operator bias
Disadvantages
o Can be very expensive o No human judgement retained e.g. to separate out aggregates, select or
reject particles etc. (unlike semi-automatic)
Sieving
A sieve analysis (or gradation test) is a practice or procedure used (commonly used in civil engineering) to assess the particle size distribution (also called gradation) of a granular material.
The size distribution is often of critical importance to the way the material performs in use. A sieve analysis can be performed on any type of non-organic or organic granular materials including sands, crushed rock, clays, granite, feldspars, coal, soil, a wide range of manufactured powders, grain and seeds, down to a minimum size depending on the exact method. Being such a simple technique of particle sizing, it is probably the most common.
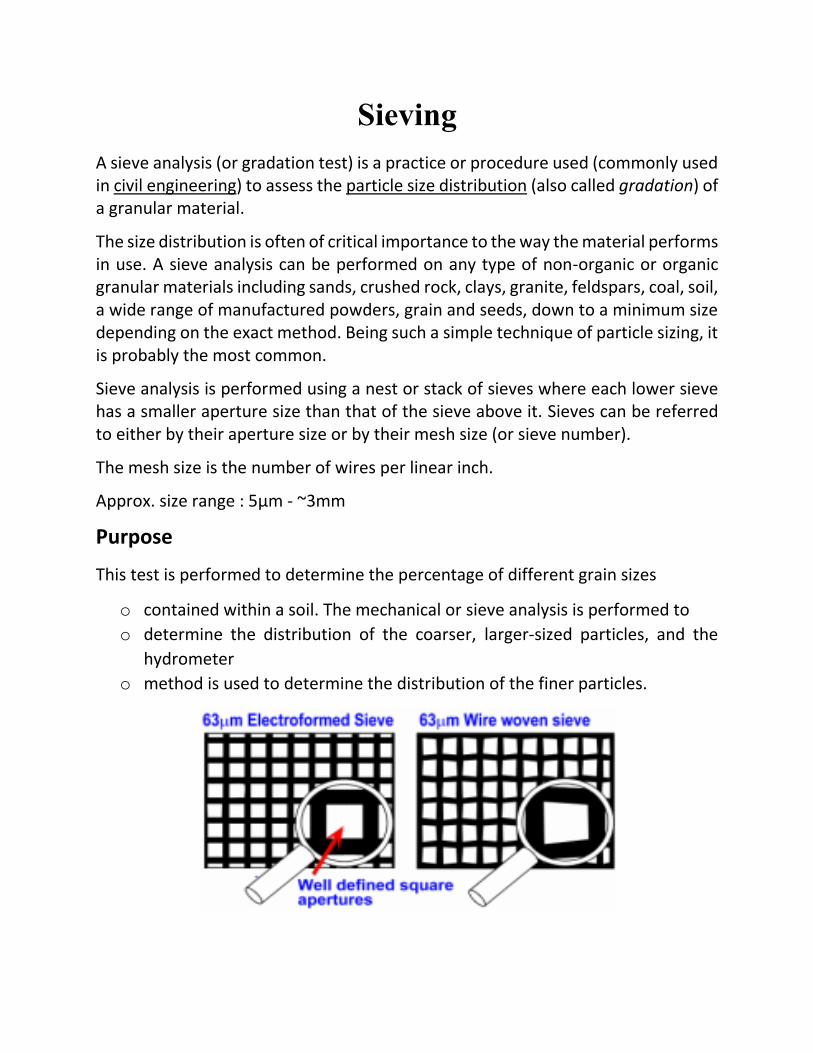
Sieve analysis is performed using a nest or stack of sieves where each lower sieve has a smaller aperture size than that of the sieve above it. Sieves can be referred to either by their aperture size or by their mesh size (or sieve number).
The mesh size is the number of wires per linear inch.
Approx. size range : 5µm - ~3mm
Purpose
This test is performed to determine the percentage of different grain sizes
o contained within a soil. The mechanical or sieve analysis is performed to
o determine the distribution of the coarser, larger-sized particles, and the
hydrometer
o method is used to determine the distribution of the finer particles.
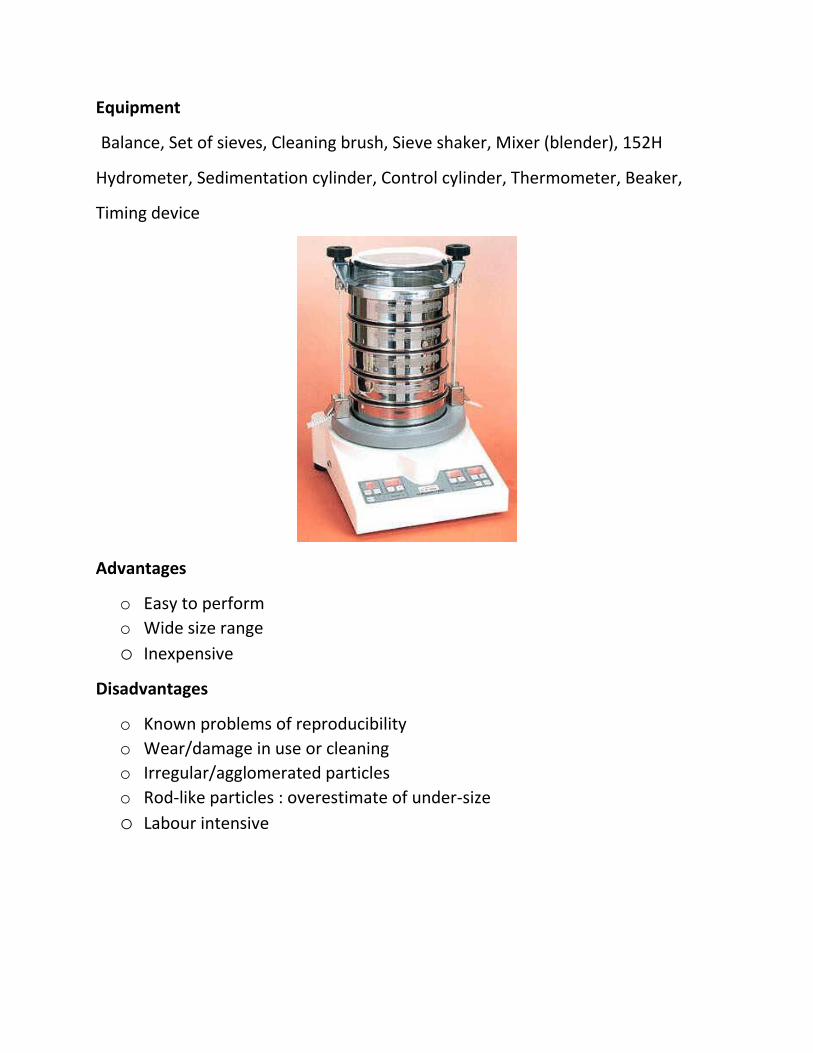
Equipment
Balance, Set of sieves, Cleaning brush, Sieve shaker, Mixer (blender), 152H
Hydrometer, Sedimentation cylinder, Control cylinder, Thermometer, Beaker,
Timing device
Advantages
o Easy to perform
o Wide size range
o Inexpensive
Disadvantages
o Known problems of reproducibility
o Wear/damage in use or cleaning
o Irregular/agglomerated particles
o Rod-like particles : overestimate of under-size
o Labour intensive
Sedimentation Technique
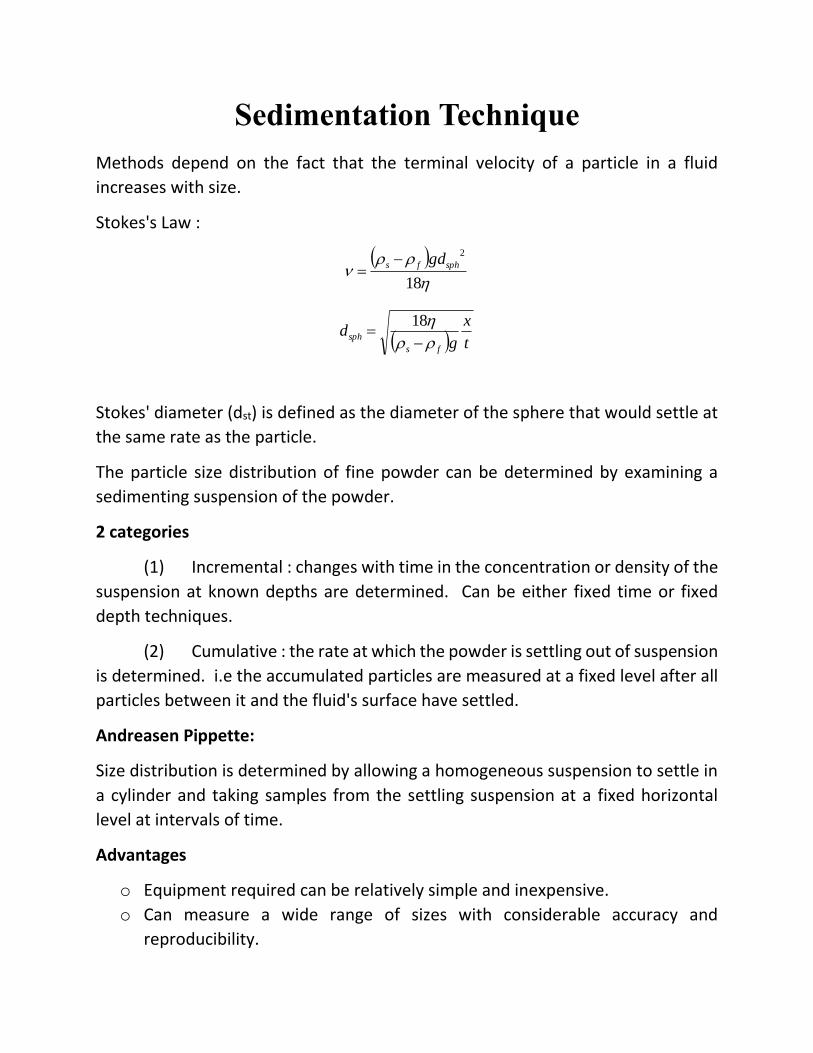
Methods depend on the fact that the terminal velocity of a particle in a fluid
increases with size.
Stokes's Law :
18
2
sphfs gd
t
x
gd
fs
sph
18
Stokes' diameter (dst) is defined as the diameter of the sphere that would settle at
the same rate as the particle.
The particle size distribution of fine powder can be determined by examining a
sedimenting suspension of the powder.
2 categories
(1) Incremental : changes with time in the concentration or density of the
suspension at known depths are determined. Can be either fixed time or fixed
depth techniques.
(2) Cumulative : the rate at which the powder is settling out of suspension
is determined. i.e the accumulated particles are measured at a fixed level after all
particles between it and the fluid's surface have settled.
Andreasen Pippette:
Size distribution is determined by allowing a homogeneous suspension to settle in
a cylinder and taking samples from the settling suspension at a fixed horizontal
level at intervals of time.
Advantages
o Equipment required can be relatively simple and inexpensive.
o Can measure a wide range of sizes with considerable accuracy and
reproducibility.
Disadvantages
o Sedimentation analyses must be carried out at concentrations which are
sufficiently low for interactive effects between particles to be negligible so
that their terminal falling velocities can be taken as equal to those of isolated
particles.
o Large particles create turbulence, are slowed and are recorded undersize.
o Careful temperature control is necessary to suppress convection currents.
o The lower limit of particle size is set by the increasing importance of
Brownian motion for progressively smaller particles.
o Particle re-aggregation during extended measurements.
o Particles have to be completely insoluble in the suspending liquid.
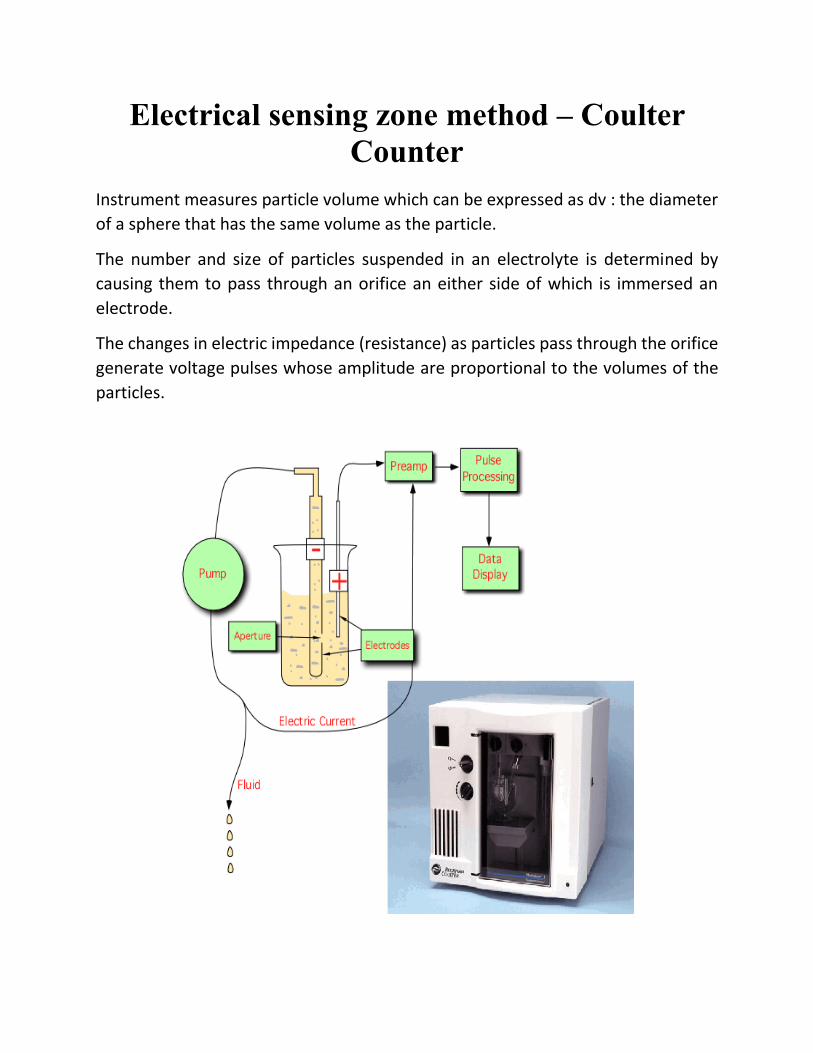
Electrical sensing zone method – Coulter
Counter
Instrument measures particle volume which can be expressed as dv : the diameter
of a sphere that has the same volume as the particle.
The number and size of particles suspended in an electrolyte is determined by
causing them to pass through an orifice an either side of which is immersed an
electrode.
The changes in electric impedance (resistance) as particles pass through the orifice
generate voltage pulses whose amplitude are proportional to the volumes of the
particles.
Laser Light Scattering Techniques
Laser-based techniques for particle-size measurement have become increasingly
important in combustion research and many other disciplines. Instruments are
continually being developed and improved to meet the demanding geometric,
accuracy and other requirements associated with current research and industrial
applications. This paper reviews some of the many techniques now used, including
those marketed as commercial instruments and those ideas still in the research
stage. Two distinct classes of methods are identified: amplitude dependent and
amplitude independent. The operating principles of particle-size instrumentation
using laser-based techniques, as well as difficulties associated with applying these
methods, are discussed. Applications of some techniques in research and industrial
situations are also reviewed. The paper provides a comprehensive review for those
who are beginning studies in, or starting to apply, any particle-sizing method based
on laser illumination.
Laser Diffraction Particle Size Analysis
(Particle size range 0.02-2000µm)
Photon Correlation Spectroscopy
(Particle size range :1nm to 5µm)
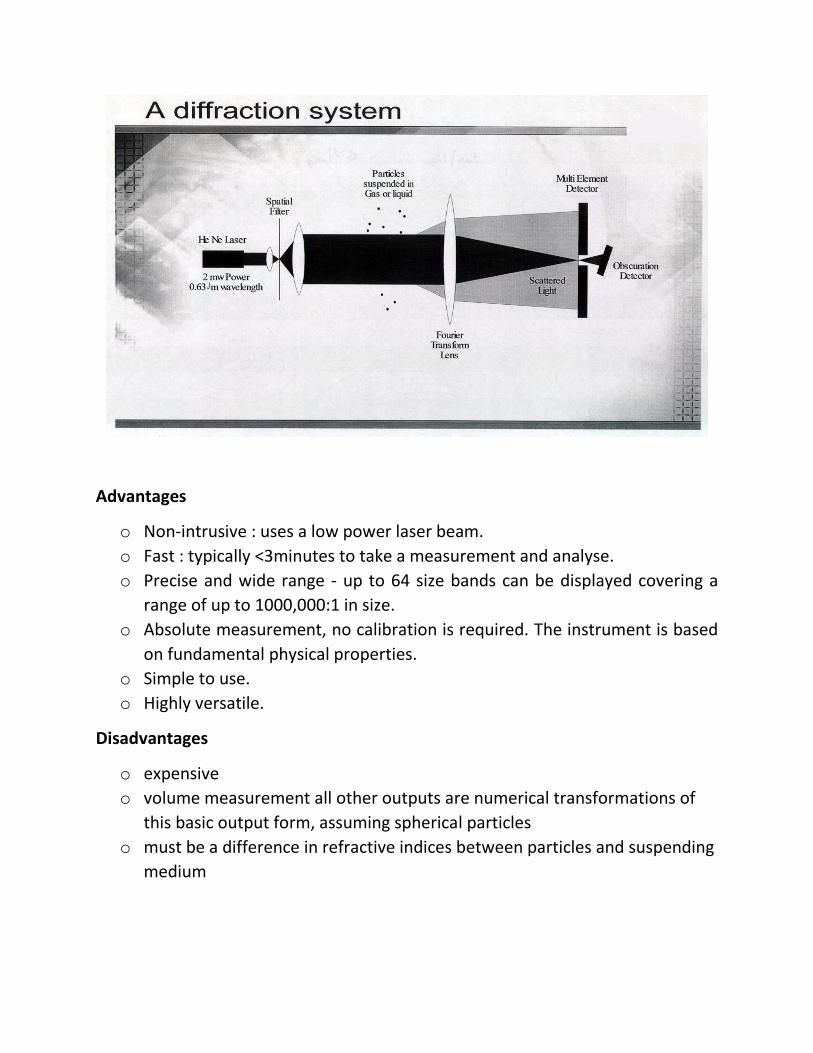
Laser diffraction:
Particles pass through a laser beam and the light scattered by them is collected
over a range of angles in the forward direction.
The angles of diffraction are, in the simplest case inversely related to the particle
size.
The particles pass through an expanded and collimated laser beam in front of a
lens in whose focal plane is positioned a photosensitive detector consisting of a
series of concentric rings.
Distribution of scattered intensity is analysed by computer to yield the particle
size distribution.
Advantages
o Non-intrusive : uses a low power laser beam.
o Fast : typically <3minutes to take a measurement and analyse.
o Precise and wide range - up to 64 size bands can be displayed covering a
range of up to 1000,000:1 in size.
o Absolute measurement, no calibration is required. The instrument is based
on fundamental physical properties.
o Simple to use.
o Highly versatile.
Disadvantages
o expensive
o volume measurement all other outputs are numerical transformations of
this basic output form, assuming spherical particles
o must be a difference in refractive indices between particles and suspending
medium
Permeametry Technique
Determination of the average size of fine particles in a fluid (gas or liquid) by passing the mixture through a powder bed of known dimensions and recording the pressure drop and flow rate through the bed. The air permeametry of powder beds of some coarse particulate solids with varying particle size and shape characteristics were measured. The specific surface area of each powder was calculated using the Kozeny-Carman equation. The air flow conditions through the powder bed were evaluated by the Reynolds number. The materials were examined in microscope to determine particle size and shape, and powder surface areas were calculated from these data. It was found that the height and the packing intensity of the powder bed did not affect the permeametry surface area. The Reynolds number indicated that the flow type was acceptable for the use of the Kozeny-Carman equation. The permeametry and microscopy derived surface areas correlated well although slightly higher surface area values were generally obtained with the permeametry technique. It is concluded that the air permeametry method can be used for the measurement of the external surface area of coarse particulate materials. For porous materials the granule density, rather than the true density, should be used for calculating the surface area.
References:
http://www.fritsch-sizing.com
http://www.nitcharacter.com
http://en.wikipedia.org
http://www.sciencedirect.com