Embed Size (px)
Citation preview
K-MEANS CLUSTERING
INTRODUCTION-What is clustering?
Clustering is the classification of objects into different groups, or more precisely, the partitioning of a data set into subsets (clusters), so that the data in each subset (ideally) share some common trait - often according to some defined distance measure.
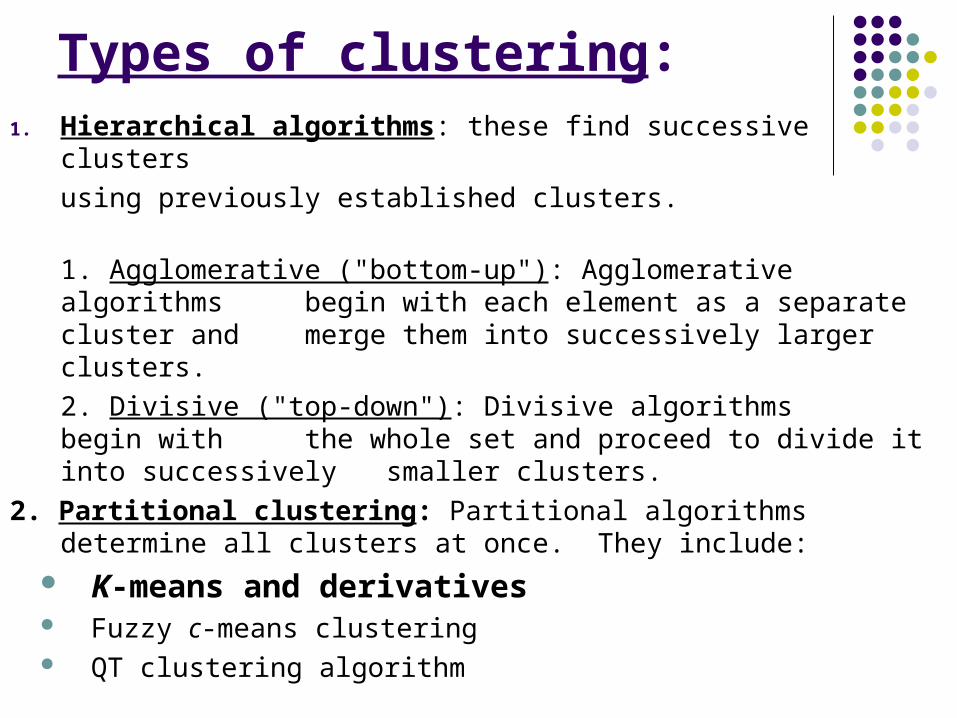
Types of clustering:1. Hierarchical algorithms: these find successive clusters
using previously established clusters.
1. Agglomerative ("bottom-up"): Agglomerative algorithms begin with each element as a separate cluster and merge them into successively larger clusters.
2. Divisive ("top-down"): Divisive algorithms begin with the whole set and proceed to divide it into successively smaller clusters.
2. Partitional clustering: Partitional algorithms determine all clusters at once. They include:
K-means and derivatives Fuzzy c-means clustering QT clustering algorithm
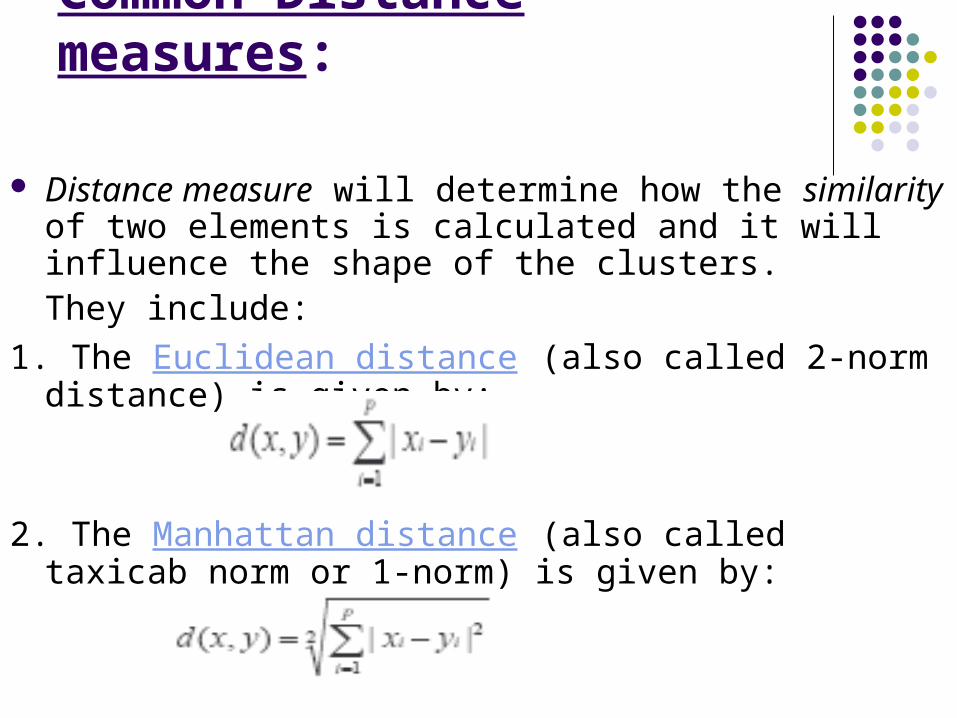
Common Distance measures:
Distance measure will determine how the similarity of two elements is calculated and it will influence the shape of the clusters.They include:
1. The Euclidean distance (also called 2-norm distance) is given by:
2. The Manhattan distance (also called taxicab norm or 1-norm) is given by:
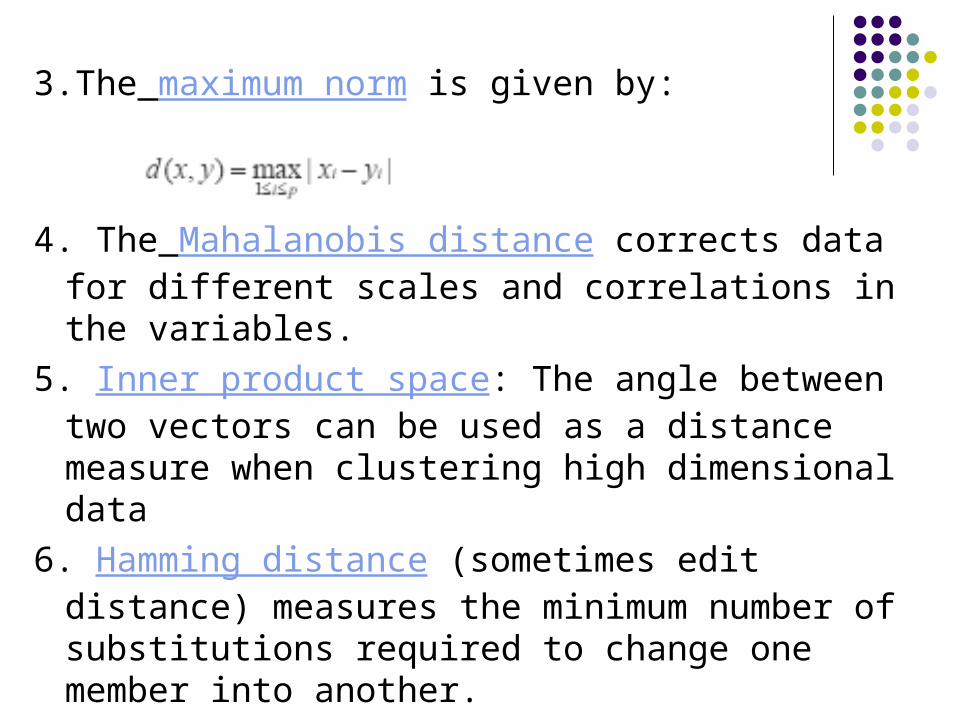
3.The maximum norm is given by:
4. The Mahalanobis distance corrects data for different scales and correlations in the variables.
5. Inner product space: The angle between two vectors can be used as a distance measure when clustering high dimensional data
6. Hamming distance (sometimes edit distance) measures the minimum number of substitutions required to change one member into another.
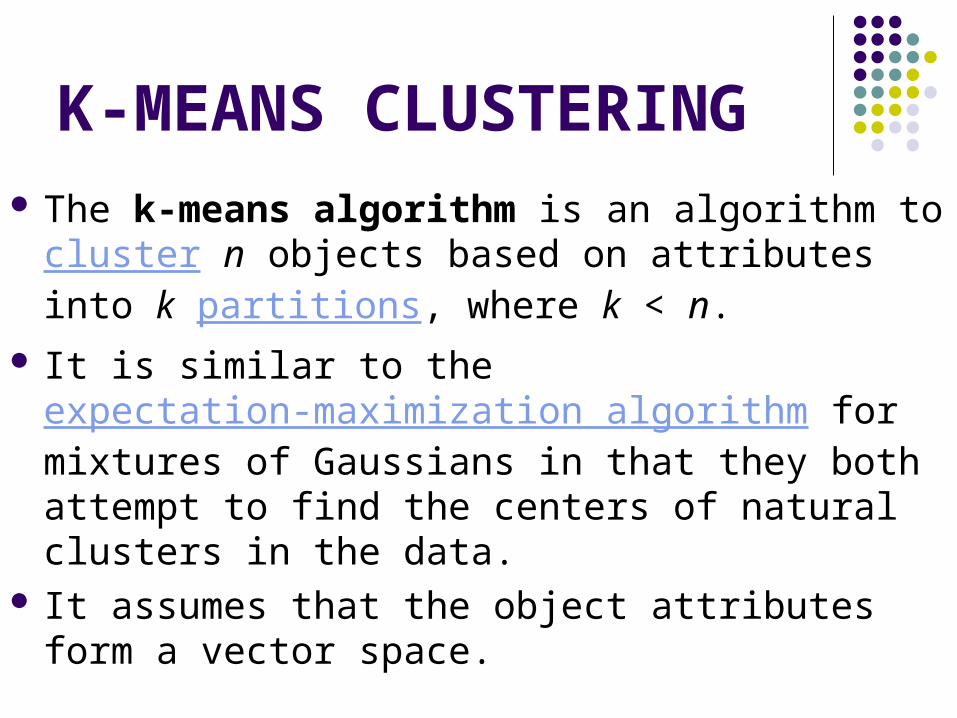
K-MEANS CLUSTERING The k-means algorithm is an algorithm to cluster
n objects based on attributes into k partitions, where k < n.
It is similar to the expectation-maximization algorithm for mixtures of Gaussians in that they both attempt to find the centers of natural clusters in the data.
It assumes that the object attributes form a vector space.
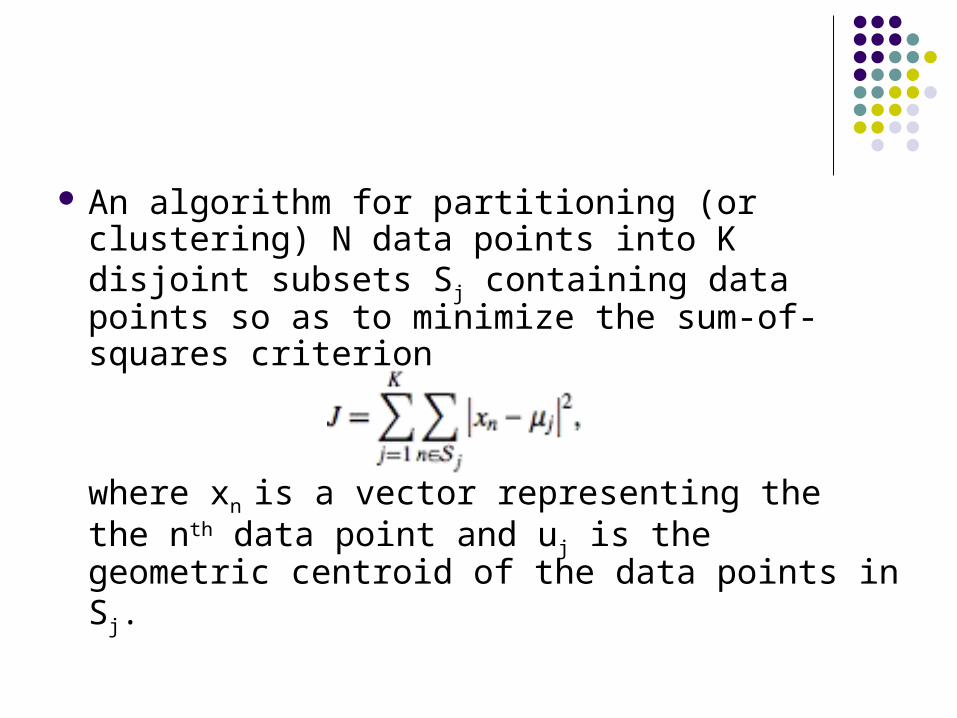
An algorithm for partitioning (or clustering) N data points into K disjoint subsets Sj containing data points so as to minimize the sum-of-squares criterion
where xn is a vector representing the the nth data point and uj is the geometric centroid of the data points in Sj.
Simply speaking k-means clustering is an algorithm to classify or to group the objects based on attributes/features into K number of group.
K is positive integer number. The grouping is done by minimizing the sum
of squares of distances between data and the corresponding cluster centroid.
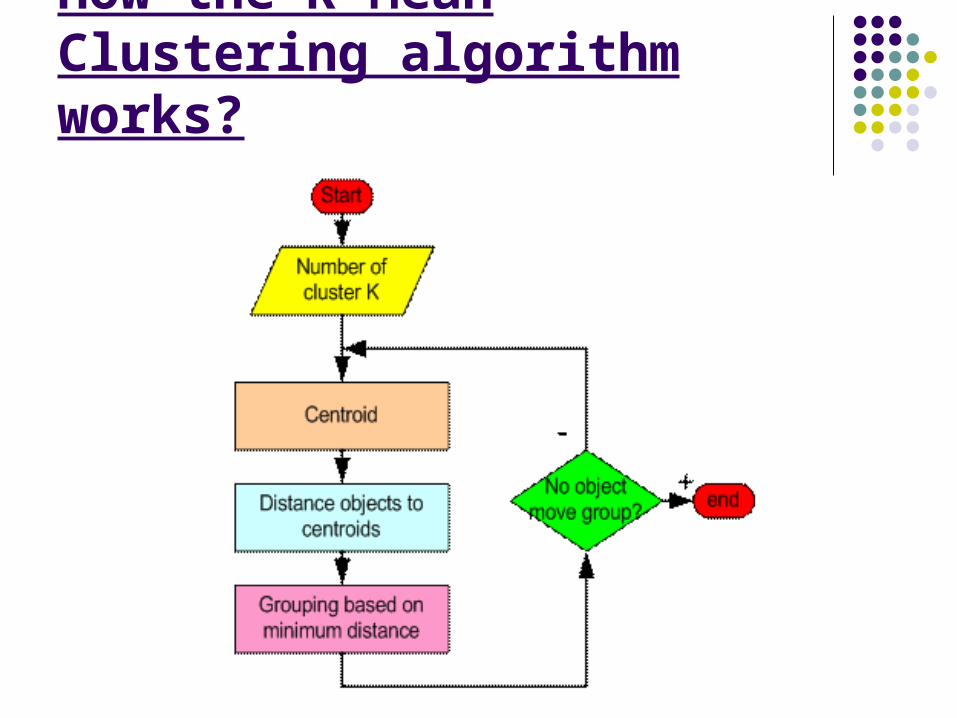
How the K-Mean Clustering algorithm works?
Step 1: Begin with a decision on the value of k = number of clusters .
Step 2: Put any initial partition that classifies the data into k clusters. You may assign the training samples randomly,or systematically as the following:
1.Take the first k training sample as single-element clusters
2. Assign each of the remaining (N-k) training sample to the cluster with the nearest centroid. After each assignment, recompute the centroid of the gaining cluster.
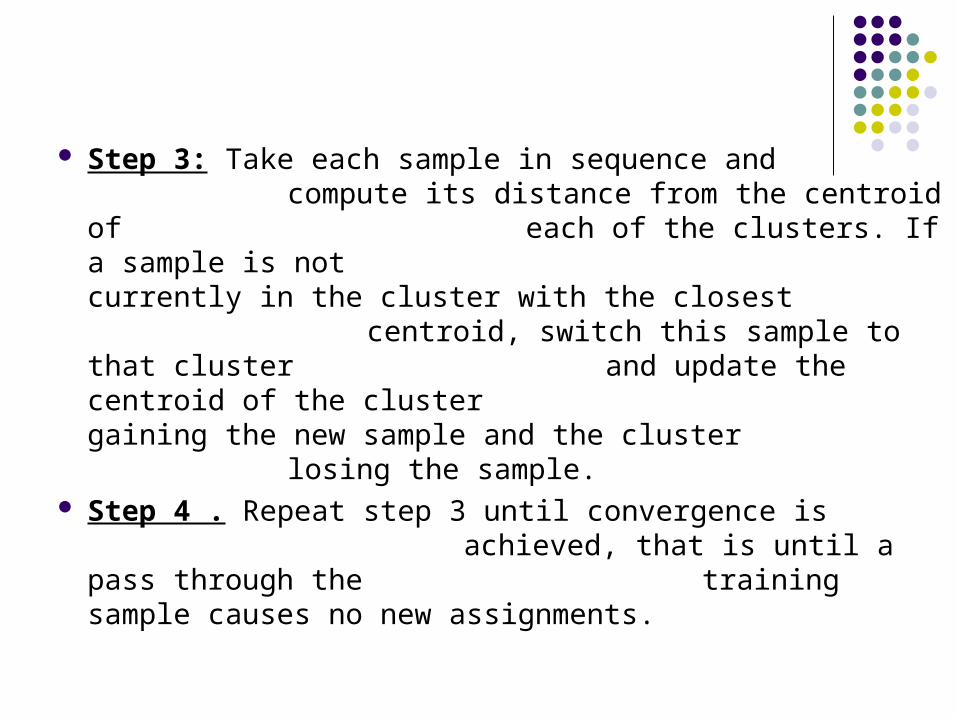
Step 3: Take each sample in sequence and compute its distance from the centroid of each of the clusters. If a sample is not
currently in the cluster with the closest centroid, switch this sample to that cluster
and update the centroid of the cluster gaining the new sample and the cluster losing the sample.
Step 4 . Repeat step 3 until convergence is achieved, that is until a pass through the training sample causes no new assignments.
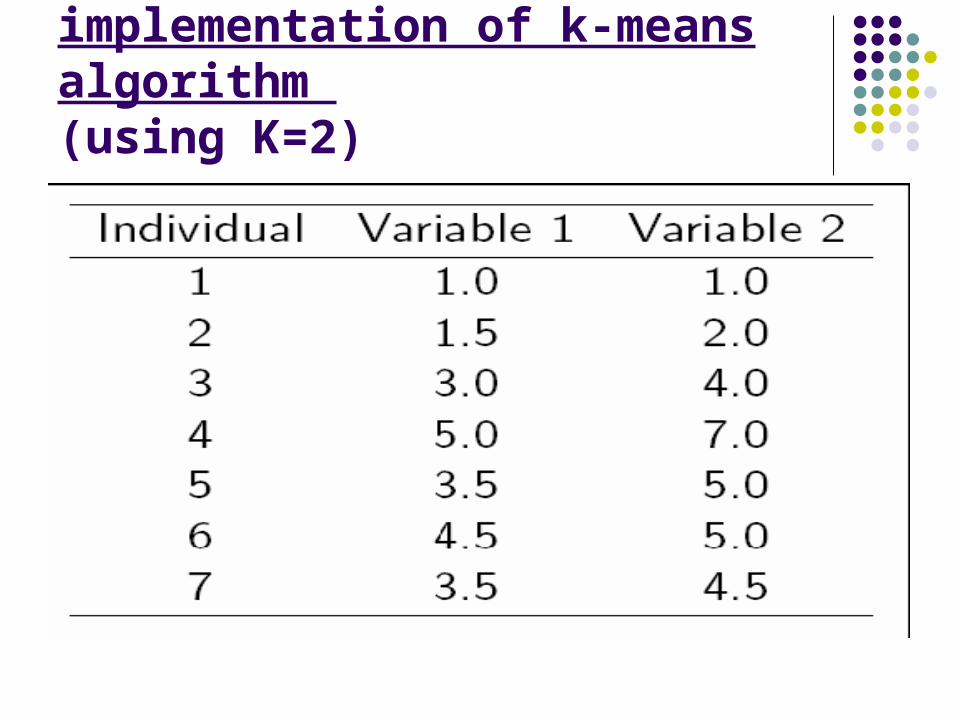
A Simple example showing the implementation of k-means algorithm (using K=2)
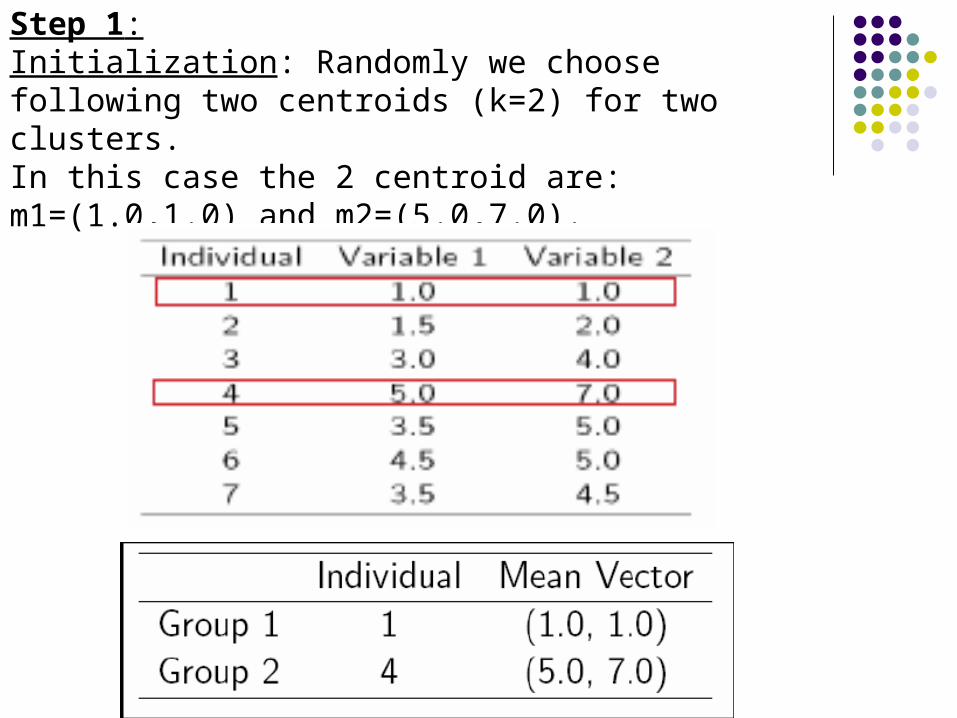
Step 1:Initialization: Randomly we choose following two centroids (k=2) for two clusters.In this case the 2 centroid are: m1=(1.0,1.0) and m2=(5.0,7.0).
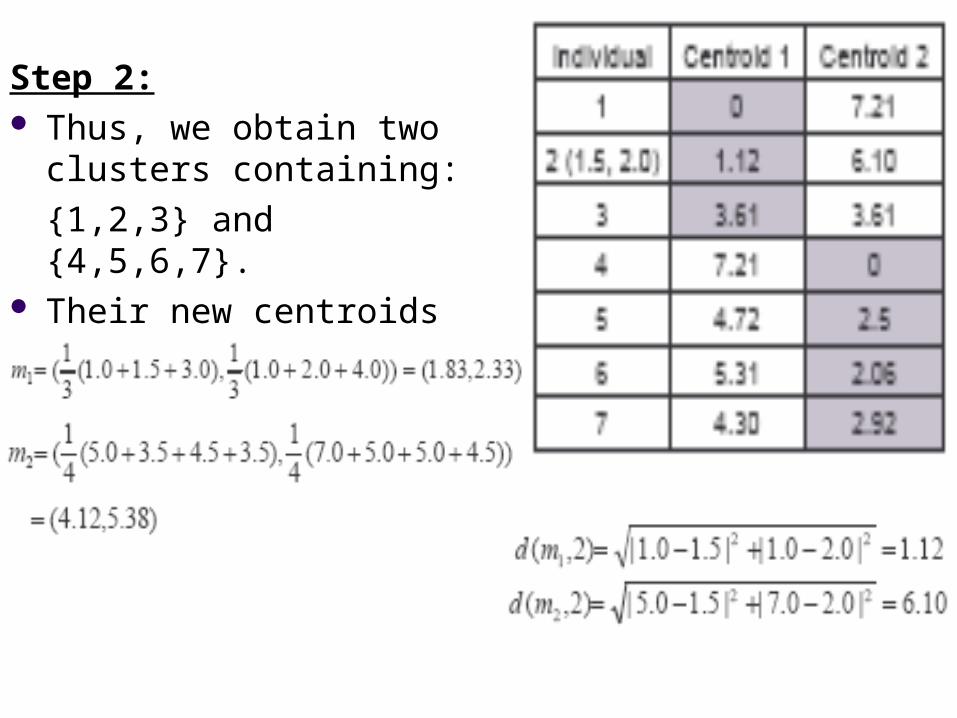
Step 2: Thus, we obtain two clusters
containing:
{1,2,3} and {4,5,6,7}. Their new centroids are:
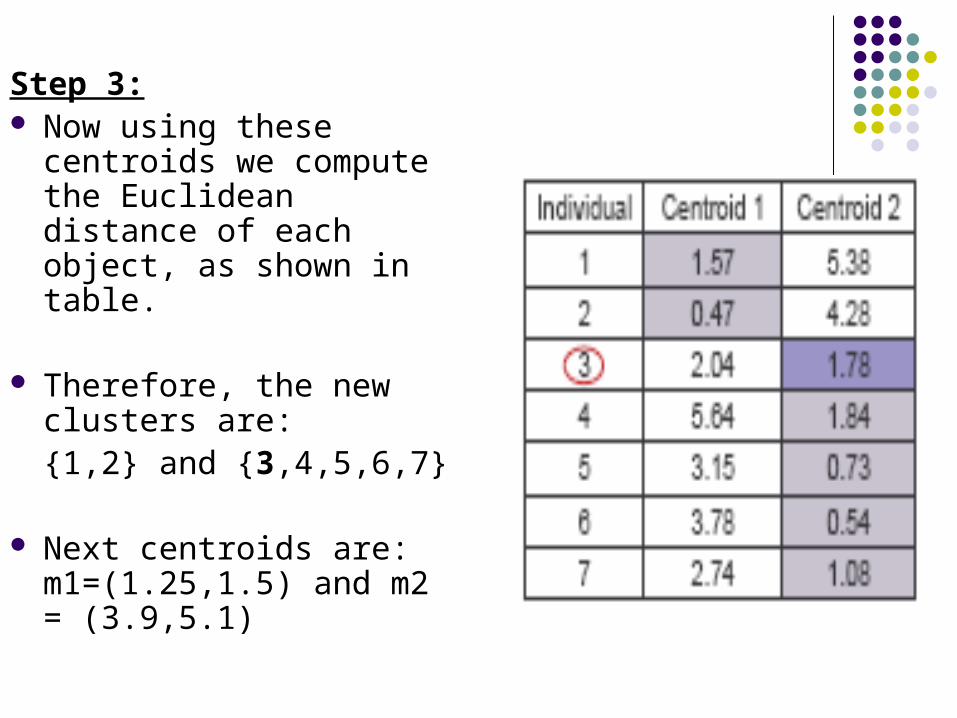
Step 3: Now using these centroids
we compute the Euclidean distance of each object, as shown in table.
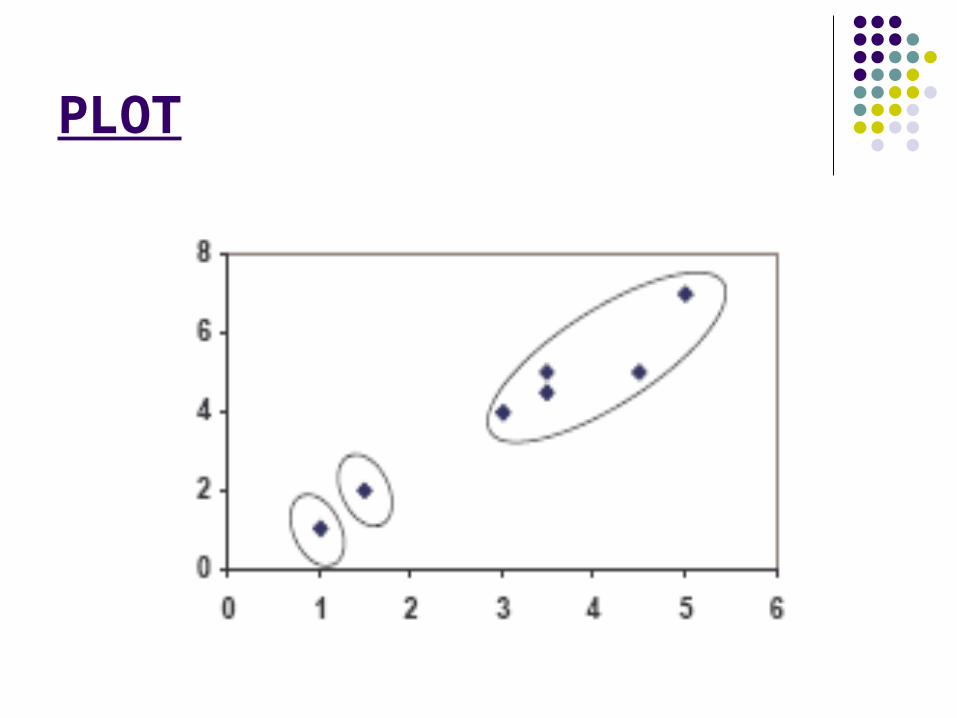
Therefore, the new clusters are:{1,2} and {3,4,5,6,7}
Next centroids are: m1=(1.25,1.5) and m2 = (3.9,5.1)
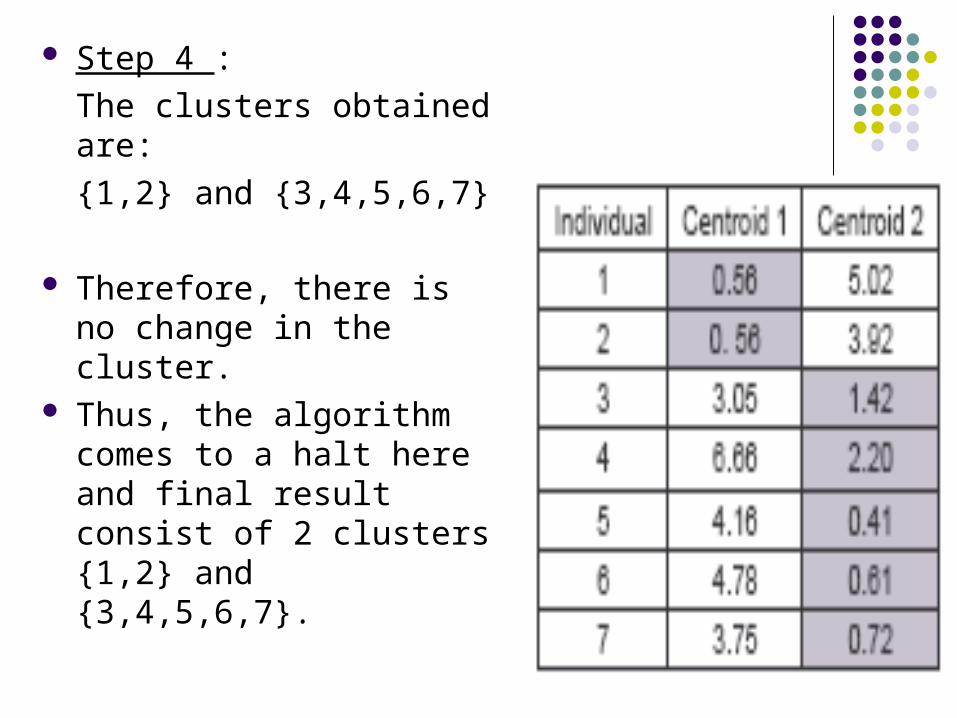
Step 4 :
The clusters obtained are:
{1,2} and {3,4,5,6,7}
Therefore, there is no change in the cluster.
Thus, the algorithm comes to a halt here and final result consist of 2 clusters {1,2} and {3,4,5,6,7}.
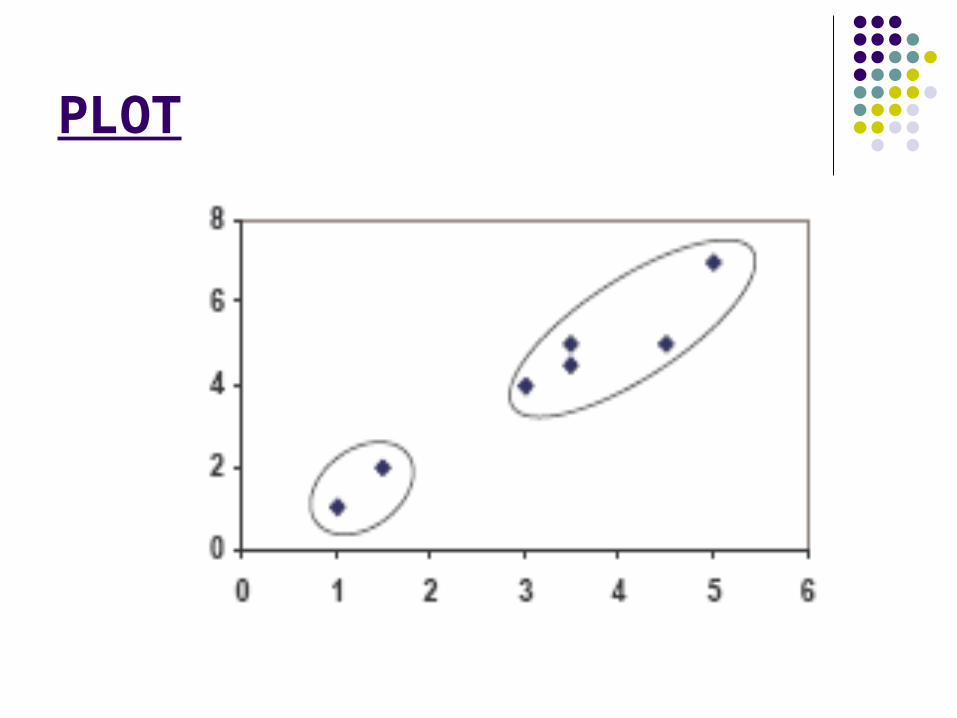
PLOT
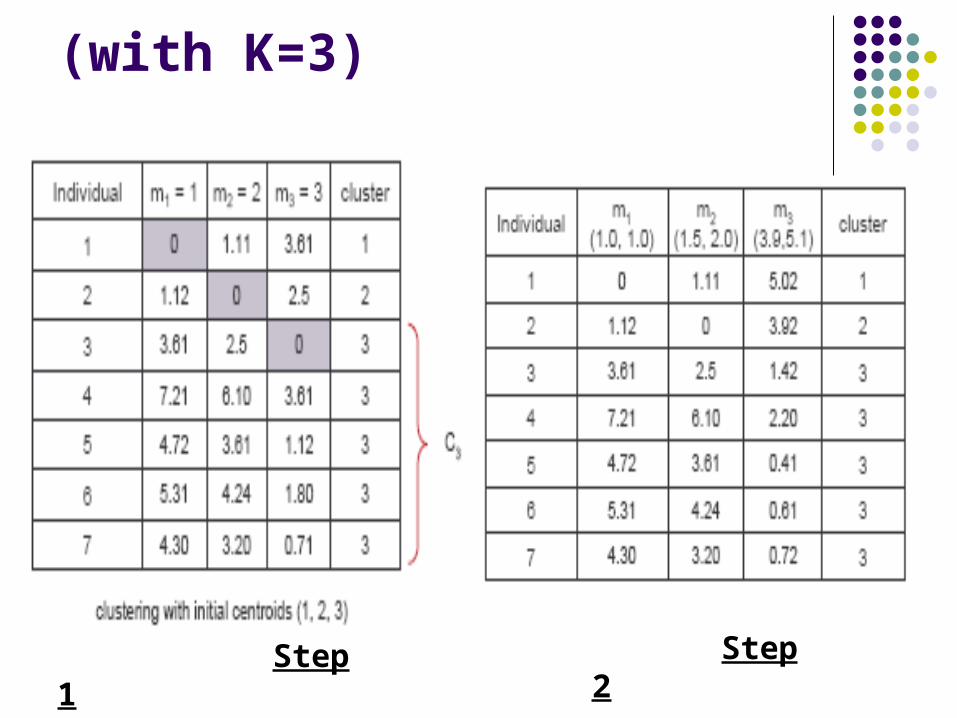
(with K=3)
Step 1 Step 2
PLOT
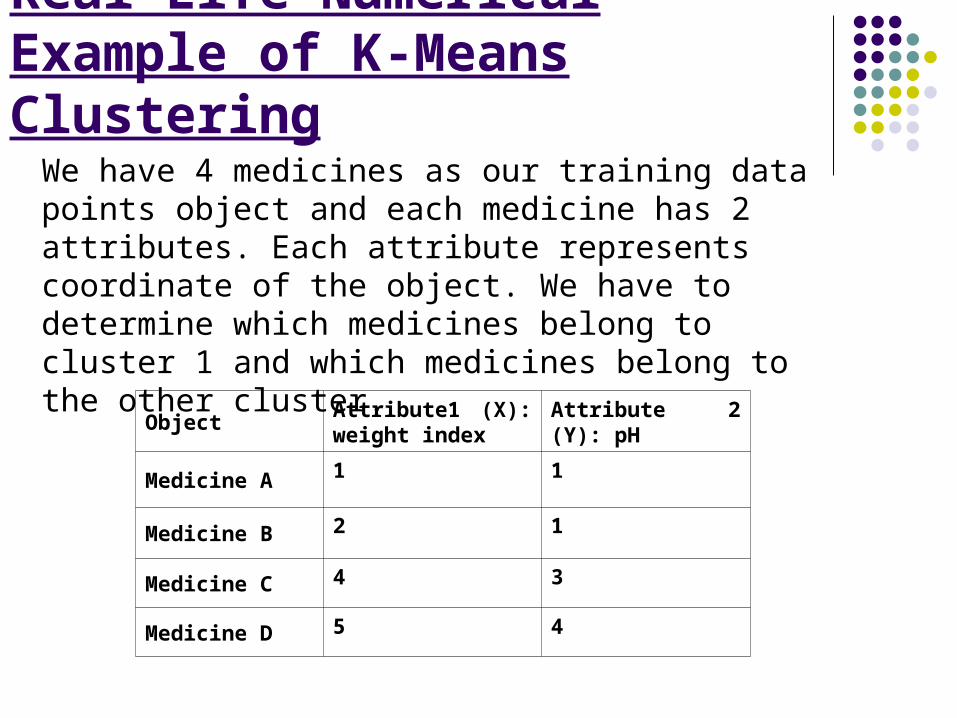
Real-Life Numerical Example of K-Means Clustering
We have 4 medicines as our training data points object and each medicine has 2 attributes. Each attribute represents coordinate of the object. We have to determine which medicines belong to cluster 1 and which medicines belong to the other cluster.
ObjectAttribute1 (X): weight index
Attribute 2 (Y): pH
Medicine A 1 1
Medicine B 2 1
Medicine C 4 3
Medicine D 5 4
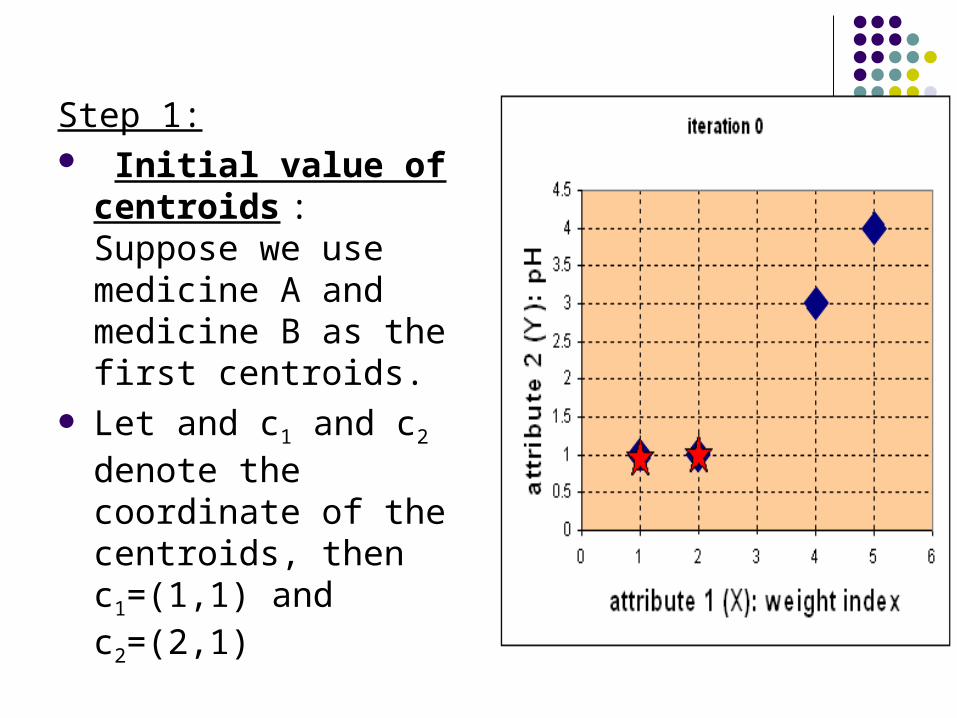
Step 1: Initial value of
centroids : Suppose we use medicine A and medicine B as the first centroids.
Let and c1 and c2
denote the coordinate of the centroids, then c1=(1,1) and c2=(2,1)
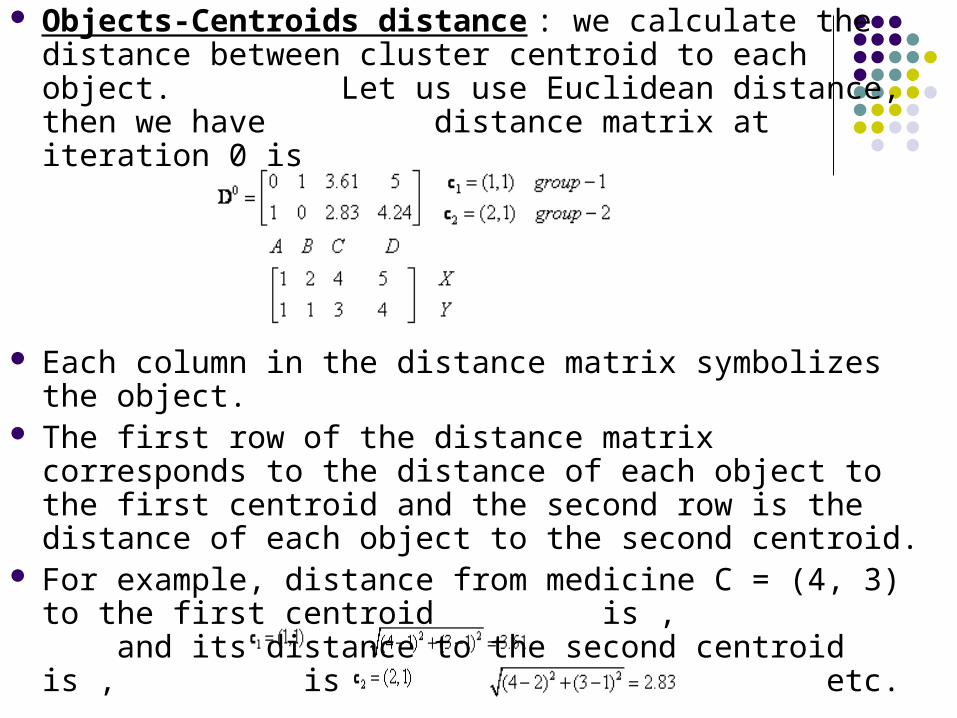
Objects-Centroids distance : we calculate the distance between cluster centroid to each object. Let us use Euclidean distance, then we have distance matrix at iteration 0 is
Each column in the distance matrix symbolizes the object.
The first row of the distance matrix corresponds to the distance of each object to the first centroid and the second row is the distance of each object to the second centroid.
For example, distance from medicine C = (4, 3) to the first centroid is , and its distance to the second centroid is , is etc.
Step 2:
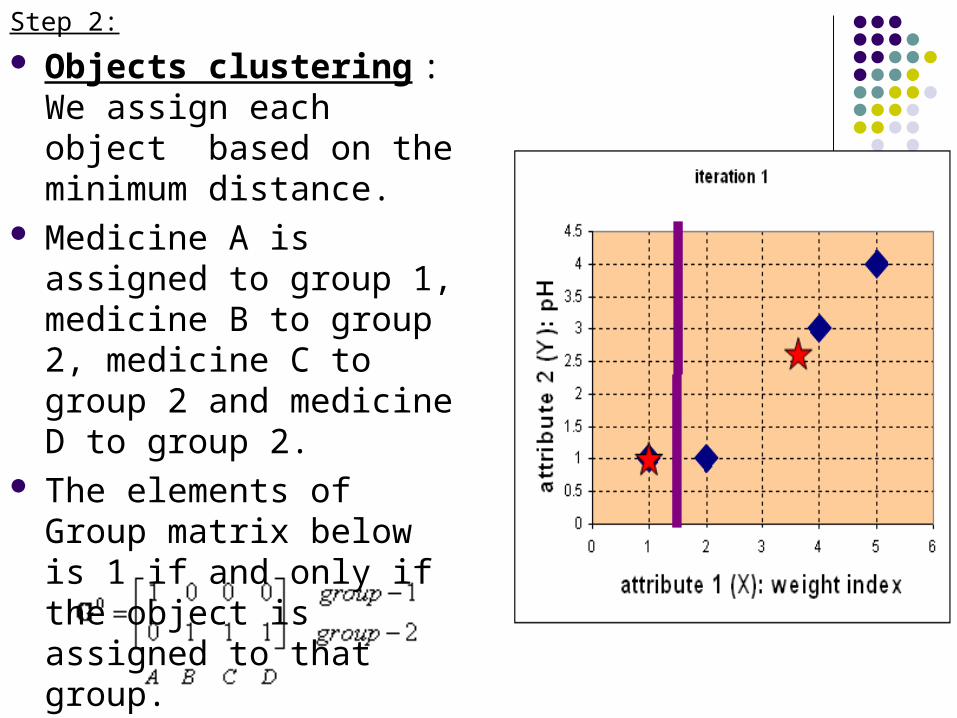
Objects clustering : We assign each object based on the minimum distance.
Medicine A is assigned to group 1, medicine B to group 2, medicine C to group 2 and medicine D to group 2.
The elements of Group matrix below is 1 if and only if the object is assigned to that group.
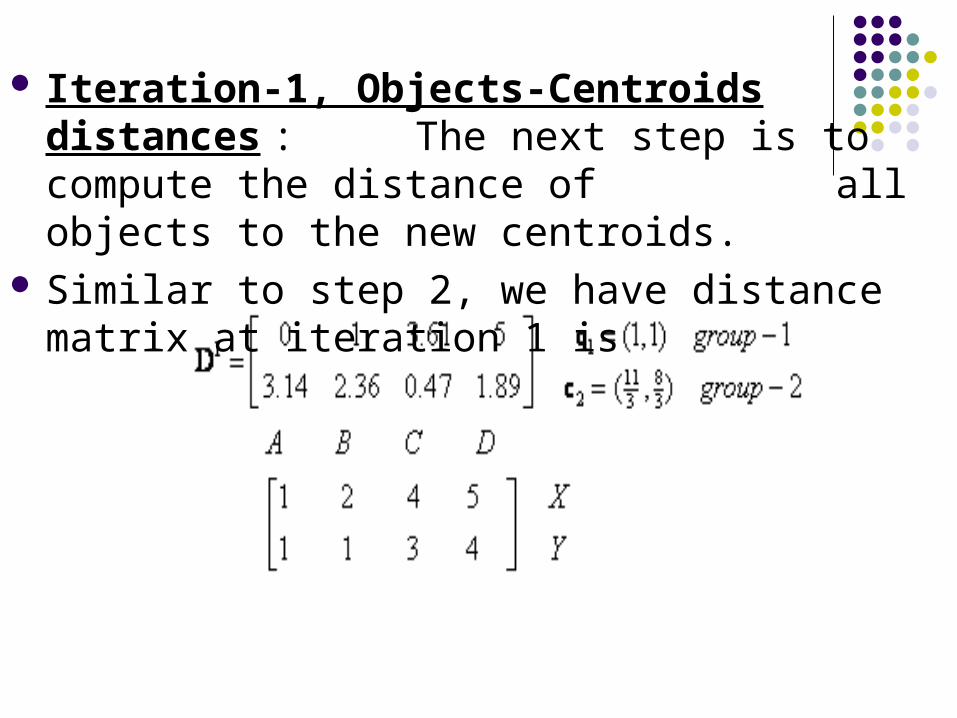
Iteration-1, Objects-Centroids distances : The next step is to compute the distance of all objects to the new centroids.
Similar to step 2, we have distance matrix at iteration 1 is

Iteration-1, Objects clustering:Based on the new distance matrix, we move the medicine B to Group 1 while all the other objects remain. The Group matrix is shown below
Iteration 2, determine centroids: Now we repeat step 4 to calculate the new centroids coordinate based on the clustering of previous iteration. Group1 and group 2 both has two members, thus the new centroids are and
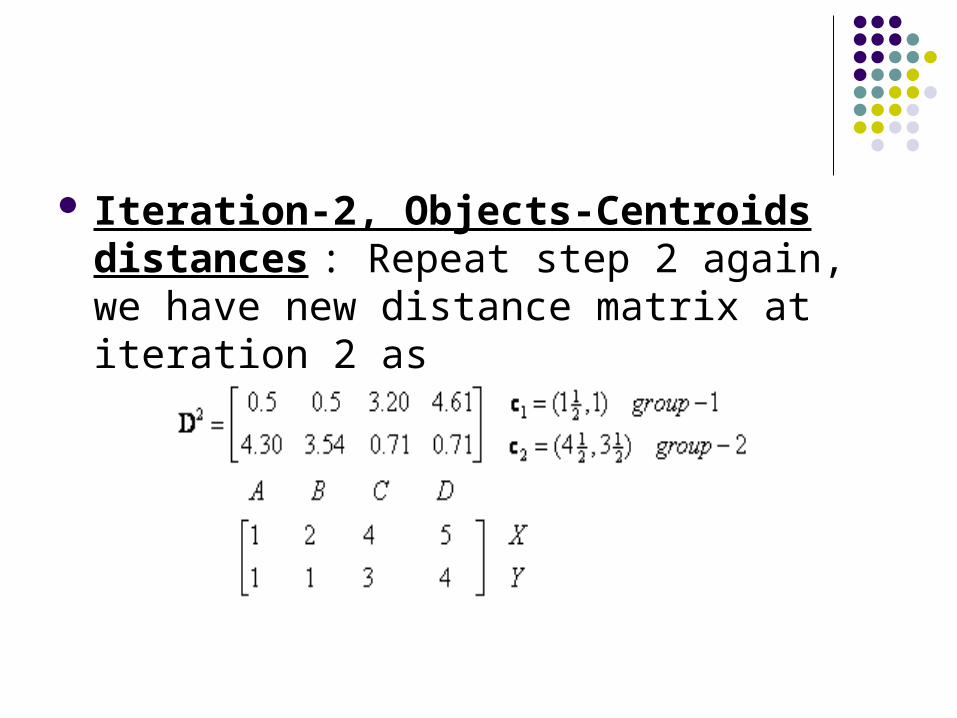
Iteration-2, Objects-Centroids distances : Repeat step 2 again, we have new distance matrix at iteration 2 as
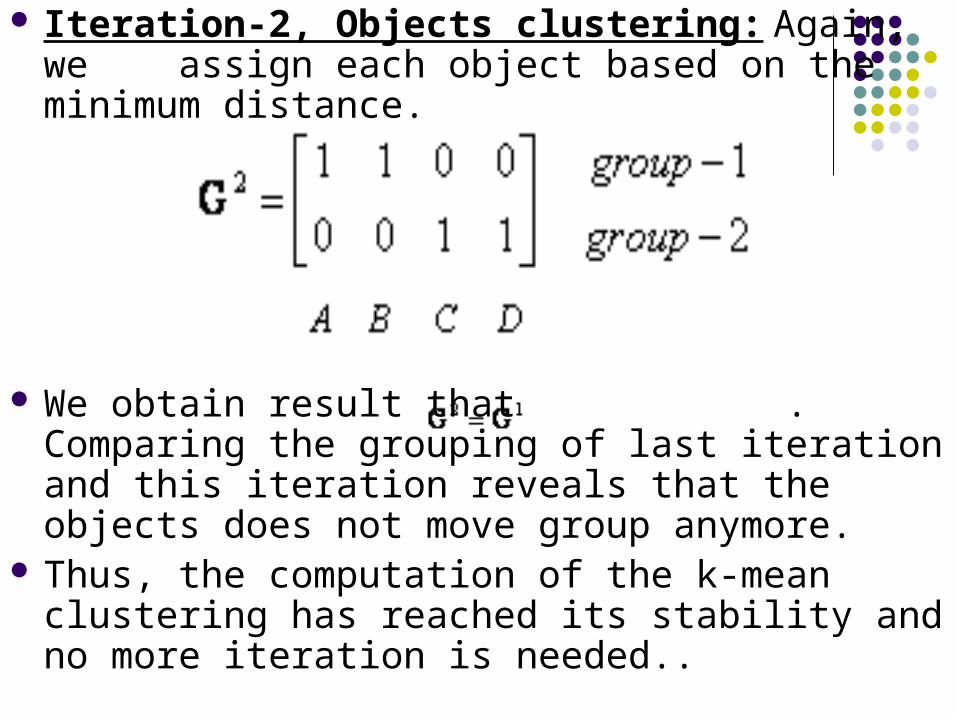
Iteration-2, Objects clustering: Again, we assign each object based on the minimum distance.
We obtain result that . Comparing the grouping of last iteration and this iteration reveals that the objects does not move group anymore.
Thus, the computation of the k-mean clustering has reached its stability and no more iteration is needed..
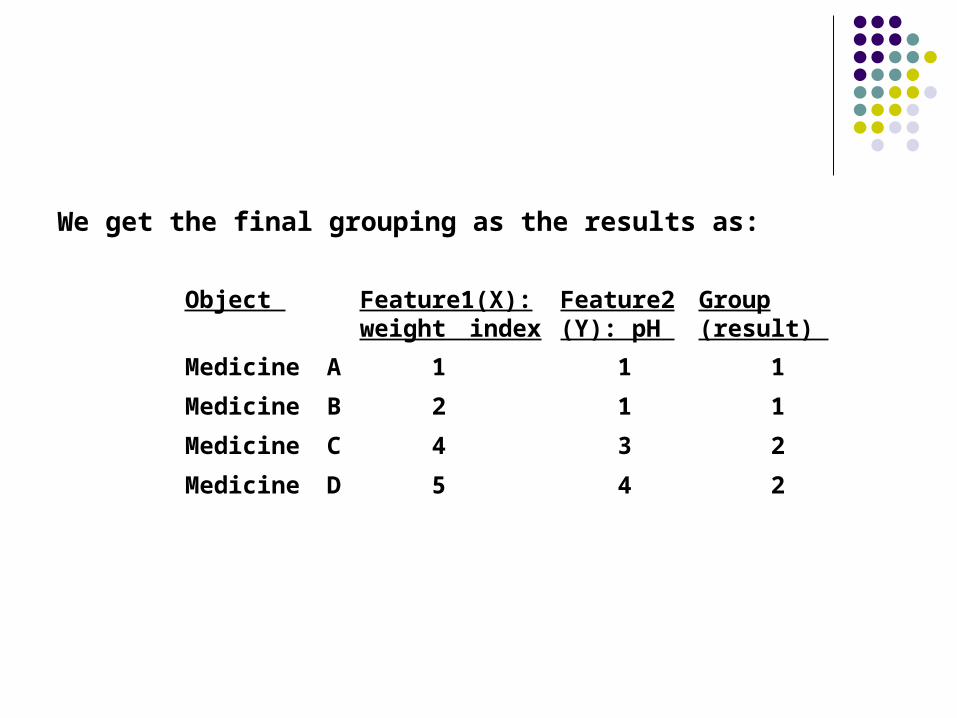
Object Feature1(X):weight index
Feature2(Y): pH
Group(result)
Medicine A 1 1 1
Medicine B 2 1 1
Medicine C 4 3 2
Medicine D 5 4 2
We get the final grouping as the results as:

K-Means Clustering Visual Basic Code
Sub kMeanCluster (Data() As Variant, numCluster As Integer)' main function to cluster data into k number of Clusters' input: ' + Data matrix (0 to 2, 1 to TotalData); ' Row 0 = cluster, 1 =X, 2= Y; data in columns' + numCluster: number of cluster user want the data to be clustered' + private variables: Centroid, TotalData' ouput:' o) update centroid' o) assign cluster number to the Data (= row 0 of Data)
Dim i As IntegerDim j As IntegerDim X As SingleDim Y As SingleDim min As SingleDim cluster As IntegerDim d As SingleDim sumXY()
Dim isStillMoving As Boolean isStillMoving = Trueif totalData <= numCluster Then 'only the last data is put here because it designed to be interactiveData(0, totalData) = totalData ' cluster No = total dataCentroid(1, totalData) = Data(1, totalData) ' XCentroid(2, totalData) = Data(2, totalData) ' YElse 'calculate minimum distance to assign the new datamin = 10 ^ 10 'big numberX = Data(1, totalData)Y = Data(2, totalData)For i = 1 To numCluster d = dist(X, Y, Centroid(1, i), Centroid(2, i)) If d < min Then min = dcluster = iEnd IfNext iData(0, totalData) = cluster
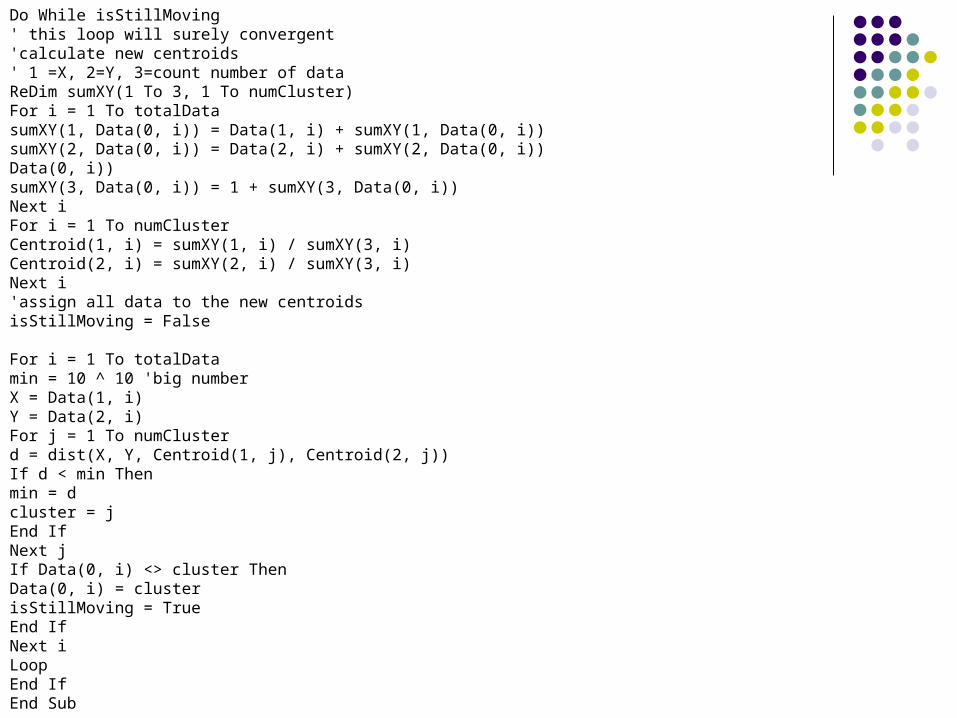
Do While isStillMoving' this loop will surely convergent'calculate new centroids' 1 =X, 2=Y, 3=count number of dataReDim sumXY(1 To 3, 1 To numCluster)For i = 1 To totalDatasumXY(1, Data(0, i)) = Data(1, i) + sumXY(1, Data(0, i))sumXY(2, Data(0, i)) = Data(2, i) + sumXY(2, Data(0, i))Data(0, i))sumXY(3, Data(0, i)) = 1 + sumXY(3, Data(0, i))Next iFor i = 1 To numClusterCentroid(1, i) = sumXY(1, i) / sumXY(3, i)Centroid(2, i) = sumXY(2, i) / sumXY(3, i)Next i'assign all data to the new centroidsisStillMoving = False
For i = 1 To totalDatamin = 10 ^ 10 'big numberX = Data(1, i)Y = Data(2, i)For j = 1 To numClusterd = dist(X, Y, Centroid(1, j), Centroid(2, j))If d < min Thenmin = dcluster = jEnd IfNext jIf Data(0, i) <> cluster ThenData(0, i) = clusterisStillMoving = TrueEnd IfNext iLoop End IfEnd Sub
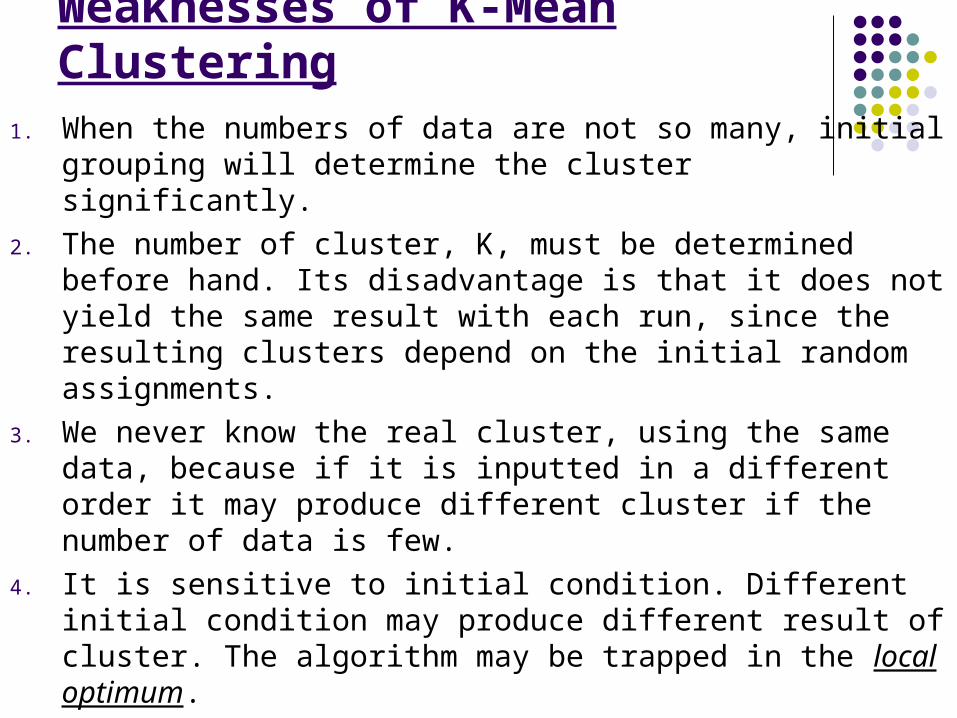
Weaknesses of K-Mean Clustering 1. When the numbers of data are not so many, initial grouping will determine the cluster significantly.
2. The number of cluster, K, must be determined before hand. Its disadvantage is that it does not yield the same result with each run, since the resulting clusters depend on the initial random assignments.
3. We never know the real cluster, using the same data, because if it is inputted in a different order it may produce different cluster if the number of data is few.
4. It is sensitive to initial condition. Different initial condition may produce different result of cluster. The algorithm may be trapped in the local optimum.
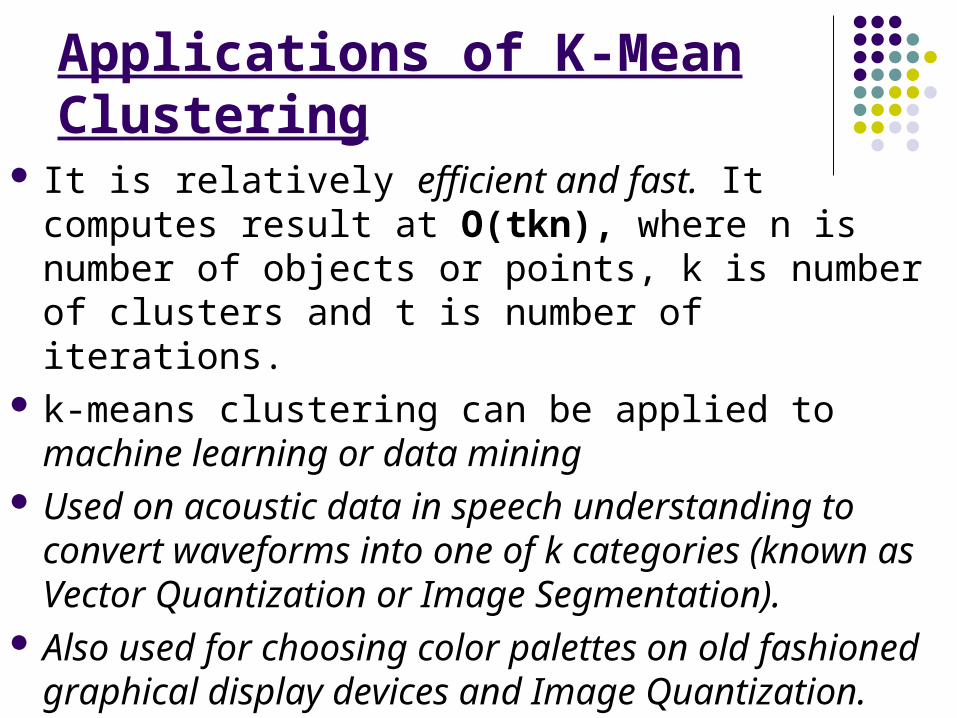
Applications of K-Mean Clustering
It is relatively efficient and fast. It computes result at O(tkn), where n is number of objects or points, k is number of clusters and t is number of iterations.
k-means clustering can be applied to machine learning or data mining
Used on acoustic data in speech understanding to convert waveforms into one of k categories (known as Vector Quantization or Image Segmentation).
Also used for choosing color palettes on old fashioned graphical display devices and Image Quantization.
CONCLUSION
K-means algorithm is useful for undirected knowledge discovery and is relatively simple. K-means has found wide spread usage in lot of fields, ranging from unsupervised learning of neural network, Pattern recognitions, Classification analysis, Artificial intelligence, image processing, machine vision, and many others.
References Tutorial - Tutorial with introduction of Clustering Algorithms (k-means, fuzzy-c-means,
hierarchical, mixture of gaussians) + some interactive demos (java applets).
Digital Image Processing and Analysis-byB.Chanda and D.Dutta Majumdar.
H. Zha, C. Ding, M. Gu, X. He and H.D. Simon. "Spectral Relaxation for K-means Clustering", Neural Information Processing Systems vol.14 (NIPS 2001). pp. 1057-1064, Vancouver, Canada. Dec. 2001.
J. A. Hartigan (1975) "Clustering Algorithms". Wiley.
J. A. Hartigan and M. A. Wong (1979) "A K-Means Clustering Algorithm", Applied Statistics, Vol. 28, No. 1, p100-108.
D. Arthur, S. Vassilvitskii (2006): "How Slow is the k-means Method?,"
D. Arthur, S. Vassilvitskii: "k-means++ The Advantages of Careful Seeding" 2007 Symposium on Discrete Algorithms (SODA).
www.wikipedia.com


![Document Clustering using Improved K-means Algorithm · means algorithm [4] presented how ontological domains are used in clustering documents. Improved document clustering algorithm](https://img.pdfslide.us/doc/110x75/5fa98bfc29d9331b0b2a1030/document-clustering-using-improved-k-means-algorithm-means-algorithm-4-presented.jpg)