Embed Size (px)
Citation preview
Page 1
FINITE ELEMENT ANALYSIS OF GLAZED SURFACE
Raghunath .D. Deshpande1, Gayatri Chiniwal2, Laxmi Golsangi3
1Assistant Professor, Civil Engineering Department, Gogte Institute of Technology Belagavi, Karnataka, India
2Trainee Civil Engineer, Telecommunication Engineering Department, Black and Veatch Pvt. Ltd, Pune,
Maharashtra, India
3M.Tech Scholar, Civil Engineering Department, Gogte Institute of Technology Belagavi, Karnataka, India
-------------------------------------------------------------------***------------------------------------------------------------------------
Abstract- In the present work finite element
analysis of a glazed surface of a structure is
performed. Considering particular location,
topography and terrain and considering glass panel
of a particular type, size and thickness, analysis is
performed for wind pressure and suction acting on
the surface. Different cases are considered – (i)
varying truss widths, (ii) varying cable position and
(iii) varying number of cables.
The results of this work show that displacement,
stress and weight of the steel of structure vary
linearly with the variation in truss width.
Displacement is found to be least for a certain range
of truss width. Stresses decrease with increase in truss
width and the weight of steel increases with increase
in truss width. Having known this, one can choose
economical and efficient steel supporting structure to
support the glazing.
Keywords: Maximum major principal stress,
maximum displacement, truss width, cable position.
1. INTRODUCTION
1.1 General
The present work is carried to study the effects of wind
pressure on glass façade and the supporting steel frame.
Here, analysis is carried out on structure models
consisting of steel frame made up of truss, vertical
columns, horizontal columns and cables and the glass
façade. In the analysis different models are considered
basically by varying (i) truss width (ii) number of cables
(iii) position of cables. The finite element method (FEM)
approach is adopted for modeling glass façade in the
analysis. A wind analysis is performed on a structure
subjected to a combination of dead and wind load. The
structure is checked for deflection and stresses for
various cases.
1.2 Software STAAD.PRO
STAAD.Pro provides a user friendly graphical user
interface (GUI) to model, analyze, post process and
design a structure. In the modeling STAAD.Pro V8i is
used. It allows to assign material properties apart from
default ones. STAAD input file helps edit commands
easily. STAAD output file gives a detailed output that is
easy to understand by anyone.
2. METHODOLOGY
2.1 Determination of Wind Pressure
Given data
Plan dimension:
Length = 75m
Width = 40m
Total height, h = 30.5m
Glass details:
Glass type - Annealed glass
Strength – 55N/mm2
Panel size – 1.5mx4.2m
Thickness = 17.52mm
Other details:
Location – Mumbai, India
Basic wind speed, Vb = 44m/s
Terrain – Category 2, Class C
We Know That:
Modulus of elasticity for glass = 6-7 kN/m2
Unit weight = 25 kN/m3
Poisson’s ratio = 0.2
Page 2
2.1.1 Load Calculation
Dead load
Unit weight of glass = 25 kN/mm3
DL = 1.5 x 4.2 x 0.1752 x 25
= 2.7594 kN/m
Wind Load
Knowing the location and terrain details, from IS: 875
(Part 3) - 1987 [16], coefficients are,
Probability factor (risk coefficient) k1 = 1.0
Terrain, height and structure size factor k2 = 1.05
Topography factor k3 = 1.0
Design wind speed
Vd = Vb x k1 x k2 x k3
= 44 x 1 x 1.05 x 1
= 46.2 m/s
Design wind pressure
Pz = 0.6 x Vd2
= 0.6 x 46.2 x 46.2
= 1.28 kN/m2
Net wind pressure is calculated using the formula,
Pnet = Pz x (Cpe +/- Cpi)
Where,
Cpe – external pressure coefficient (IS 875 part 3 tab le 4)
Cpi – internal pressure coefficient
To obtain Cpe from IS 875 part 3 we need, h/w and l/w
ratios of the plan.
h/w = 0.7625
l/w = 1.875
2.1.2 Resultant Pressure
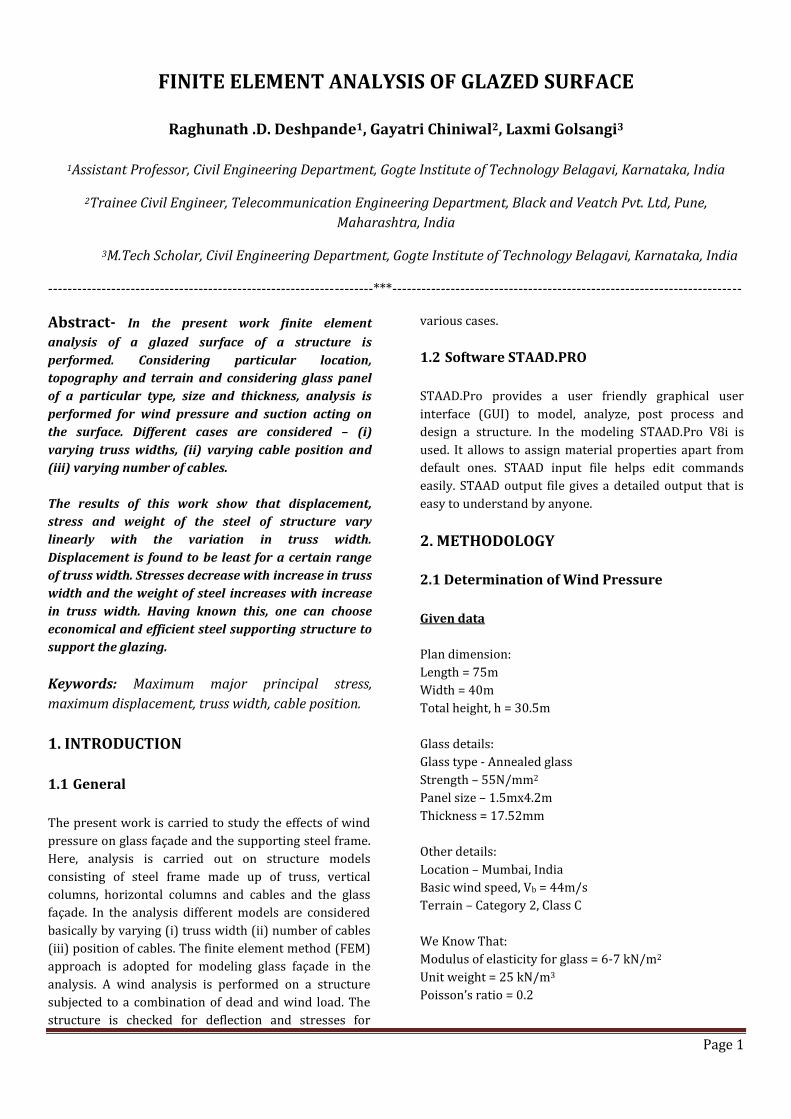
1. Pressure Case
a. Z axis
For Cpe referring IS 875 part3 and Cpi = 0.2 (for 5% wall
openings)
(Cpe+Cpi)
Pz × (Cpe+Cpi)
Fig-1: Pressure along z-axis
b. X axis
(Cpe+Cpi)
Pz × (Cpe+Cpi)
Fig-2: Pressure along x-axis
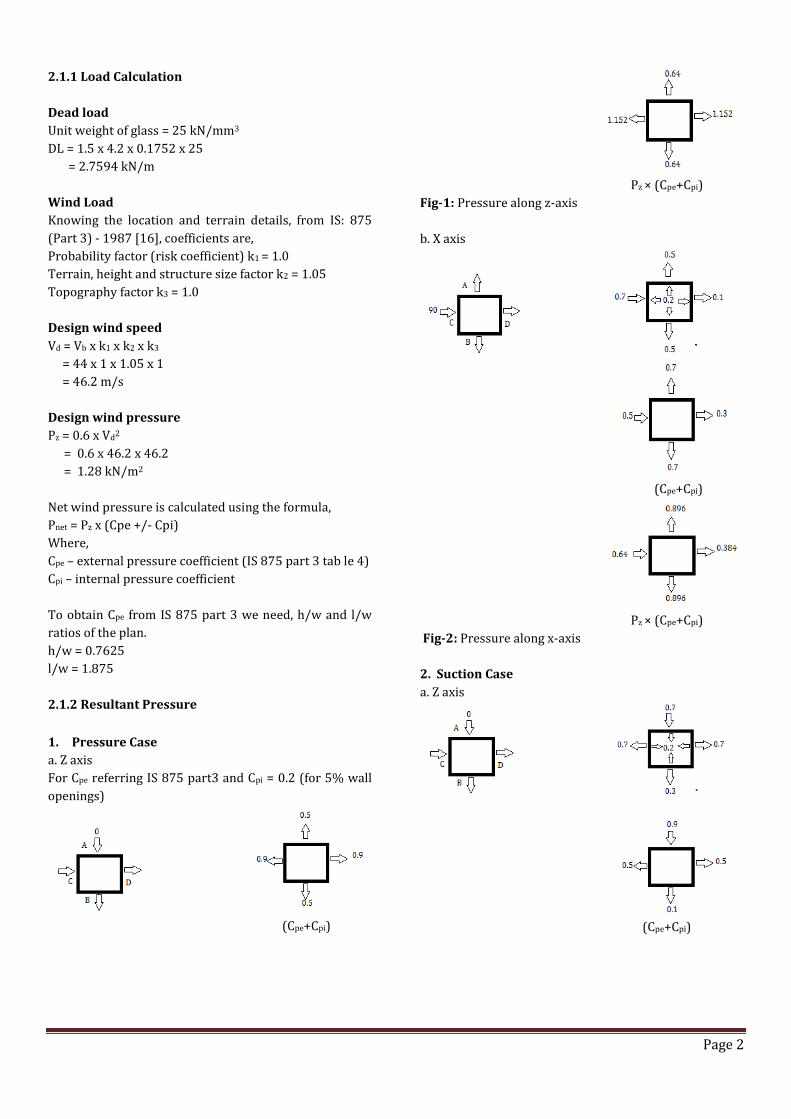
2. Suction Case
a. Z axis
(Cpe+Cpi)
Page 3
Pz × (Cpe+Cpi)
Fig-3: Suction along z-axis
b. X axis
(Cpe+Cpi)
Pz × (Cpe+Cpi)
Fig-4: Suction along x-axis
Pressure = 0.896 kN/m2
Suction = 1.152 kN/m2
2.2 Modeling in STAAD.Pro
One of the objectives of model designing is to ensure it
represents the characteristics of the structure. Many
trials were made until a model was finalized. It consists
of a combination of different types of members. It
comprises of – (i) Steel frame, (ii) Glass façade and (iii)
Connections.
2.2.1 Steel Frame
i.Truss
Height = 19.7m
Two parallel vertical members connected by short
horizontal members.
Horizontal member width (varying) – 0.63m, 0.75m,
0.90m and 1.10m.
Vertical member – 1.05m
Sections used – Pipe Sections
Vertical members - 1651M Steel Pipe
Horizontal members – 889M Steel Pipe
ii. Vertical Columns
Height = 19.7m
Each member = 2.1m
Section used – Pipe
Section 1143M Steel Pipe
iii. Horizontal Supporting Members
Provided at 4 levels of height- 4.2m, 8.4m, 12.6m and
16.8m
Section used – Pipe section
1143M Steel Pipe
Length of each member = 1.5m
iv. Cables
Provided at varying levels of height –
(i) 2 down i.e. @ 2nd and 3rd level from top
(ii) 2 top i.e. @ 1st and 2nd level from top
(iii) 3 cables i.e. @ 1st, 2nd and 3rd level from top
(iv) Alternate 1 and 3 i.e. @ 1st and 3rd level from top
Section used – Solid Circular Steel section
Diameter = 0.01m
Initial tension assigned = 5 kN/m2
2.2.2 Glass Façade
Designed as Plate member
Thickness = 17.52 mm
Rectangular meshing is done
Rectangular mesh of size 0.3mx0.3m each
Panel size – 1.5mx4.2m
Space between adjacent glass pane l- 2mm
2.2.3 Connections
Spider connections are adopted
4-armed and 2-armed spiders are used
4-armed spider is used at top and bottom ends of glass
panels
2-armed spider is used at mid-height of the glass panels
Section used – Solid Circular Steel
section Diameter – 0.12m
4-armed spider:
2-arms are connecting top of the panel are assigned Mx,
My, Mz releases.
Page 4
2-arms connecting bottom of the spider are assigned Fy,
Mx, My, Mz releases.
2- armed spider:
They are provided at mid-height of the panels.
Both the ends are released for Fy, Mx, My, Mz.
Connection arm between the spider and the steel frame
Section used – Solid Circular Steel section
Diameter = 0.12m
2.3 Supports
Four types of supports are used in the STAAD model-
(i) Pinned Support
(ii) Fixed but Mx released
(iii) Fixed but Mz released
(iv) Fixed but Mx & Mz released
2.4 Load Assigned in STAAD
i. Dead load
DL Selfweight
ii. Wind load
WPRE = -0.896 kN/m2
WSUC = 1.152 kN/m2
iii. Combinations
DL+0.75WPRE
DL+0.75WSUC
DL-0.75WPRE
DL-0.75WSUC
2.5 Analysis
After the model is designed and all the properties and
loads are assigned, the file is saved and analysis is run.
The results of analysis are obtained in post processing
mode. The displacements at every node, reactions,
stresses and steel take off etc are well produced in
STAAD in an easy-to-understand manner. Graphs can be
plot using MS Excel or any graph plotter to depict the
trend of change in structure behavior under different
conditions of loading and varying parameters.
2.6 Model
Table: 1- Models
Truss
width
in m
Cable position
0.63 2 cables
down
2 cables
top
3 cables Alternate
cables @
1 and 3
level
0.75 2 cables
down
2 cables
top
3 cables Alternate
cables @
1 and 3
level
0.90 2 cables
down
2 cables
top
3 cables Alternate
cables @
1 and 3
level
1.10 2 cables
down
2 cables
top
3 cables Alternate
cables @
1 and 3
level
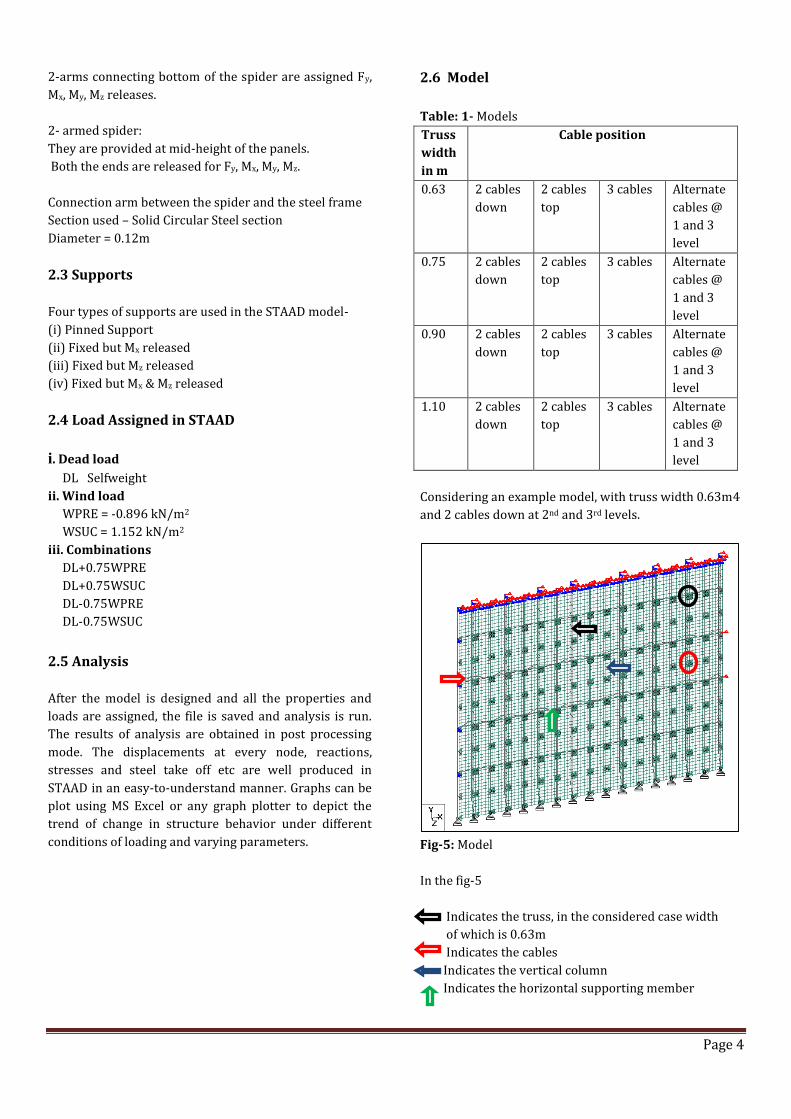
Considering an example model, with truss width 0.63m4
and 2 cables down at 2nd and 3rd levels.
Fig-5: Model
In the fig-5
Indicates the truss, in the considered case width
of which is 0.63m
Indicates the cables
Indicates the vertical column
Indicates the horizontal supporting member
Page 5
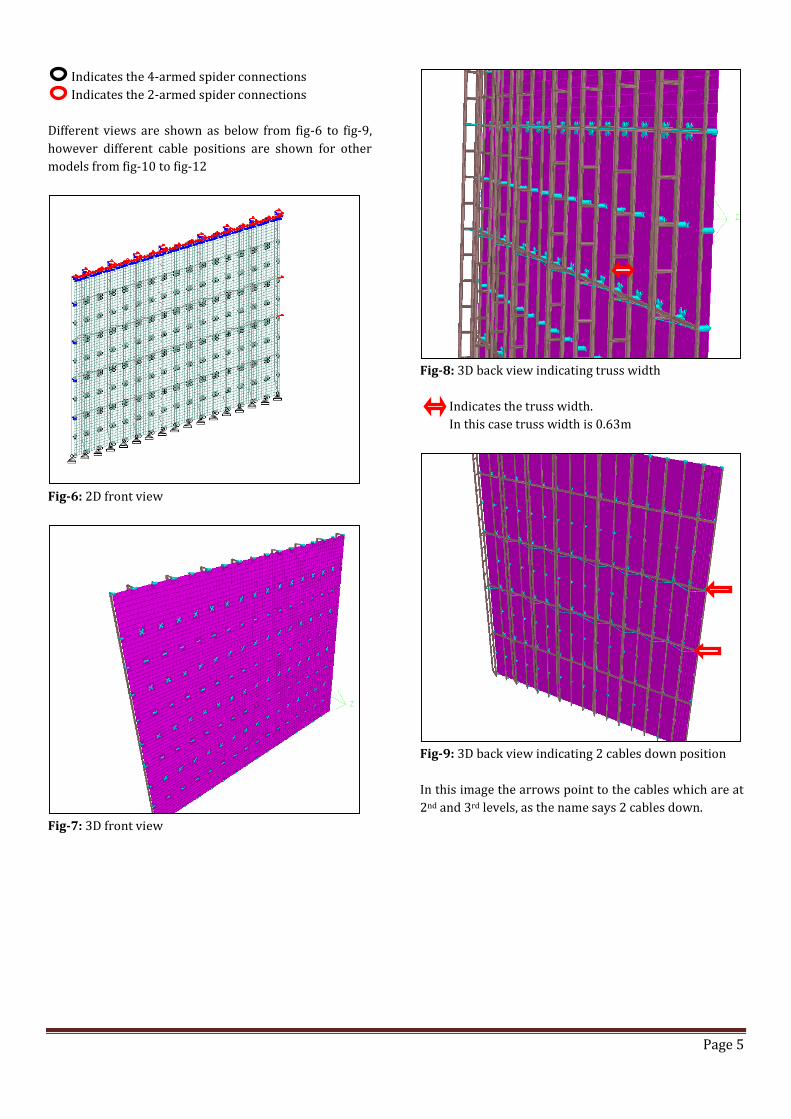
Indicates the 4-armed spider connections
Indicates the 2-armed spider connections
Different views are shown as below from fig-6 to fig-9,
however different cable positions are shown for other
models from fig-10 to fig-12
Fig-6: 2D front view
Fig-7: 3D front view
Fig-8: 3D back view indicating truss width
Indicates the truss width.
In this case truss width is 0.63m
Fig-9: 3D back view indicating 2 cables down position
In this image the arrows point to the cables which are at
2nd and 3rd levels, as the name says 2 cables down.
Page 6
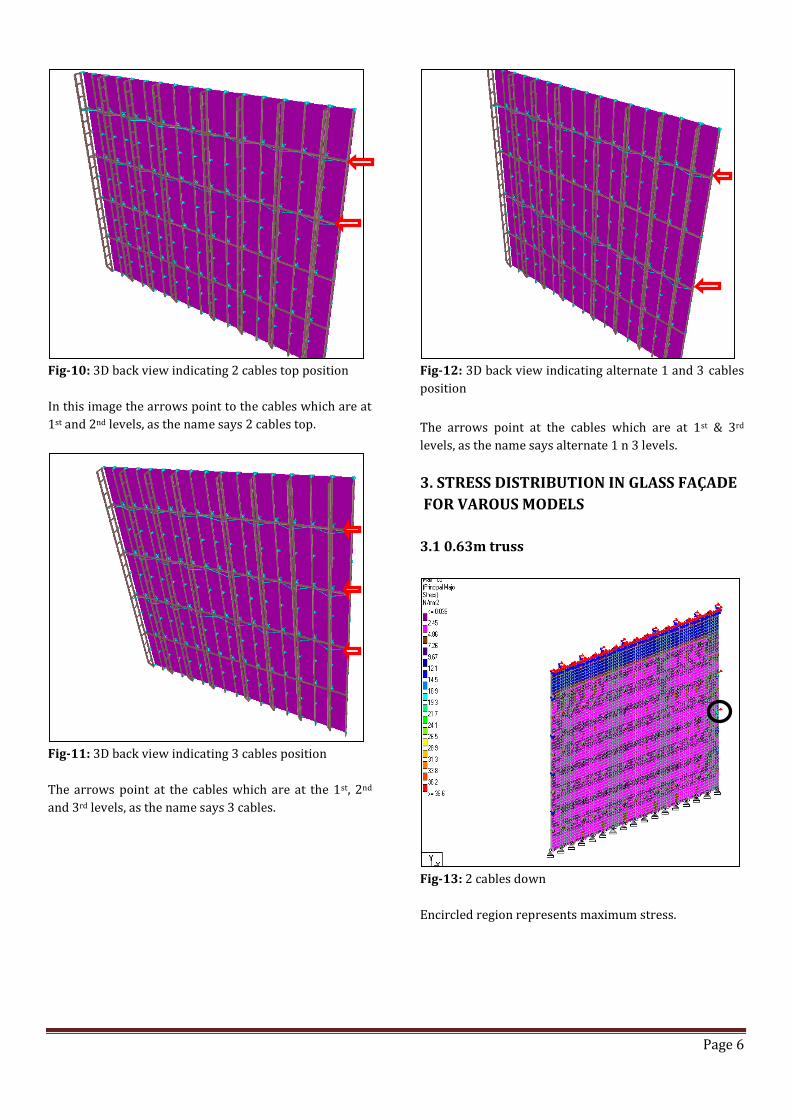
Fig-10: 3D back view indicating 2 cables top position
In this image the arrows point to the cables which are at
1st and 2nd levels, as the name says 2 cables top.
Fig-11: 3D back view indicating 3 cables position
The arrows point at the cables which are at the 1st, 2nd
and 3rd levels, as the name says 3 cables.
Fig-12: 3D back view indicating alternate 1 and 3 cables
position
The arrows point at the cables which are at 1st & 3rd
levels, as the name says alternate 1 n 3 levels.
3. STRESS DISTRIBUTION IN GLASS FAÇADE
FOR VAROUS MODELS
3.1 0.63m truss
Fig-13: 2 cables down
Encircled region represents maximum stress.
Page 7
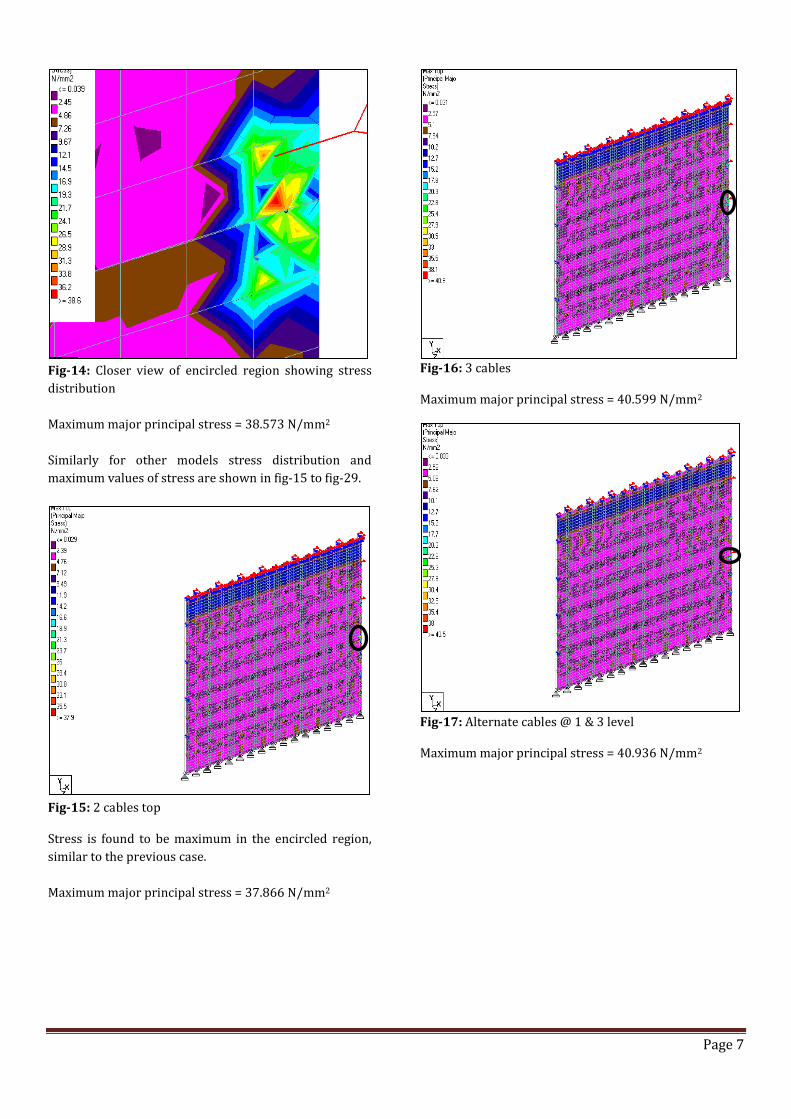
Fig-14: Closer view of encircled region showing stress
distribution
Maximum major principal stress = 38.573 N/mm2
Similarly for other models stress distribution and
maximum values of stress are shown in fig-15 to fig-29.
Fig-15: 2 cables top
Stress is found to be maximum in the encircled region,
similar to the previous case.
Maximum major principal stress = 37.866 N/mm2
Fig-16: 3 cables
Maximum major principal stress = 40.599 N/mm2
Fig-17: Alternate cables @ 1 & 3 level
Maximum major principal stress = 40.936 N/mm2
Page 8
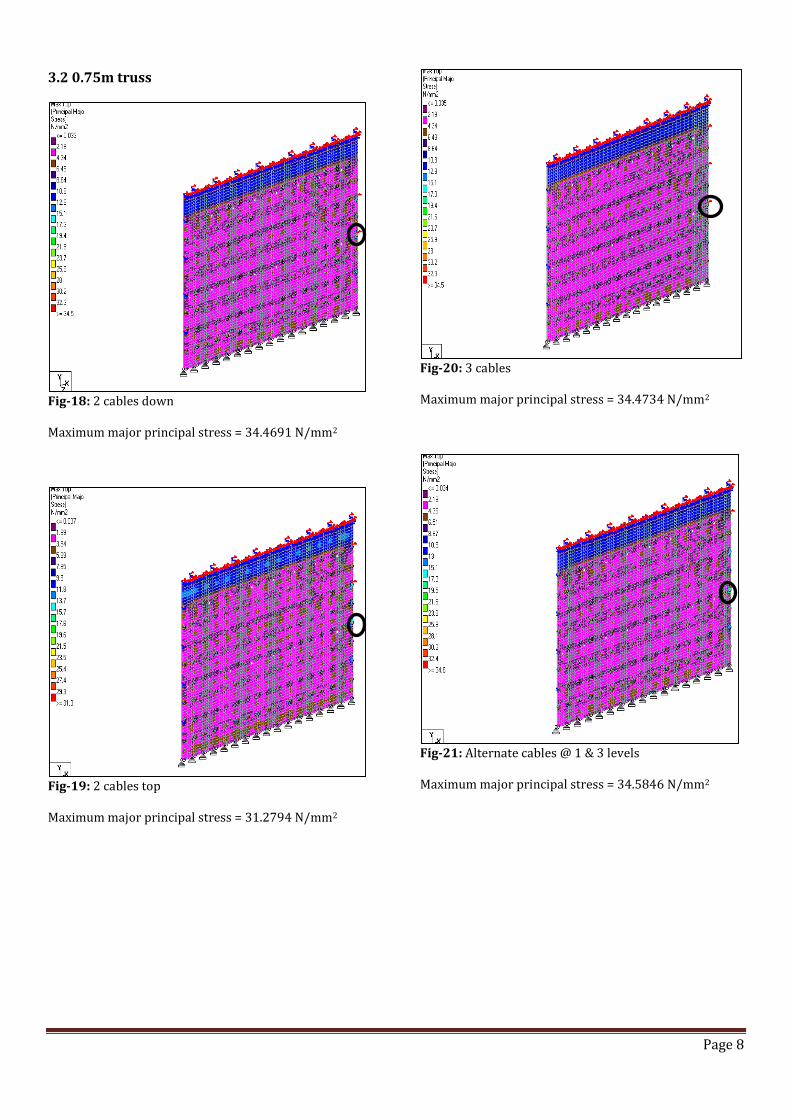
3.2 0.75m truss
Fig-18: 2 cables down
Maximum major principal stress = 34.4691 N/mm2
Fig-19: 2 cables top
Maximum major principal stress = 31.2794 N/mm2
Fig-20: 3 cables
Maximum major principal stress = 34.4734 N/mm2
Fig-21: Alternate cables @ 1 & 3 levels
Maximum major principal stress = 34.5846 N/mm2
Page 9
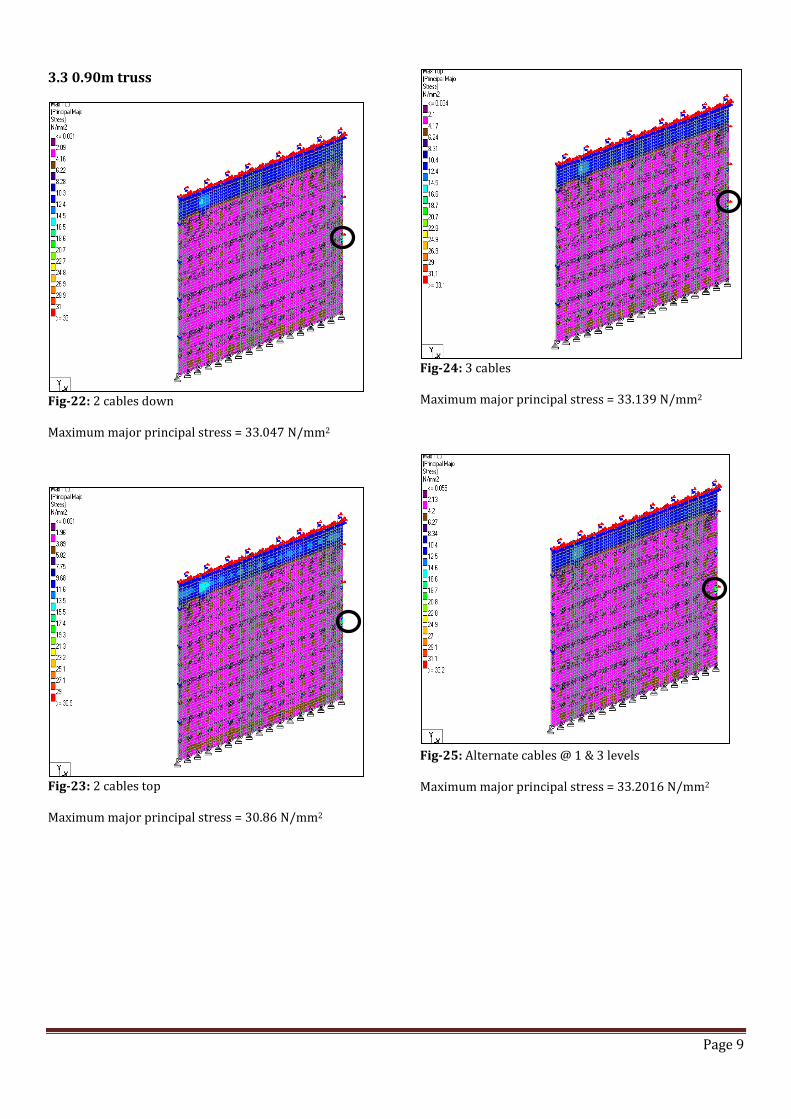
3.3 0.90m truss
Fig-22: 2 cables down
Maximum major principal stress = 33.047 N/mm2
Fig-23: 2 cables top
Maximum major principal stress = 30.86 N/mm2
Fig-24: 3 cables
Maximum major principal stress = 33.139 N/mm2
Fig-25: Alternate cables @ 1 & 3 levels
Maximum major principal stress = 33.2016 N/mm2
Page 10
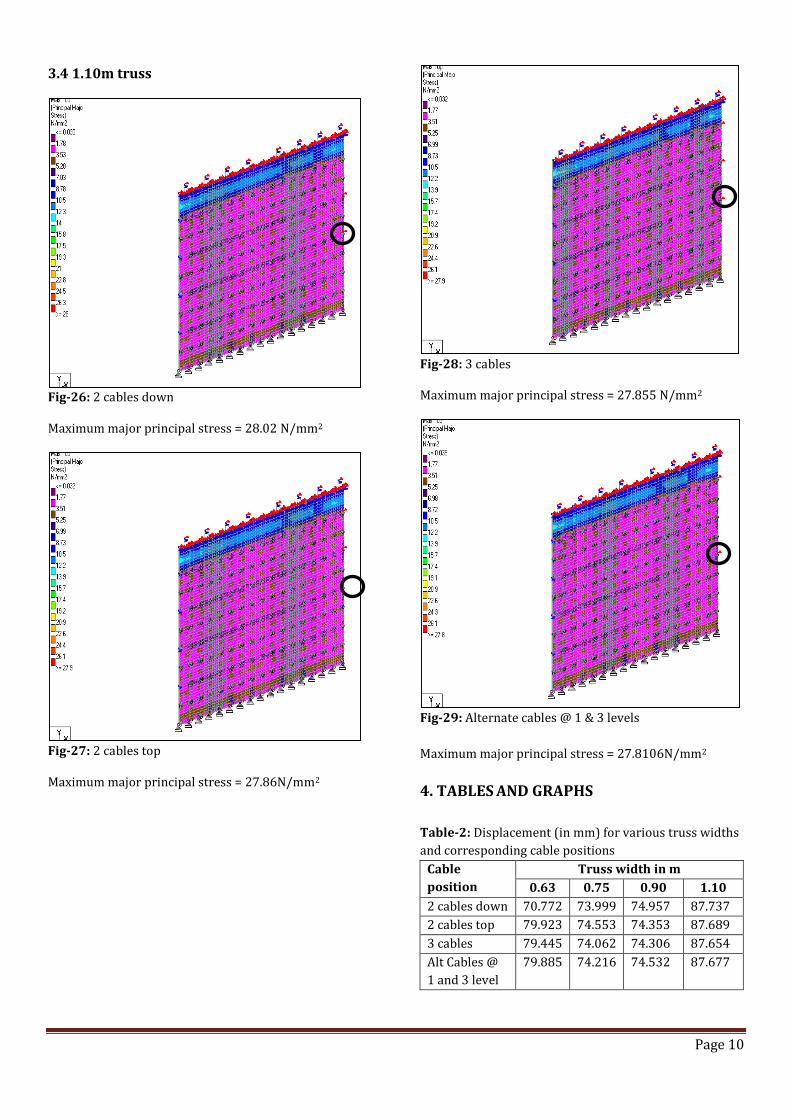
3.4 1.10m truss
Fig-26: 2 cables down
Maximum major principal stress = 28.02 N/mm2
Fig-27: 2 cables top
Maximum major principal stress = 27.86N/mm2
Fig-28: 3 cables
Maximum major principal stress = 27.855 N/mm2
Fig-29: Alternate cables @ 1 & 3 levels
Maximum major principal stress = 27.8106N/mm2
4. TABLES AND GRAPHS
Table-2: Displacement (in mm) for various truss widths
and corresponding cable positions Cable
position
Truss width in m
0.63 0.75 0.90 1.10
2 cables down 70.772 73.999 74.957 87.737
2 cables top 79.923 74.553 74.353 87.689
3 cables 79.445 74.062 74.306 87.654
Alt Cables @
1 and 3 level
79.885 74.216 74.532 87.677
Page 11
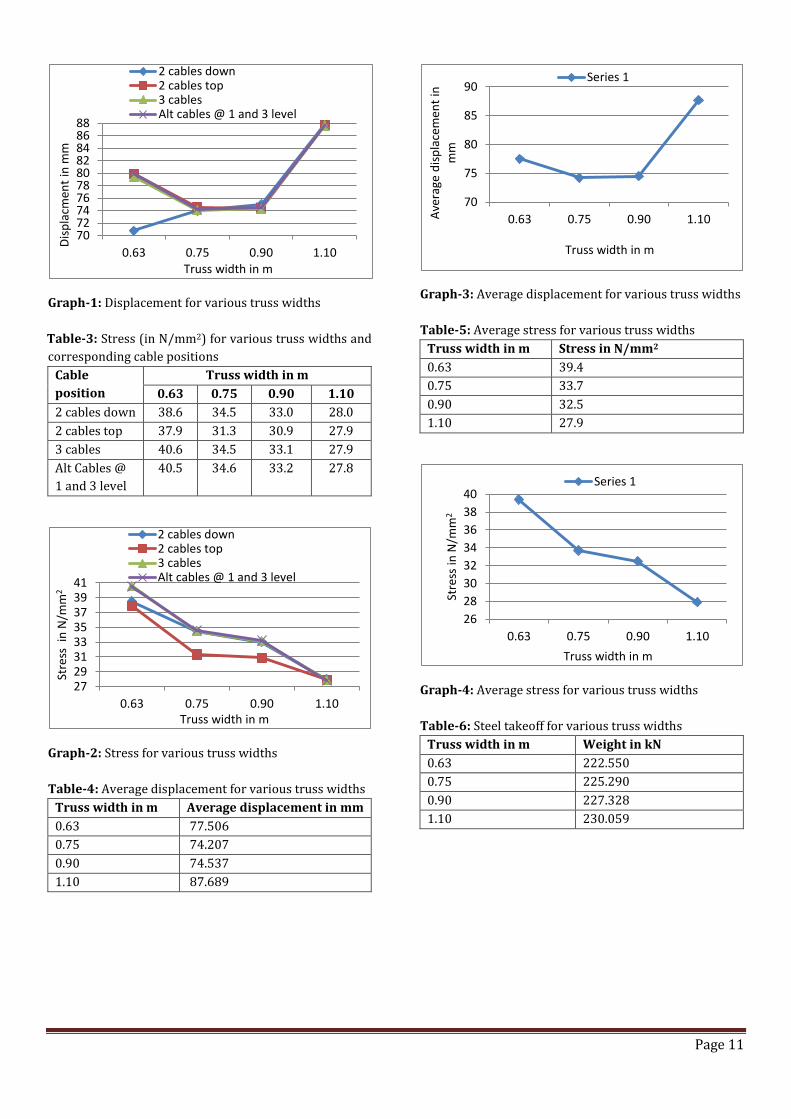
Graph-1: Displacement for various truss widths
Table-3: Stress (in N/mm2) for various truss widths and
corresponding cable positions
Cable
position
Truss width in m
0.63 0.75 0.90 1.10
2 cables down 38.6 34.5 33.0 28.0
2 cables top 37.9 31.3 30.9 27.9
3 cables 40.6 34.5 33.1 27.9
Alt Cables @
1 and 3 level
40.5 34.6 33.2 27.8
Graph-2: Stress for various truss widths
Table-4: Average displacement for various truss widths
Truss width in m Average displacement in mm
0.63 77.506
0.75 74.207
0.90 74.537
1.10 87.689
Graph-3: Average displacement for various truss widths
Table-5: Average stress for various truss widths
Truss width in m Stress in N/mm2
0.63 39.4
0.75 33.7
0.90 32.5
1.10 27.9
Graph-4: Average stress for various truss widths
Table-6: Steel takeoff for various truss widths
Truss width in m Weight in kN
0.63 222.550
0.75 225.290
0.90 227.328
1.10 230.059
70727476788082848688
0.63 0.75 0.90 1.10
Dis
pla
cmen
t in
mm
Truss width in m
2 cables down2 cables top3 cablesAlt cables @ 1 and 3 level
2729313335373941
0.63 0.75 0.90 1.10
Stre
ss i
n N
/mm
2
Truss width in m
2 cables down2 cables top3 cablesAlt cables @ 1 and 3 level
70
75
80
85
90
0.63 0.75 0.90 1.10Ave
rage
dis
pla
cem
ent
in
mm
Truss width in m
Series 1
26
28
30
32
34
36
38
40
0.63 0.75 0.90 1.10
Stre
ss in
N/m
m2
Truss width in m
Series 1
Page 12
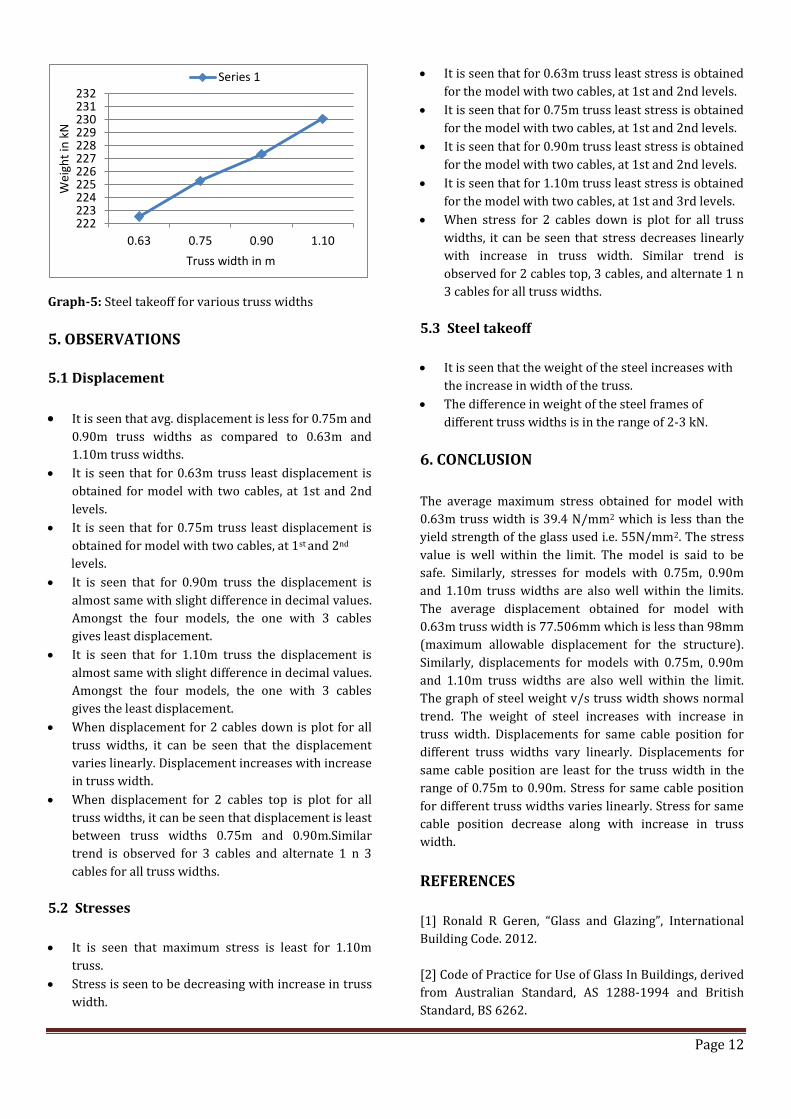
Graph-5: Steel takeoff for various truss widths
5. OBSERVATIONS
5.1 Displacement
It is seen that avg. displacement is less for 0.75m and
0.90m truss widths as compared to 0.63m and
1.10m truss widths.
It is seen that for 0.63m truss least displacement is
obtained for model with two cables, at 1st and 2nd
levels.
It is seen that for 0.75m truss least displacement is
obtained for model with two cables, at 1st and 2nd
levels.
It is seen that for 0.90m truss the displacement is
almost same with slight difference in decimal values.
Amongst the four models, the one with 3 cables
gives least displacement.
It is seen that for 1.10m truss the displacement is
almost same with slight difference in decimal values.
Amongst the four models, the one with 3 cables
gives the least displacement.
When displacement for 2 cables down is plot for all
truss widths, it can be seen that the displacement
varies linearly. Displacement increases with increase
in truss width.
When displacement for 2 cables top is plot for all
truss widths, it can be seen that displacement is least
between truss widths 0.75m and 0.90m.Similar
trend is observed for 3 cables and alternate 1 n 3
cables for all truss widths.
5.2 Stresses
It is seen that maximum stress is least for 1.10m
truss.
Stress is seen to be decreasing with increase in truss
width.
It is seen that for 0.63m truss least stress is obtained
for the model with two cables, at 1st and 2nd levels.
It is seen that for 0.75m truss least stress is obtained
for the model with two cables, at 1st and 2nd levels.
It is seen that for 0.90m truss least stress is obtained
for the model with two cables, at 1st and 2nd levels.
It is seen that for 1.10m truss least stress is obtained
for the model with two cables, at 1st and 3rd levels.
When stress for 2 cables down is plot for all truss
widths, it can be seen that stress decreases linearly
with increase in truss width. Similar trend is
observed for 2 cables top, 3 cables, and alternate 1 n
3 cables for all truss widths.
5.3 Steel takeoff
It is seen that the weight of the steel increases with
the increase in width of the truss.
The difference in weight of the steel frames of
different truss widths is in the range of 2-3 kN.
6. CONCLUSION
The average maximum stress obtained for model with
0.63m truss width is 39.4 N/mm2 which is less than the
yield strength of the glass used i.e. 55N/mm2. The stress
value is well within the limit. The model is said to be
safe. Similarly, stresses for models with 0.75m, 0.90m
and 1.10m truss widths are also well within the limits.
The average displacement obtained for model with
0.63m truss width is 77.506mm which is less than 98mm
(maximum allowable displacement for the structure).
Similarly, displacements for models with 0.75m, 0.90m
and 1.10m truss widths are also well within the limit.
The graph of steel weight v/s truss width shows normal
trend. The weight of steel increases with increase in
truss width. Displacements for same cable position for
different truss widths vary linearly. Displacements for
same cable position are least for the truss width in the
range of 0.75m to 0.90m. Stress for same cable position
for different truss widths varies linearly. Stress for same
cable position decrease along with increase in truss
width.
REFERENCES
[1] Ronald R Geren, “Glass and Glazing”, International
Building Code. 2012.
[2] Code of Practice for Use of Glass In Buildings, derived
from Australian Standard, AS 1288-1994 and British
Standard, BS 6262.
222223224225226227228229230231232
0.63 0.75 0.90 1.10
Wei
ght
in k
N
Truss width in m
Series 1

Page 13
[3] Chapter 24 Glass and Glazing, International Building
Code 2006, New Jersey Edition.
[4] Innovative Structural Glass, Inc. – Brochure 05, 06, 07
and 08.
[5] Guardian Sunguard, “Technical Guidelines”,
www.sunguardglass.com
[6] Shelton Nhamoinesu, Mauro Overend, “The
Mechanical Performance of Adhesives for a Steel-Glass
Composite Façade System”, University of Cambridge,UK.
[7] Kenneth Zammit and Mauro Overend, “Improved
Computational Methods for Wind Pressures and Glass
Thickness in Facades”, University of Cambridge, UK.
[8] Dorma Loop, Dorma UK Ltd. www.dorma-uk.co.uk
[9] S.L.Chan, “Basic Structural Design Considerations and
Properties of Glass and Aluminium Structures”, RCATISE.
[10] Allan Sage, “Double Glazing”, Glassage Design Ltd.
[11] Large Insulating Glass Units- Design Considerations,
PPG Industries Inc.
[12] Mark DuBois, “Glass Bearing Walls- A Case Study”,
Glass Performance Days 2007 www.gpd.fi
[13] James Watson and Mauro Overend, “Novel
Connections for Steel-Glass and Glass-Glass Structures”,
University of Cambridge,UK.
[14] Heather Hammatt, “Study in Steel”, Modern Steel
Construction, Dec 2003.
[15] Hatsuo Ishizaki, “On the Large Deflections of
Rectangular Glass Panes under Uniform Pressure”, Dec
1972.
[16] Code of practice for design loads for buildings and
structures derived from Indian Standard IS: 875 (Part
3)-1987
BIOGRAPHIES
Raghunath .D. Deshpande (M.tech structural Engg.)
Assistant Professor, Civil Engineering Department, Gogte
Institute of Technology Belagavi, Karnataka, India
Email: [email protected]
Gayatri Chiniwal (M.tech structural Engg.)
Trainee Civil Engineer, Telecommunication Engineering
Department, Black and Veatch Pvt. Ltd, Pune,
Maharashtra, India.
Email: [email protected]
Laxmi Golsangi (M.Tech Scholar)
M.Tech Scholar, Civil Engineering Department, Gogte
Institute of Technology Belagavi, Karnataka, India
Email: [email protected]