Embed Size (px)
Citation preview
Iloeje, A. F. Int. Journal of Engineering Research and Applications www.ijera.com
ISSN : 2248-9622, Vol. 5, Issue 6, ( Part - 5) June 2015, pp.104-118
www.ijera.com 104 | P a g e
Impacts of Flooding on Road Transport Infrastructure In Enugu
Metropolitan City, Nigeria.
Iloeje, A. F.; Aniagolu, C. O., Okoye, V. Faculty of Environmental Sciences, Enugu State University of Science and Technology, Agbani;
School of Business Administration, Institute of Management and Technology, Enugu
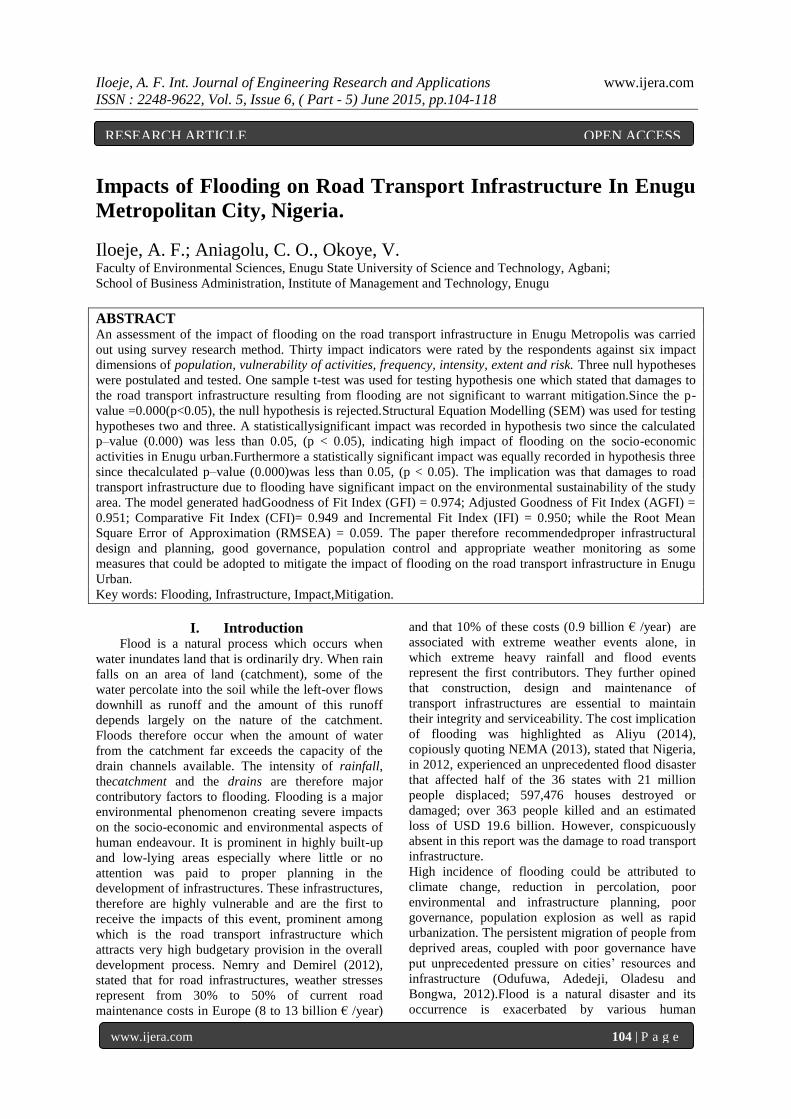
ABSTRACT An assessment of the impact of flooding on the road transport infrastructure in Enugu Metropolis was carried
out using survey research method. Thirty impact indicators were rated by the respondents against six impact
dimensions of population, vulnerability of activities, frequency, intensity, extent and risk. Three null hypotheses
were postulated and tested. One sample t-test was used for testing hypothesis one which stated that damages to
the road transport infrastructure resulting from flooding are not significant to warrant mitigation.Since the p-
value =0.000(p<0.05), the null hypothesis is rejected.Structural Equation Modelling (SEM) was used for testing
hypotheses two and three. A statisticallysignificant impact was recorded in hypothesis two since the calculated
p–value (0.000) was less than 0.05, (p < 0.05), indicating high impact of flooding on the socio-economic
activities in Enugu urban.Furthermore a statistically significant impact was equally recorded in hypothesis three
since thecalculated p–value (0.000)was less than 0.05, (p < 0.05). The implication was that damages to road
transport infrastructure due to flooding have significant impact on the environmental sustainability of the study
area. The model generated hadGoodness of Fit Index (GFI) = 0.974; Adjusted Goodness of Fit Index (AGFI) =
0.951; Comparative Fit Index (CFI)= 0.949 and Incremental Fit Index (IFI) = 0.950; while the Root Mean
Square Error of Approximation (RMSEA) = 0.059. The paper therefore recommendedproper infrastructural
design and planning, good governance, population control and appropriate weather monitoring as some
measures that could be adopted to mitigate the impact of flooding on the road transport infrastructure in Enugu
Urban.
Key words: Flooding, Infrastructure, Impact,Mitigation.
I. Introduction Flood is a natural process which occurs when
water inundates land that is ordinarily dry. When rain
falls on an area of land (catchment), some of the
water percolate into the soil while the left-over flows
downhill as runoff and the amount of this runoff
depends largely on the nature of the catchment.
Floods therefore occur when the amount of water
from the catchment far exceeds the capacity of the
drain channels available. The intensity of rainfall,
thecatchment and the drains are therefore major
contributory factors to flooding. Flooding is a major
environmental phenomenon creating severe impacts
on the socio-economic and environmental aspects of
human endeavour. It is prominent in highly built-up
and low-lying areas especially where little or no
attention was paid to proper planning in the
development of infrastructures. These infrastructures,
therefore are highly vulnerable and are the first to
receive the impacts of this event, prominent among
which is the road transport infrastructure which
attracts very high budgetary provision in the overall
development process. Nemry and Demirel (2012),
stated that for road infrastructures, weather stresses
represent from 30% to 50% of current road
maintenance costs in Europe (8 to 13 billion € /year)
and that 10% of these costs (0.9 billion € /year) are
associated with extreme weather events alone, in
which extreme heavy rainfall and flood events
represent the first contributors. They further opined
that construction, design and maintenance of
transport infrastructures are essential to maintain
their integrity and serviceability. The cost implication
of flooding was highlighted as Aliyu (2014),
copiously quoting NEMA (2013), stated that Nigeria,
in 2012, experienced an unprecedented flood disaster
that affected half of the 36 states with 21 million
people displaced; 597,476 houses destroyed or
damaged; over 363 people killed and an estimated
loss of USD 19.6 billion. However, conspicuously
absent in this report was the damage to road transport
infrastructure.
High incidence of flooding could be attributed to
climate change, reduction in percolation, poor
environmental and infrastructure planning, poor
governance, population explosion as well as rapid
urbanization. The persistent migration of people from
deprived areas, coupled with poor governance have
put unprecedented pressure on cities’ resources and
infrastructure (Odufuwa, Adedeji, Oladesu and
Bongwa, 2012).Flood is a natural disaster and its
occurrence is exacerbated by various human
RESEARCH ARTICLE OPEN ACCESS
Iloeje, A. F. Int. Journal of Engineering Research and Applications www.ijera.com
ISSN : 2248-9622, Vol. 5, Issue 6, ( Part - 5) June 2015, pp.104-118
www.ijera.com 105 | P a g e
activities’ interface with the environment.The
impacts and effects of flooding have alsobeen noted
to range from submerging of roads, obstruction of
traffic, coastal erosion, disruption of economic
activities, displacement of people, loss of property, to
loss of lives,Akukwe and Ogbodo(2015)
quotingEtuonovbe (2011). These impacts can be
viewed from both short term, medium and long term
perspectives. The immediate impacts include:
destruction of roads, bridges and culverts and
disruption of road transport systems, traffic jams,
long travel time, loss in man-hour, stress, fatigue as
well as other stress related issues. In the medium and
long term, impacts include: cost of rehabilitation of
damaged infrastructures, cost of reconstruction of
existing ones to cope with futureoccurrences,
restoration of lost assets.
In Enugu urban, significant improvement on the road
transport infrastructure has been made over the past
eight years but these roads are fast deteriorating in
spite of evident quality of the design and
construction. The severe damage inflicted on these
roads, bridges, culverts and public rights of way is
becoming alarming and a source of serious concern
especially when one considers the enormous
resources ploughed into the design and construction
process. The ultimate factor of damage is not the
quantity of water but how high water is above normal
restraints or embankments as stated inAdedeji and
Salami (2008). Some of the major roads within the
metropolis have started showing signs of severe
structural failure. They are inundated when it rains
while the drainage systems have been overwhelmed,
apparently converting these roads to drainage line
probably as a result of blockage and silting of the
designed drains.
It has become a nightmare for city dwellers in Enugu
urban each time there was a downpour. Commuting
takes considerably longer time thus compounding the
already bad traffic situation. The very few
diversionary routes which lack the capacity to take
the diverted traffic are helplessly overwhelmed and
do not seem to offer any significant response to the
chaotic traffic congestion. Kofo (2012) stated that
flood destroys farmlands, property, industrial
installations, roads, railways, residence and it carries
people away. The consequences of flooding are more
severe at the rural areas where costs are more
significant and funds less available. Productivity,
security, welfare, economic viability, social stability
and environmental sustainability are facilitated by
efficient road network and so whereroad alignment is
wrong and road inefficient, flooding is precipitated
causing infrastructural breakdown, thus hindering the
availability of urban facilities.
Authors such as Odufuwaet al, 2012; Watson, 1993;
Neal and Curtis, 2008; Tibaijuka, 2008;have argued
that cities are the focal points that enhance economic
and social activities of people in the society at
large.Kazmierczak and Kenny (2011), further posited
that various types of infrastructure, including water
and energy supply, communications, transport, but
also emergency services (e.g. hospitals) and social
infrastructure (e.g. schools) allow the modern society
to function and the importance of infrastructure in
our lives is emphasised when it is damaged, or when
its function is hindered,
Furthermore, experts have copiously written on
flooding but there is dearth of literature on its impact
on city transportationresulting in the uncertainty
about the potential impacts. For instance, Tunstall et
al, (2006); Tapsell et al (2002); Adger et al (2005);
Brouwer and Remco (2004), all wrote on the social
impact of flooding, while Green et al (1991); Few
(2003); Akukwe and Ogbodo (2015) concentrated on
risk and vulnerability to flooding.
There are emerging signs of dilapidation on the urban
roads in Enugu city that could be linked to
flooding.In this paper, therefore an assessment of the
impact of flooding on the road transport
infrastructure is most imperative so as to alert the
policy makers to devise a lasting strategy to cub the
menace on the city roads.
Three null hypotheses were postulated and they
include:
Ho: Damages to the road transport infrastructure
resulting from flooding are not significant to warrant
mitigation;
Ho: Damages to road transport infrastructure due to
flooding has no significant impacts on the socio-
economic activities of Enugu urban.
Ho:Damages to road transport infrastructure due to
flooding has no significant impact on the
environmental sustainability of Enugu urban road
transport infrastructure. This study is anchored on
these three hypotheses.
II. Materials and Methods 2.1 Study Area
Enugu is the capital of Enugu State, a mainland state
in South-easternNigeria. The state shares borders
with Ebonyi State to the east, Kogi and Benue States
to the northwest and northeast respectively, Anambra
State to the west, Abia and Imo States to the south.
The major cities in close proximity to Enugu are Port
Harcourt in Rivers State, Aba in Abia State, Onitsha
in Anambra State and Abakiliki in Ebonyi State, all
within one to three hours’ drive, the furthest being
Port Harcourt.
Enugu is blessed with good soil, interesting
landscape and excellent climatic conditions.
Enugu is located in a tropical rain forest zone with a
derived savannah (Sani, 2007; Reinfsnyder, 1989)). It
has a humid climate typical of the tropical savanna,
with its highest between March and
Iloeje, A. F. Int. Journal of Engineering Research and Applications www.ijera.com
ISSN : 2248-9622, Vol. 5, Issue 6, ( Part - 5) June 2015, pp.104-118
www.ijera.com 106 | P a g e
November(Reinfsnyder, 1989). For the whole of
Enugu State the mean daily temperature is 26.7 °C
(80.1 °F (Sani, 2007).The average annual rainfall in
Enugu is around 2,000 millimetres (79 in), which
arrives intermittently and becomes very heavy during
the rainy seasonEgboka, (1985).
Enugu acquired a township status in 1917 and was of
strategic importance to the British colonial masters
because of its beautiful landscape, serene
environment, perfect scenic beauty, and high
potentials for commerce as a result of the abundant
natural resources of coal, natural gas, limestone,
bauxite and very rich agricultural potentials. It thus
became the capital of the Southern province and later
the regional capital of the then Eastern Region of
Nigeria. The current state government has taken bold
steps to harness these potentials through its various
development programmes thus turning the city into a
very attractive rendezvous for people from all works
of life, encouraging, as it were, commerce, education,
agricultural activities, tourism, and so on. With its
beautiful rolling green hills and well planned
environment, Enugu became a centre of attraction in
terms of improved standard of living. This places, on
environmental stakeholders, the compulsive
responsibility of ensuring the sustained development
of this great city.
2.2 Methodology
This is an empirical study based on qualitative
primary data. Survey research method was, therefore,
adopted using well-structured and extensively
detailed questionnaire administered on respondents
selected from the residents of Enugu metropolis, to
elicit information on the subject matter. The
questionnaire sort information on relevant personal
characteristics of the respondents and on the
magnitude of damage and degree of impact of
flooding on the road transport infrastructure. This
was captured by listing some key impact indicators
and relevant impact dimensions (Appendix). The
Likert-type scale was used to rate the respondents’
perception with which impact evaluation was carried
out. Thirty (30) impact indicators were carefully
selected and rated against six (6) impact dimensions
which include: Vulnerability of activities, Population,
Frequency, Intensity, Extent and Risk. The
questionnaires were administered on six hundred and
twenty five (625) respondents representing the
sample size drawn from a projected population of
nine hundred and one thousand, one hundred and
sixty two (901,162) residents of Enugu urban,
(National Bureau of Statistics, 2006).Three
hypotheses were formulated. One sample t-test was
used to test hypothesis one while hypotheses two and
three were tested using Structural Equation
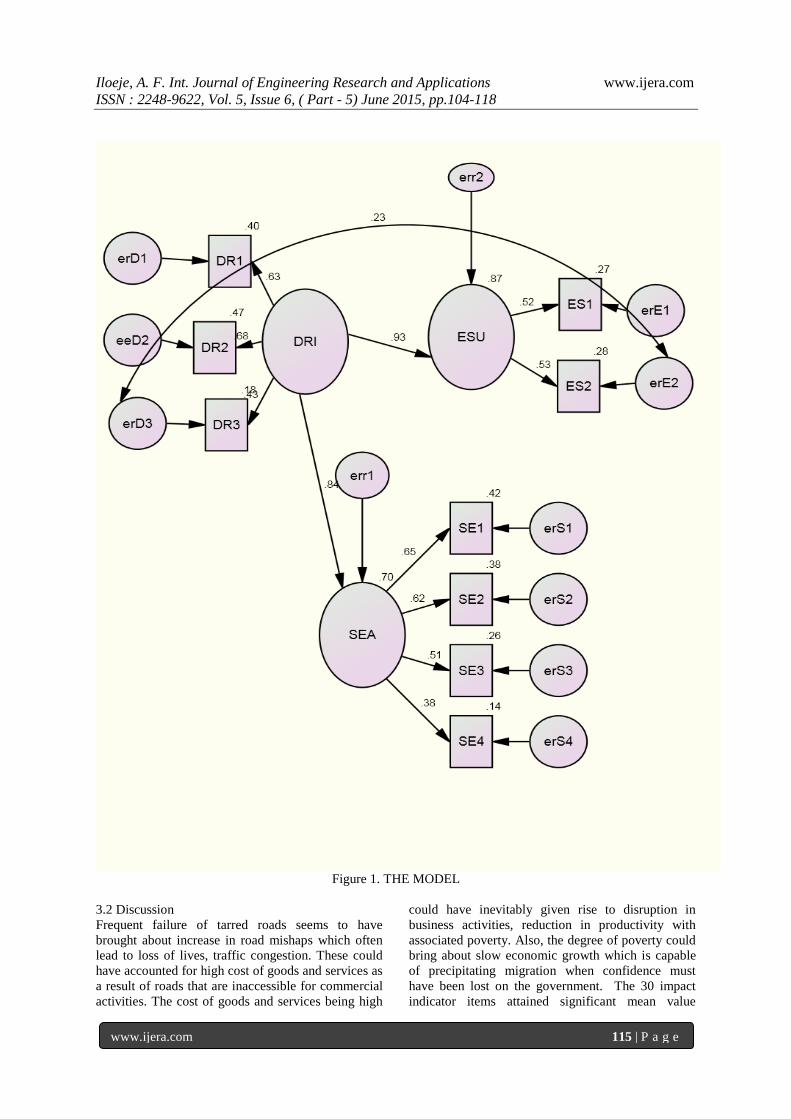
Modelling (SEM).The oval shaped constructs
(variables) in the (SEM) shown in figure 1 are the
latent constructs, the rectangular shaped ones are the
observed. The construct DRI stands for Damages to
the road transport infrastructure. The indicator
variables for DRI are DR1, DR2and DR3, which
were got from the questionnaire items. The
construct, ESU represents Environmental
Sustainability. Attached to it are the indicator
variables ES1 and ES2 while the construct SEA
means Socio Economic Activities with SE1, SE2,
SE3, SE4, respectively, as the observed variables.
Also each indicator variable has error term on it. The
30 questionnaire items were compressed into the
observed variables in the model according to their
relevance to the indicator variables. This was
achieved by combining similar variables into a
composite measure for the indicator variables. Hair et
al (2010) opined that summated scale provides two
benefits; first it provides a means of overcoming to
some extent, the measurement error inherent in all
measured variables; secondly, summated scale has
the ability to represent the multiple aspects of a
concept in a single measure. All the thirty items in
the questionnaire, measuring Assessment of Socio-
Economic and Environmental Impacts of Flooding on
Road Transport Infrastructure in Enugu Metropolis
were measured using metric scales. Also, for the
purpose of performing the inferential statistics, the
summated scale for the six impact dimensions for
each impact indicator item were computed and the
average scores determined .On the basis of five point
scale, the rating of each of the items for the impact
indicator/ dimensions were as follows;: Very high
(5); High (4); Moderate (3); Low (2); Very low (1)
III. Results and Discussion 3.1Results
Out of six hundred and twenty five respondents, 330
(52.8%) were of the male gender while 295(47.2%)
were female. The data revealed fairness in the gender
distribution. Furthermore, the age distribution
revealed that 395 (63.2%) of the respondents were
not more than 50 years of age while 230 (36.8%) of
the respondents were above age 50.This appears to be
a moderate distribution of age. The level of education
of the valid respondents showed that 425 (68%) of
the respondents had acquired tertiary education while
200(32%) had attained other levels of education;
thus, the degree of education of the respondents
seems to have consolidated the dependability of the
data got from them bythe researchers.
3.1.1 Rating of Impact Indicators/Dimensions by the
Respondents
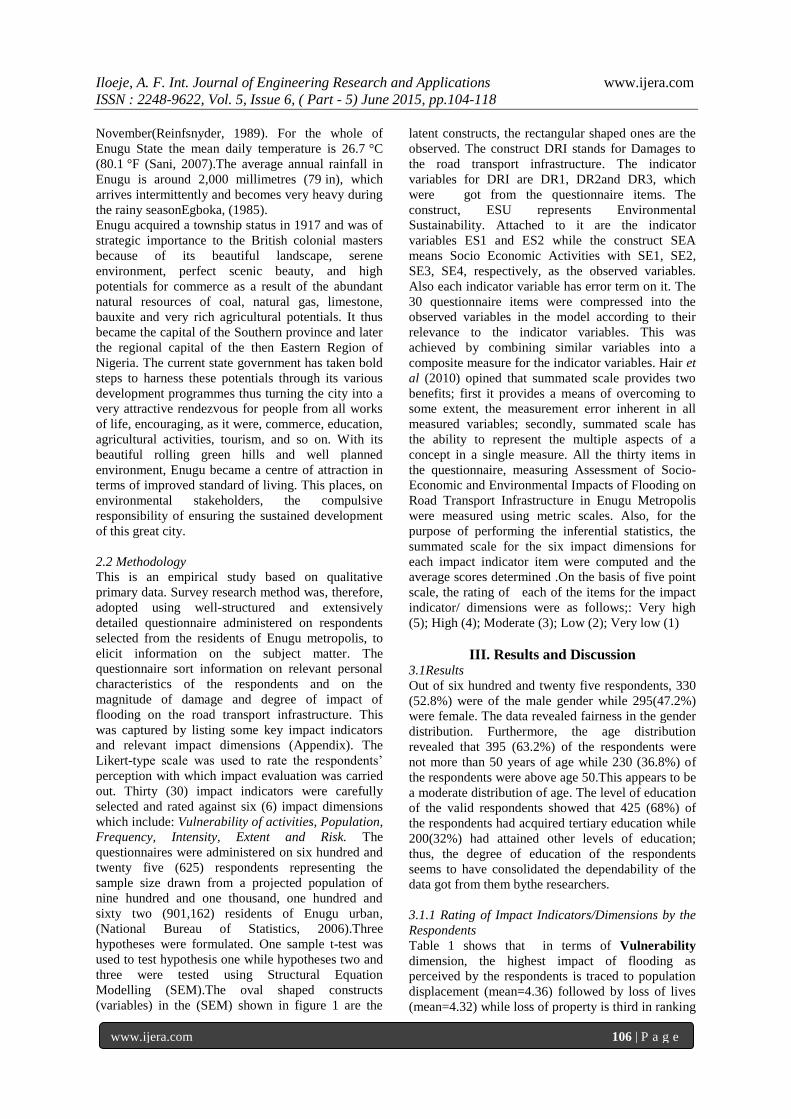
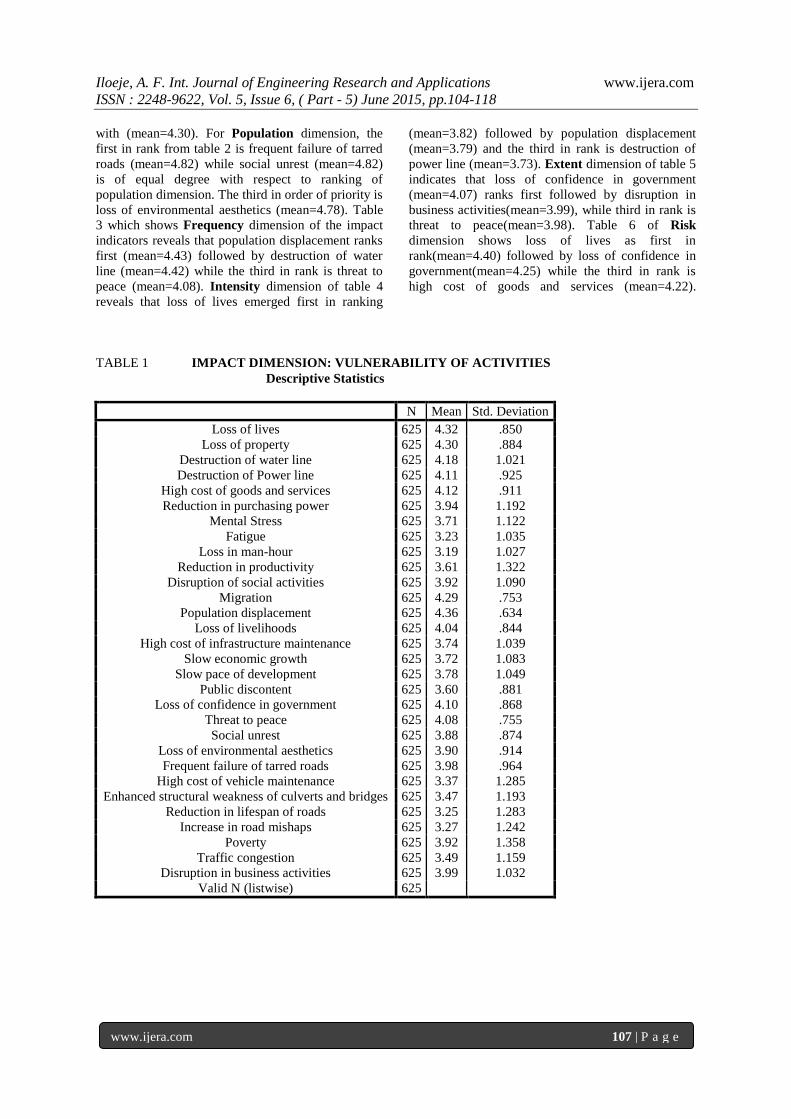
Table 1 shows that in terms of Vulnerability
dimension, the highest impact of flooding as
perceived by the respondents is traced to population
displacement (mean=4.36) followed by loss of lives
(mean=4.32) while loss of property is third in ranking
Iloeje, A. F. Int. Journal of Engineering Research and Applications www.ijera.com
ISSN : 2248-9622, Vol. 5, Issue 6, ( Part - 5) June 2015, pp.104-118
www.ijera.com 107 | P a g e
with (mean=4.30). For Population dimension, the
first in rank from table 2 is frequent failure of tarred
roads (mean=4.82) while social unrest (mean=4.82)
is of equal degree with respect to ranking of
population dimension. The third in order of priority is
loss of environmental aesthetics (mean=4.78). Table
3 which shows Frequency dimension of the impact
indicators reveals that population displacement ranks
first (mean=4.43) followed by destruction of water
line (mean=4.42) while the third in rank is threat to
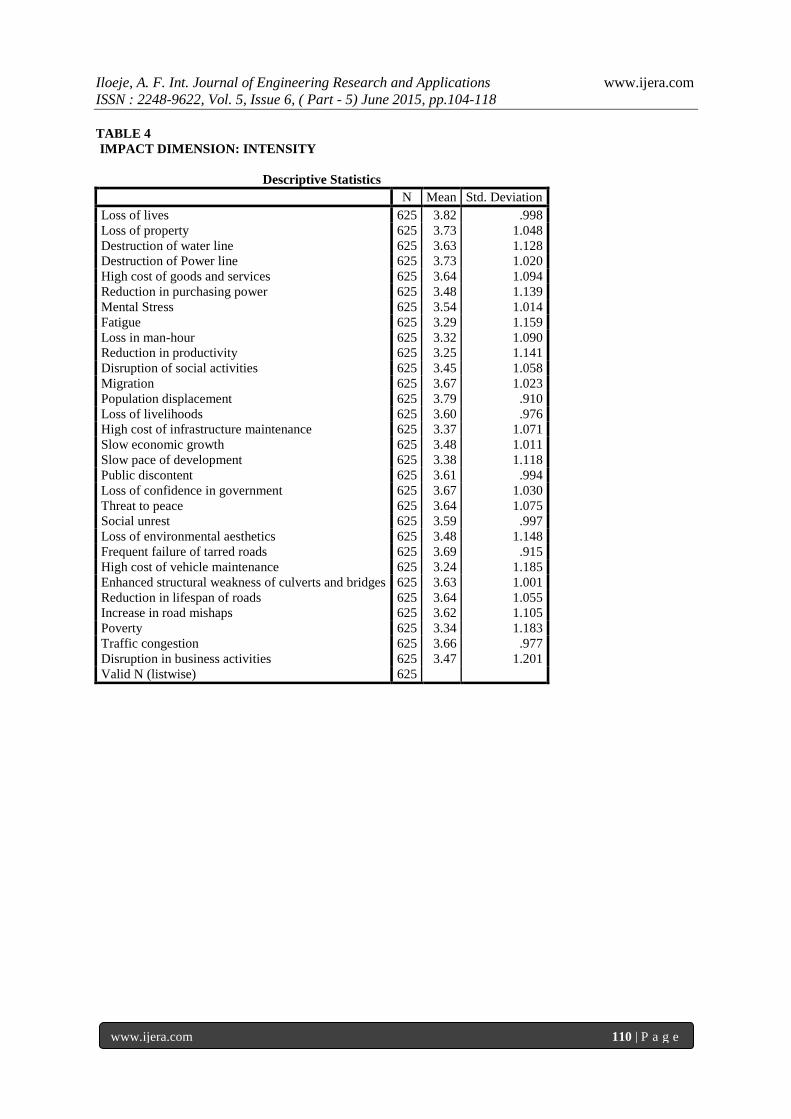
peace (mean=4.08). Intensity dimension of table 4
reveals that loss of lives emerged first in ranking
(mean=3.82) followed by population displacement
(mean=3.79) and the third in rank is destruction of
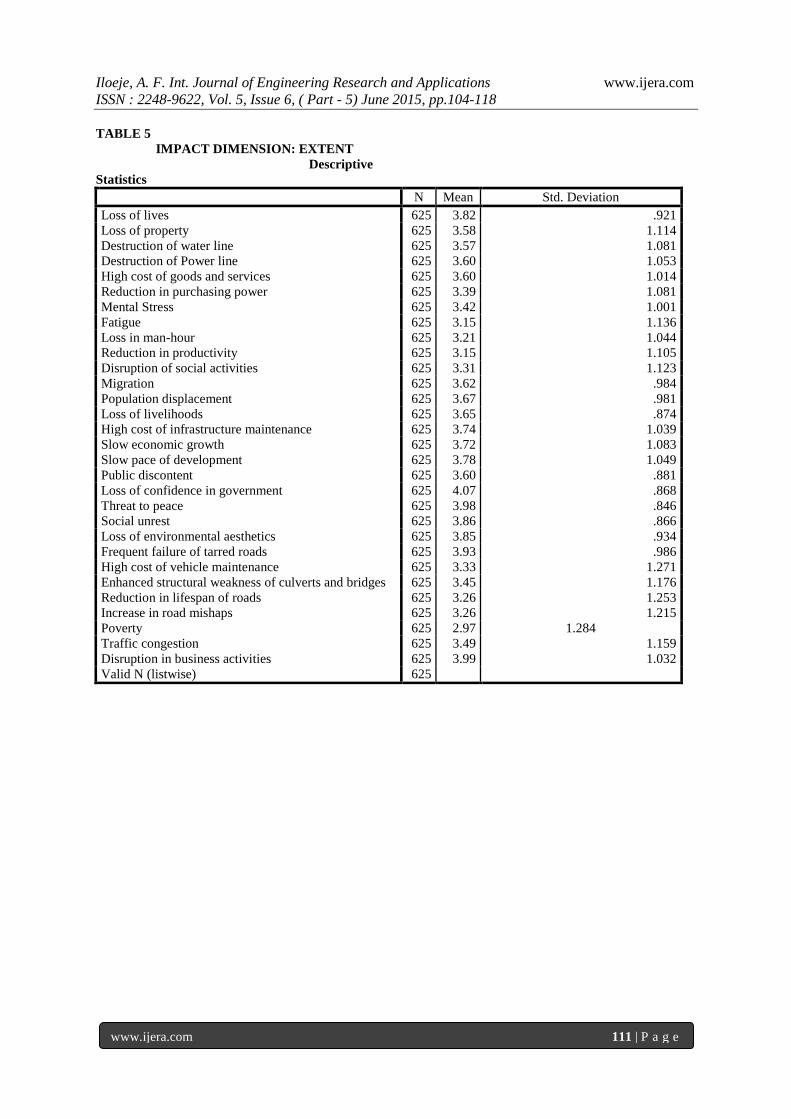
power line (mean=3.73). Extent dimension of table 5
indicates that loss of confidence in government
(mean=4.07) ranks first followed by disruption in
business activities(mean=3.99), while third in rank is
threat to peace(mean=3.98). Table 6 of Risk
dimension shows loss of lives as first in
rank(mean=4.40) followed by loss of confidence in
government(mean=4.25) while the third in rank is
high cost of goods and services (mean=4.22).
TABLE 1 IMPACT DIMENSION: VULNERABILITY OF ACTIVITIES
Descriptive Statistics
N Mean Std. Deviation
Loss of lives 625 4.32 .850
Loss of property 625 4.30 .884
Destruction of water line 625 4.18 1.021
Destruction of Power line 625 4.11 .925
High cost of goods and services 625 4.12 .911
Reduction in purchasing power 625 3.94 1.192
Mental Stress 625 3.71 1.122
Fatigue 625 3.23 1.035
Loss in man-hour 625 3.19 1.027
Reduction in productivity 625 3.61 1.322
Disruption of social activities 625 3.92 1.090
Migration 625 4.29 .753
Population displacement 625 4.36 .634
Loss of livelihoods 625 4.04 .844
High cost of infrastructure maintenance 625 3.74 1.039
Slow economic growth 625 3.72 1.083
Slow pace of development 625 3.78 1.049
Public discontent 625 3.60 .881
Loss of confidence in government 625 4.10 .868
Threat to peace 625 4.08 .755
Social unrest 625 3.88 .874
Loss of environmental aesthetics 625 3.90 .914
Frequent failure of tarred roads 625 3.98 .964
High cost of vehicle maintenance 625 3.37 1.285
Enhanced structural weakness of culverts and bridges 625 3.47 1.193
Reduction in lifespan of roads 625 3.25 1.283
Increase in road mishaps 625 3.27 1.242
Poverty 625 3.92 1.358
Traffic congestion 625 3.49 1.159
Disruption in business activities 625 3.99 1.032
Valid N (listwise) 625

Iloeje, A. F. Int. Journal of Engineering Research and Applications www.ijera.com
ISSN : 2248-9622, Vol. 5, Issue 6, ( Part - 5) June 2015, pp.104-118
www.ijera.com 108 | P a g e
TABLE 2
IMPACT DIMENSION: POPULATION
Descriptive Statistics
N Mean Std. Deviation
Loss of lives 625 4.46 .952
Loss of property 625 4.46 .987
Destruction of water line 625 4.41 1.029
Destruction of Power line 625 4.42 1.026
High cost of goods and services 625 4.41 .978
Reduction in purchasing power 625 4.37 1.020
Mental Stress 625 4.33 1.061
Fatigue 625 4.31 1.081
Loss in man-hour 625 4.00 1.007
Reduction in productivity 625 3.98 1.031
Disruption of social activities 625 4.35 1.036
Migration 625 4.42 .898
Population displacement 625 4.47 .875
Loss of livelihoods 625 4.30 .920
High cost of infrastructure maintenance 625 4.12 .947
Slow economic growth 625 4.70 .701
Slow pace of development 625 4.68 .692
Public discontent 625 4.75 .704
Loss of confidence in government 625 4.56 .588
Threat to peace 625 4.54 .545
Social unrest 625 4.82 .558
Loss of environmental aesthetics 625 4.78 .687
Frequent failure of tarred roads 625 4.82 .577
High cost of vehicle maintenance 625 4.43 .857
Enhanced structural weakness of culverts and bridges 625 4.49 .665
Reduction in lifespan of roads 625 3.58 1.352
Increase in road mishaps 625 4.74 .674
Poverty 625 4.63 .934
Traffic congestion 625 4.37 .947
Disruption in business activities 625 4.36 .995
Valid N (listwise) 625

Iloeje, A. F. Int. Journal of Engineering Research and Applications www.ijera.com
ISSN : 2248-9622, Vol. 5, Issue 6, ( Part - 5) June 2015, pp.104-118
www.ijera.com 109 | P a g e
TABLE 3
IMPACT DIMENSION: FREQUENCY
Descriptive Statistics
N Mean Std. Deviation
Loss of lives 625 3.66 1.132
Loss of property 625 3.86 1.138
Destruction of water line 625 4.42 .743
Destruction of Power line 625 3.99 1.218
High cost of goods and services 625 3.96 1.203
Reduction in purchasing power 625 3.65 1.271
Mental Stress 625 3.42 1.184
Fatigue 625 3.25 1.164
Loss in man-hour 625 3.35 1.281
Reduction in productivity 625 3.88 1.218
Disruption of social activities 625 4.03 1.033
Migration 625 4.07 .973
Population displacement 622 4.43 .594
Loss of livelihoods 625 3.88 1.150
High cost of infrastructure maintenance 625 3.78 1.209
Slow economic growth 625 3.77 1.168
Slow pace of development 625 3.76 1.112
Public discontent 625 3.61 .897
Loss of confidence in government 625 3.86 1.045
Threat to peace 625 4.08 .755
Social unrest 625 3.88 .874
Loss of environmental aesthetics 625 3.90 .914
Frequent failure of tarred roads 625 3.98 .964
High cost of vehicle maintenance 625 3.37 1.285
Enhanced structural weakness of culverts and bridges 625 3.48 1.173
Reduction in lifespan of roads 625 3.27 1.244
Increase in road mishaps 625 3.42 1.212
Poverty 625 3.13 1.384
Traffic congestion 625 3.18 1.345
Disruption in business activities 625 3.55 1.367
Valid N (listwise) 622
Iloeje, A. F. Int. Journal of Engineering Research and Applications www.ijera.com
ISSN : 2248-9622, Vol. 5, Issue 6, ( Part - 5) June 2015, pp.104-118
www.ijera.com 110 | P a g e
TABLE 4
IMPACT DIMENSION: INTENSITY
Descriptive Statistics
N Mean Std. Deviation
Loss of lives 625 3.82 .998
Loss of property 625 3.73 1.048
Destruction of water line 625 3.63 1.128
Destruction of Power line 625 3.73 1.020
High cost of goods and services 625 3.64 1.094
Reduction in purchasing power 625 3.48 1.139
Mental Stress 625 3.54 1.014
Fatigue 625 3.29 1.159
Loss in man-hour 625 3.32 1.090
Reduction in productivity 625 3.25 1.141
Disruption of social activities 625 3.45 1.058
Migration 625 3.67 1.023
Population displacement 625 3.79 .910
Loss of livelihoods 625 3.60 .976
High cost of infrastructure maintenance 625 3.37 1.071
Slow economic growth 625 3.48 1.011
Slow pace of development 625 3.38 1.118
Public discontent 625 3.61 .994
Loss of confidence in government 625 3.67 1.030
Threat to peace 625 3.64 1.075
Social unrest 625 3.59 .997
Loss of environmental aesthetics 625 3.48 1.148
Frequent failure of tarred roads 625 3.69 .915
High cost of vehicle maintenance 625 3.24 1.185
Enhanced structural weakness of culverts and bridges 625 3.63 1.001
Reduction in lifespan of roads 625 3.64 1.055
Increase in road mishaps 625 3.62 1.105
Poverty 625 3.34 1.183
Traffic congestion 625 3.66 .977
Disruption in business activities 625 3.47 1.201
Valid N (listwise) 625
Iloeje, A. F. Int. Journal of Engineering Research and Applications www.ijera.com
ISSN : 2248-9622, Vol. 5, Issue 6, ( Part - 5) June 2015, pp.104-118
www.ijera.com 111 | P a g e
TABLE 5
IMPACT DIMENSION: EXTENT
Descriptive
Statistics
N Mean Std. Deviation
Loss of lives 625 3.82 .921
Loss of property 625 3.58 1.114
Destruction of water line 625 3.57 1.081
Destruction of Power line 625 3.60 1.053
High cost of goods and services 625 3.60 1.014
Reduction in purchasing power 625 3.39 1.081
Mental Stress 625 3.42 1.001
Fatigue 625 3.15 1.136
Loss in man-hour 625 3.21 1.044
Reduction in productivity 625 3.15 1.105
Disruption of social activities 625 3.31 1.123
Migration 625 3.62 .984
Population displacement 625 3.67 .981
Loss of livelihoods 625 3.65 .874
High cost of infrastructure maintenance 625 3.74 1.039
Slow economic growth 625 3.72 1.083
Slow pace of development 625 3.78 1.049
Public discontent 625 3.60 .881
Loss of confidence in government 625 4.07 .868
Threat to peace 625 3.98 .846
Social unrest 625 3.86 .866
Loss of environmental aesthetics 625 3.85 .934
Frequent failure of tarred roads 625 3.93 .986
High cost of vehicle maintenance 625 3.33 1.271
Enhanced structural weakness of culverts and bridges 625 3.45 1.176
Reduction in lifespan of roads 625 3.26 1.253
Increase in road mishaps 625 3.26 1.215
Poverty 625 2.97 1.284
Traffic congestion 625 3.49 1.159
Disruption in business activities 625 3.99 1.032
Valid N (listwise) 625

Iloeje, A. F. Int. Journal of Engineering Research and Applications www.ijera.com
ISSN : 2248-9622, Vol. 5, Issue 6, ( Part - 5) June 2015, pp.104-118
www.ijera.com 112 | P a g e
TABLE 6
IMPACT DIMENSION: RISK
Descriptive Statistics
N Mean Std. Deviation
Loss of lives 625 4.40 .630
Loss of property 625 4.10 .923
Destruction of water line 625 4.04 1.010
Destruction of Power line 625 4.13 .893
High cost of goods and services 625 4.22 .795
Reduction in purchasing power 623 3.85 1.075
Mental Stress 625 3.67 1.166
Fatigue 625 3.47 1.218
Loss in man-hour 625 3.46 1.235
Reduction in productivity 625 3.40 1.318
Disruption of social activities 625 3.65 1.149
Migration 625 4.13 .932
Population displacement 625 4.19 .856
Loss of livelihoods 625 3.93 .978
High cost of infrastructure maintenance 625 3.67 1.114
Slow economic growth 625 3.86 1.094
Slow pace of development 625 3.92 1.052
Public discontent 625 4.04 .953
Loss of confidence in government 625 4.25 .720
Threat to peace 625 4.12 .837
Social unrest 625 4.09 .875
Loss of environmental aesthetics 625 3.90 .914
Frequent failure of tarred roads 625 3.98 .964
High cost of vehicle maintenance 625 3.37 1.285
Enhanced structural weakness of culverts and bridges 625 3.47 1.193
Reduction in lifespan of roads 625 3.25 1.283
Increase in road mishaps 625 3.27 1.242
Poverty 625 3.47 1.297
Traffic congestion 625 3.71 1.132
Disruption in business activities 625 3.99 1.060
Valid N (listwise) 623
3.1.2 Test of Hypothesis
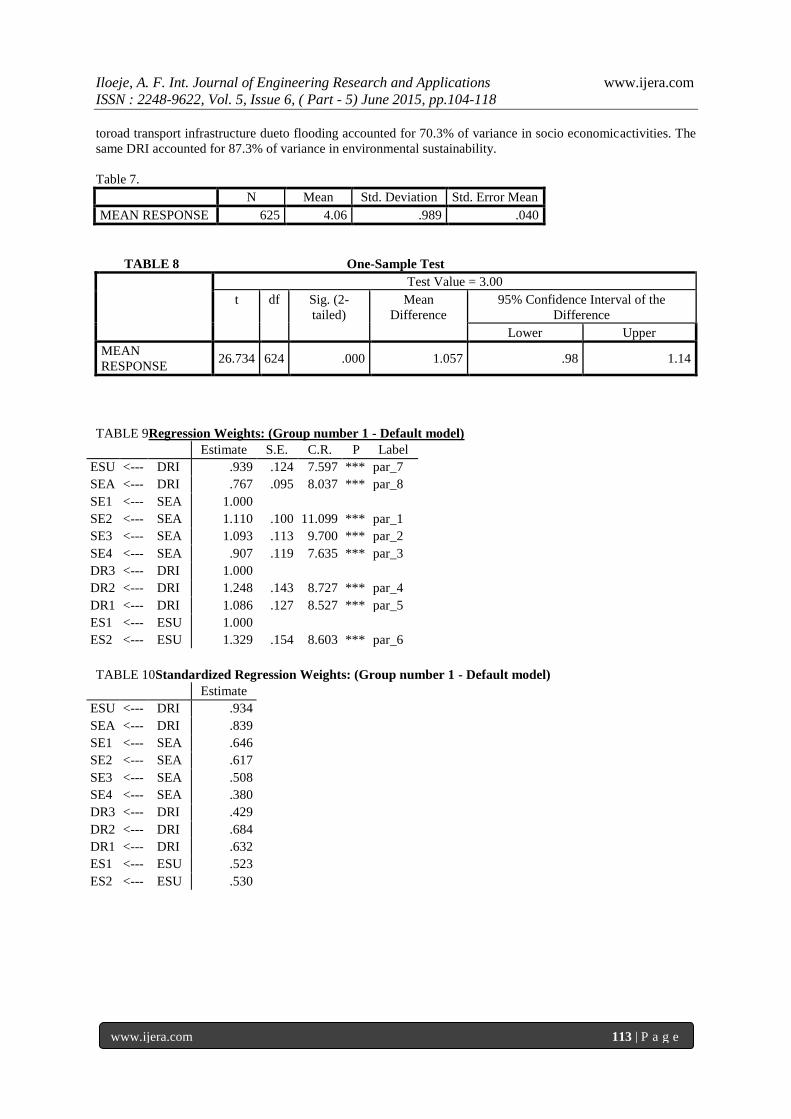
One sample t test was used for testing hypothesis one. From table7 the sample mean is 4.06; standard deviation
is 0.989, n=625while table8 shows that the calculated t-value is 26.734 with624degree of freedom; p-value=
0.000. Since the p-value =0.000(p<0.05), the null hypothesis is rejected. The conclusion therefore is that
damages to the road transport infrastructure resulting from flooding are significant to warrant mitigation.
Structural Equation Modelling (SEM) was used for testing hypotheses two and three in this study.SEM consists
of statistical models that aim at explaining relationships among multiple variables. It examines the structure of
interrelationships expressed in a series of equations similar to a series of multiple regression equations (Hair et
al, 2010). AMOS software version 18 was used for the purpose of structural equation modelling.
Hypothesis two proposed that damages to road transport infrastructure due to flooding has no
significantimpact on the socio-economic activities in Enugu urban. Table 9 shows a statistically
significant impact since the calculated p–value (0.000) is less than 0.05, (p < 0,05). Thus, the
standardized regression weights from table10, indicate that one standard deviation increase in
damages to road transport infrastructure due to flooding increases impact on socio economic activities
by 0.839 standard deviation.
Also, Hypothesis three proposed that damages to road transportinfrastructure due to flooding has no significant
impact on the environmental sustainability of Enugu urban road transport infrastructure. Table 9 equally shows
a statistically significant impact since thecalculated p–value (0.000)isless than 0.05, (p < 0.05).Thus, one
standard deviation increase indamages to road transport infrastructure due to flooding increases impact on
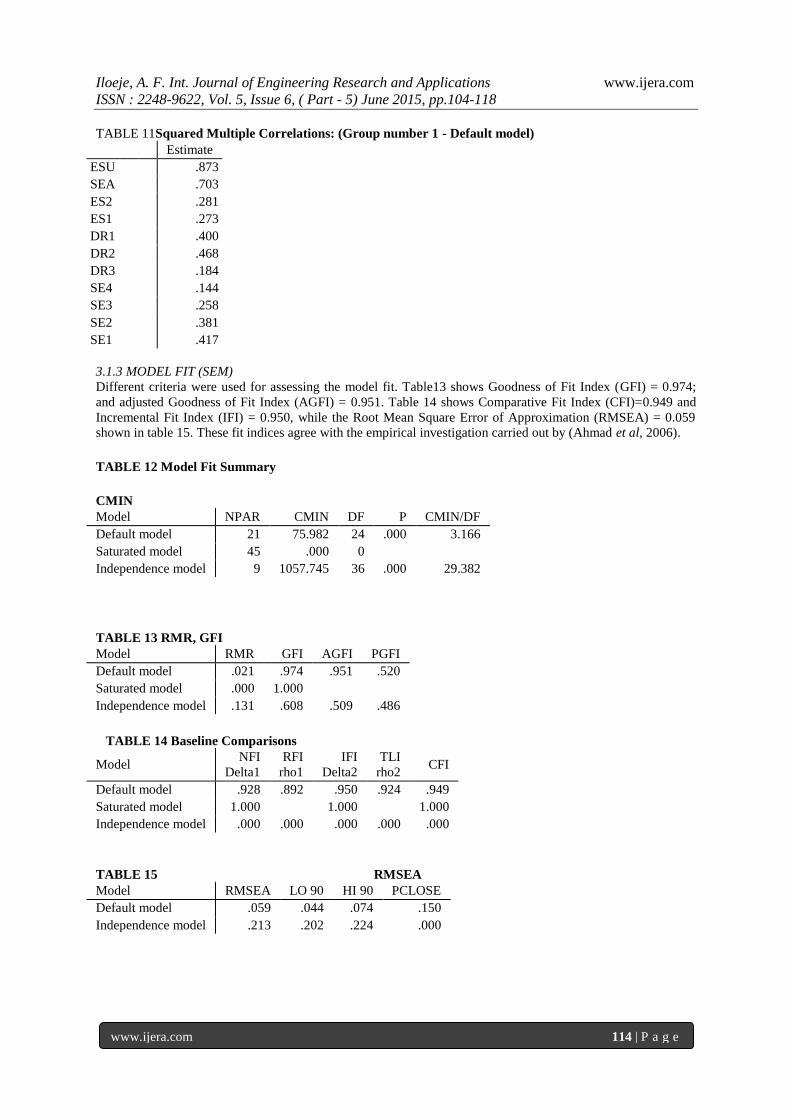
Environmental sustainability of Enugu urban by 0.934 standard deviation. Table 11 further reveals that damages
Iloeje, A. F. Int. Journal of Engineering Research and Applications www.ijera.com
ISSN : 2248-9622, Vol. 5, Issue 6, ( Part - 5) June 2015, pp.104-118
www.ijera.com 113 | P a g e
toroad transport infrastructure dueto flooding accounted for 70.3% of variance in socio economicactivities. The
same DRI accounted for 87.3% of variance in environmental sustainability.
Table 7.
N Mean Std. Deviation Std. Error Mean
MEAN RESPONSE 625 4.06 .989 .040
TABLE 8 One-Sample Test
Test Value = 3.00
t df Sig. (2-
tailed)
Mean
Difference
95% Confidence Interval of the
Difference
Lower Upper
MEAN
RESPONSE 26.734 624 .000 1.057 .98 1.14
TABLE 9Regression Weights: (Group number 1 - Default model)
Estimate S.E. C.R. P Label
ESU <--- DRI .939 .124 7.597 *** par_7
SEA <--- DRI .767 .095 8.037 *** par_8
SE1 <--- SEA 1.000
SE2 <--- SEA 1.110 .100 11.099 *** par_1
SE3 <--- SEA 1.093 .113 9.700 *** par_2
SE4 <--- SEA .907 .119 7.635 *** par_3
DR3 <--- DRI 1.000
DR2 <--- DRI 1.248 .143 8.727 *** par_4
DR1 <--- DRI 1.086 .127 8.527 *** par_5
ES1 <--- ESU 1.000
ES2 <--- ESU 1.329 .154 8.603 *** par_6
TABLE 10Standardized Regression Weights: (Group number 1 - Default model)
Estimate
ESU <--- DRI .934
SEA <--- DRI .839
SE1 <--- SEA .646
SE2 <--- SEA .617
SE3 <--- SEA .508
SE4 <--- SEA .380
DR3 <--- DRI .429
DR2 <--- DRI .684
DR1 <--- DRI .632
ES1 <--- ESU .523
ES2 <--- ESU .530
Iloeje, A. F. Int. Journal of Engineering Research and Applications www.ijera.com
ISSN : 2248-9622, Vol. 5, Issue 6, ( Part - 5) June 2015, pp.104-118
www.ijera.com 114 | P a g e
TABLE 11Squared Multiple Correlations: (Group number 1 - Default model)
Estimate
ESU
.873
SEA
.703
ES2
.281
ES1
.273
DR1
.400
DR2
.468
DR3
.184
SE4
.144
SE3
.258
SE2
.381
SE1
.417
3.1.3 MODEL FIT (SEM)
Different criteria were used for assessing the model fit. Table13 shows Goodness of Fit Index (GFI) = 0.974;
and adjusted Goodness of Fit Index (AGFI) = 0.951. Table 14 shows Comparative Fit Index (CFI)=0.949 and
Incremental Fit Index (IFI) = 0.950, while the Root Mean Square Error of Approximation (RMSEA) = 0.059
shown in table 15. These fit indices agree with the empirical investigation carried out by (Ahmad et al, 2006).
TABLE 12 Model Fit Summary
CMIN
Model NPAR CMIN DF P CMIN/DF
Default model 21 75.982 24 .000 3.166
Saturated model 45 .000 0
Independence model 9 1057.745 36 .000 29.382
TABLE 13 RMR, GFI
Model RMR GFI AGFI PGFI
Default model .021 .974 .951 .520
Saturated model .000 1.000
Independence model .131 .608 .509 .486
TABLE 14 Baseline Comparisons
Model NFI
Delta1
RFI
rho1
IFI
Delta2
TLI
rho2 CFI
Default model .928 .892 .950 .924 .949
Saturated model 1.000
1.000
1.000
Independence model .000 .000 .000 .000 .000
TABLE 15 RMSEA
Model RMSEA LO 90 HI 90 PCLOSE
Default model .059 .044 .074 .150
Independence model .213 .202 .224 .000
Iloeje, A. F. Int. Journal of Engineering Research and Applications www.ijera.com
ISSN : 2248-9622, Vol. 5, Issue 6, ( Part - 5) June 2015, pp.104-118
www.ijera.com 115 | P a g e
Figure 1. THE MODEL
3.2 Discussion
Frequent failure of tarred roads seems to have
brought about increase in road mishaps which often
lead to loss of lives, traffic congestion. These could
have accounted for high cost of goods and services as
a result of roads that are inaccessible for commercial
activities. The cost of goods and services being high
could have inevitably given rise to disruption in
business activities, reduction in productivity with
associated poverty. Also, the degree of poverty could
bring about slow economic growth which is capable
of precipitating migration when confidence must
have been lost on the government. The 30 impact
indicator items attained significant mean value
Iloeje, A. F. Int. Journal of Engineering Research and Applications www.ijera.com
ISSN : 2248-9622, Vol. 5, Issue 6, ( Part - 5) June 2015, pp.104-118
www.ijera.com 116 | P a g e
beyond the threshold of 3.00 in the 5 point rating
scale which is significant enough to warrant
mitigation.
These impact indicators as shown in this study are
traced to damages to road transport infrastructure
resulting from flooding; thus, these multiplier effects
as shown in the 30 item impact indicators have been
parsimoniously segmented in the structural equation
model used in this study. Thus, damages to road
transport infrastructure resulting from flooding have
significantly influenced socio economic activities and
environmental sustainability. This is validated by the
output of the descriptive statistics for the indicator
items used in this study.
IV. Conclusion Flooding is a major environmental issue
precipitated by inadequate or silted drains. It has
immense capacity to disrupt socio-economic
activities as a result of the damages to road transport
infrastructure and other municipal utilities. The
impact on the environment is so severe that
sustainability, integrity and serviceability of urban
infrastructures are interfered with giving rise to an
unfriendly and unliveable city. This study has been
able to statistically confirm the degree of impact of
flood events on the environment and therefore
recommends that appropriate mitigation strategies
such as proper infrastructural design and planning,
good governance, population control and appropriate
weather monitoring and alert, be put in place to cope
with the phenomenon.
References [1] Adedeji, A. A.; and Salamu, A. W. (2008).
Environmental Hazards. Flooding and Its
Effects on Residential Buildings in Ilorin,
Nigeria. Copyright 2015 Scribd.
[2] Adger, W. N., Hughes, T. P., Folke, C.,
Carpenter, S. R., Rockstrom, J. (2005).
Social-Ecological Resilience to Coastal
Disasters. Science 309 (5737). 1036-1039.
[3] Akukwe, T. I., Ogbodo, C. (2015). Spatial
Analysis of Vulnerability to Flooding in Port
HarcourtMetropolis, Nigeria.Sage Open
March 1, 2015. 5:2158244015575558, 1-19.
[4] Ahmad, F. D.; Farooq, C; and Mohamed, A.
(2006). Profling Consumer: A Study of
Qatari Consumers’ Shopping Motivations.
Journal of Retailing and Consumer Service;
13:67-80.
[5] Aliyu, B. N. (2014). Analysis of Vulnerabilty
of Flood Disaster in Kano State,
Nigeria.Greener Journal of Physical Sciences
4(2), 22-29.
[6] Brouwer, R. and Remcovan, E. K. (2004).
Integrated Ecological, Economic and Social
Impact Assessment of alternative Flood
Control Policies in the Netherlands.
Ecological Economics, 50(1-2), 1-21.
[7] Egboka, B. C, (1985). "Water resources
problems in the Enugu area of Anambra
State, Nigeria"
[8] Water Resources and Environmental
Pollution Unit (WREPU), Department of
GeologyAnambra State University of
Technology. p. 98.
[9] Few, R. (2003). Flooding, Vulnerability and
Coping Strategies: local responses to a global
threat.
[10] Progress in Development Studies, 3(1), 43-
58.
[11] Green, C. H., Tunstall, S. M., and Fordham,
M. H. (1991). The Risks from Flooding:
Which Risks andwhose Perception. Disasters,
15(3), 227-236.
[12] Hair, J.; William, C.; Barry, J; Rolph, E.
(2010). Multivariate Data Analysis; Pearson
Education Inc. New Jersey.
[13] Kazmierczak, A., and Kenny, C. (2011). Risk
of Flooding to Infrastructure in Greater
Manchester. The Bruntwood Initiative for
Sustainable Cities at the University of
Manchester.
[14] Kofo, A. A. (2012). Qualitative Studies of
Recent Floods and Sustainable Growth and
Development of Cities and Towns in Nigeria.
International Journal of Academic Research
in Economics and Management Sciences.
1(3), 1-25.
[15] National Emergency Management Agency
(NEMA) (2013). Flood Disaster Report 2012,
Daily Trust Newspaper, May 11, 2012.
[16] National Bureau of Statistics (2006). Federal
Republic of Nigeria 2006Population Census.
[17] http://www.nigerianstat.gov.ng/nbsapps/conn
ections/Pop2006.pdfCensus (2006)
[18] Neal, P. and Curtis, W. (2008). Century of the
City: No time to lose. New York: Rockefeller
Foundation.
[19] Nemry, F. and Demirel, H. (2012). Impacts of
Climate Change on Transport: A focus on
road and rail Transport infrastructures. JRC
Scientific and Policy Reports.
[20] Odufuwa, B. O., Adedeji, H. O., Oladesu, J.
O.,andBongwa, A. (2012). Floods of Fury in
Nigerian Cities. Journal of Sustainable
Development, 5(7), 69-79.
[21] Reifsnyder, W. E.; Darnhofer, T. (1989).
Meteorology and agroforestry. World
Agroforestry Centre. p. 544. ISBN 92-9059-
059-9.
[22] Sanni, L. O. (2007). Cassava post-harvest
needs assessment survey in Nigeria. IITA.
p. 165. ISBN 978-131-265-3.
Iloeje, A. F. Int. Journal of Engineering Research and Applications www.ijera.com
ISSN : 2248-9622, Vol. 5, Issue 6, ( Part - 5) June 2015, pp.104-118
www.ijera.com 117 | P a g e
[23] Tapsell, S. M., Penning-Rowsell, E. C.
Tunstall, S. M., Wilson, T. L. (2002).
Vulnerability to Flooding: health and social
dimensions DOI: 10.1098/rsta.2002.1013.
The Royal Society Publishing.
[24] Tibaijuka, A. (2008). The Challenge of
Urbanization and the role of UN-Habitat. A
lecture delivered at Warsaw School of
Economics, April 18, 2008.
[25] Tunstall, S.; Tapsell, S.; Green, C.; Floyd, P.
and George, C. (2006). The health Effects of
Flooding: Social research results from
England and Wales. Journal of Water and
Health 04(3). 365-380.
[26] Watson, S. (1993). Cities of Dreams and
Fantasy: Social Planning in a Post-modern
Era. In Freestone, R. (Ed.), Spirited cities:
Urban Planning, Traffic and Environmental
Management in the Nineties. 140-149.
Sydney: Federation Press.
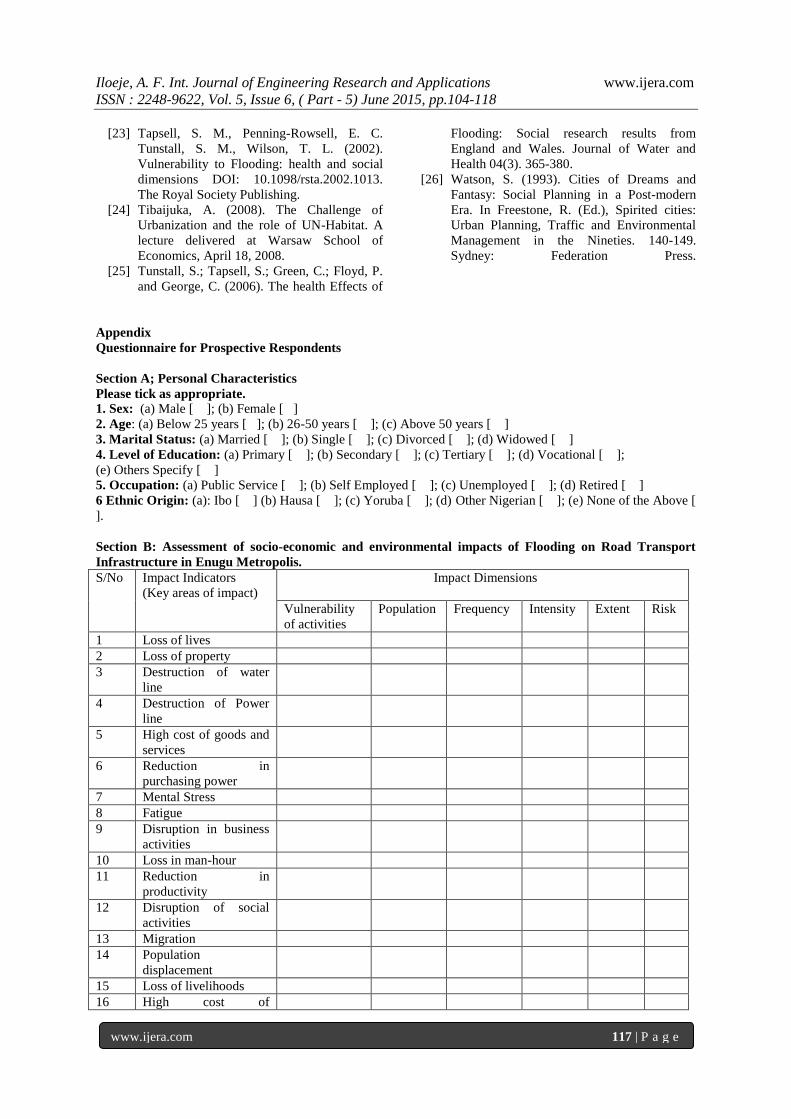
Appendix
Questionnaire for Prospective Respondents
Section A; Personal Characteristics
Please tick as appropriate.
1. Sex: (a) Male [ ]; (b) Female [ ]
2. Age: (a) Below 25 years [ ]; (b) 26-50 years [ ]; (c) Above 50 years [ ]
3. Marital Status: (a) Married [ ]; (b) Single [ ]; (c) Divorced [ ]; (d) Widowed [ ]
4. Level of Education: (a) Primary [ ]; (b) Secondary [ ]; (c) Tertiary [ ]; (d) Vocational [ ];
(e) Others Specify [ ]
5. Occupation: (a) Public Service [ ]; (b) Self Employed [ ]; (c) Unemployed [ ]; (d) Retired [ ]
6 Ethnic Origin: (a): Ibo [ ] (b) Hausa [ ]; (c) Yoruba [ ]; (d) Other Nigerian [ ]; (e) None of the Above [
].
Section B: Assessment of socio-economic and environmental impacts of Flooding on Road Transport
Infrastructure in Enugu Metropolis.
S/No Impact Indicators
(Key areas of impact)
Impact Dimensions
Vulnerability
of activities
Population Frequency Intensity Extent Risk
1 Loss of lives
2 Loss of property
3 Destruction of water
line
4 Destruction of Power
line
5 High cost of goods and
services
6 Reduction in
purchasing power
7 Mental Stress
8 Fatigue
9 Disruption in business
activities
10 Loss in man-hour
11 Reduction in
productivity
12 Disruption of social
activities
13 Migration
14 Population
displacement
15 Loss of livelihoods
16 High cost of
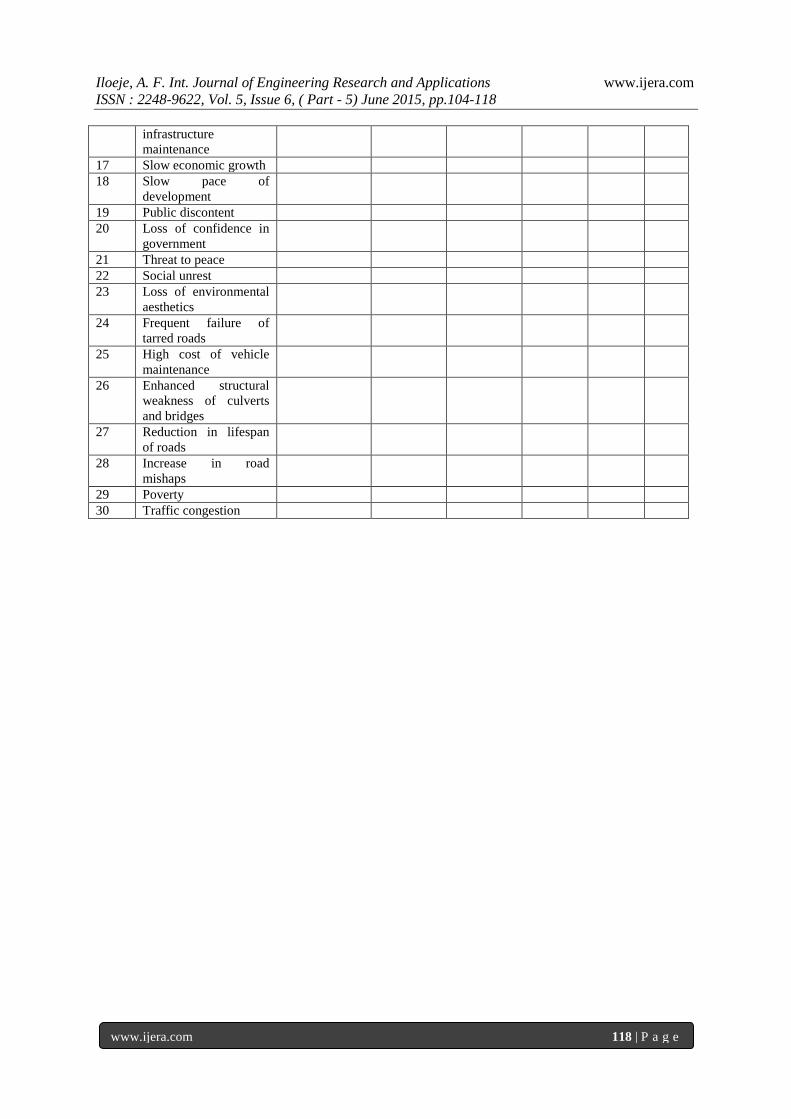
Iloeje, A. F. Int. Journal of Engineering Research and Applications www.ijera.com
ISSN : 2248-9622, Vol. 5, Issue 6, ( Part - 5) June 2015, pp.104-118
www.ijera.com 118 | P a g e
infrastructure
maintenance
17 Slow economic growth
18 Slow pace of
development
19 Public discontent
20 Loss of confidence in
government
21 Threat to peace
22 Social unrest
23 Loss of environmental
aesthetics
24 Frequent failure of
tarred roads
25 High cost of vehicle
maintenance
26 Enhanced structural
weakness of culverts
and bridges
27 Reduction in lifespan
of roads
28 Increase in road
mishaps
29 Poverty
30 Traffic congestion