Embed Size (px)
Citation preview
International Journal of Science and Engineering Applications
Volume 4 Issue 2, 2015, ISSN-2319-7560 (Online)
www.ijsea.com 1
Influence of Titanium Oxide on Creep Behavior, Microstructure and Physical Properties of Tin-Antimony and
Tin-Aluminum-Antimony Based Bearing Alloys
Abstract: Influence of adding titanium oxide (TiO2) nanoparticles on creep behavior, structure, mechanical and thermal properties of tin-
antimony-lead and tin-aluminum-antimony bearing alloys have been studied and analyzed. Stress exponent of tin- antimony- lead and tin-
aluminum- antimony- lead alloys decreased after adding titanium oxide. Elastic modulus of tin- antimony- lead increased after adding titanium
oxide. Internal fiction of tin- antimony- lead and tin- aluminum- antimony- lead alloys varied after adding titanium oxide. Microstructure of tin-
antimony- lead and tin- aluminum- antimony- lead alloys changed after adding titanium oxide. Strengths of tin- antimony- lead and tin- aluminum-
antimony- lead alloys increased after adding titanium oxide. Thermal parameters of tin- antimony- lead and tin- aluminum- antimony- lead alloys
varied after adding titanium oxide. The Sn97Sb51Pb1(TiO2)1 alloy has better bearing properties such as lowest internal friction, high elastic modulus
and higher thermal diffusivity for industrial applications
.
Key words: stress exponent, titanium oxide, bearing alloys, internal fiction, creep indentation, thermal properties, mechanical properties
1. INTRODUCTION
Bearing is a device to allow constrained relative motion
between two or more parts, typically rotation or linear movement.
Bearing is a device used to transmit loads between relatively moving
surfaces. The tribological properties of tin-based bearing alloys with
different compositions, (7% and 20%), have been investigated [1].
Structure, electrical resistivity and elastic modulus of SnSb7X (X = 0,
Cu, Ag, or Cu and Ag) and Pb63-xSn30Sb7Cux [x=0 or x≤2.5] alloys
have been studied and analyzed [2, 3]. Electrical resistivity, elastic
modulus and internal friction of Pb63Sn30Sb7 decreases after adding
Cu. Mechanical properties of Sn-Sb bearing alloy have been evaluated
[4]. Mechanical properties of Sn-Sb improved after adding 1 wt. % of
Cu or Ag. Also the elastic modulus, internal friction and stiffness of
Sn-Sb based bearing alloys varied after annealing for 2 and 4 h at 120,
140 and 160 C. Creep behavior of SnSb5 alloy and
SnPb40Sb2.5 peritectic alloy were studied by long time Vickers
indentation testing at room temperature [5- 7]. Increasing Sb content
from 7.5% to 20% provided an increase in hardness. Tensile properties
of SnSb5Bi1.5 and SnSb5Cu1.5 alloys have been studied at different
strain rates ranging from 5×10⁻⁴ to 1×10⁻² s−1 over the wide
temperature range of 298-400 K [8]. Strength and ductility of SnSb5
improved after adding Bi and Cu. Creep behavior, elastic modulus and
internal friction of SnSb10Cu2X2 (X = Pb, Ag, Se, Cd and Zn) alloys
have been investigated and stress exponents have been determined [9].
The effect of solidification rate, heating and micro additions on
microstructure and hardness of tin-based white metals have been
studied [10, 11]. Rapid cooling suppresses formation and growth of
SbSn cuboids and increases hardness. Structure, hardness, mechanical
and electrical transport properties of Sn90-xSb10Bix (x = 0, or x ≥1)
alloys have been studied and analyzed [12]. Electrical resistivity and
hardness of SnSb10 increased after adding bismuth content. Internal
friction, elastic modulus and thermal diffusivity of SnSb10 decreased
after adding bismuth content. The effects of small amounts of Ag and
Cu on the as-cast microstructure and creep properties of the SnSb5
alloy have been investigated [13]. Small additions of Ag and Cu
elements could effectively change the creep behavior of the SnSb5
alloy. The friction coefficients of
SnSb20.2Pb16.6Cu2.6 is lower than that of SnSb7.2Pb0.4Cu3 under all
scratch test conditions [14]. The directionally solidified
microstructure of SnSb16 hyperperitectic alloy has been investigated at
various solidification rates using a high-thermal gradient directional
solidification apparatus [15]. The volume fraction of the SnSb phase
firstly decreased and then increased when the solidification rate
increased. The aim of this work was to study and analyze the effects
of adding titanium oxide nanoparticles on creep behavior, structure,
mechanical and thermal properties of tin-antimony-lead and tin-
aluminum-antimony based alloys.
2. EXPERIMENTAL WORK Two groups of alloys, Sn80-xSb51Pb1(TiO2)x (x= 0.5, 1 and
1.5 wt.%) and Sn60-xAl20Sb51Pb1(TiO2)x (x= 0.5, 1 and 1.5 wt.%), were
molten in the muffle furnace. Using elements tin, antimony, lead,
aluminum and titanium oxide have a high purity, more than 99.95%.
The resulting ingots were turned and re-melted several times to
increase the homogeneity of the ingots. From these ingots, long
ribbons of about 3-5 mm width and ~ 70 m thickness were prepared
as the test samples by directing a stream of molten alloy onto the outer
surface of rapidly revolving copper roller with surface velocity 31 m/s
giving a cooling rate of 3.7 × 10⁵ k/s. The samples then cut into
convenient shape for the measurements using double knife cuter.
Structure of used alloys was performed using an Shimadzu x–ray
diffractometer (Dx–30, Japan) of Cu–K radiation with =1.54056 Å
at 45 kV and 35 mA and Ni–filter in the angular range 2 ranging from
0 to 100° in continuous mode with a scan speed 5 deg/min. Scanning
electron microscope JEOL JSM-6510LV, Japan was used to study
microstructure of used samples. The melting endotherms of used
alloys were obtained using a SDT Q600 V20.9 Build 20 instrument.
A digital Vickers micro-hardness tester, (Model-FM-7- Japan), was
used to measure Vickers hardness values of used alloys. Internal
friction Q-1 and the elastic constants of used alloys were determined
using the dynamic resonance method [16-18].
3. RESULTS AND DISCUSSIONS Structure
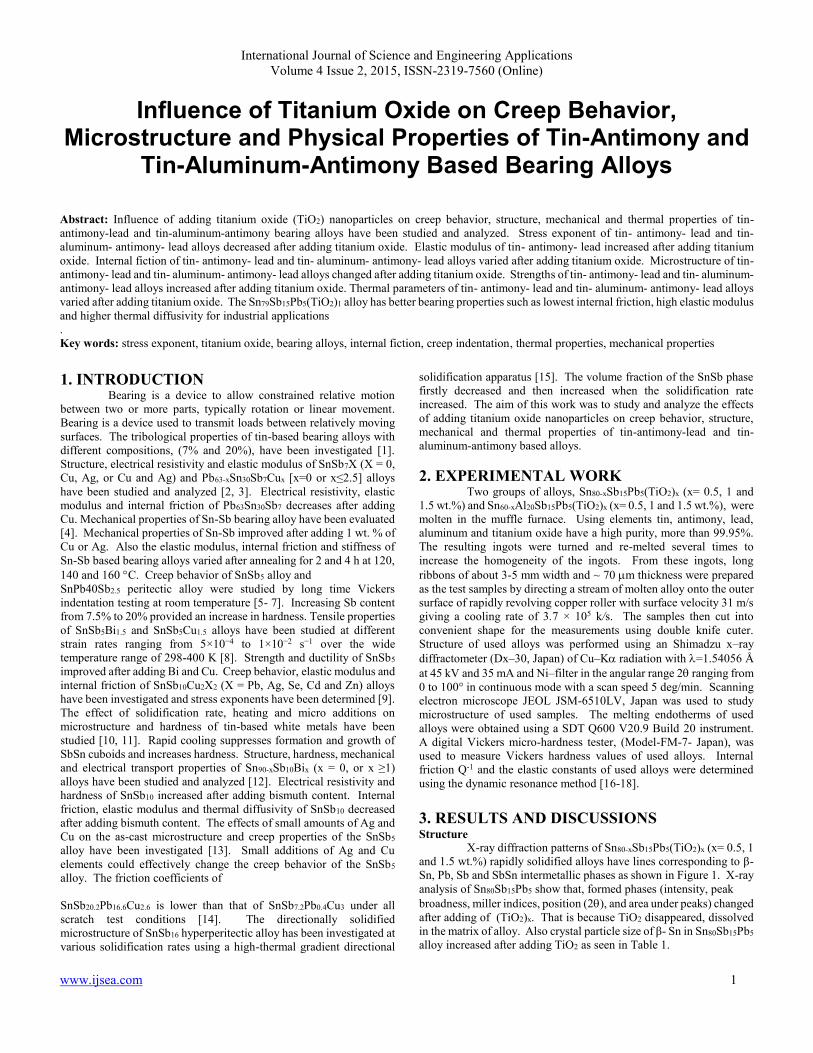
X-ray diffraction patterns of Sn80-xSb51Pb1(TiO2)x (x= 0.5, 1
and 1.5 wt.%) rapidly solidified alloys have lines corresponding to β-
Sn, Pb, Sb and SbSn intermetallic phases as shown in Figure 1. X-ray
analysis of Sn80Sb51Pb1 show that, formed phases (intensity, peak
broadness, miller indices, position (2), and area under peaks) changed
after adding of (TiO2)x. That is because TiO2 disappeared, dissolved
in the matrix of alloy. Also crystal particle size of β- Sn in Sn80Sb51Pb1
alloy increased after adding TiO2 as seen in Table 1.
International Journal of Science and Engineering Applications
Volume 4 Issue 2, 2015, ISSN-2319-7560 (Online)
www.ijsea.com 65
Figure 1:- x-ray diffraction patterns of Sn80-xSb10Pb5(TiO2)x alloys
Table 1:- crystal particle size of β- Sn in Sn80-xSb10Pb5(TiO2)x alloys
Samples Particle size Å
Sn08Sb51Pb1 317.25
Sn9791Sb51Pb1(TiO2)891 395.12
Sn97Sb51Pb1(TiO2)1 448.06
Sn98.5Sb51Pb1(TiO2)1.5 415.38
Scanning electron micrographs, SEM, of Sn80-
xSb51Pb1(TiO2)x alloys show heterogeneous structure as shown in
Figure 2 and that agreed with x-ray analysis. Adding TiO2 caused
change in microstructure of Sn80Sb51Pb1 alloy.
Figure 2:- SEM of Sn80-xSb10Pb5(TiO2)x alloys
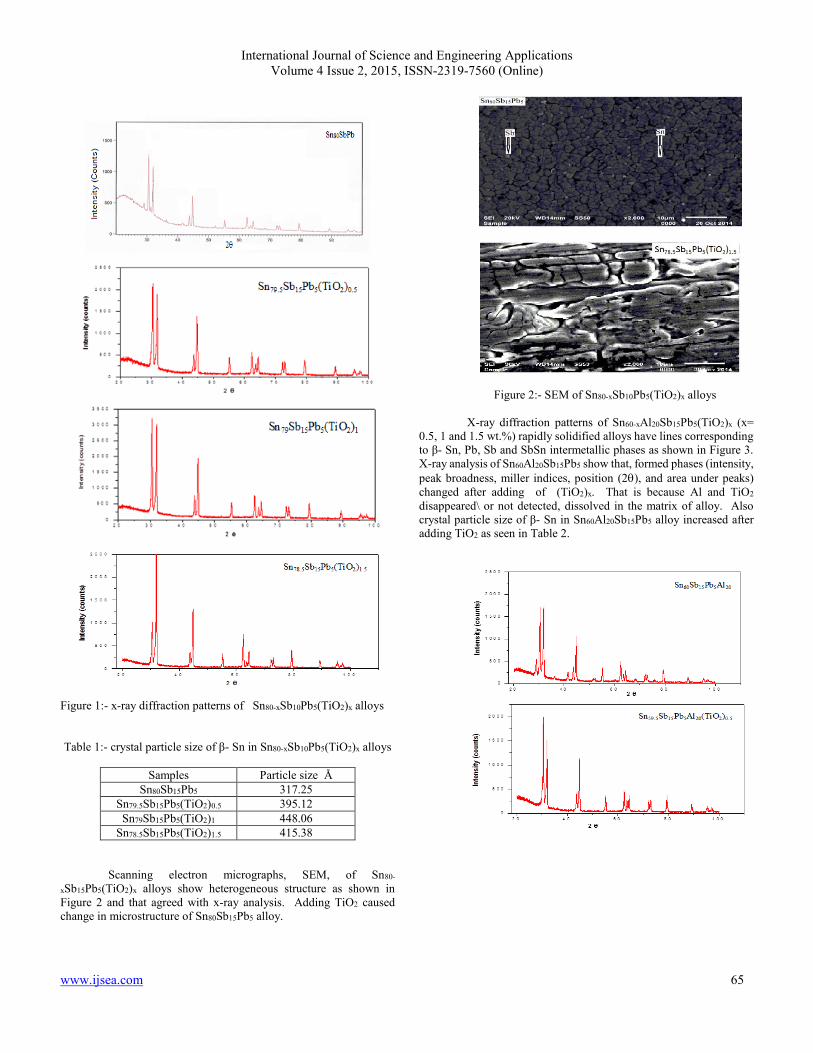
X-ray diffraction patterns of Sn60-xAl20Sb51Pb1(TiO2)x (x=
0.5, 1 and 1.5 wt.%) rapidly solidified alloys have lines corresponding
to β- Sn, Pb, Sb and SbSn intermetallic phases as shown in Figure 3.
X-ray analysis of Sn60Al20Sb51Pb1 show that, formed phases (intensity,
peak broadness, miller indices, position (2), and area under peaks)
changed after adding of (TiO2)x. That is because Al and TiO2
disappeared\ or not detected, dissolved in the matrix of alloy. Also
crystal particle size of β- Sn in Sn60Al20Sb51Pb1 alloy increased after
adding TiO2 as seen in Table 2.
International Journal of Science and Engineering Applications
Volume 4 Issue 2, 2015, ISSN-2319-7560 (Online)
www.ijsea.com 66
Figure 3:- x-ray diffraction patterns of
Sn68-x Al20Sb51Pb1 (TiO2)x alloys
Table 2:- crystal particle size of β- Sn in
Sn68-x Al20Sb51Pb1(TiO2)x alloys
Samples Particle size Å
Sn68 Al20Sb51Pb1 337.70
Sn59.5 Al20Sb51Pb1(TiO2)891 412.47
Sn59 Al20Sb51Pb1(TiO2)1 409.78
Sn58.5 Al20Sb51Pb1(TiO2)1.5 368.36
Scanning electron micrographs, SEM, of Sn60-
xAl20Sb51Pb1(TiO2)x alloys show heterogeneous structure as shown in
Figure 4 and that agreed with x-ray analysis.
Figure 4:- SEM of Sn68-x Al20Sb51Pb1(TiO2)x alloys
Mechanical properties
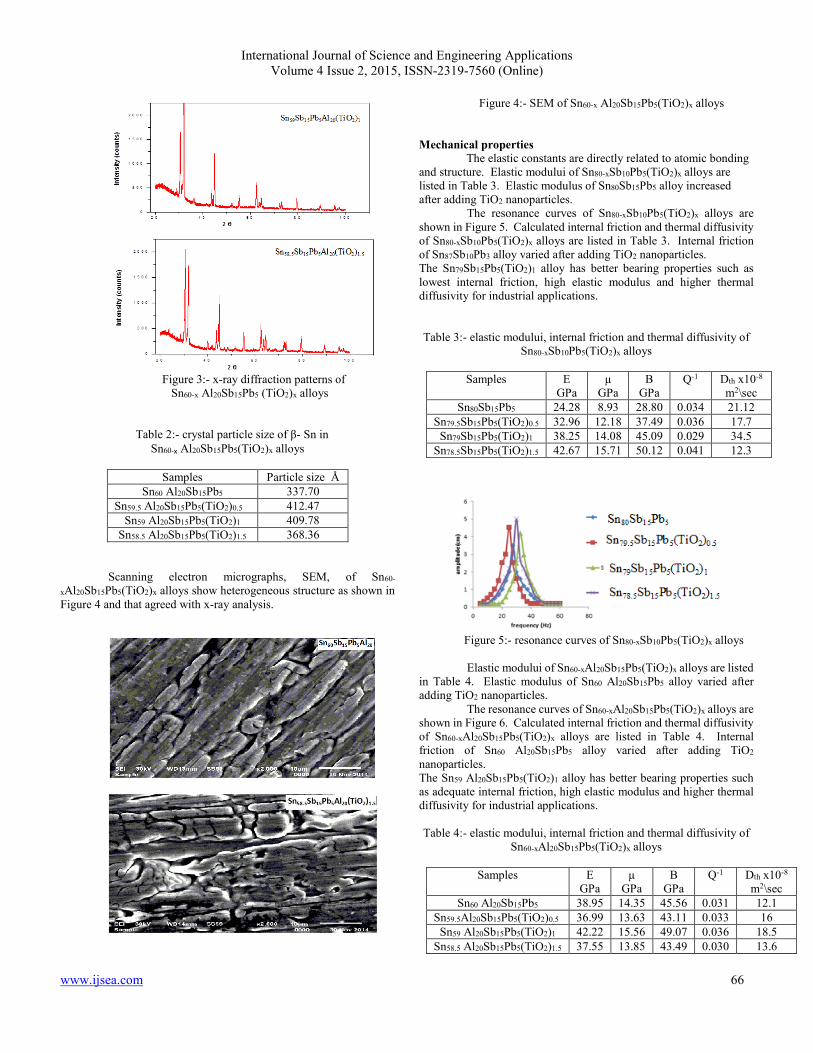
The elastic constants are directly related to atomic bonding
and structure. Elastic modului of Sn80-xSb10Pb5(TiO2)x alloys are
listed in Table 3. Elastic modulus of Sn08Sb51Pb1 alloy increased
after adding TiO2 nanoparticles.
The resonance curves of Sn80-xSb10Pb5(TiO2)x alloys are
shown in Figure 5. Calculated internal friction and thermal diffusivity
of Sn80-xSb10Pb5(TiO2)x alloys are listed in Table 3. Internal friction
of Sn87Sb10Pb3 alloy varied after adding TiO2 nanoparticles.
The Sn97Sb51Pb1(TiO2)1 alloy has better bearing properties such as
lowest internal friction, high elastic modulus and higher thermal
diffusivity for industrial applications.
Table 3:- elastic modului, internal friction and thermal diffusivity of
Sn80-xSb10Pb5(TiO2)x alloys
Samples E
GPa
µ
GPa
B
GPa
Q-1 Dth x10-8
m2\sec
Sn08Sb51Pb1 24.28 8.93 28.80 0.034 21.12
Sn9791Sb51Pb1(TiO2)891 9.976 12.18 37.49 0.036 17.7
Sn97Sb51Pb1(TiO2)1 38.25 14.08 45.09 0.029 34.5
Sn98.5Sb51Pb1(TiO2)1.5 42.67 15.71 50.12 0.041 12.3
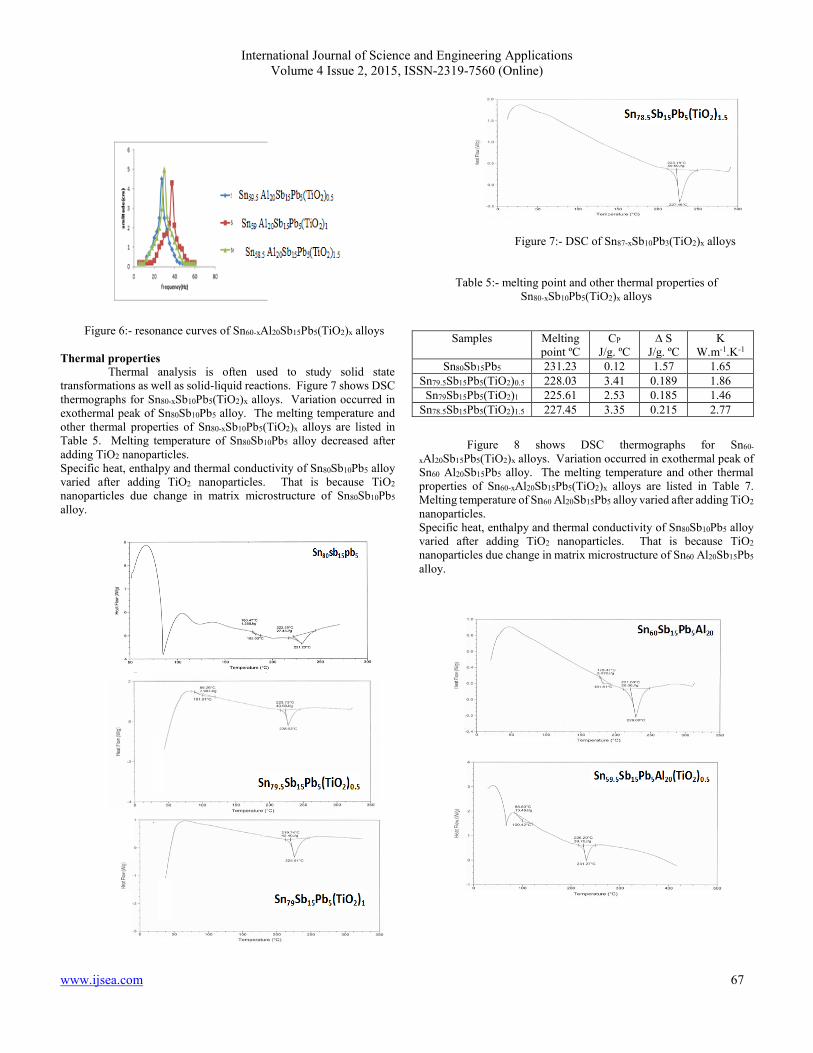
Figure 5:- resonance curves of Sn80-xSb10Pb5(TiO2)x alloys
Elastic modului of Sn60-xAl20Sb51Pb1(TiO2)x alloys are listed
in Table 4. Elastic modulus of Sn68 Al20Sb51Pb1 alloy varied after
adding TiO2 nanoparticles.
The resonance curves of Sn60-xAl20Sb51Pb1(TiO2)x alloys are
shown in Figure 6. Calculated internal friction and thermal diffusivity
of Sn60-xAl20Sb51Pb1(TiO2)x alloys are listed in Table 4. Internal
friction of Sn68 Al20Sb51Pb1 alloy varied after adding TiO2
nanoparticles.
The Sn59 Al20Sb51Pb1(TiO2)1 alloy has better bearing properties such
as adequate internal friction, high elastic modulus and higher thermal
diffusivity for industrial applications.
Table 4:- elastic modului, internal friction and thermal diffusivity of
Sn60-xAl20Sb51Pb1(TiO2)x alloys
Samples E
GPa
µ
GPa
B
GPa
Q-1 Dth x10-8
m2\sec
Sn68 Al20Sb51Pb1 38.95 14.35 45.56 0.031 12.1
Sn59.5Al20Sb51Pb1(TiO2)891 36.99 13.63 43.11 0.033 16
Sn59 Al20Sb51Pb1(TiO2)1 42.22 15.56 49.07 0.036 18.5
Sn58.5 Al20Sb51Pb1(TiO2)1.5 37.55 13.85 43.49 0.030 13.6
International Journal of Science and Engineering Applications
Volume 4 Issue 2, 2015, ISSN-2319-7560 (Online)
www.ijsea.com 67
Figure 6:- resonance curves of Sn60-xAl20Sb51Pb1(TiO2)x alloys
Thermal properties
Thermal analysis is often used to study solid state
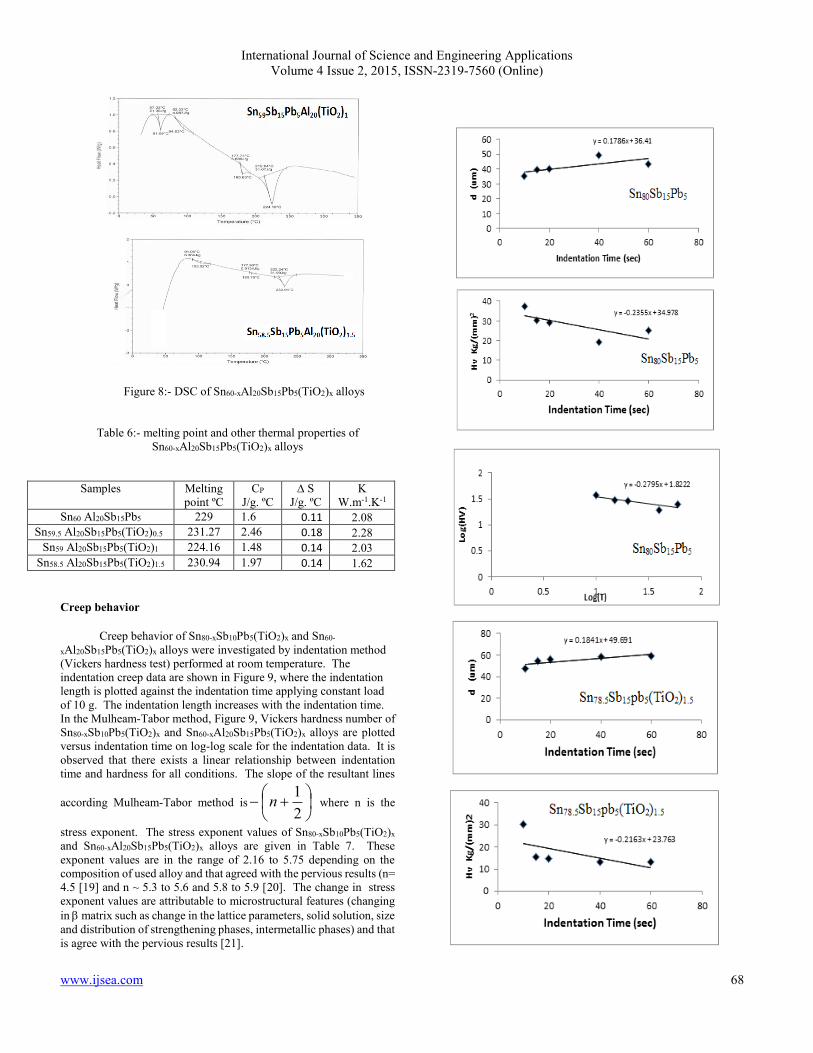
transformations as well as solid-liquid reactions. Figure 7 shows DSC
thermographs for Sn80-xSb10Pb5(TiO2)x alloys. Variation occurred in
exothermal peak of Sn80Sb10Pb5 alloy. The melting temperature and
other thermal properties of Sn80-xSb10Pb5(TiO2)x alloys are listed in
Table 5. Melting temperature of Sn80Sb10Pb5 alloy decreased after
adding TiO2 nanoparticles.
Specific heat, enthalpy and thermal conductivity of Sn80Sb10Pb5 alloy
varied after adding TiO2 nanoparticles. That is because TiO2
nanoparticles due change in matrix microstructure of Sn80Sb10Pb5
alloy.
Figure 7:- DSC of Sn87-xSb10Pb3(TiO2)x alloys
Table 5:- melting point and other thermal properties of
Sn80-xSb10Pb5(TiO2)x alloys
Samples Melting
point ºC
CP
J/g. ºC
∆ S
J/g. ºC
K
W.m-1.K-1
Sn08Sb51Pb1 .959.9 0.12 1.57 1.65
Sn9791Sb51Pb1(TiO2)891 228.03 3.41 0.189 1.86
Sn97Sb51Pb1(TiO2)1 225.61 2.53 0.185 1.46
Sn98.5Sb51Pb1(TiO2)1.5 227.45 3.35 0.215 2.77
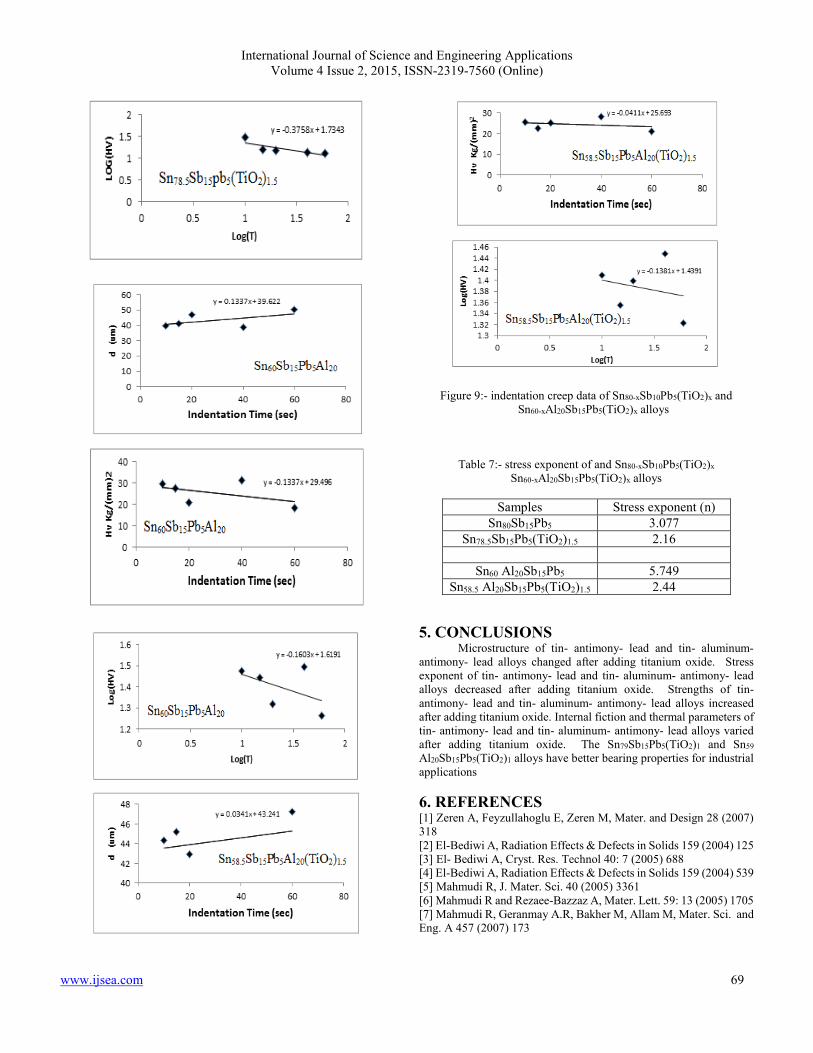
Figure 8 shows DSC thermographs for Sn60-
xAl20Sb51Pb1(TiO2)x alloys. Variation occurred in exothermal peak of
Sn68 Al20Sb51Pb1 alloy. The melting temperature and other thermal
properties of Sn60-xAl20Sb51Pb1(TiO2)x alloys are listed in Table 9.
Melting temperature of Sn68 Al20Sb51Pb1 alloy varied after adding TiO2
nanoparticles.
Specific heat, enthalpy and thermal conductivity of Sn80Sb10Pb5 alloy
varied after adding TiO2 nanoparticles. That is because TiO2
nanoparticles due change in matrix microstructure of Sn68 Al20Sb51Pb1
alloy.
International Journal of Science and Engineering Applications
Volume 4 Issue 2, 2015, ISSN-2319-7560 (Online)
www.ijsea.com 68
Figure 8:- DSC of Sn60-xAl20Sb51Pb1(TiO2)x alloys
Table 6:- melting point and other thermal properties of
Sn60-xAl20Sb51Pb1(TiO2)x alloys
Samples Melting
point ºC
CP
J/g. ºC
∆ S
J/g. ºC
K
W.m-1.K-1
Sn68 Al20Sb51Pb1 229 1.6 0.11 2.08
Sn59.5 Al20Sb51Pb1(TiO2)891 231.27 2.46 0.18 2.28
Sn59 Al20Sb51Pb1(TiO2)1 224.16 1.48 0.14 2.03
Sn58.5 Al20Sb51Pb1(TiO2)1.5 230.94 1.97 0.14 1.62
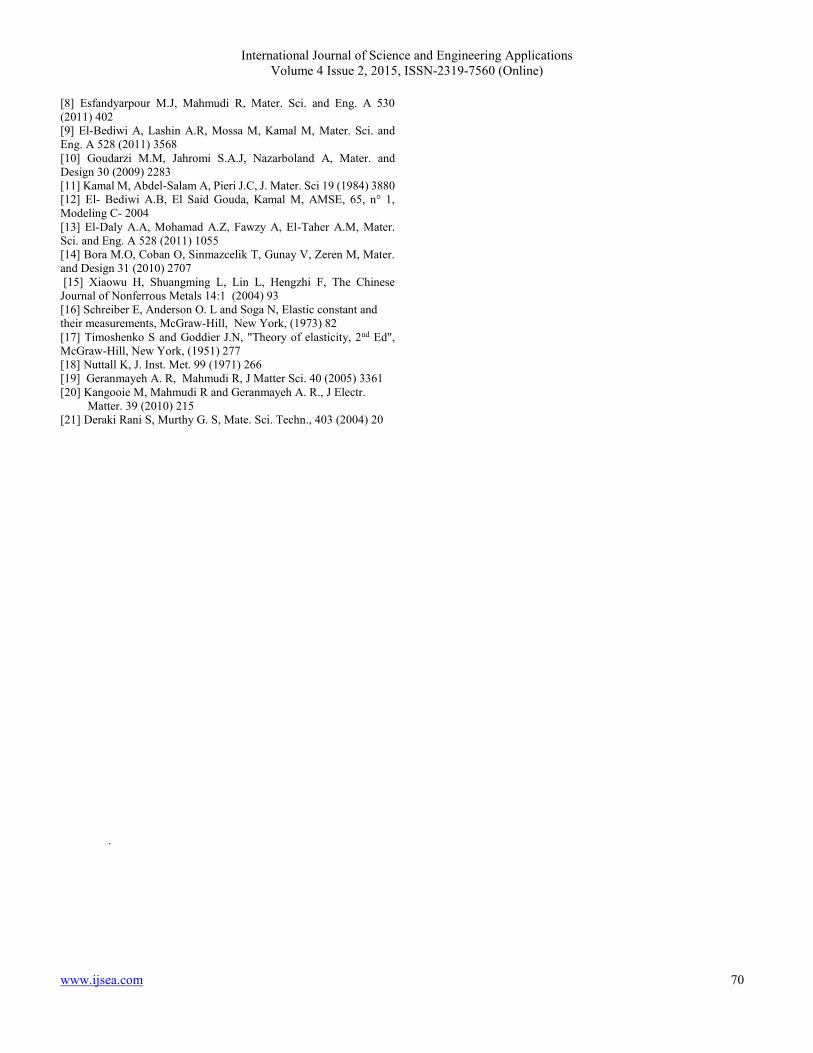
Creep behavior
Creep behavior of Sn80-xSb10Pb5(TiO2)x and Sn60-
xAl20Sb51Pb1(TiO2)x alloys were investigated by indentation method
(Vickers hardness test) performed at room temperature. The
indentation creep data are shown in Figure 9, where the indentation
length is plotted against the indentation time applying constant load
of 10 g. The indentation length increases with the indentation time.
In the Mulheam-Tabor method, Figure 9, Vickers hardness number of
Sn80-xSb10Pb5(TiO2)x and Sn60-xAl20Sb51Pb1(TiO2)x alloys are plotted
versus indentation time on log-log scale for the indentation data. It is
observed that there exists a linear relationship between indentation
time and hardness for all conditions. The slope of the resultant lines
according Mulheam-Tabor method is
2
1n where n is the
stress exponent. The stress exponent values of Sn80-xSb10Pb5(TiO2)x
and Sn60-xAl20Sb51Pb1(TiO2)x alloys are given in Table 7. These
exponent values are in the range of 2.16 to 5.75 depending on the
composition of used alloy and that agreed with the pervious results (n=
4.5 [19] and n ~ 5.3 to 5.6 and 5.8 to 5.9 [20]. The change in stress
exponent values are attributable to microstructural features (changing
in matrix such as change in the lattice parameters, solid solution, size
and distribution of strengthening phases, intermetallic phases) and that
is agree with the pervious results [21].
International Journal of Science and Engineering Applications
Volume 4 Issue 2, 2015, ISSN-2319-7560 (Online)
www.ijsea.com 69
Figure 9:- indentation creep data of Sn80-xSb10Pb5(TiO2)x and
Sn60-xAl20Sb51Pb1(TiO2)x alloys
Table 7:- stress exponent of and Sn80-xSb10Pb5(TiO2)x
Sn60-xAl20Sb51Pb1(TiO2)x alloys
Samples Stress exponent (n)
Sn08Sb51Pb1 3.077
Sn98.5Sb51Pb1(TiO2)1.5 2.16
Sn68 Al20Sb51Pb1 5.749
Sn58.5 Al20Sb51Pb1(TiO2)1.5 2.44
5. CONCLUSIONS
Microstructure of tin- antimony- lead and tin- aluminum-
antimony- lead alloys changed after adding titanium oxide. Stress
exponent of tin- antimony- lead and tin- aluminum- antimony- lead
alloys decreased after adding titanium oxide. Strengths of tin-
antimony- lead and tin- aluminum- antimony- lead alloys increased
after adding titanium oxide. Internal fiction and thermal parameters of
tin- antimony- lead and tin- aluminum- antimony- lead alloys varied
after adding titanium oxide. The Sn97Sb51Pb1(TiO2)1 and Sn59
Al20Sb51Pb1(TiO2)1 alloys have better bearing properties for industrial
applications
6. REFERENCES
[1] Zeren A, Feyzullahoglu E, Zeren M, Mater. and Design 28 (2007)
318
[2] El-Bediwi A, Radiation Effects & Defects in Solids 159 (2004) 125
[3] El- Bediwi A, Cryst. Res. Technol 40: 7 (2005) 688
[4] El-Bediwi A, Radiation Effects & Defects in Solids 159 (2004) 539
[5] Mahmudi R, J. Mater. Sci. 40 (2005) 3361
[6] Mahmudi R and Rezaee-Bazzaz A, Mater. Lett. 59: 13 (2005) 1705
[7] Mahmudi R, Geranmay A.R, Bakher M, Allam M, Mater. Sci. and
Eng. A 457 (2007) 173
International Journal of Science and Engineering Applications
Volume 4 Issue 2, 2015, ISSN-2319-7560 (Online)
www.ijsea.com 70
[8] Esfandyarpour M.J, Mahmudi R, Mater. Sci. and Eng. A 530
(2011) 402
[9] El-Bediwi A, Lashin A.R, Mossa M, Kamal M, Mater. Sci. and
Eng. A 528 (2011) 3568
[10] Goudarzi M.M, Jahromi S.A.J, Nazarboland A, Mater. and
Design 30 (2009) 2283
[11] Kamal M, Abdel-Salam A, Pieri J.C, J. Mater. Sci 19 (1984) 3880
[12] El- Bediwi A.B, El Said Gouda, Kamal M, AMSE, 65, n° 1,
Modeling C- 2004
[13] El-Daly A.A, Mohamad A.Z, Fawzy A, El-Taher A.M, Mater.
Sci. and Eng. A 528 (2011) 1055
[14] Bora M.O, Coban O, Sinmazcelik T, Gunay V, Zeren M, Mater.
and Design 31 (2010) 2707
[15] Xiaowu H, Shuangming L, Lin L, Hengzhi F, The Chinese
Journal of Nonferrous Metals 14:1 (2004) 93
[16] Schreiber E, Anderson O. L and Soga N, Elastic constant and
their measurements, McGraw-Hill, New York, (1973) 82
[17] Timoshenko S and Goddier J.N, "Theory of elasticity, 2nd Ed",
McGraw-Hill, New York, (1951) 277
[18] Nuttall K, J. Inst. Met. 99 (1971) 266
[19] Geranmayeh A. R, Mahmudi R, J Matter Sci. 40 (2005) 3361
[20] Kangooie M, Mahmudi R and Geranmayeh A. R., J Electr.
Matter. 39 (2010) 215
[21] Deraki Rani S, Murthy G. S, Mate. Sci. Techn., 403 (2004) 20
.