Embed Size (px)
Citation preview
ECHO SOUNDING,HIGH RESOLUTION SHALLOW SEISMIC REFLECTION AND UNDERWATER SONOGRAPHIC
METHODS FOR CONSTRUCTION OF OFFSHORE STRUCTURES
Seminar by
ANUP P NAIKNIKA BHINGARDE
RAGHAVENDRA PRABHUSABNA THILAKAN
Guided byDr A K CHAUBEY
Chief scientistGeological Oceanography Division
CSIR-NIO, Dona Paula, Goa
Objective of study
The main objective of the project work are: Understanding fundamentals of echo sounding, side scan
sonar, high resolution seismic reflection techniques employed to study seabed and sub-seabed features of near offshore region
Understanding fundamentals of Ground Penetrating Radar (GPR) technique employed to study sub surface onshore coastal features adjacent to near shore region
Learning details of acquisition of bathymetry, sonography of the sea bed and seismic reflection data onboard survey boat.
Learning procedure for processing the acquired raw data using standard software and interpretation of processed data.
Synthesising details of the data acquisition , processing and interpretation.
ECHO SOUNDING METHOD
INTRODUCTION
Echo sounding is a geophysical technique of finding depth of water by transmitting sound pulses into water. The time interval between emission and return of a pulse is recorded, which is used to determine the depth of water considering speed of sound in water.
Lead line and sounding pole were the earliest methods used for directly measuring water depth.
The Echo-sounding technique was developed by Professor Fassenden in 1914 and has been used in hydrographic surveying since then.
Single Beam Echo Sounders (SBES) still remain the traditional equipment used on hydrographic surveys worldwide, however Multi Beam Echo Sounders (MBES) and Airborne Laser Sounding (ALS) systems now provide almost total seafloor coverage and depth measurement.
SOUND PROPAGATION IN SEA WATER
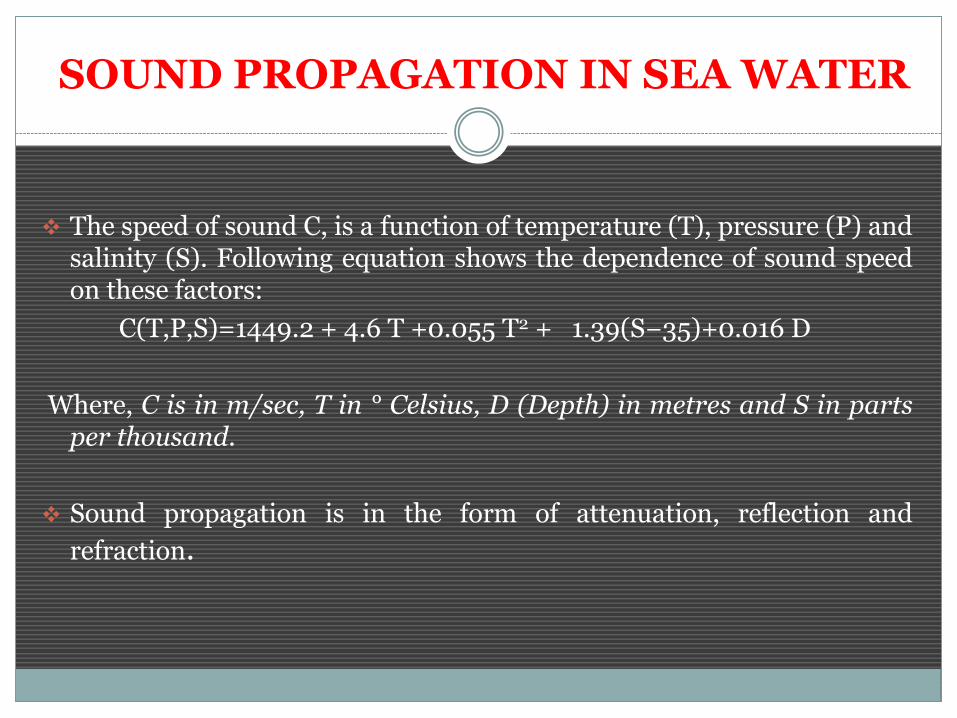
The speed of sound C, is a function of temperature (T), pressure (P) andsalinity (S). Following equation shows the dependence of sound speedon these factors:
C(T,P,S)=1449.2 + 4.6 T +0.055 T2 + 1.39(S−35)+0.016 D
Where, C is in m/sec, T in ° Celsius, D (Depth) in metres and S in partsper thousand.
Sound propagation is in the form of attenuation, reflection and
refraction.
ACOUSTIC PARAMETERS
The characteristics of an echo sounder are determined by the acoustic parameters namely:
1. Frequency
2. Band width
3. Pulse length
The transducers are one of the echo sounders’ components; it is transducer characteristics which dictate some of the operating features of an echo sounder. The transducers are the devices used for transmission and reception of the acoustic pulses.
Transducers are classified with regard to their operating principle, i.e. magnetostrictive, piezoelectric, and electrostrictive.
SINGLE BEAM ECHO SOUNDER
These echo sounders are devices for depth determination by measuring the time interval between the emission of a sonic or ultrasonic pulse and the return of its echo from the seabed .
An echo sounder works by converting electrical energy, from the pulse generator, into acoustic energy. As the transducers do not transmit in all directions, the acoustic energy is projected into the water in the form of a vertically oriented beam.
The acoustic pulse travels through the water column and hits the seabed. The interaction with the seafloor results in reflection, transmission and scattering.
The reflected energy which returns to the transducer, the echo, is sensed by the transducer.
MULTI BEAM ECHO SOUNDERS
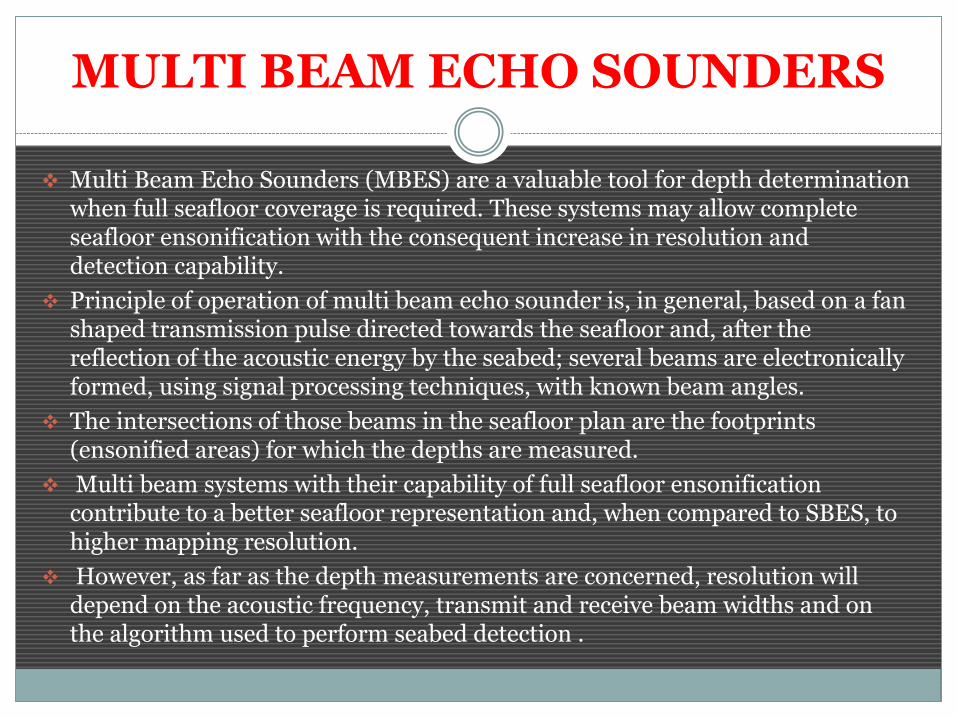
Multi Beam Echo Sounders (MBES) are a valuable tool for depth determination when full seafloor coverage is required. These systems may allow complete seafloor ensonification with the consequent increase in resolution and detection capability.
Principle of operation of multi beam echo sounder is, in general, based on a fan shaped transmission pulse directed towards the seafloor and, after the reflection of the acoustic energy by the seabed; several beams are electronically formed, using signal processing techniques, with known beam angles.
The intersections of those beams in the seafloor plan are the footprints (ensonified areas) for which the depths are measured.
Multi beam systems with their capability of full seafloor ensonification contribute to a better seafloor representation and, when compared to SBES, to higher mapping resolution.
However, as far as the depth measurements are concerned, resolution will depend on the acoustic frequency, transmit and receive beam widths and on the algorithm used to perform seabed detection .
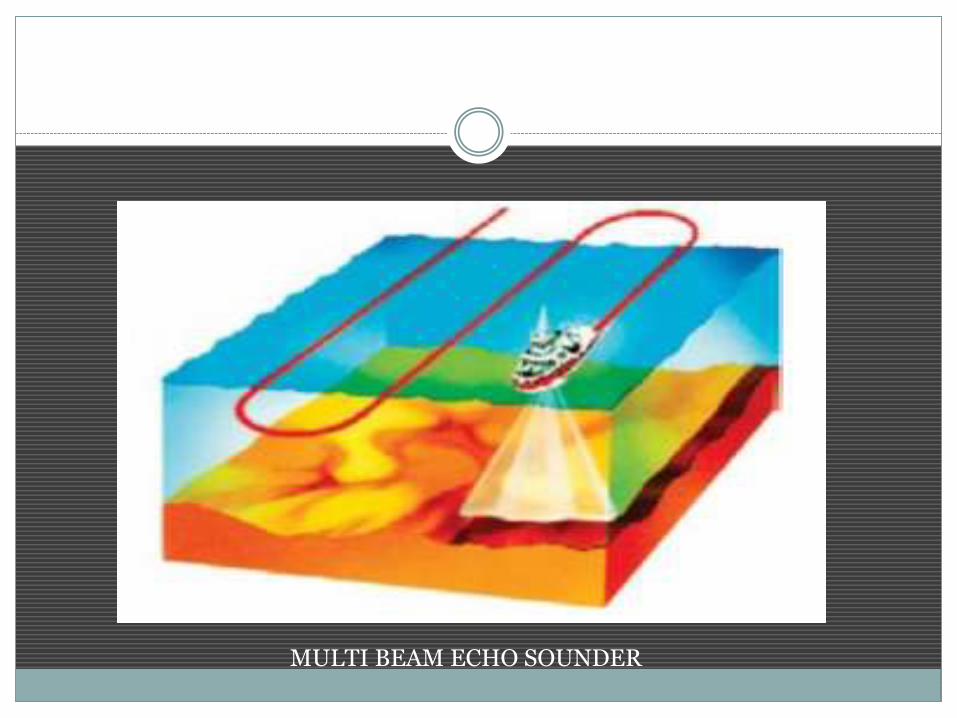
MULTI BEAM ECHO SOUNDER
PROCESSING AND PRESENTATION OF DATA
Acquired echo sounding data are required to be corrected for ship’s motion, navigation, sound velocity, and tidal variations.
In practice at most four processing steps, which are summarized below, are needed for the majority of acquired echo sounding data:
Application of appropriate sound velocity profile
Application of corrected tides
Editing of spurious depth data
Generation of gridded database
The echo sounding data normally are presented in the form of:
1. bathymetric profiles
2. bathymetric contour map (both 2D & 3D) and,
3. gridded bathymetry map.
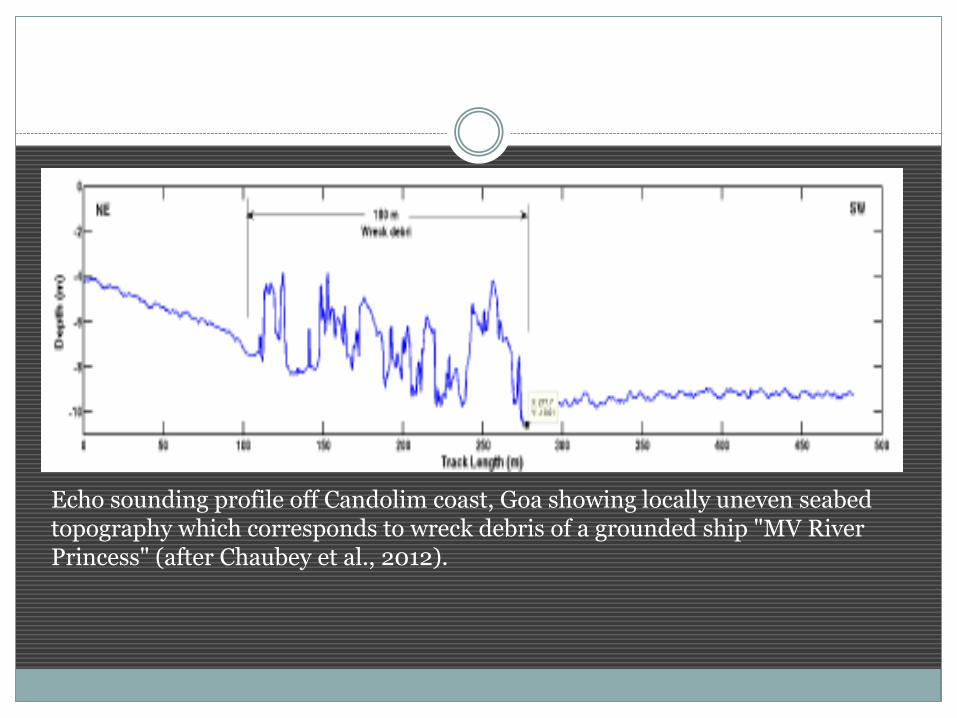
Echo sounding profile off Candolim coast, Goa showing locally uneven seabed topography which corresponds to wreck debris of a grounded ship "MV River Princess" (after Chaubey et al., 2012).
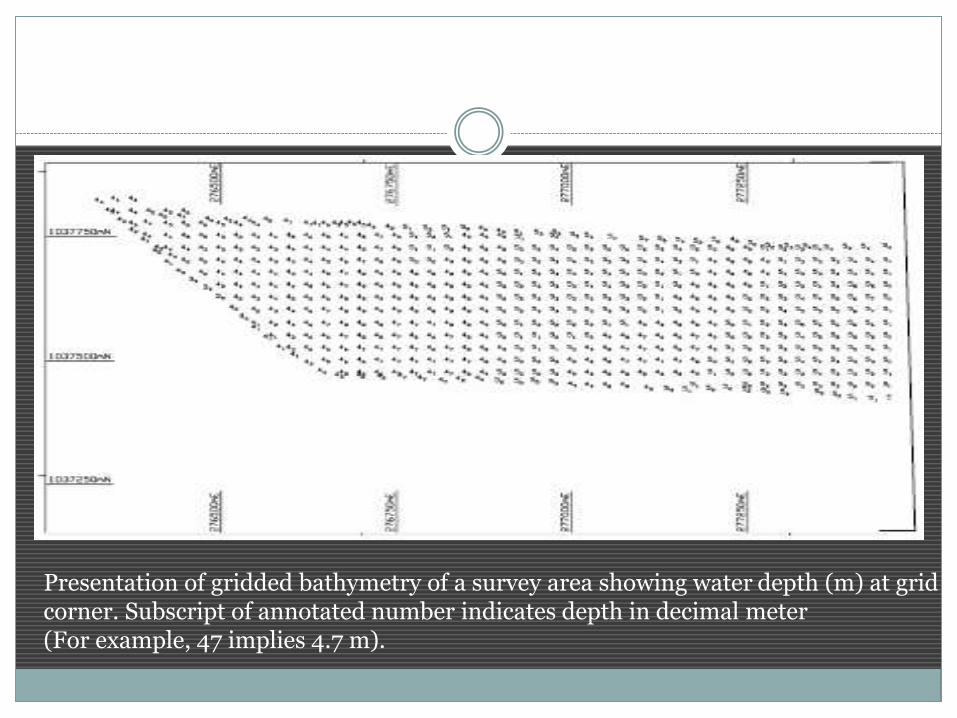
Presentation of gridded bathymetry of a survey area showing water depth (m) at grid corner. Subscript of annotated number indicates depth in decimal meter (For example, 47 implies 4.7 m).
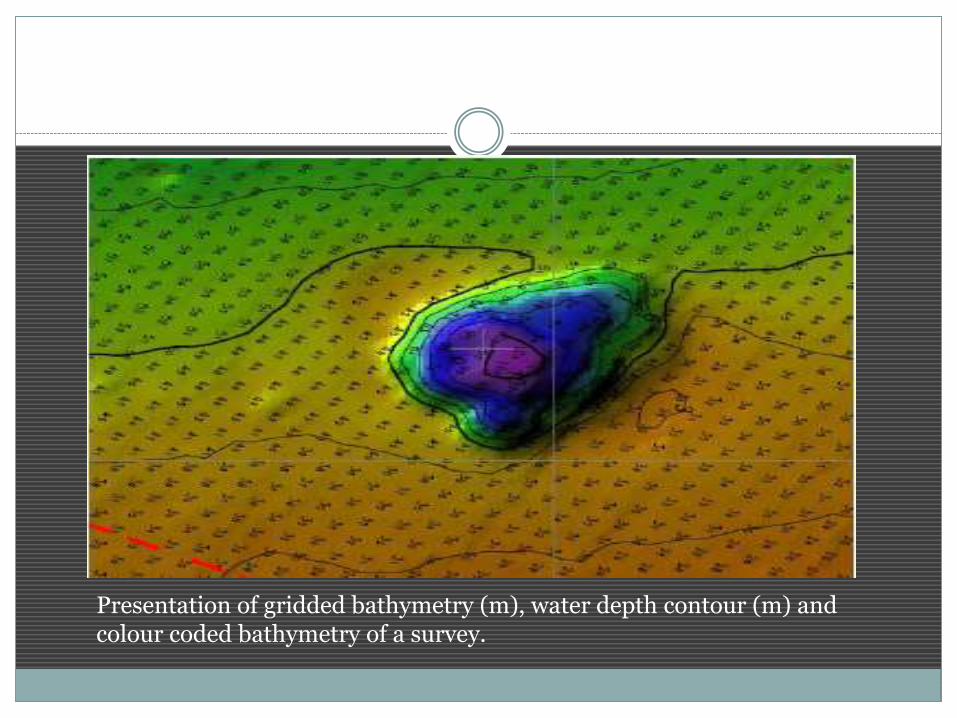
Presentation of gridded bathymetry (m), water depth contour (m) and colour coded bathymetry of a survey.
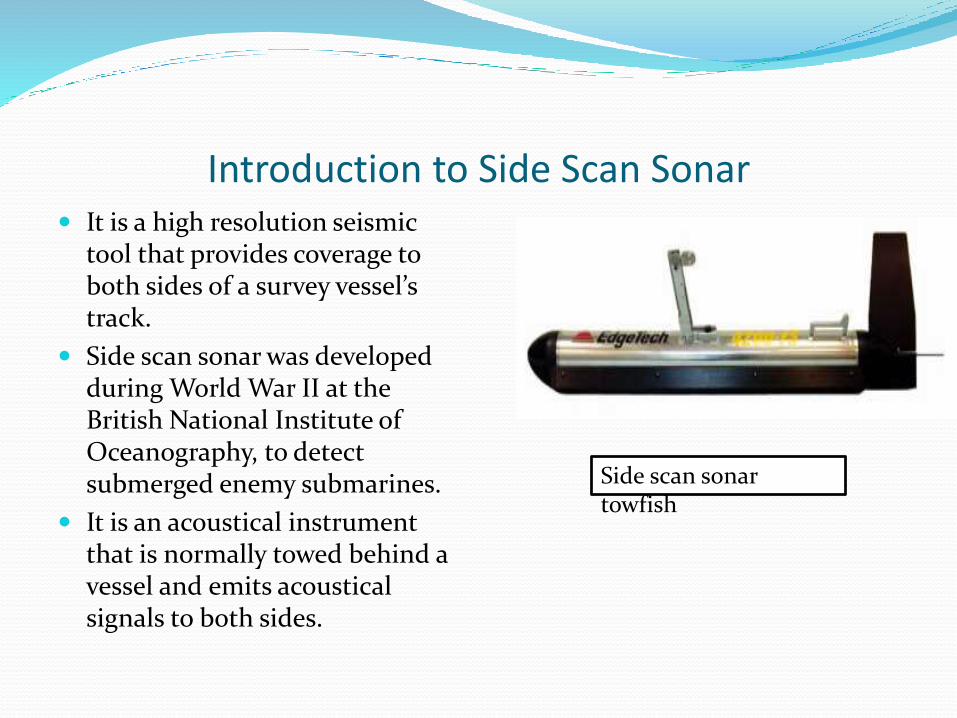
Introduction to Side Scan Sonar It is a high resolution seismic
tool that provides coverage to both sides of a survey vessel’s track.
Side scan sonar was developed during World War II at the British National Institute of Oceanography, to detect submerged enemy submarines.
It is an acoustical instrument that is normally towed behind a vessel and emits acoustical signals to both sides.
Side scan sonar towfish
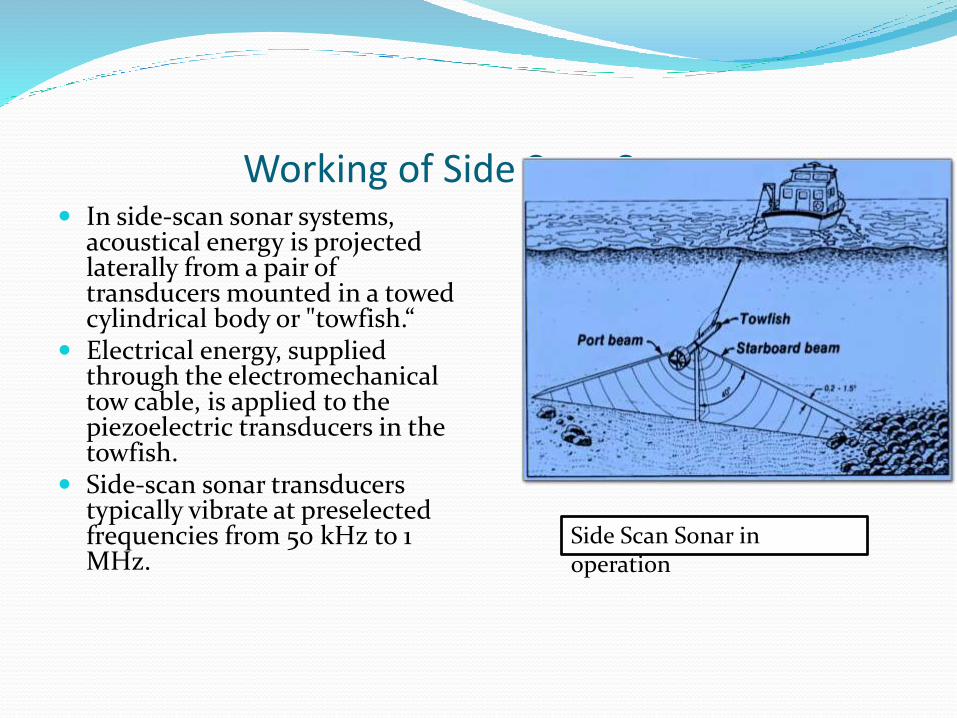
Working of Side Scan Sonar In side-scan sonar systems,
acoustical energy is projected laterally from a pair of transducers mounted in a towed cylindrical body or "towfish.“
Electrical energy, supplied through the electromechanical tow cable, is applied to the piezoelectric transducers in the towfish.
Side-scan sonar transducers typically vibrate at preselected frequencies from 50 kHz to 1 MHz.
Side Scan Sonar in operation
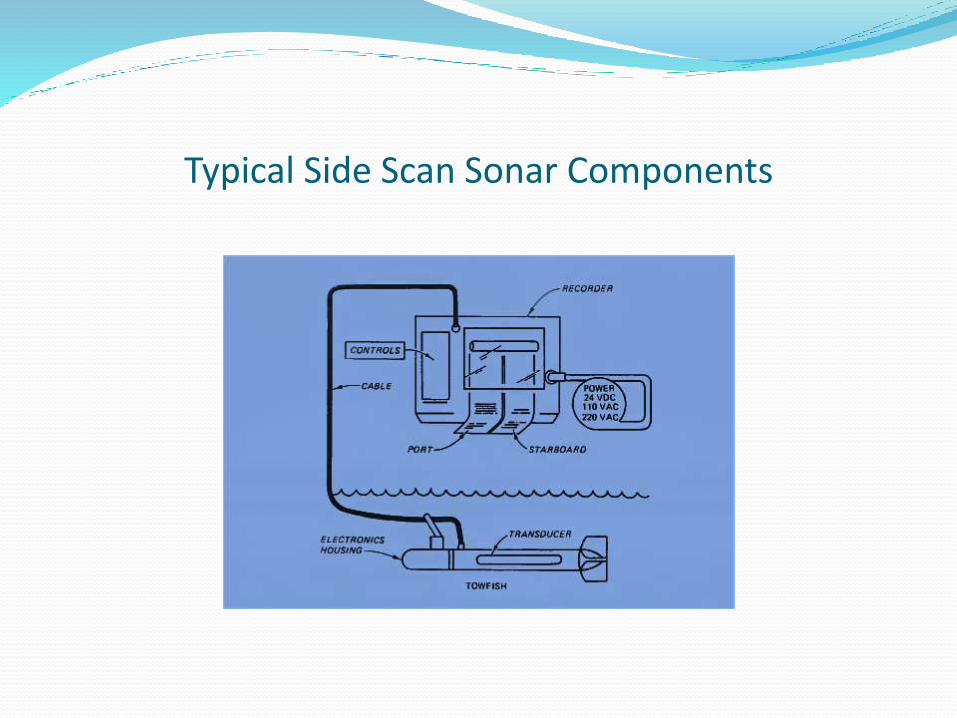
Typical Side Scan Sonar Components
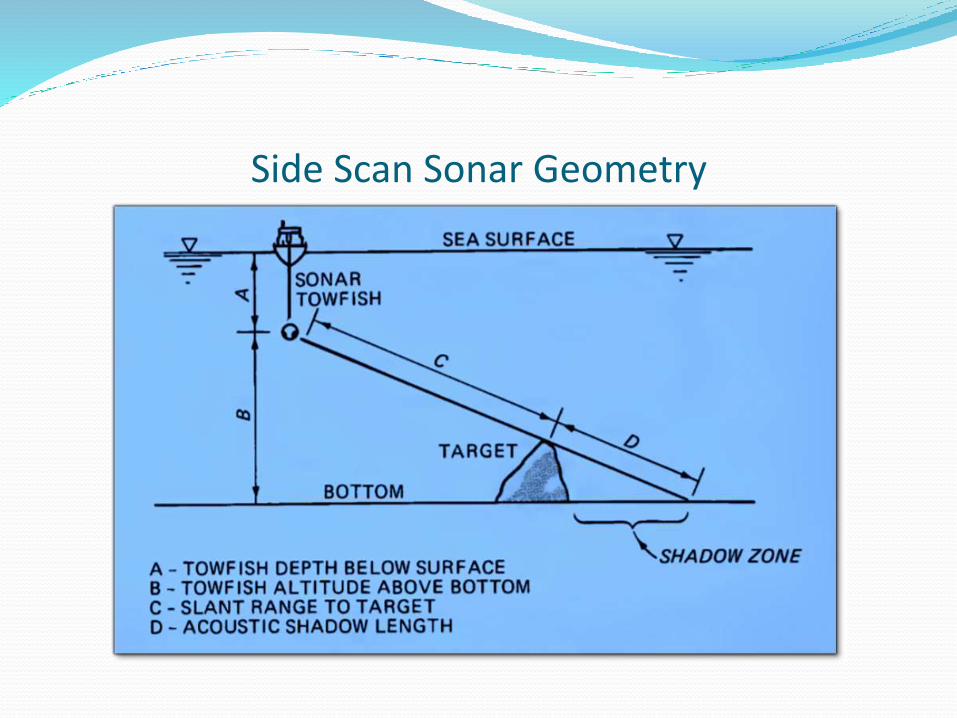
Side Scan Sonar Geometry
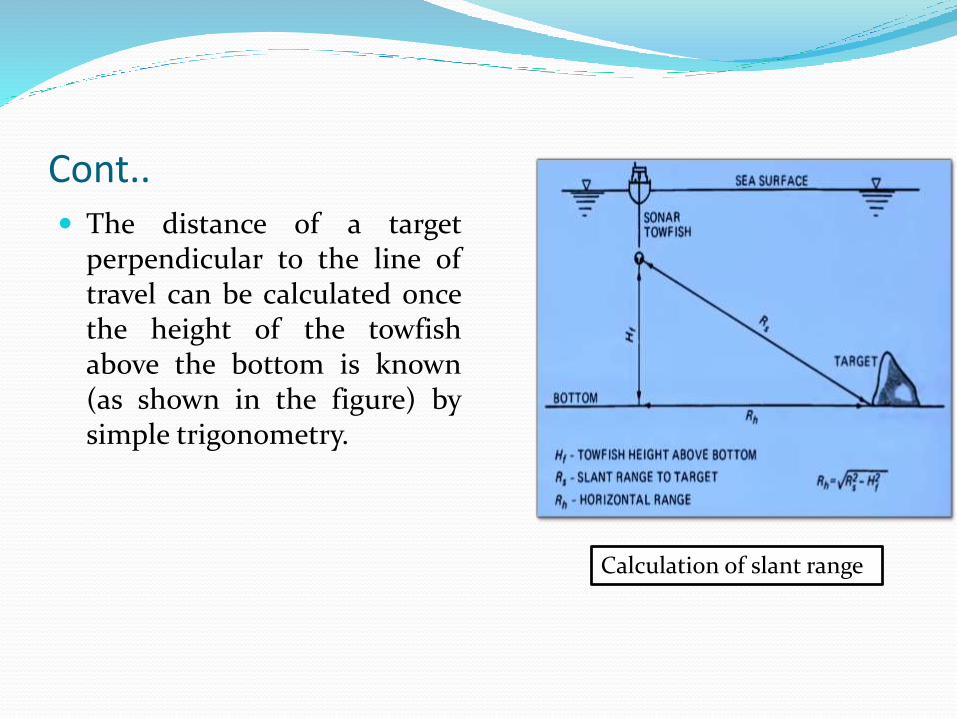
Cont.. The distance of a target
perpendicular to the line oftravel can be calculated oncethe height of the towfishabove the bottom is known(as shown in the figure) bysimple trigonometry.
Calculation of slant range
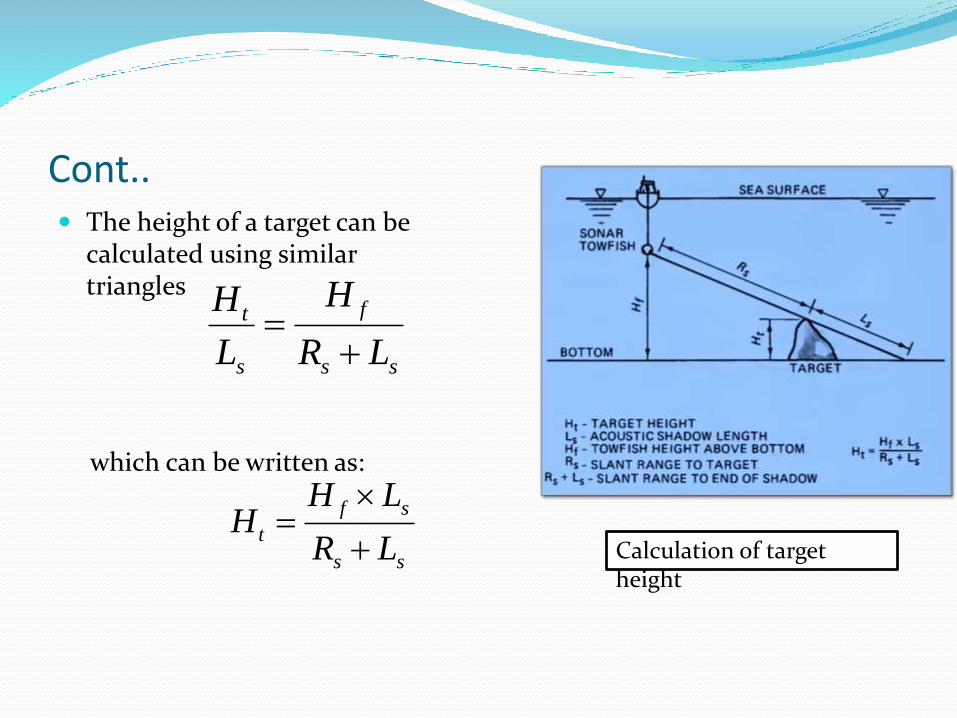
Cont.. The height of a target can be
calculated using similar triangles
which can be written as:
Calculation of target height
ss
f
s
t
LR
H
L
H
ss
sf
tLR
LHH
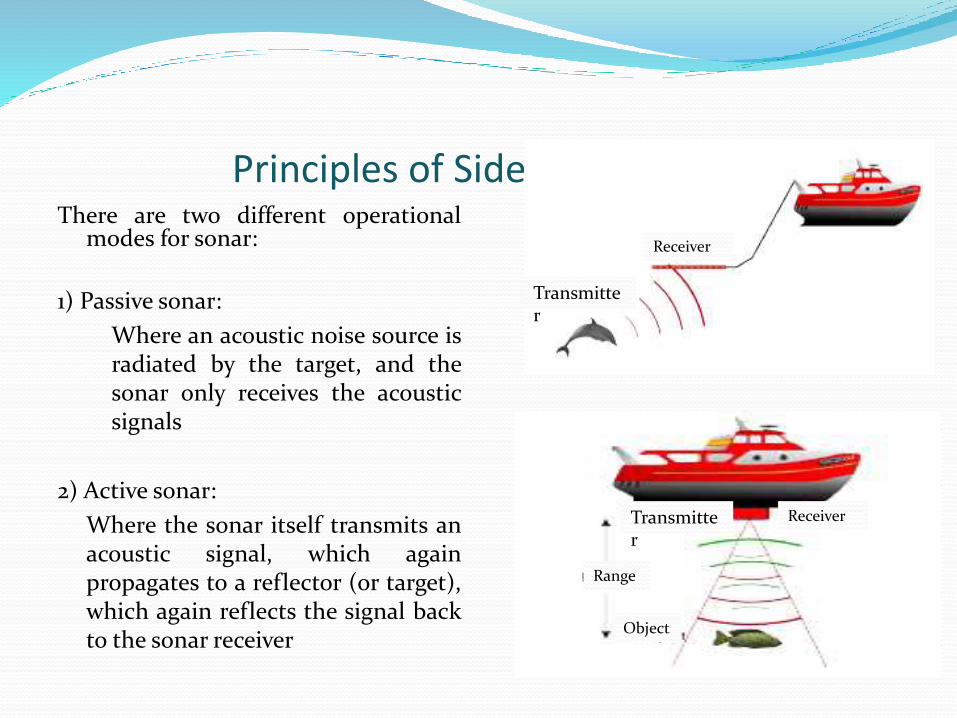
Principles of Side Scan SonarThere are two different operational
modes for sonar:
1) Passive sonar:
Where an acoustic noise source isradiated by the target, and thesonar only receives the acousticsignals
2) Active sonar:
Where the sonar itself transmits anacoustic signal, which againpropagates to a reflector (or target),which again reflects the signal backto the sonar receiver
Transmitter
Receiver
Range
Object
Transmitter
Receiver
Range
Object
Receiver
Transmitter
Processing of SSS Data The side scan sonar record is also known as a ‘sonogram’. The sonogram
is of varying shades with each shade a function of the intensity of thereturning acoustical pulse. The stronger the returning pulse the darkerthe image.
Sonogram often shows striking variations in brightness, caused bychanging altitude of the towfish, making the images difficult to read.Hence processing of the SSS data is very important before they can beinterpreted.
It involves a number of steps including corrections for environmentaland instrument noise and geometrical projections.
In the present study, processing of the raw SSS data was carried outusing SonarWiz5 software at the CSIR-National Institute ofOceanography, Goa.
Cont..
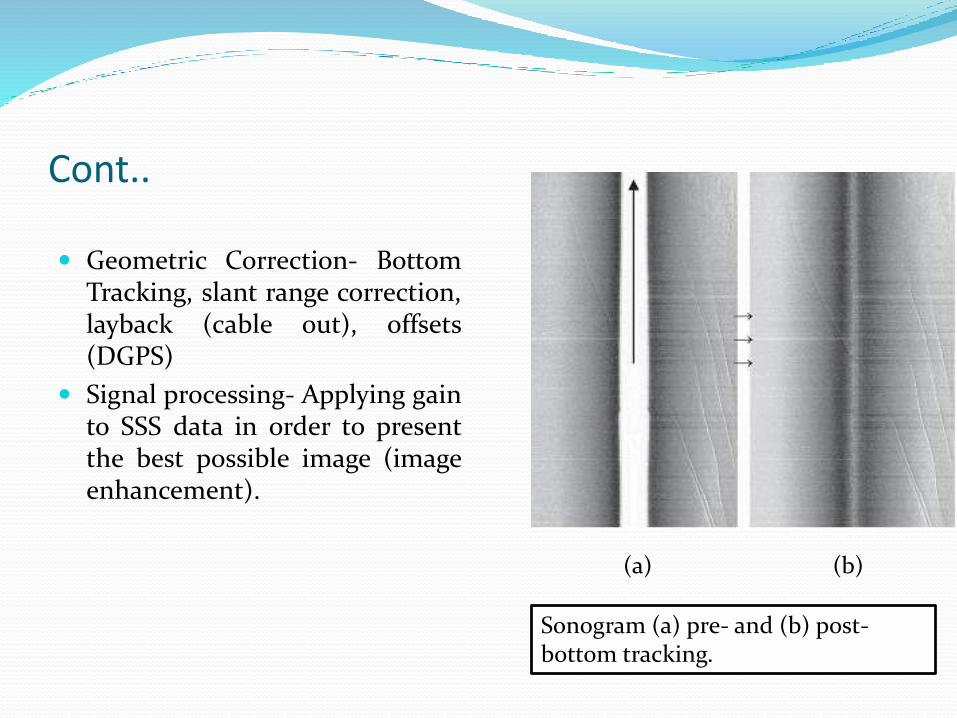
Geometric Correction- BottomTracking, slant range correction,layback (cable out), offsets(DGPS)
Signal processing- Applying gainto SSS data in order to presentthe best possible image (imageenhancement).
Sonogram (a) pre- and (b) post-bottom tracking.
(a) (b)
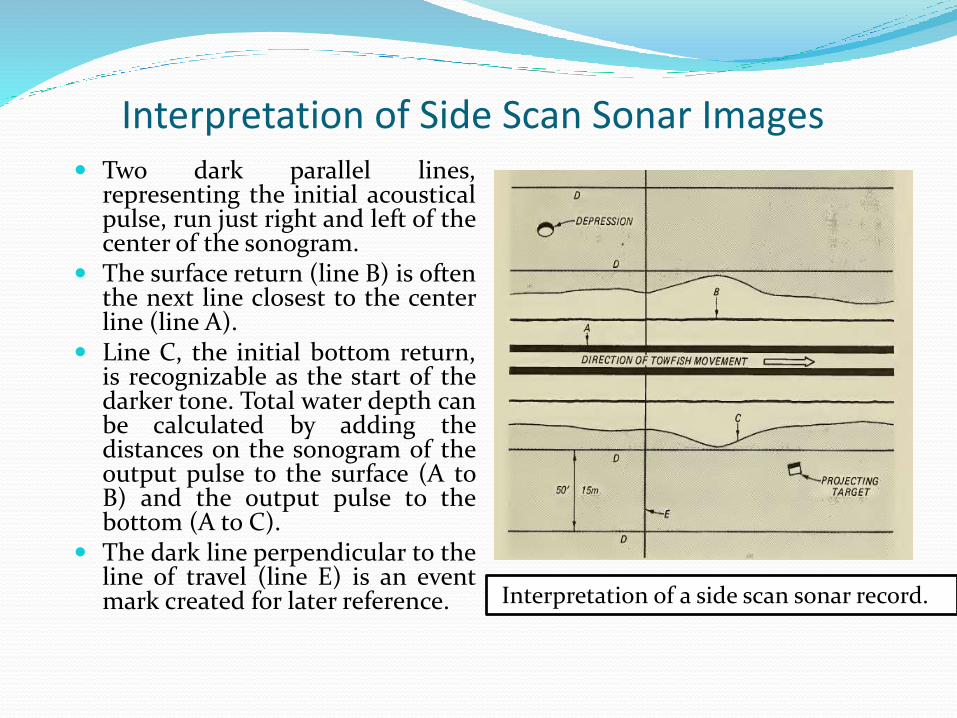
Interpretation of Side Scan Sonar Images Two dark parallel lines,
representing the initial acousticalpulse, run just right and left of thecenter of the sonogram.
The surface return (line B) is oftenthe next line closest to the centerline (line A).
Line C, the initial bottom return,is recognizable as the start of thedarker tone. Total water depth canbe calculated by adding thedistances on the sonogram of theoutput pulse to the surface (A toB) and the output pulse to thebottom (A to C).
The dark line perpendicular to theline of travel (line E) is an eventmark created for later reference. Interpretation of a side scan sonar record.
Factors Affecting Interpretation of Sonar Images A number of factors affect the intensity of the returning signal,
which includes: Acoustic reflectivity of the target, Slope of thetarget face, Contrast between the target and surroundingmaterial, and the number of reflecting surfaces.
Target material and orientation influences Acoustic Reflectivity is a function of the acoustic impedance of
the material.Acoustic impedance = ρ x cwhere ρ = material density
c = speed of sound through the material The coarser the sediment, the higher the reflectivity. Therefore, gravel reflects more acoustic energy than sand, which
reflects more than silt or clay.
Cont.. Vessel speed effects
Distortion parallel to the trackline of the towfish occurs due to varyingboat speeds.
Distortions perpendicular to the line of travel is a function of theheight of the fish and the distance of the object from the fish andoscillations in these positions.

Limitations of Side Scan Sonar Wave effects:
Periods for successful survey is limited to seasons of low wave energy i.e summer months.
Current conditions:
Major problem occurs when the current is perpendicular to the path of survey vessel.
Other site limitations:
Maintaining constant speed and towfish elevation required for good results.
Presence of other vessels can make it difficult to keep the vessel on track.
Engineering Application
Side-scan sonar is a potentially useful tool for the reconnaissance andinspection for coastal structures.
Side-scan sonar has been used for a variety of coastal engineeringrelated applications. It is used to find out objects lying on the seafloorbefore starting construction of any offshore structures such as offshoreplatform, jetty, single point mooring, intake and outfall pipe line layingetc.
It is proved to be an effective monitoring tool for monitoring disposalsites of dredged material at near shore and offshore sites. As thenearshore and offshore open-water disposal of dredged materialbecomes increasingly popular, the need to monitor these disposal siteswill become more important.
Pre and post-dredging sediment distribution mapping. Pipeline and cable route surveys. Site surveys for drilling rigs, bridges etc. Mapping seamounts, ocean ridges and other major tectonic features.
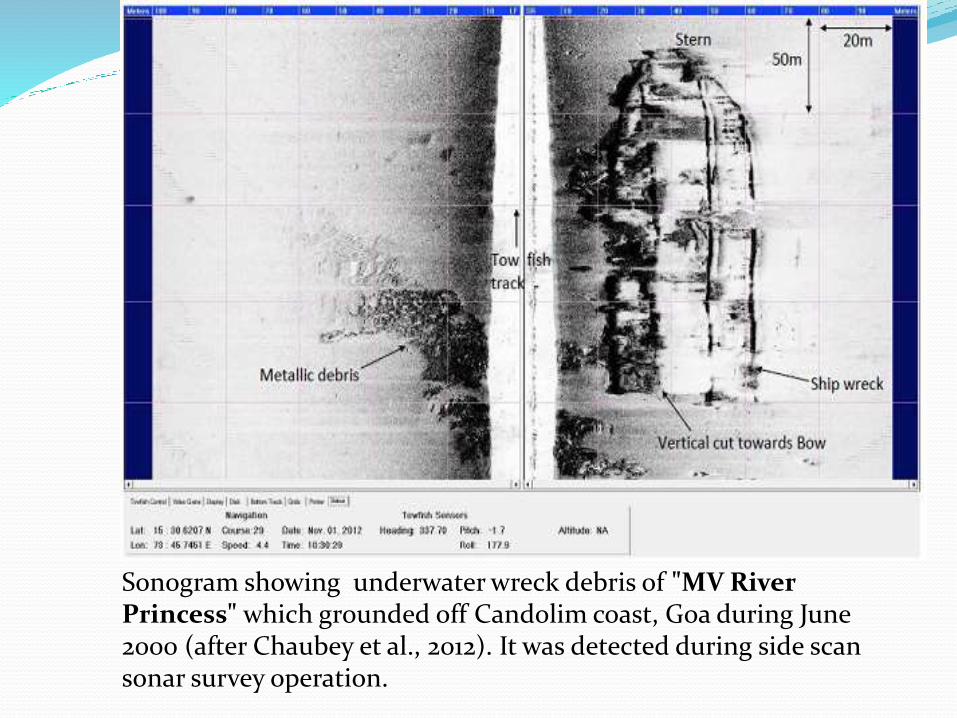
Sonogram showing underwater wreck debris of "MV River Princess" which grounded off Candolim coast, Goa during June 2000 (after Chaubey et al., 2012). It was detected during side scan sonar survey operation.
HIGH RESOLUTION SHALLOW SEISMIC
REFLECTION METHOD
GENERAL BACKGROUND
Marine seismic reflection method is the most important geophysical
methods employed in the offshore environment to obtain a
comprehensive picture of the sea-floor morphology and underlying
shallow stratigraphy. TYPICAL APPLICATIONS
1. Mineral exploration
2. Foundation studies
3.Harbour development
4. Cable/pipeline surveys
5. It is also widely used to identify and characterize near-surface
tectonic deformation in areas concerned with earthquake
hazards.
ENGINEERING
APPLICATION
High resolution seismic reflection surveying is the most
widely used geophysical technique, since around 1980
THIS METHOD IS EXTENSIVELY USED TO CARRY OUT :
1. Foundation studies for offshore platforms
2. Harbour development
3. Cable/pipeline rooting
4. Seabed surveys for bridges
5. Mapping of lateral continuity of lithologic units
6. To obtain Water table
7. To locate Fracture.
HIGH RESOLUTION SHALLOW SEISMIC REFLECTION
TECHNIQUE
Seismic reflection method involves the measurement of the two-way travel
time of seismic waves transmitted from sea-surface and reflected back to
the surface from the interfaces between contrasting sub-surface layers.
The reflected signal is detected on sea surface using an array of
hydrophones.
*
*
THE FOUR BASIC COMPONENTS IN ANY SEISMIC
REFLECTION SYSTEM ARE
1. A sound source that emits acoustic impulses or pressure
waves.
2. An energy source to store energy for the sound source.
3.A hydrophone receiver that converts the reflected acoustic
signals
to electrical signals.
4. A display unit that makes a permanent record of the reflected
signals.
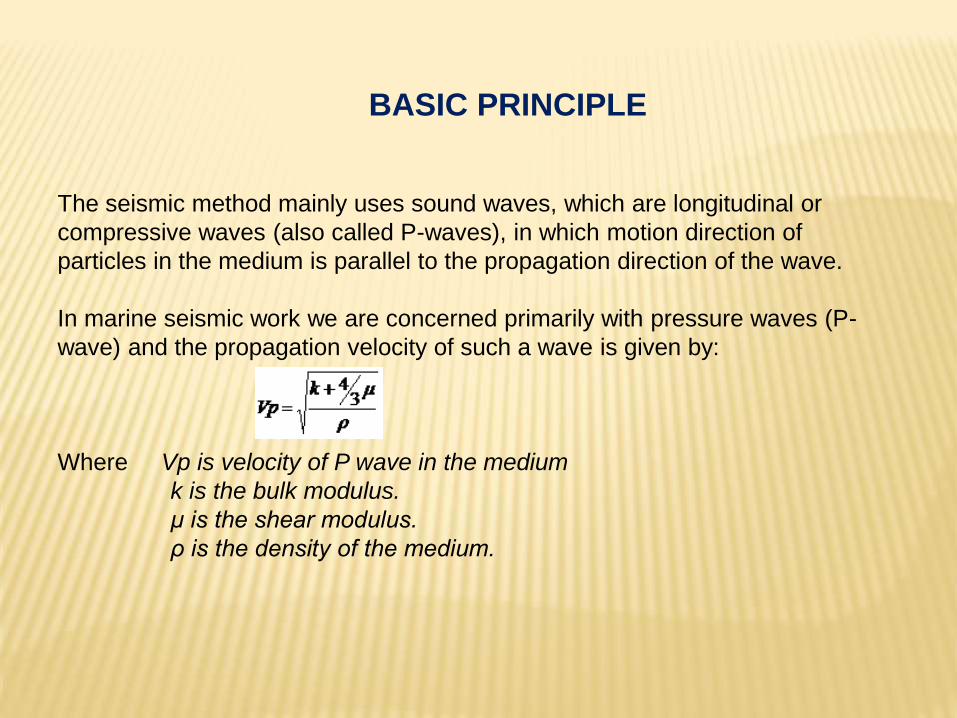
BASIC PRINCIPLE
The seismic method mainly uses sound waves, which are longitudinal or
compressive waves (also called P-waves), in which motion direction of
particles in the medium is parallel to the propagation direction of the wave.
In marine seismic work we are concerned primarily with pressure waves (P-
wave) and the propagation velocity of such a wave is given by:
Where Vp is velocity of P wave in the medium
k is the bulk modulus.
μ is the shear modulus.
ρ is the density of the medium.
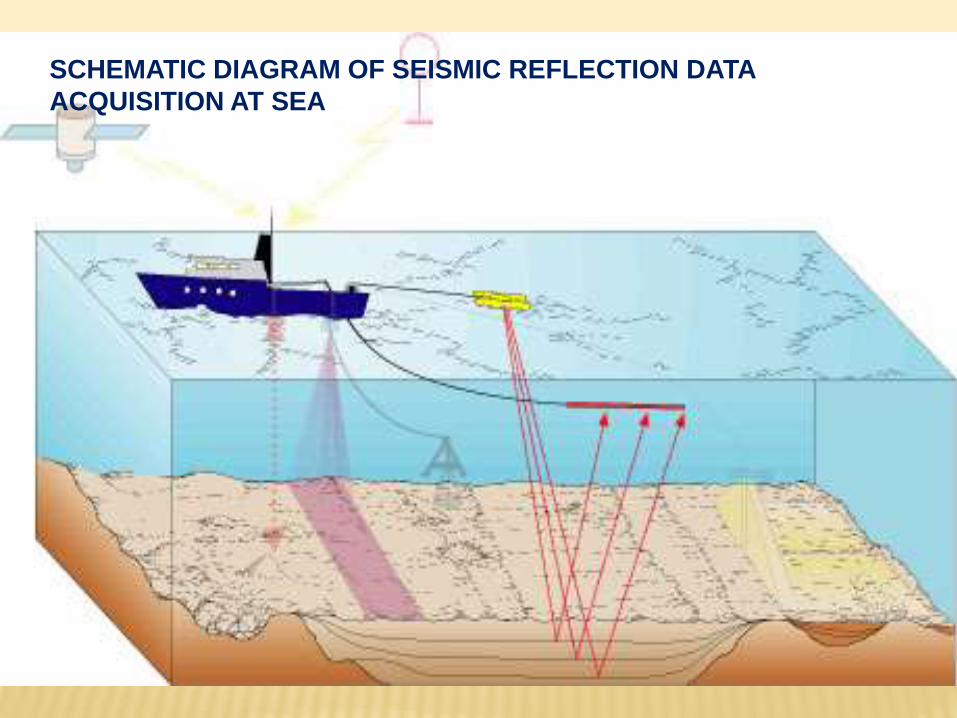
SCHEMATIC DIAGRAM OF SEISMIC REFLECTION DATA
ACQUISITION AT SEA
SUB- BOTTOM
PROFILER
The selection of an acoustic source is often based upon the
requirements for resolution and depth of penetration.
However, equally important considerations are the cost, size, ease of
operation, maintenance and availability of the energy source and
acoustic source.
The acoustic source requires some form of primary energy
(electrical), which is developed by the system onboard the survey
platform (small boat or ship) and each employs a device in the water
that converts stored energy to an acoustic pulse.
BOOMER
The boomer is often classed as displacement type device because the
rapid movement of a flat, rounded aluminium plate against the water
produces the acoustic signal.
The motion of the plate is produced when electrical energy stored in the
power supply is rapidly discharged through the coil located in the
transducer; a magnetic field is developed in the coil.
This magnetic field opposes the induced magnetic field generated in the
aluminium plate, resulting in a rapid repulsion action of the plate .
The fields decay very rapidly and return spring forces the plate back to the
initial position. The acoustic signature generated is of short duration and
relatively high amplitude having a characteristic bandwidth of 400-4000 Hz.

SPARKER
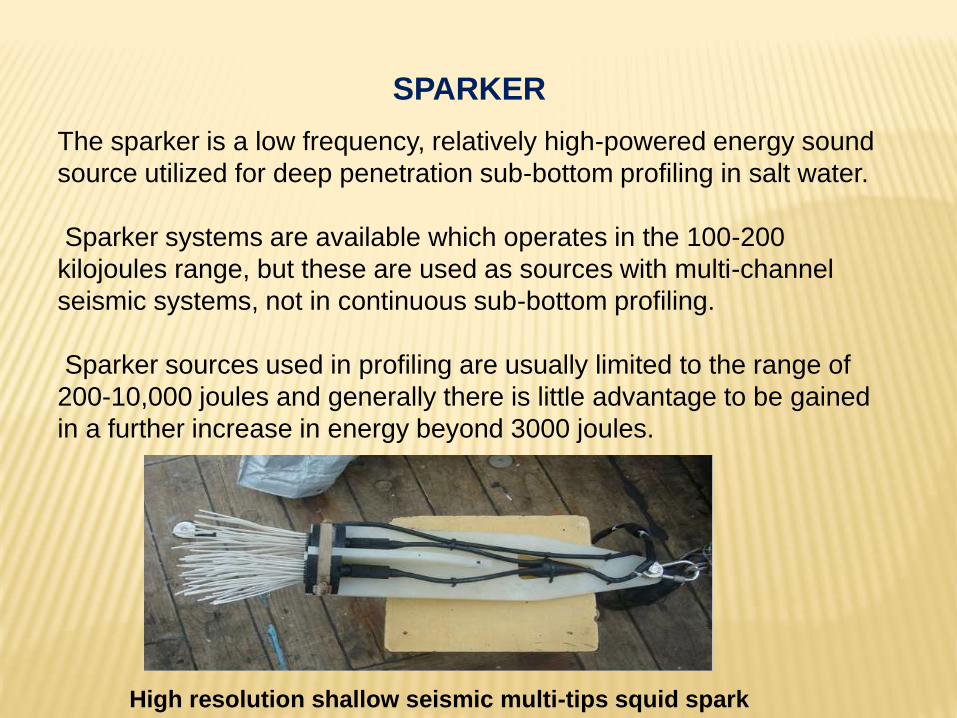
The sparker is a low frequency, relatively high-powered energy sound
source utilized for deep penetration sub-bottom profiling in salt water.
Sparker systems are available which operates in the 100-200
kilojoules range, but these are used as sources with multi-channel
seismic systems, not in continuous sub-bottom profiling.
Sparker sources used in profiling are usually limited to the range of
200-10,000 joules and generally there is little advantage to be gained
in a further increase in energy beyond 3000 joules.
High resolution shallow seismic multi-tips squid spark
array.
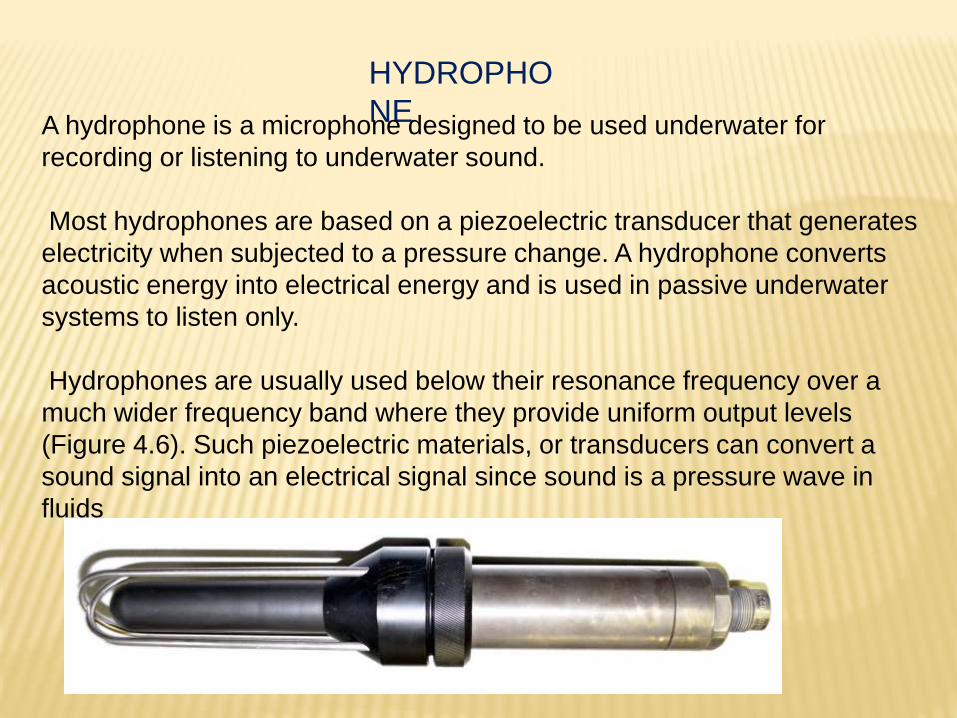
HYDROPHO
NE A hydrophone is a microphone designed to be used underwater for
recording or listening to underwater sound.
Most hydrophones are based on a piezoelectric transducer that generates
electricity when subjected to a pressure change. A hydrophone converts
acoustic energy into electrical energy and is used in passive underwater
systems to listen only.
Hydrophones are usually used below their resonance frequency over a
much wider frequency band where they provide uniform output levels
(Figure 4.6). Such piezoelectric materials, or transducers can convert a
sound signal into an electrical signal since sound is a pressure wave in
fluids
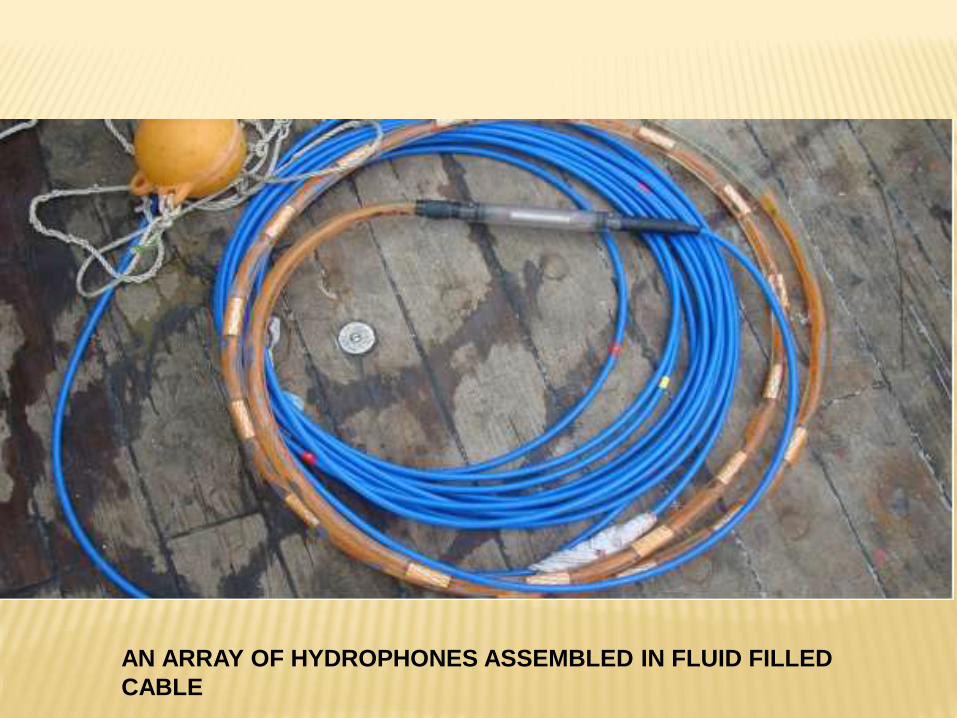
AN ARRAY OF HYDROPHONES ASSEMBLED IN FLUID FILLED
CABLE
PROCESSING OF HIGH RESOLUTION SEISMIC DATA
The acquired seismic reflection data contains a lot of noise. These noises are
removed by applying sophisticated processing techniques, mostly with state-of-art
seismic
data processing software package.
The basic objective of all seismic processing is to convert the information recorded
in the field into a form that facilitates geological interpretation.
The resultant processed data provides a structural image of the sub-surface,
which allows one to map sub-surface distribution of seismic sequences,
depositional environments, rock facies and structural trends.
The purpose of seismic data processing is to manipulate the acquired
data into an image that can be used to infer the sub-surface structure.
Processing consists of the application of a series of computer routines to
the acquired data guided by the processing geophysicist
In the present study Seisee software was used for processing , at CSIR-
NIO.
SEISMIC RESOLUTION
VERTICAL
RESOLUTION :seismic resolution is the ability to distinguish separate features; in
other words, the minimum distance between two features so that
the two can be identified separately rather than as one feature.
normally we think of resolution in the vertical sense,
HORIZONTAL RESOLUTION :
Horizontal resolution refers to how close two reflecting points can
be situated horizontally, and yet be recognized as two separate
points rather than one. The area that produces the reflection is
known as the First Fresnel Zone: the reflecting zone in the
subsurface insonified by the first quarter of a wavelength. If the
wavelength is large then the zone over which the reflection
returns is larger and the resolution is lower.
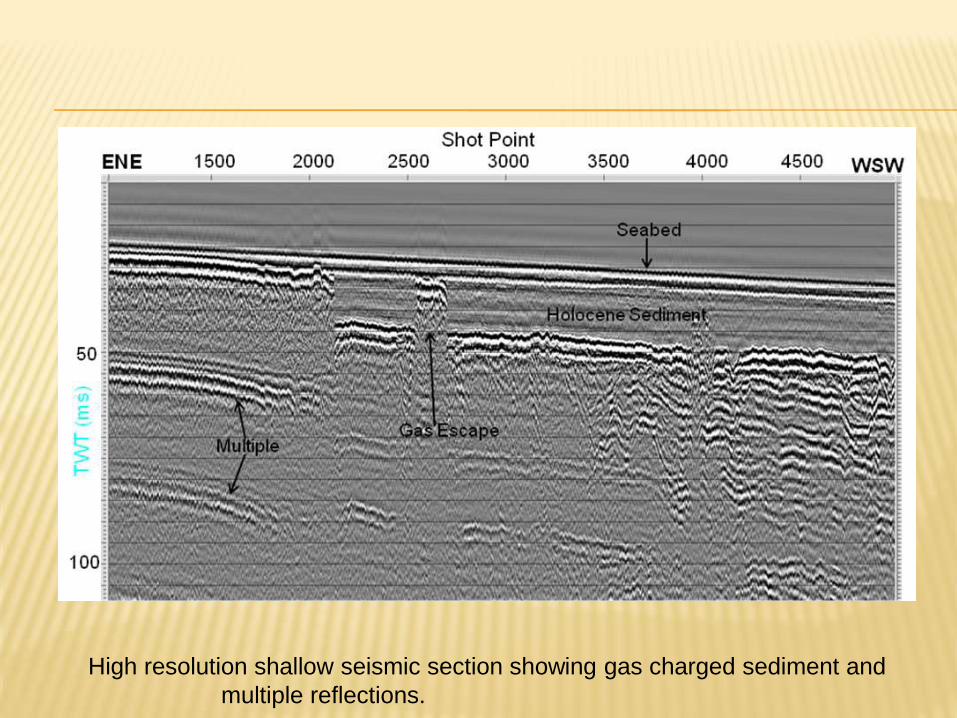
High resolution shallow seismic section showing gas charged sediment and
multiple reflections.
Introduction
Ground penetrating radar (commonly called GPR) is ahigh resolution electromagnetic technique that isdesigned primarily to investigate the shallow subsurfaceof the earth, building materials, and roads and bridges
Geophysical equipment uses RADAR (RAdio DetectionAnd Ranging) pulses for imaging subsurface
Uses electromagnetic radiation in the microwaveband(300 MHz to 300 GHz) and detects the reflectedsignals from subsurface structures.
Media includes rock, soil, ice, freshwater, pavements andstructures
History
The first use of Electromagnetic signals to locate buried objects is attributed to Hulsmeyer in a German patent in 19o4.
The first published description of such investigations was by Leimbach and Lowy in 1910 again in German patents
The potential of GPR for civilian use was identified by Geophysical Survey Systems Inc.(GSSI)
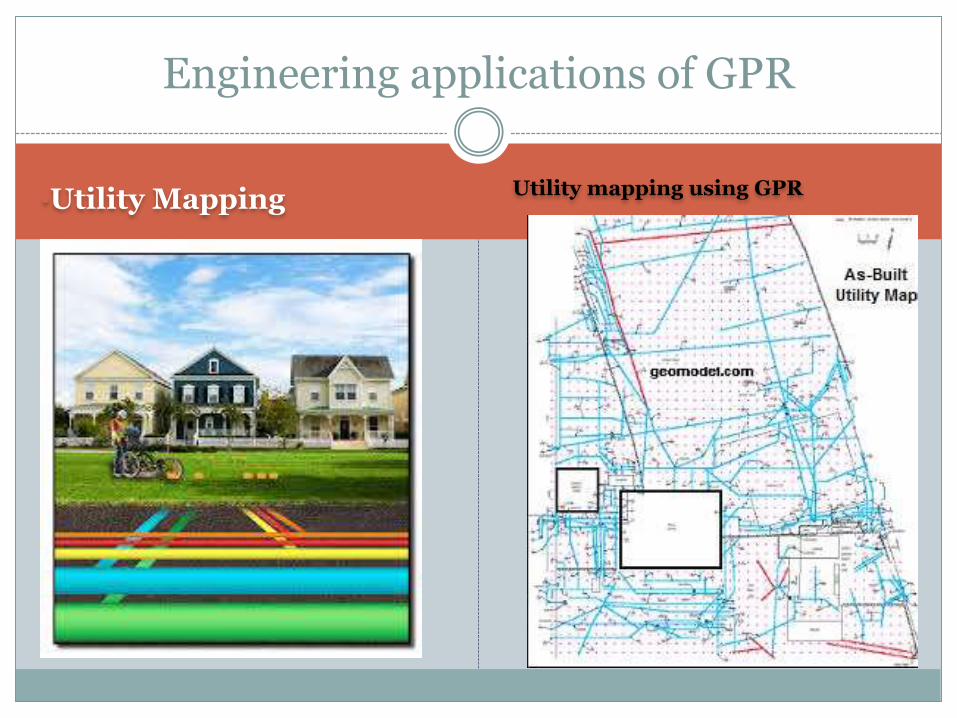
•Utility Mapping Utility mapping using GPR
Utility Mapping
Engineering applications of GPR
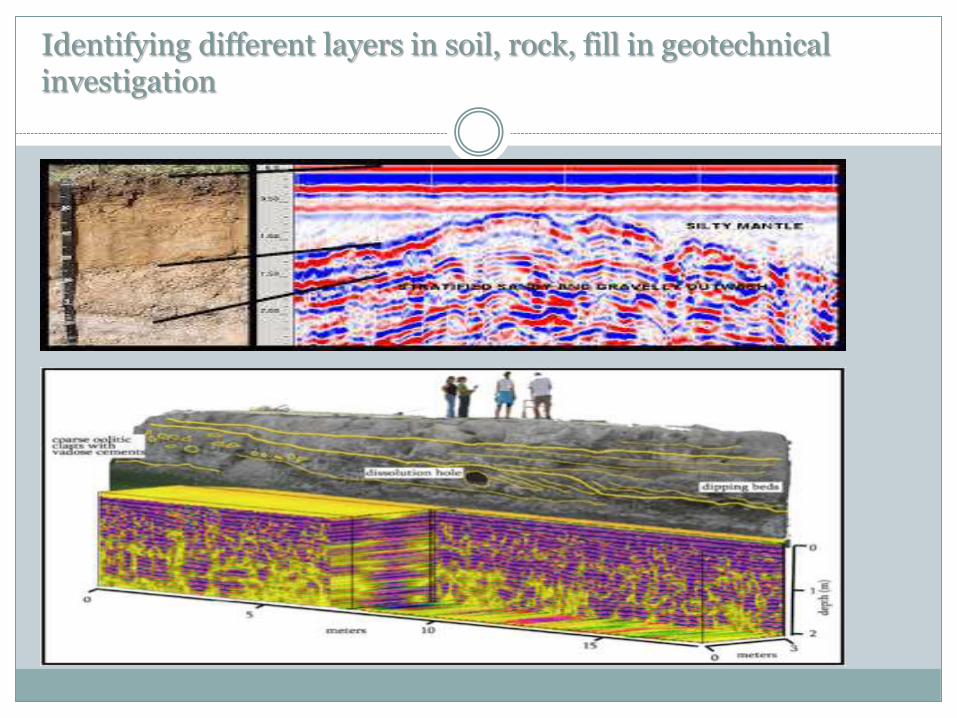
Identifying different layers in soil, rock, fill in geotechnical investigation
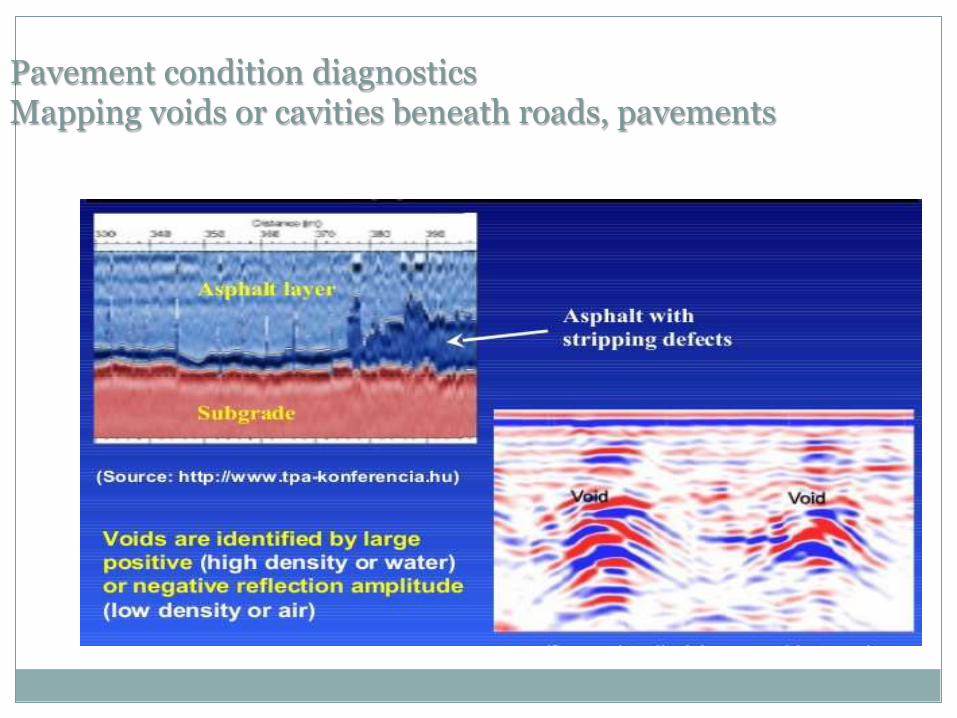
Pavement condition diagnosticsMapping voids or cavities beneath roads, pavements
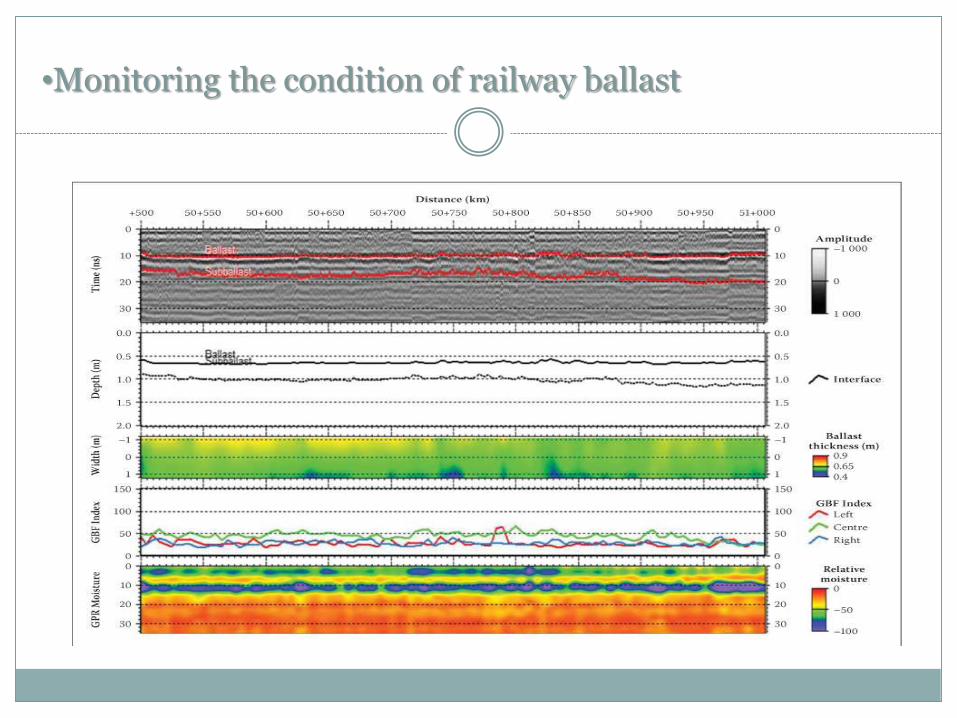
•Monitoring the condition of railway ballast

• Detailed inspection of concrete structures
Inspection quality of precast concrete
Detection of termite attack zones in timber
Mapping zones of termite attack or fungal decay intrees
Detection of faults , fracturing of rocks(BH- GPR)
Determining thickness of snow and ice.
Mapping archeological ruins
Surveying sediments beneath bottoms and lakes andrivers
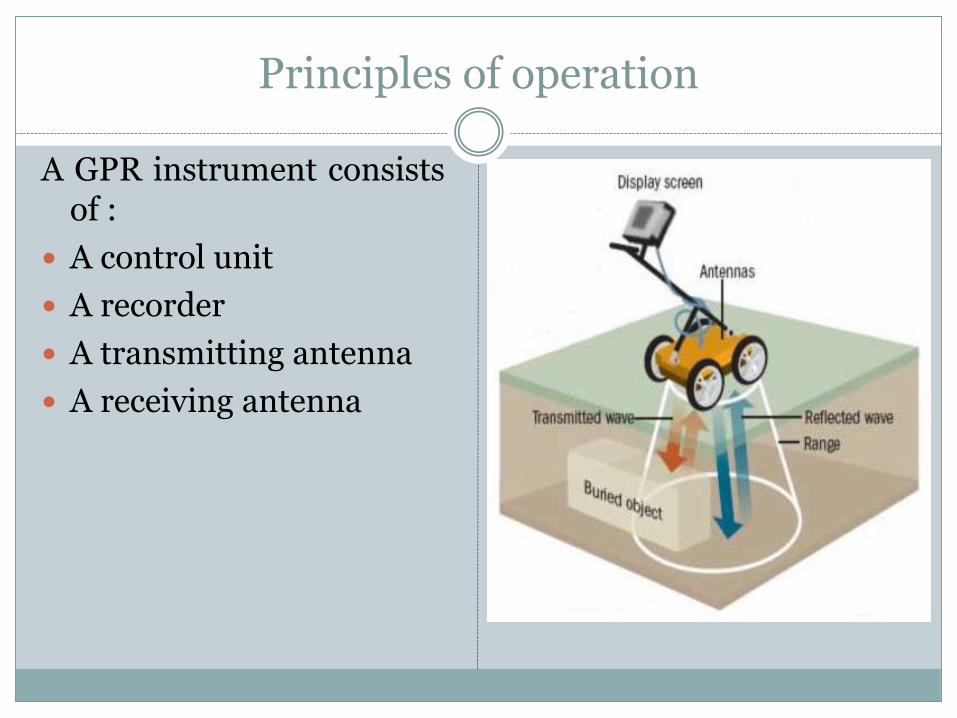
Principles of operation
A GPR instrument consistsof :
A control unit
A recorder
A transmitting antenna
A receiving antenna
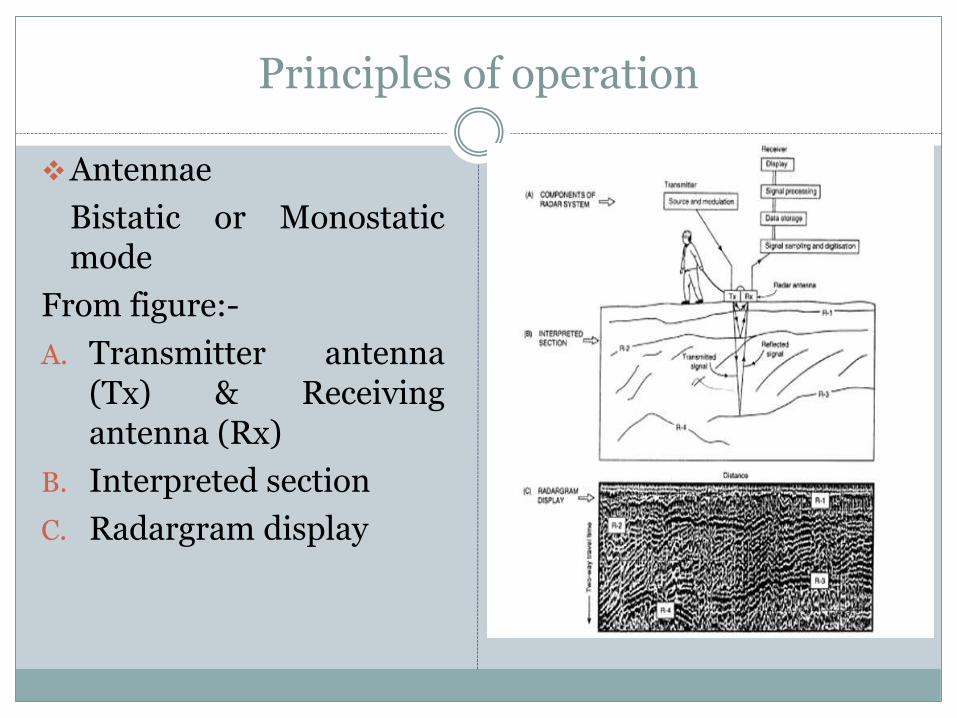
Principles of operation
Antennae
Bistatic or Monostaticmode
From figure:-
A. Transmitter antenna(Tx) & Receivingantenna (Rx)
B. Interpreted section
C. Radargram display
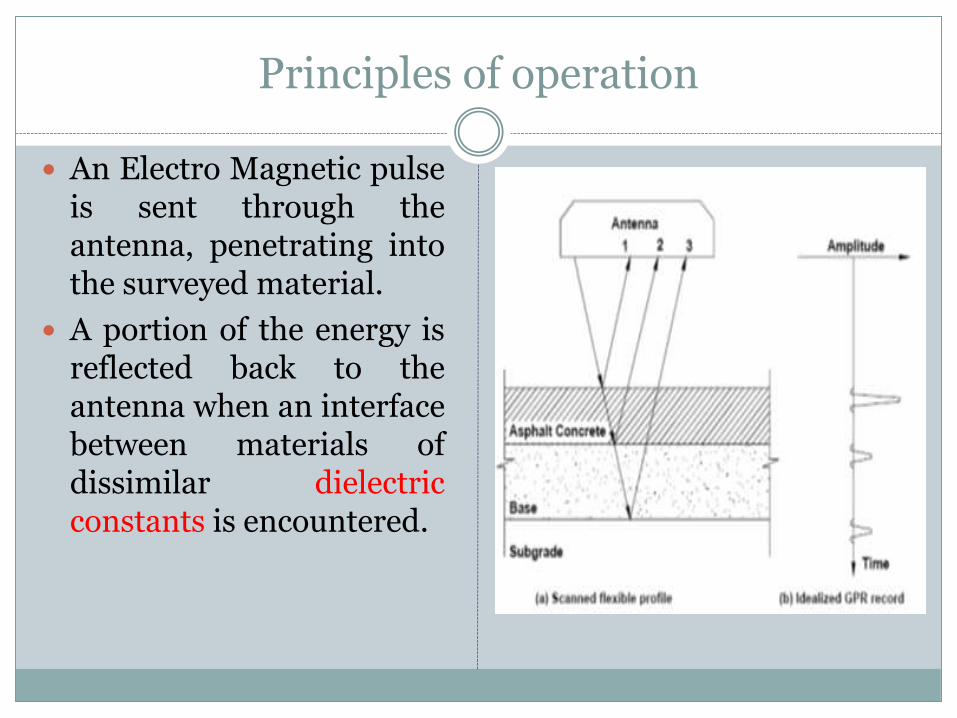
Principles of operation
An Electro Magnetic pulseis sent through theantenna, penetrating intothe surveyed material.
A portion of the energy isreflected back to theantenna when an interfacebetween materials ofdissimilar dielectricconstants is encountered.
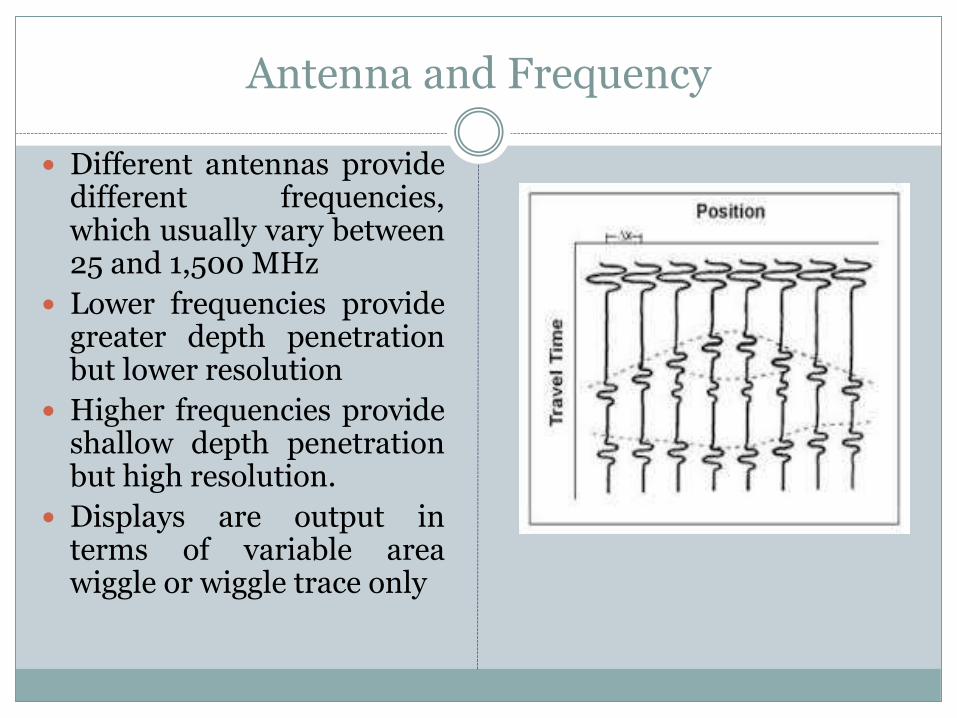
Antenna and Frequency
Different antennas providedifferent frequencies,which usually vary between25 and 1,500 MHz
Lower frequencies providegreater depth penetrationbut lower resolution
Higher frequencies provideshallow depth penetrationbut high resolution.
Displays are output interms of variable areawiggle or wiggle trace only
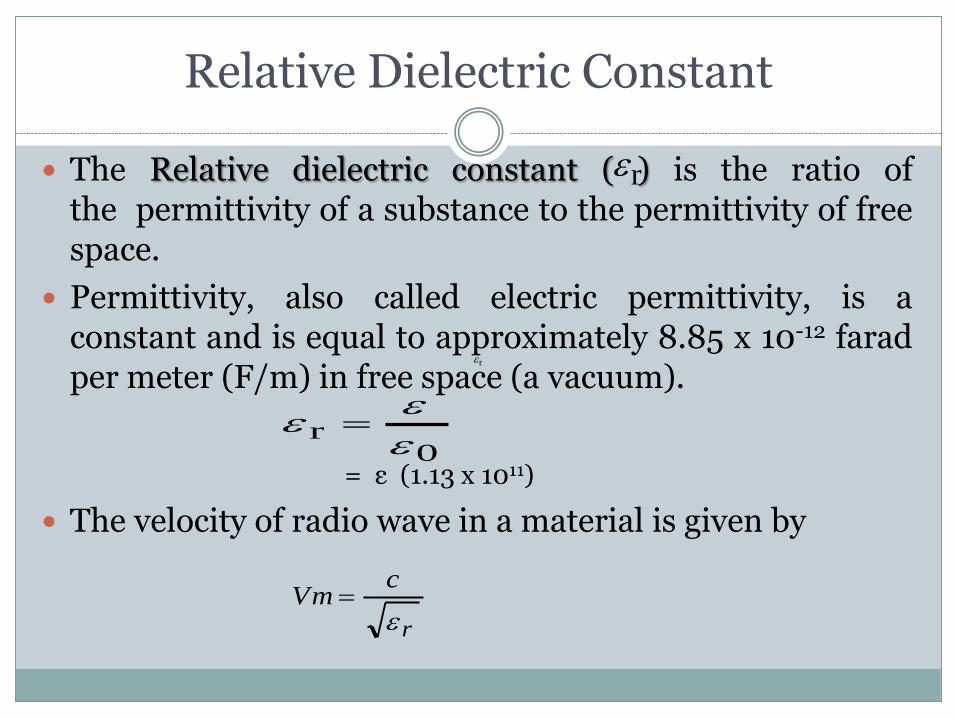
Relative Dielectric Constant
The Relative dielectric constant ( ) is the ratio ofthe permittivity of a substance to the permittivity of freespace.
Permittivity, also called electric permittivity, is aconstant and is equal to approximately 8.85 x 10⁻¹² faradper meter (F/m) in free space (a vacuum).
= ε (1.13 x 10¹¹)
The velocity of radio wave in a material is given by
0r
r
cVm
r
r
Material εr V(mm/ns)
Air 1 300
Water (fresh) 81 33
Water (sea) 81 33
Permafrost 1-8 106-300
Coastal sand (dry) 10 95
Sand (dry) 3-6 120-170
Sand (wet) 25-30 55-60
Silt (wet) 10 95
Clay (wet) 8-15 86-110
Clay soil (dry) 3 173
Average ‘soil’ 16 75
Granite 5-8 106-120
Limestone 7-9 100-113
Basalt (wet) 8 106
Sandstone (wet) 6 112
Concrete 6-30 55-112
Asphalt 3-5 134-173
PVC, Epoxy, Polyesters 3 173
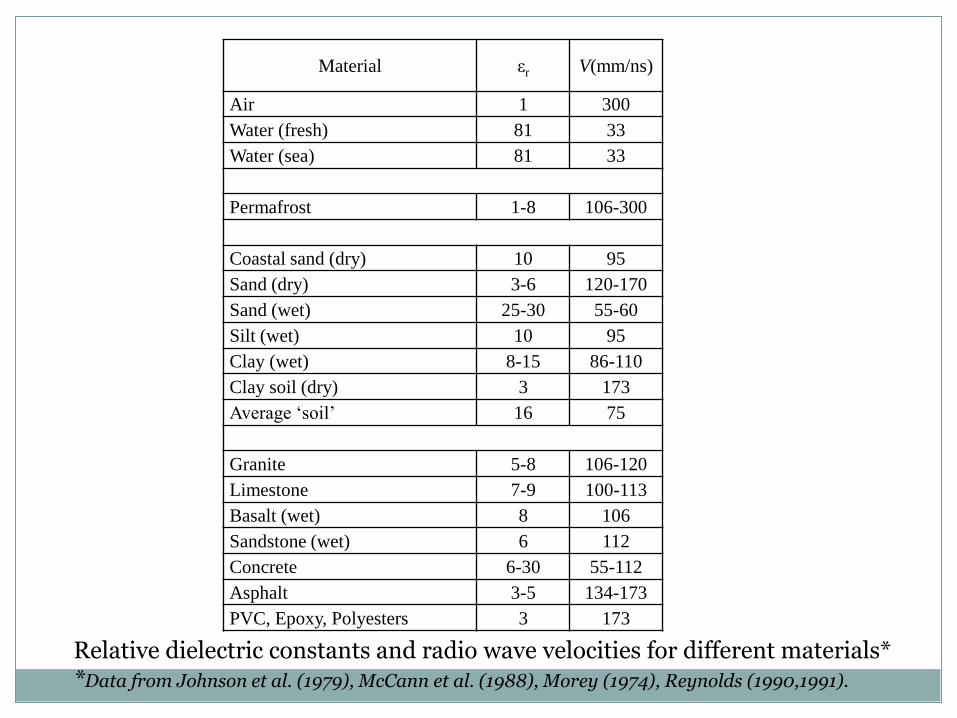
Relative dielectric constants and radio wave velocities for different materials**Data from Johnson et al. (1979), McCann et al. (1988), Morey (1974), Reynolds (1990,1991).
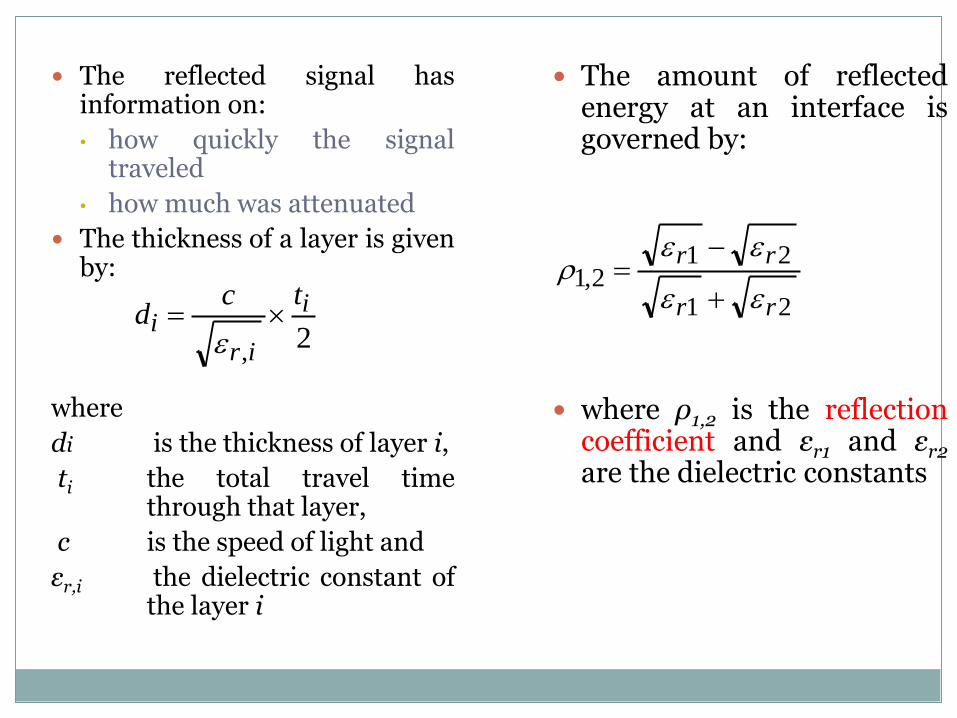
The reflected signal hasinformation on:
• how quickly the signaltraveled
• how much was attenuated
The thickness of a layer is givenby:
where
di is the thickness of layer i,
ti the total travel timethrough that layer,
c is the speed of light and
εr,i the dielectric constant ofthe layer i
The amount of reflectedenergy at an interface isgoverned by:
where ρ1,2 is the reflectioncoefficient and εr1 and εr2
are the dielectric constants
2,
i
iri
tcd
21
212,1
rr
rr
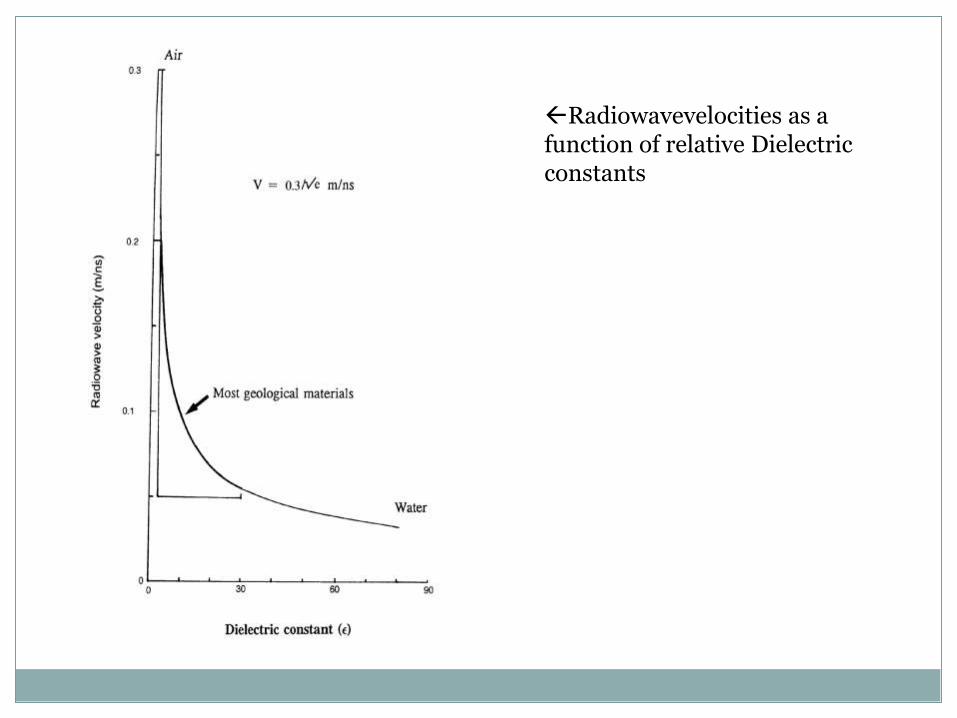
Radiowavevelocities as a function of relative Dielectric constants
Data Acquisition
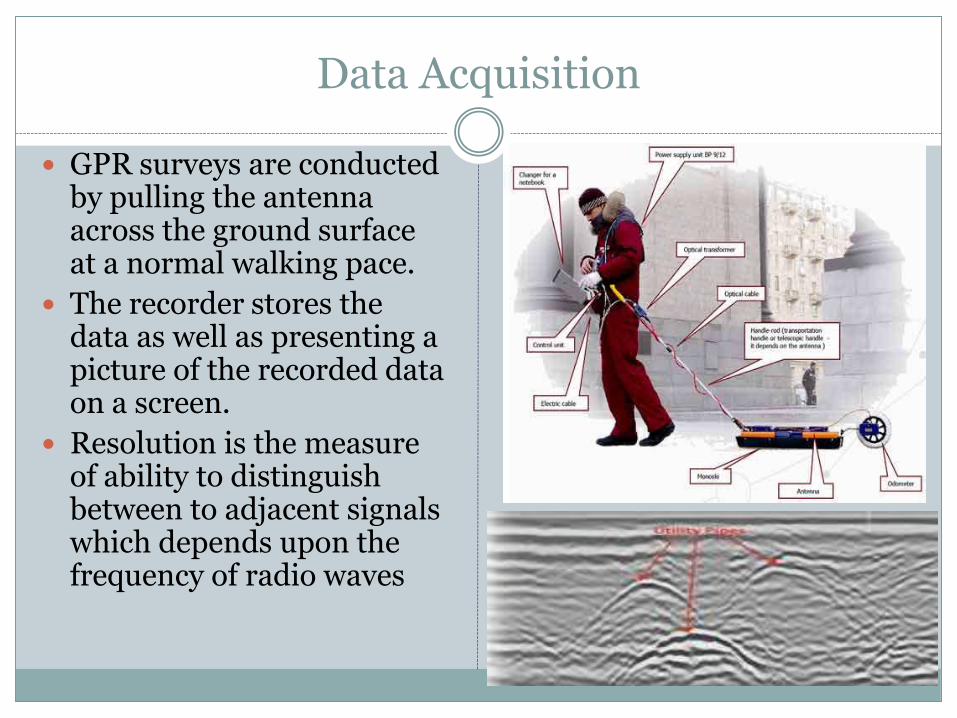
GPR surveys are conducted by pulling the antenna across the ground surface at a normal walking pace.
The recorder stores the data as well as presenting a picture of the recorded data on a screen.
Resolution is the measure of ability to distinguish between to adjacent signals which depends upon the frequency of radio waves
Processing and Interpreting
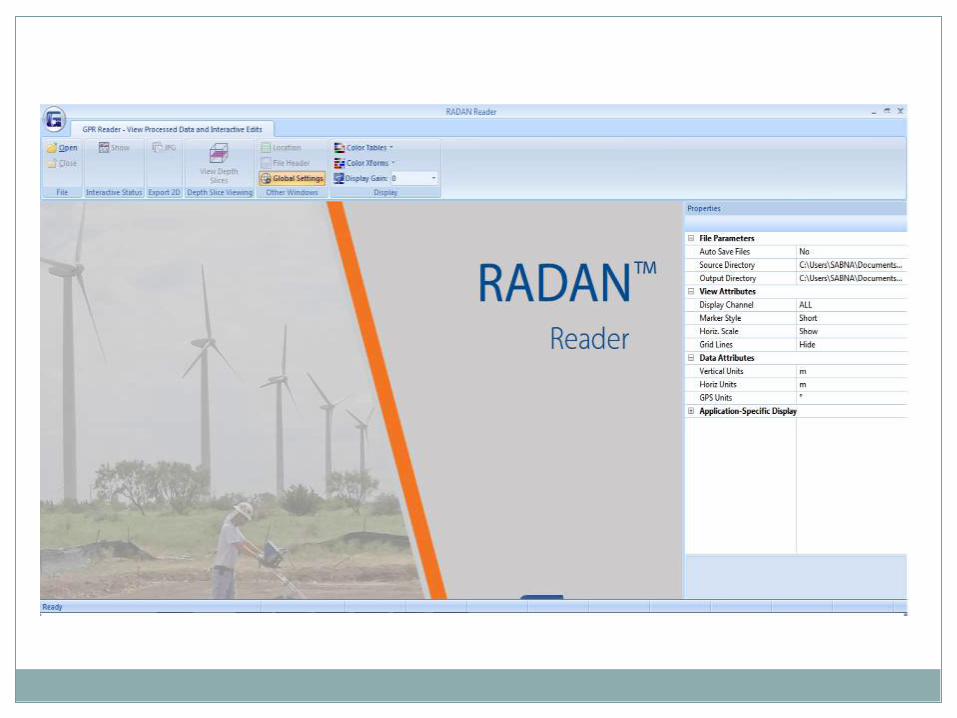
RADAN is GSSI’s ground penetrating radar processing software.
Stands for RAdar Data ANalyser
It has been developed over the last 20 years to aid in the processing and interpretation of GPR data.
Runs on regular laptop or desktop computer
Provides the user with many powerful tools to clean up and view data in 3D
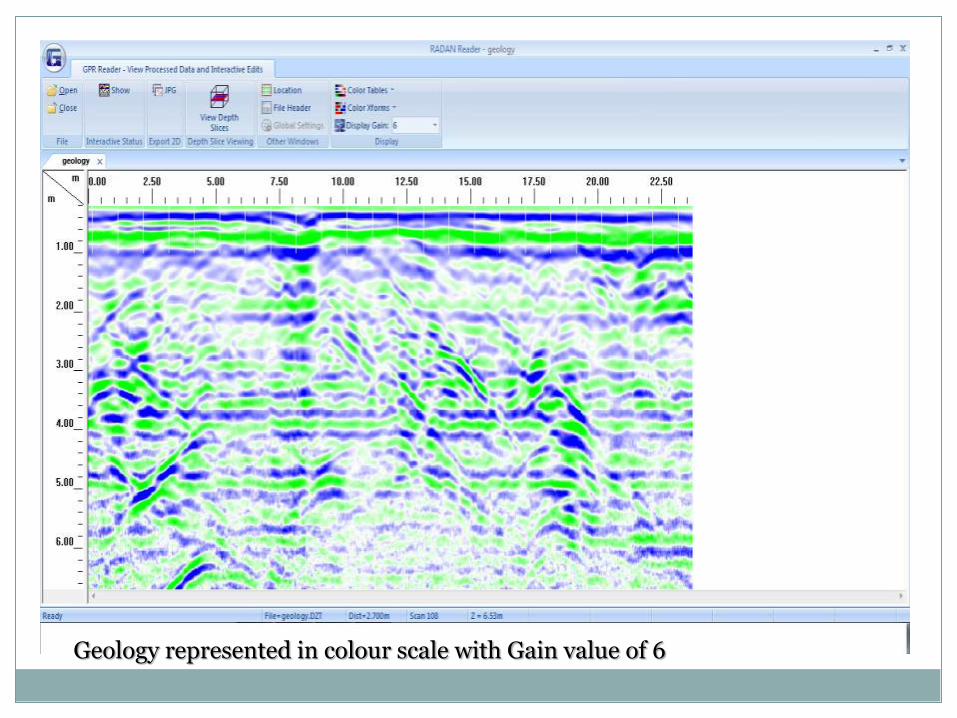
Geology represented in colour scale with Gain value of 6
Advantages and Limitations
Advantages Wide area can be surveyed in very less time
Non-destructive method
As the information is obtain field itself anomalies can be marked on the ground
It doesn’t pose any kind of health hazard
Limitations Cannot be used in saline water
Cannot be used in clayey soils
Gives ambiguous results if two materials have similar dielectric materials
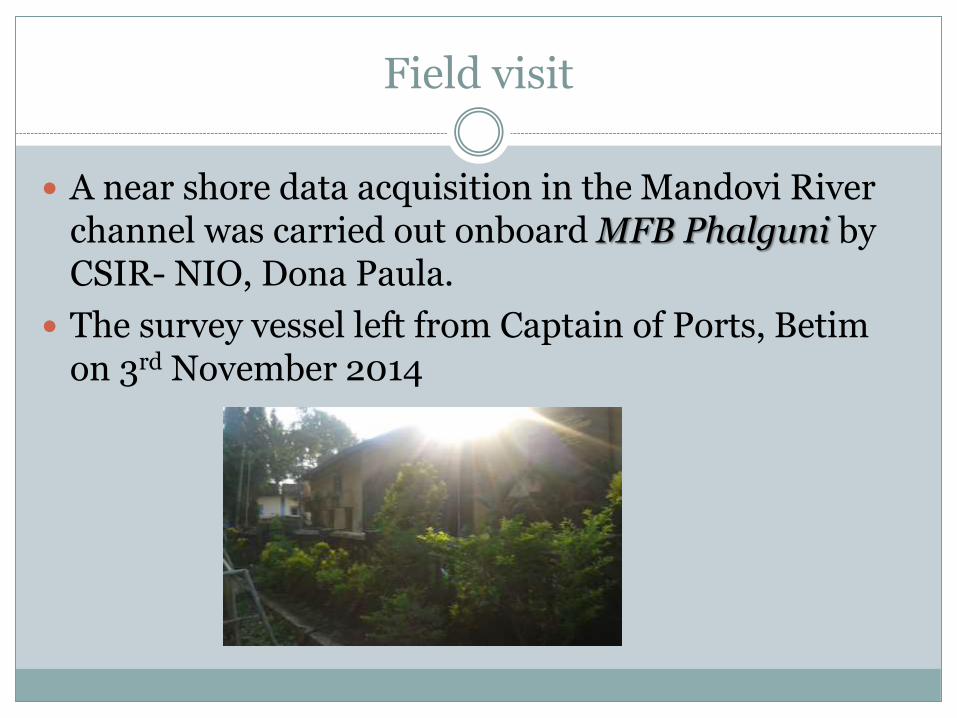
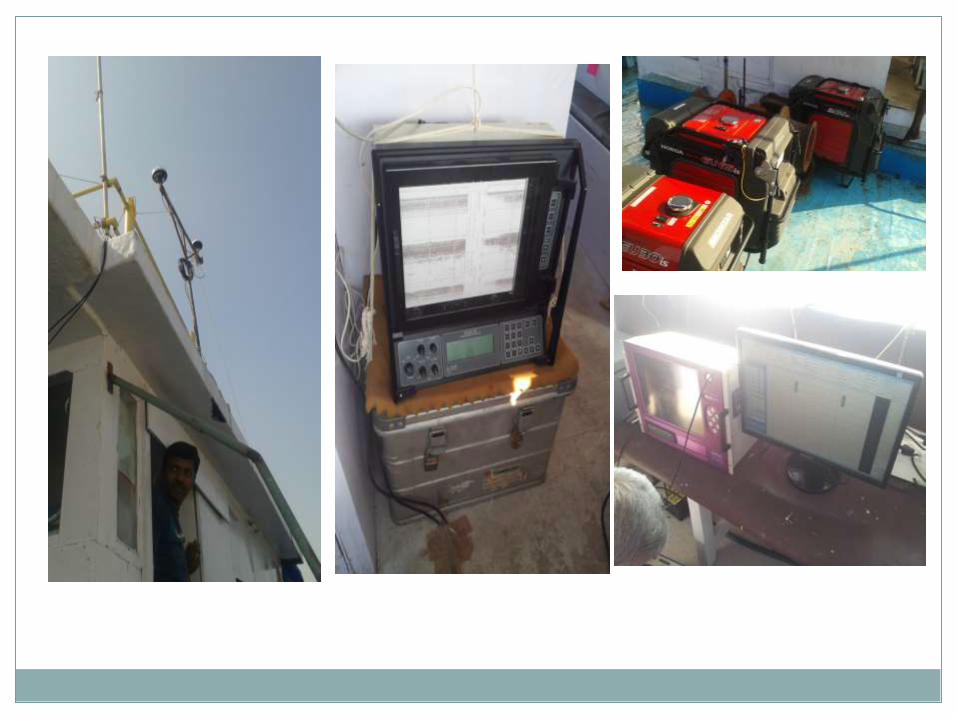
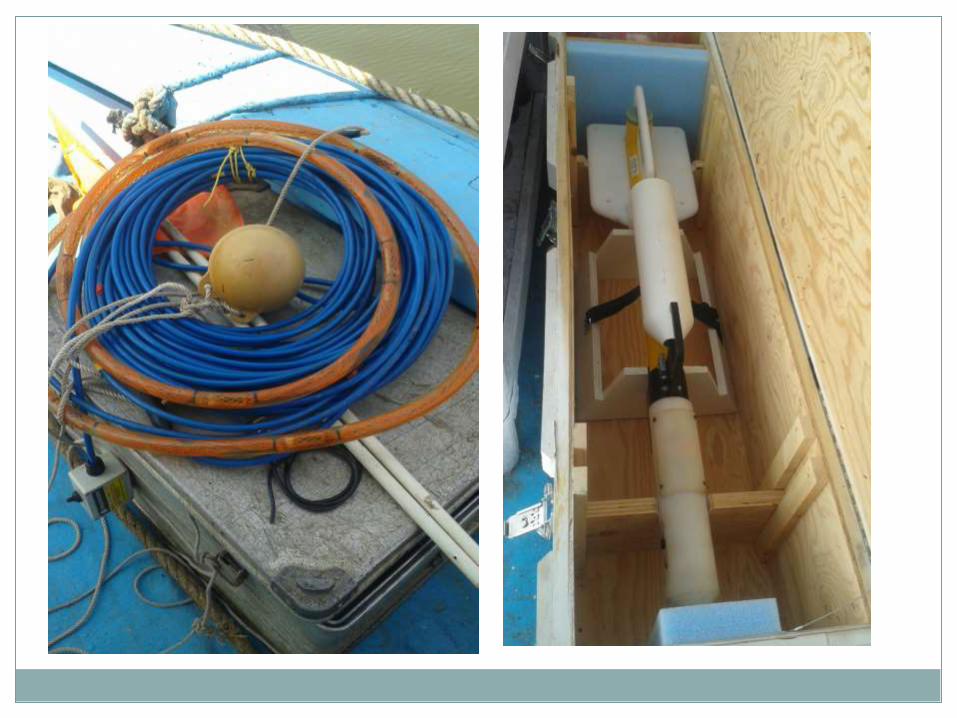
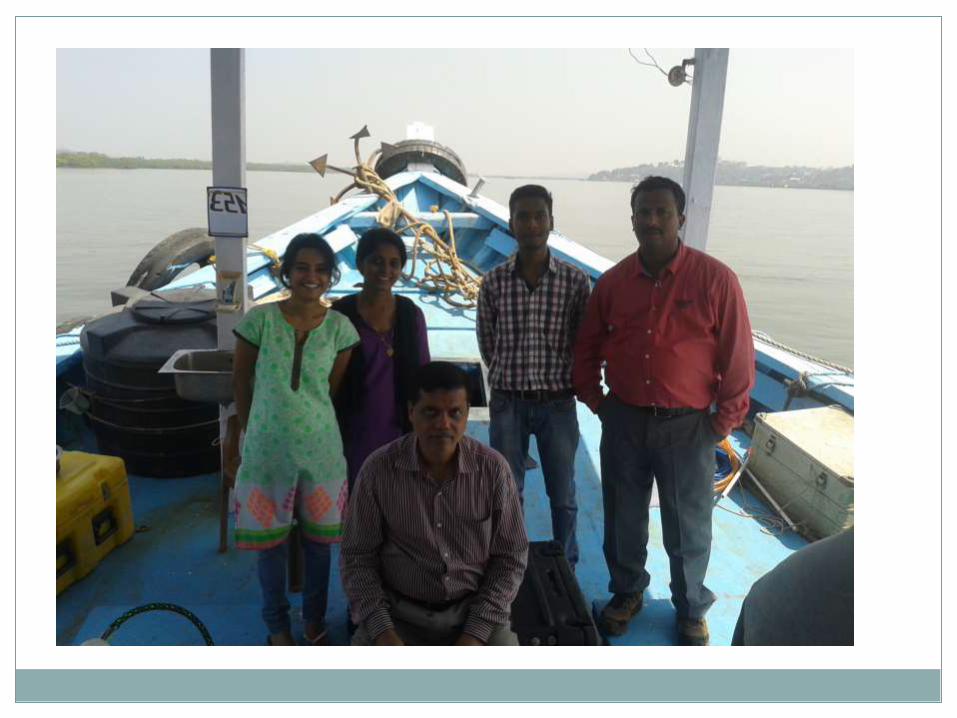
Field visit
A near shore data acquisition in the Mandovi River channel was carried out onboard MFB Phalguni by CSIR- NIO, Dona Paula.
The survey vessel left from Captain of Ports, Betimon 3rd November 2014
Summary and Inferences
This study carried out at CSIR-NIO, Goa has provided and opportunity to acquireconsiderable information and knowledge in echo sounding, side scan sonar, seismicreflection and ground penetrating radar techniques which are of immense use ingeotechnical engineering. The workshop on Ground penetrating Radar held in October2014 at CSIR-NIO also helped us to understand its working principles and the agenciesproviding GPR equipment.
Some of the inferences drawn from the studies and work carried out during the projecttenure are listed below:
Echo sounding technique is found to be very useful to determine the water depth andbottom topography of water covered areas
Side scan sonar technique is used to find out objects lying on the sea floor beforeplanning construction of any offshore structure such as offshore platforms, jetties,harbour development, underwater pipeline for transporting oil and gas, fresh water,effluent discharge etc.
High resolution shallow marine seismic reflection method is useful to determine sea floormorphology , subsurface features and underlying shallow stratigraphy for checkingfeasibility of site for construction of any offshore structure.
GPR can be use for various engineering application like locating utility services, detectionof voids or cavities, mapping bed rock depth or faults and fractured zones in rock.
References
Brouwer, J. and Helbig, K.; 1998. Shallow high-resolution reflection seismic. Handbook of geophysical exploration, 391pp.
Chaubey, A.K., 2012. Geophysical survey off Candolim Beach, Goa reveals large remnant of a grounded vessel. Source - http://www.nio.org/nio/uploadnews/326_0_survey-report-off-candolim-021112.pdf, available on internet.
Chaubey, A.K.; 2012. Fundamentals of seismic reflection and refraction techniques. In: Chaubey, A.K.(Editor), Industrial offshore surveys- a long ‘H’ course, National Institute of Oceanography, Goa, 214-221.
Clausner, E.J.; Pope, Joan; 1988. Side scan sonar applications for evaluating coastal structures. Technical Report CERC 88-16, pp 76.
Denbigh, P.; 1989. Swath bathymetry: Principles of Operation and Analysis of Errors, IEEE Journal of Oceanic Engineering 14, 289-298.
Dobrin, M.B.; 1976. Introduction to Geophysical Prospecting. McGraw-Hill international book company Japan, 630 pp.
Geng, X and A. Zielinsky.; 1999. Precise Multibeam Acoustic Bathymetry, Marine Geodesy, 22, 157-167pp.
Hansen R.E.; 2009. Introduction to Sonar. Course material to INF-GEO4310, University of Oslo.
Hughes Clarke, J.; 2000. Present-day Methods of Depth Measurement. In: P. Cook and C. Carlton Continental Shelf Limits-The Scientific and Legal Interface., Oxford University Press, New York.
John M. Reynolds; 1988. An Introduction to Applied and Environmental Geophysics. John Wiley & Sons Ltd., 321 pp.
Johnson H.P.; Helferty M.; 1990. The Geological Interpretation of Side-Scan Sonar. Reviews of Geophysics, 28, 357-380.
Kinsler, L.A.; Coppens, A. and Sanders, J.; 1982. Fundamentals of Acoustics. Wiley and Sons, Toronto
Peter, T.K.; 1984. Applied high-resolution geophysical methods; offshore geoengineeringhazards. International Human Resources Development Corporation, 43-58 pp.
Reynolds, John M.; 1997. Ground Penetrating Radar: An Introduction to Applied and Environmental Geophysics. John Wiley & Sons, Reynolds Geo-Sciences Ltd., UK, pp.682-723.
Williams S.J.; 1982. Use of High Resolution Seismic Reflection and Side-Scan Sonar Equipment for Offshore Surveys. Coastal Engineering Technical Aid (CETA) 82-5, U.S. Army, Corps of Engineers, Coastal Engineering Research Centre, pp 22.
Yelf, Richard J.; 2007. Application of ground penetrating Radar to Civil and Geotechnical Engineering, Electromagnetic Phenomena, 7, 110-116.


![[2015.114] Sonographic Imaging of Scrotal Emergencies Including](https://img.pdfslide.us/doc/110x75/58831cd31a28abaf198ba6de/2015114-sonographic-imaging-of-scrotal-emergencies-including-.jpg)